Eastpointe, MI Map & Demographics
Eastpointe Map
Eastpointe Overview
$27,019
PER CAPITA INCOME
$63,174
AVG FAMILY INCOME
$57,953
AVG HOUSEHOLD INCOME
19.8%
WAGE / INCOME GAP [ % ]
80.2¢/ $1
WAGE / INCOME GAP [ $ ]
$10,613
FAMILY INCOME DEFICIT
0.39
INEQUALITY / GINI INDEX
34,087
TOTAL POPULATION
16,630
MALE POPULATION
17,457
FEMALE POPULATION
95.26
MALES / 100 FEMALES
104.97
FEMALES / 100 MALES
36.4
MEDIAN AGE
3.2
AVG FAMILY SIZE
2.6
AVG HOUSEHOLD SIZE
16,598
LABOR FORCE [ PEOPLE ]
61.5%
PERCENT IN LABOR FORCE
12.1%
UNEMPLOYMENT RATE
Eastpointe Zip Codes
Eastpointe Area Codes
Income in Eastpointe
Income Overview in Eastpointe
Per Capita Income in Eastpointe is $27,019, while median incomes of families and households are $63,174 and $57,953 respectively.
| Characteristic | Number | Measure |
| Per Capita Income | 34,087 | $27,019 |
| Median Family Income | 8,467 | $63,174 |
| Mean Family Income | 8,467 | $72,502 |
| Median Household Income | 13,232 | $57,953 |
| Mean Household Income | 13,232 | $68,607 |
| Income Deficit | 8,467 | $10,613 |
| Wage / Income Gap (%) | 34,087 | 19.82% |
| Wage / Income Gap ($) | 34,087 | 80.18¢ per $1 |
| Gini / Inequality Index | 34,087 | 0.39 |
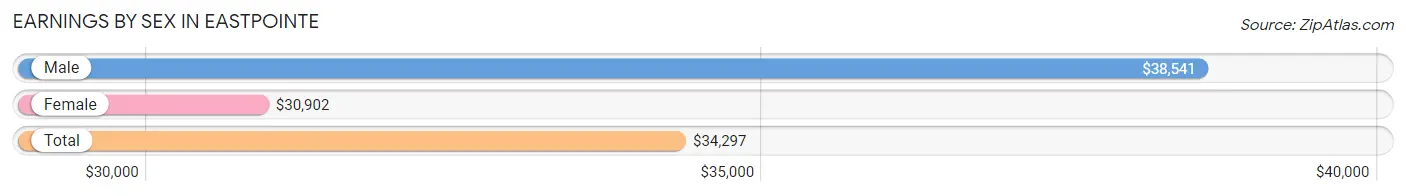
Earnings by Sex in Eastpointe
Average Earnings in Eastpointe are $34,297, $38,541 for men and $30,902 for women, a difference of 19.8%.
| Sex | Number | Average Earnings |
| Male | 8,573 (50.5%) | $38,541 |
| Female | 8,385 (49.4%) | $30,902 |
| Total | 16,958 (100.0%) | $34,297 |
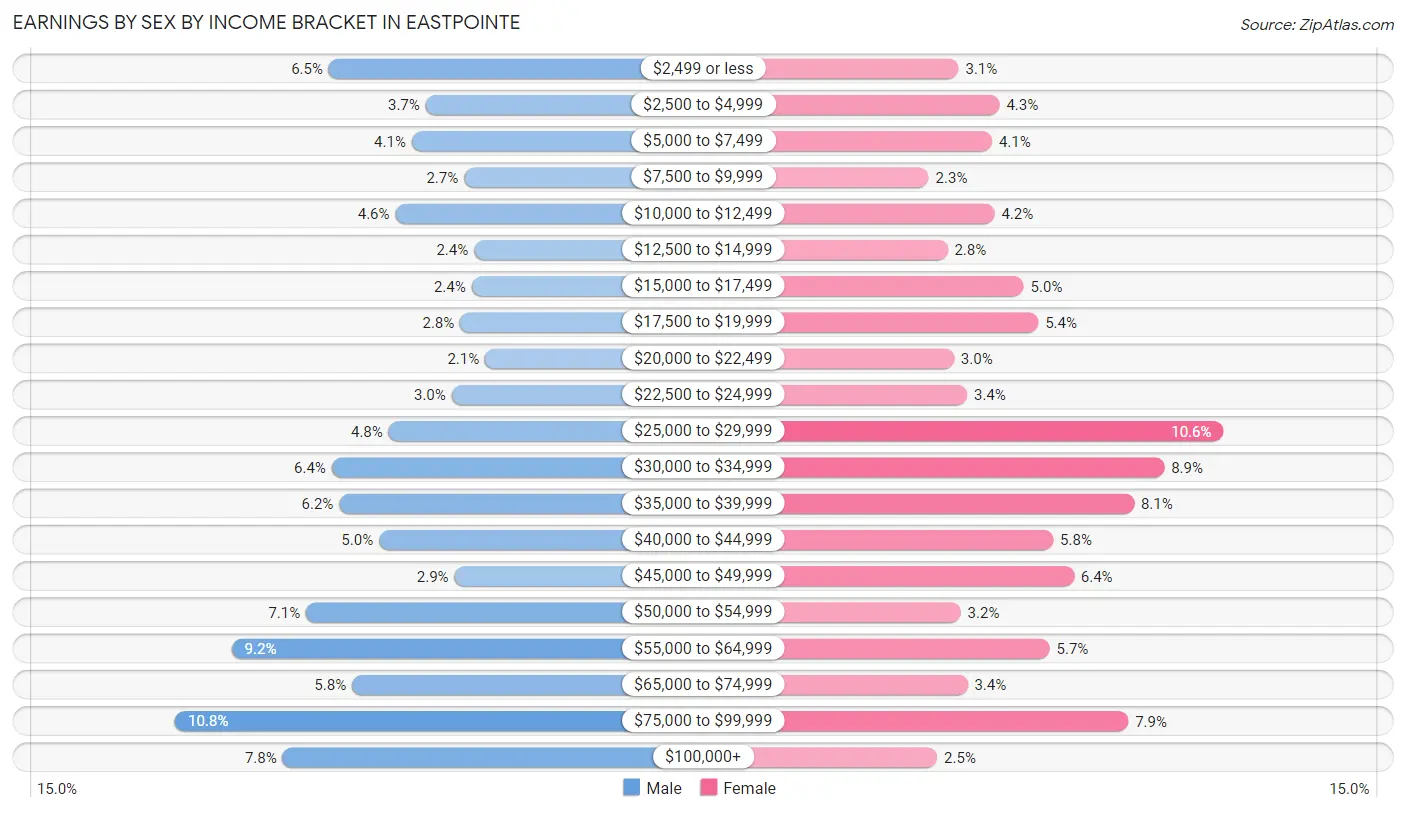
Earnings by Sex by Income Bracket in Eastpointe
The most common earnings brackets in Eastpointe are $75,000 to $99,999 for men (923 | 10.8%) and $25,000 to $29,999 for women (887 | 10.6%).
| Income | Male | Female |
| $2,499 or less | 553 (6.5%) | 263 (3.1%) |
| $2,500 to $4,999 | 320 (3.7%) | 360 (4.3%) |
| $5,000 to $7,499 | 353 (4.1%) | 342 (4.1%) |
| $7,500 to $9,999 | 227 (2.6%) | 193 (2.3%) |
| $10,000 to $12,499 | 393 (4.6%) | 348 (4.2%) |
| $12,500 to $14,999 | 203 (2.4%) | 237 (2.8%) |
| $15,000 to $17,499 | 209 (2.4%) | 417 (5.0%) |
| $17,500 to $19,999 | 237 (2.8%) | 451 (5.4%) |
| $20,000 to $22,499 | 177 (2.1%) | 252 (3.0%) |
| $22,500 to $24,999 | 257 (3.0%) | 283 (3.4%) |
| $25,000 to $29,999 | 409 (4.8%) | 887 (10.6%) |
| $30,000 to $34,999 | 546 (6.4%) | 748 (8.9%) |
| $35,000 to $39,999 | 528 (6.2%) | 677 (8.1%) |
| $40,000 to $44,999 | 432 (5.0%) | 486 (5.8%) |
| $45,000 to $49,999 | 250 (2.9%) | 535 (6.4%) |
| $50,000 to $54,999 | 608 (7.1%) | 268 (3.2%) |
| $55,000 to $64,999 | 787 (9.2%) | 478 (5.7%) |
| $65,000 to $74,999 | 497 (5.8%) | 284 (3.4%) |
| $75,000 to $99,999 | 923 (10.8%) | 663 (7.9%) |
| $100,000+ | 664 (7.7%) | 213 (2.5%) |
| Total | 8,573 (100.0%) | 8,385 (100.0%) |
Earnings by Sex by Educational Attainment in Eastpointe
Average earnings in Eastpointe are $42,649 for men and $33,320 for women, a difference of 21.9%. Men with an educational attainment of graduate degree enjoy the highest average annual earnings of $75,192, while those with high school diploma education earn the least with $37,500. Women with an educational attainment of graduate degree earn the most with the average annual earnings of $48,167, while those with less than high school education have the smallest earnings of $26,453.

| Educational Attainment | Male Income | Female Income |
| Less than High School | $42,131 | $26,453 |
| High School Diploma | $37,500 | $30,846 |
| College or Associate's Degree | $45,471 | $33,034 |
| Bachelor's Degree | $71,552 | $47,662 |
| Graduate Degree | $75,192 | $48,167 |
| Total | $42,649 | $33,320 |
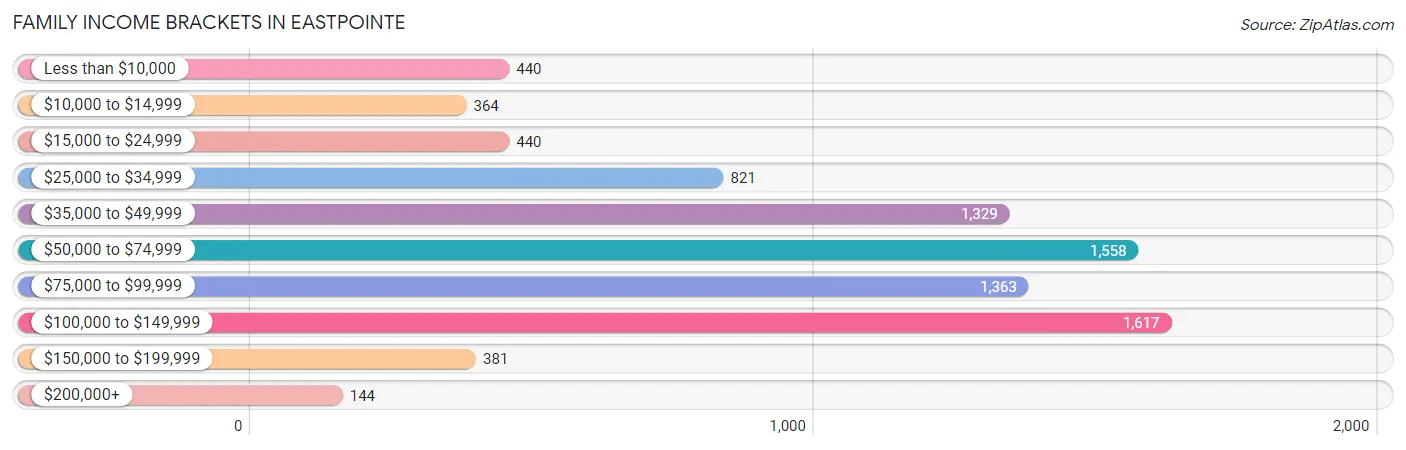
Family Income in Eastpointe
Family Income Brackets in Eastpointe
According to the Eastpointe family income data, there are 1,617 families falling into the $100,000 to $149,999 income range, which is the most common income bracket and makes up 19.1% of all families. Conversely, the $200,000+ income bracket is the least frequent group with only 144 families (1.7%) belonging to this category.
| Income Bracket | # Families | % Families |
| Less than $10,000 | 440 | 5.2% |
| $10,000 to $14,999 | 364 | 4.3% |
| $15,000 to $24,999 | 440 | 5.2% |
| $25,000 to $34,999 | 821 | 9.7% |
| $35,000 to $49,999 | 1,329 | 15.7% |
| $50,000 to $74,999 | 1,558 | 18.4% |
| $75,000 to $99,999 | 1,363 | 16.1% |
| $100,000 to $149,999 | 1,617 | 19.1% |
| $150,000 to $199,999 | 381 | 4.5% |
| $200,000+ | 144 | 1.7% |
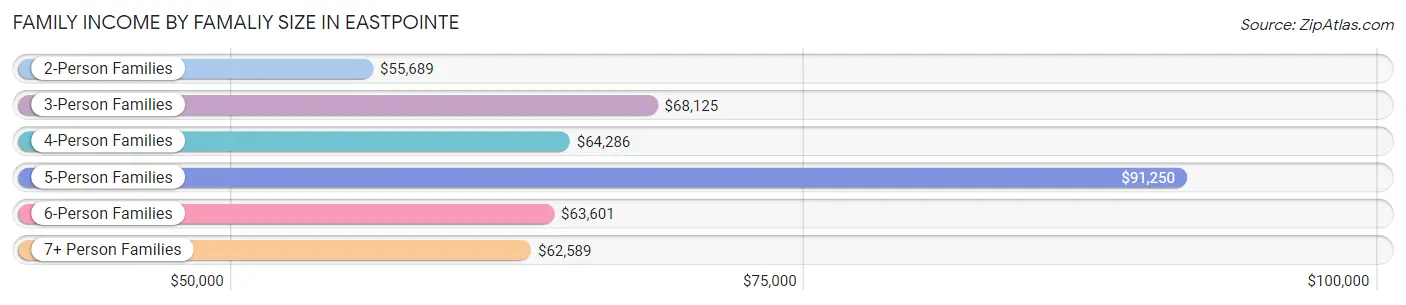
Family Income by Famaliy Size in Eastpointe
5-person families (643 | 7.6%) account for the highest median family income in Eastpointe with $91,250 per family, while 2-person families (3,923 | 46.3%) have the highest median income of $27,844 per family member.
| Income Bracket | # Families | Median Income |
| 2-Person Families | 3,923 (46.3%) | $55,689 |
| 3-Person Families | 2,135 (25.2%) | $68,125 |
| 4-Person Families | 1,314 (15.5%) | $64,286 |
| 5-Person Families | 643 (7.6%) | $91,250 |
| 6-Person Families | 289 (3.4%) | $63,601 |
| 7+ Person Families | 163 (1.9%) | $62,589 |
| Total | 8,467 (100.0%) | $63,174 |
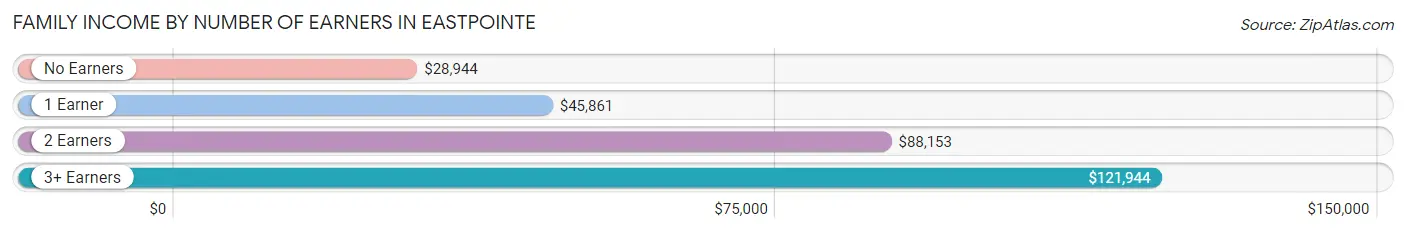
Family Income by Number of Earners in Eastpointe
The median family income in Eastpointe is $63,174, with families comprising 3+ earners (886) having the highest median family income of $121,944, while families with no earners (1,301) have the lowest median family income of $28,944, accounting for 10.5% and 15.4% of families, respectively.
| Number of Earners | # Families | Median Income |
| No Earners | 1,301 (15.4%) | $28,944 |
| 1 Earner | 3,406 (40.2%) | $45,861 |
| 2 Earners | 2,874 (33.9%) | $88,153 |
| 3+ Earners | 886 (10.5%) | $121,944 |
| Total | 8,467 (100.0%) | $63,174 |
Household Income in Eastpointe
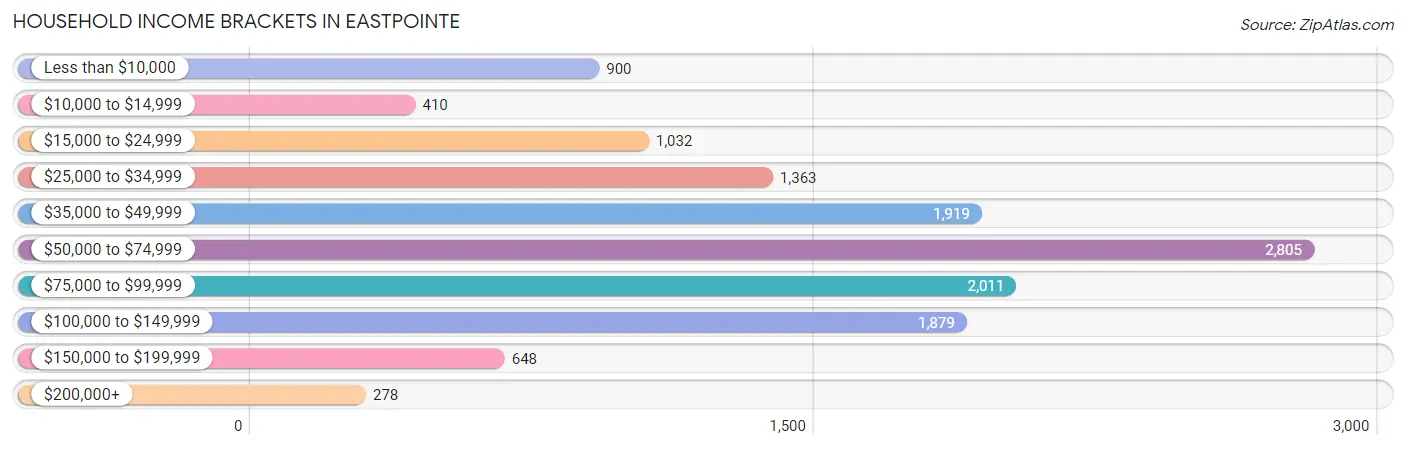
Household Income Brackets in Eastpointe
With 2,805 households falling in the category, the $50,000 to $74,999 income range is the most frequent in Eastpointe, accounting for 21.2% of all households. In contrast, only 278 households (2.1%) fall into the $200,000+ income bracket, making it the least populous group.
| Income Bracket | # Households | % Households |
| Less than $10,000 | 900 | 6.8% |
| $10,000 to $14,999 | 410 | 3.1% |
| $15,000 to $24,999 | 1,032 | 7.8% |
| $25,000 to $34,999 | 1,363 | 10.3% |
| $35,000 to $49,999 | 1,919 | 14.5% |
| $50,000 to $74,999 | 2,805 | 21.2% |
| $75,000 to $99,999 | 2,011 | 15.2% |
| $100,000 to $149,999 | 1,879 | 14.2% |
| $150,000 to $199,999 | 648 | 4.9% |
| $200,000+ | 278 | 2.1% |
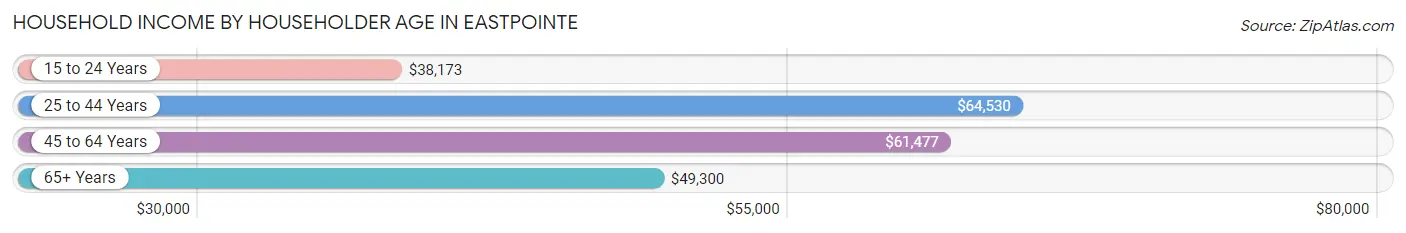
Household Income by Householder Age in Eastpointe
The median household income in Eastpointe is $57,953, with the highest median household income of $64,530 found in the 25 to 44 years age bracket for the primary householder. A total of 4,655 households (35.2%) fall into this category. Meanwhile, the 15 to 24 years age bracket for the primary householder has the lowest median household income of $38,173, with 179 households (1.3%) in this group.
| Income Bracket | # Households | Median Income |
| 15 to 24 Years | 179 (1.3%) | $38,173 |
| 25 to 44 Years | 4,655 (35.2%) | $64,530 |
| 45 to 64 Years | 5,374 (40.6%) | $61,477 |
| 65+ Years | 3,024 (22.9%) | $49,300 |
| Total | 13,232 (100.0%) | $57,953 |
Poverty in Eastpointe
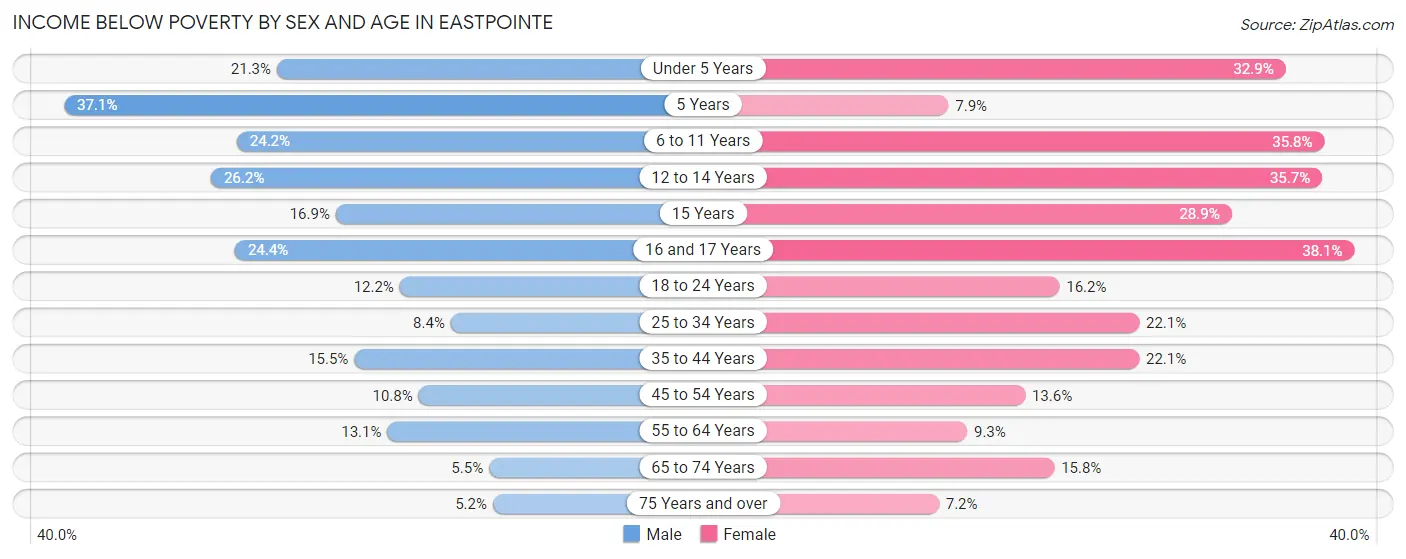
Income Below Poverty by Sex and Age in Eastpointe
With 14.4% poverty level for males and 20.0% for females among the residents of Eastpointe, 5 year old males and 16 and 17 year old females are the most vulnerable to poverty, with 96 males (37.1%) and 148 females (38.1%) in their respective age groups living below the poverty level.
| Age Bracket | Male | Female |
| Under 5 Years | 208 (21.3%) | 395 (32.9%) |
| 5 Years | 96 (37.1%) | 14 (7.9%) |
| 6 to 11 Years | 310 (24.2%) | 437 (35.8%) |
| 12 to 14 Years | 219 (26.2%) | 241 (35.6%) |
| 15 Years | 36 (16.9%) | 46 (28.9%) |
| 16 and 17 Years | 188 (24.4%) | 148 (38.1%) |
| 18 to 24 Years | 169 (12.1%) | 234 (16.2%) |
| 25 to 34 Years | 223 (8.4%) | 518 (22.1%) |
| 35 to 44 Years | 320 (15.5%) | 612 (22.1%) |
| 45 to 54 Years | 236 (10.7%) | 273 (13.6%) |
| 55 to 64 Years | 283 (13.1%) | 223 (9.3%) |
| 65 to 74 Years | 70 (5.5%) | 268 (15.8%) |
| 75 Years and over | 25 (5.2%) | 67 (7.2%) |
| Total | 2,383 (14.4%) | 3,476 (20.0%) |
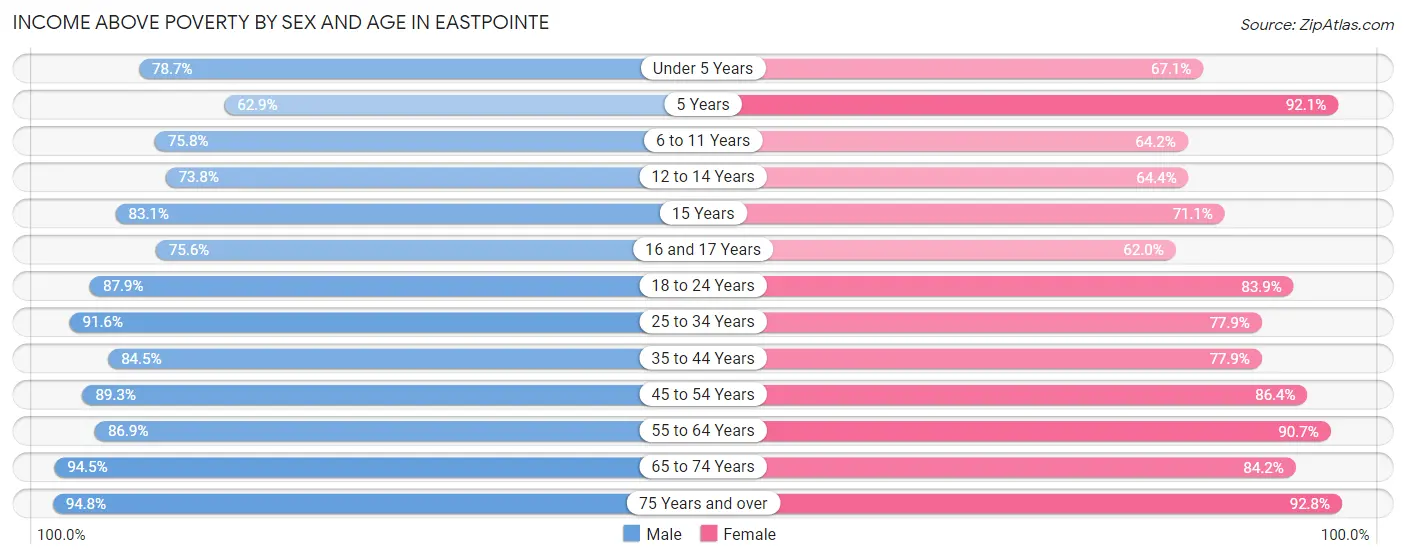
Income Above Poverty by Sex and Age in Eastpointe
According to the poverty statistics in Eastpointe, males aged 75 years and over and females aged 75 years and over are the age groups that are most secure financially, with 94.8% of males and 92.8% of females in these age groups living above the poverty line.
| Age Bracket | Male | Female |
| Under 5 Years | 770 (78.7%) | 804 (67.1%) |
| 5 Years | 163 (62.9%) | 163 (92.1%) |
| 6 to 11 Years | 969 (75.8%) | 783 (64.2%) |
| 12 to 14 Years | 618 (73.8%) | 435 (64.3%) |
| 15 Years | 177 (83.1%) | 113 (71.1%) |
| 16 and 17 Years | 583 (75.6%) | 241 (62.0%) |
| 18 to 24 Years | 1,222 (87.8%) | 1,215 (83.9%) |
| 25 to 34 Years | 2,444 (91.6%) | 1,829 (77.9%) |
| 35 to 44 Years | 1,740 (84.5%) | 2,161 (77.9%) |
| 45 to 54 Years | 1,959 (89.2%) | 1,735 (86.4%) |
| 55 to 64 Years | 1,882 (86.9%) | 2,176 (90.7%) |
| 65 to 74 Years | 1,197 (94.5%) | 1,431 (84.2%) |
| 75 Years and over | 452 (94.8%) | 864 (92.8%) |
| Total | 14,176 (85.6%) | 13,950 (80.0%) |
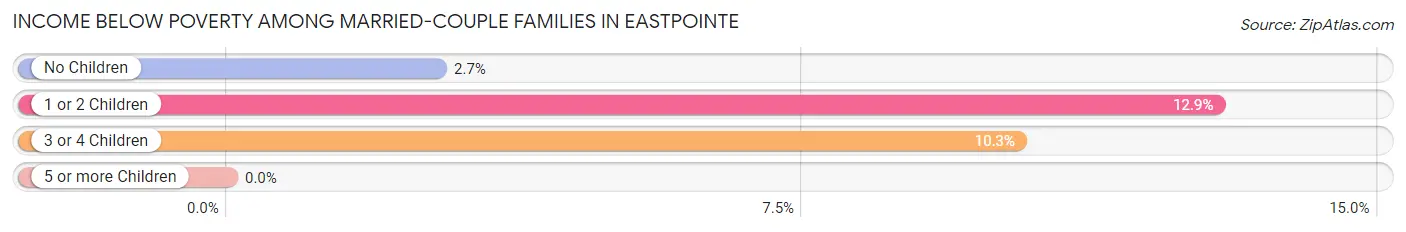
Income Below Poverty Among Married-Couple Families in Eastpointe
The poverty statistics for married-couple families in Eastpointe show that 6.6% or 279 of the total 4,216 families live below the poverty line. Families with 1 or 2 children have the highest poverty rate of 12.9%, comprising of 173 families. On the other hand, families with 5 or more children have the lowest poverty rate of 0.0%, which includes 0 families.
| Children | Above Poverty | Below Poverty |
| No Children | 2,423 (97.3%) | 68 (2.7%) |
| 1 or 2 Children | 1,169 (87.1%) | 173 (12.9%) |
| 3 or 4 Children | 331 (89.7%) | 38 (10.3%) |
| 5 or more Children | 14 (100.0%) | 0 (0.0%) |
| Total | 3,937 (93.4%) | 279 (6.6%) |
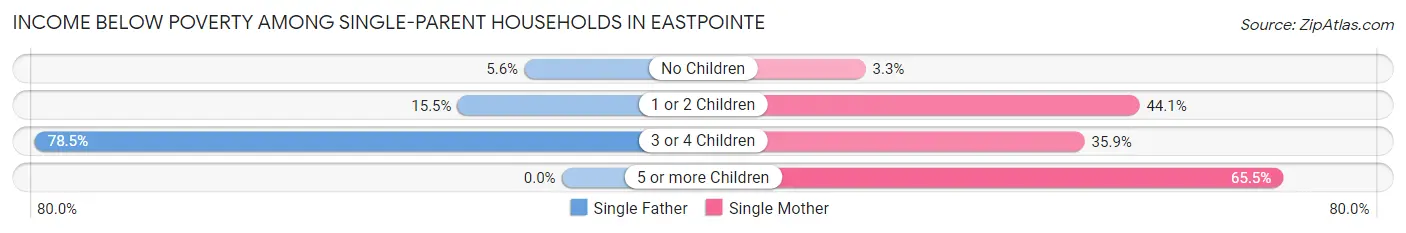
Income Below Poverty Among Single-Parent Households in Eastpointe
According to the poverty data in Eastpointe, 13.9% or 155 single-father households and 27.6% or 866 single-mother households are living below the poverty line. Among single-father households, those with 3 or 4 children have the highest poverty rate, with 62 households (78.5%) experiencing poverty. Likewise, among single-mother households, those with 5 or more children have the highest poverty rate, with 55 households (65.5%) falling below the poverty line.
| Children | Single Father | Single Mother |
| No Children | 35 (5.6%) | 41 (3.3%) |
| 1 or 2 Children | 58 (15.5%) | 663 (44.1%) |
| 3 or 4 Children | 62 (78.5%) | 107 (35.9%) |
| 5 or more Children | 0 (0.0%) | 55 (65.5%) |
| Total | 155 (13.9%) | 866 (27.6%) |
Income Below Poverty Among Married-Couple vs Single-Parent Households in Eastpointe
The poverty data for Eastpointe shows that 279 of the married-couple family households (6.6%) and 1,021 of the single-parent households (24.0%) are living below the poverty level. Within the married-couple family households, those with 1 or 2 children have the highest poverty rate, with 173 households (12.9%) falling below the poverty line. Among the single-parent households, those with 5 or more children have the highest poverty rate, with 55 household (46.6%) living below poverty.
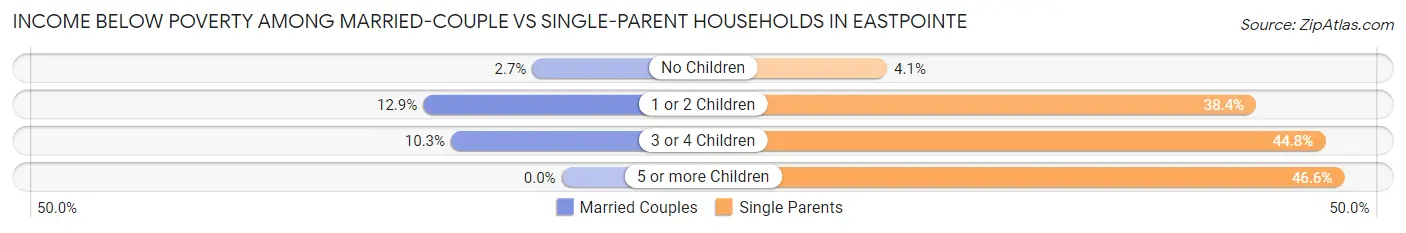
| Children | Married-Couple Families | Single-Parent Households |
| No Children | 68 (2.7%) | 76 (4.1%) |
| 1 or 2 Children | 173 (12.9%) | 721 (38.4%) |
| 3 or 4 Children | 38 (10.3%) | 169 (44.8%) |
| 5 or more Children | 0 (0.0%) | 55 (46.6%) |
| Total | 279 (6.6%) | 1,021 (24.0%) |
Race in Eastpointe
The most populous races in Eastpointe are Black / African American (18,104 | 53.1%), White / Caucasian (13,714 | 40.2%), and Two or more Races (1,785 | 5.2%).
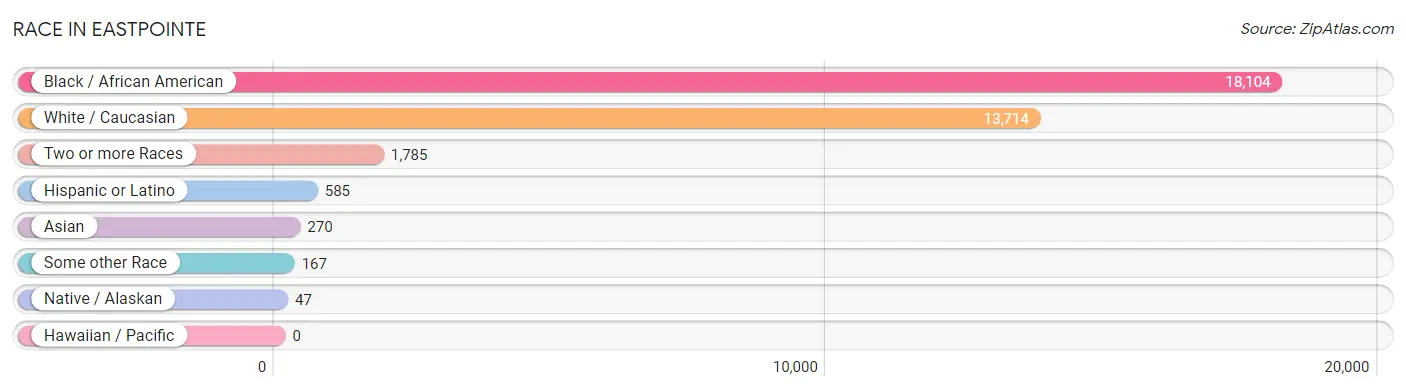
| Race | # Population | % Population |
| Asian | 270 | 0.8% |
| Black / African American | 18,104 | 53.1% |
| Hawaiian / Pacific | 0 | 0.0% |
| Hispanic or Latino | 585 | 1.7% |
| Native / Alaskan | 47 | 0.1% |
| White / Caucasian | 13,714 | 40.2% |
| Two or more Races | 1,785 | 5.2% |
| Some other Race | 167 | 0.5% |
| Total | 34,087 | 100.0% |
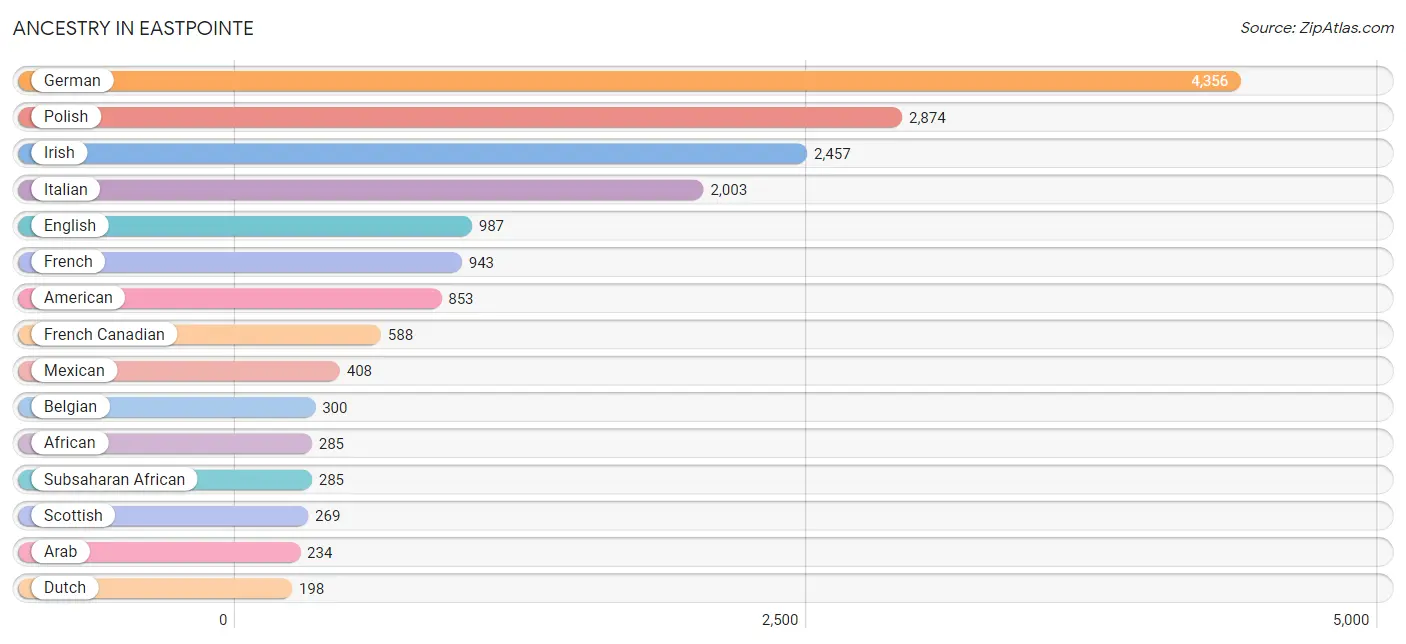
Ancestry in Eastpointe
The most populous ancestries reported in Eastpointe are German (4,356 | 12.8%), Polish (2,874 | 8.4%), Irish (2,457 | 7.2%), Italian (2,003 | 5.9%), and English (987 | 2.9%), together accounting for 37.2% of all Eastpointe residents.
| Ancestry | # Population | % Population |
| African | 285 | 0.8% |
| American | 853 | 2.5% |
| Arab | 234 | 0.7% |
| Armenian | 11 | 0.0% |
| Austrian | 9 | 0.0% |
| Bangladeshi | 91 | 0.3% |
| Belgian | 300 | 0.9% |
| Bhutanese | 14 | 0.0% |
| Blackfeet | 5 | 0.0% |
| British | 19 | 0.1% |
| Bulgarian | 68 | 0.2% |
| Canadian | 139 | 0.4% |
| Cherokee | 62 | 0.2% |
| Chippewa | 74 | 0.2% |
| Choctaw | 22 | 0.1% |
| Croatian | 8 | 0.0% |
| Crow | 5 | 0.0% |
| Cuban | 48 | 0.1% |
| Czech | 29 | 0.1% |
| Czechoslovakian | 9 | 0.0% |
| Danish | 6 | 0.0% |
| Dutch | 198 | 0.6% |
| Eastern European | 6 | 0.0% |
| Egyptian | 9 | 0.0% |
| English | 987 | 2.9% |
| European | 144 | 0.4% |
| Finnish | 27 | 0.1% |
| French | 943 | 2.8% |
| French Canadian | 588 | 1.7% |
| German | 4,356 | 12.8% |
| Greek | 60 | 0.2% |
| Guamanian / Chamorro | 29 | 0.1% |
| Hungarian | 155 | 0.4% |
| Indonesian | 78 | 0.2% |
| Iraqi | 15 | 0.0% |
| Irish | 2,457 | 7.2% |
| Israeli | 13 | 0.0% |
| Italian | 2,003 | 5.9% |
| Jamaican | 182 | 0.5% |
| Korean | 42 | 0.1% |
| Lebanese | 92 | 0.3% |
| Lithuanian | 6 | 0.0% |
| Mexican | 408 | 1.2% |
| Mexican American Indian | 9 | 0.0% |
| Moroccan | 4 | 0.0% |
| Northern European | 20 | 0.1% |
| Norwegian | 111 | 0.3% |
| Ottawa | 7 | 0.0% |
| Palestinian | 28 | 0.1% |
| Polish | 2,874 | 8.4% |
| Portuguese | 12 | 0.0% |
| Puerto Rican | 55 | 0.2% |
| Romanian | 13 | 0.0% |
| Russian | 169 | 0.5% |
| Samoan | 9 | 0.0% |
| Scandinavian | 9 | 0.0% |
| Scotch-Irish | 148 | 0.4% |
| Scottish | 269 | 0.8% |
| Serbian | 20 | 0.1% |
| Slovak | 28 | 0.1% |
| Slovene | 27 | 0.1% |
| Subsaharan African | 285 | 0.8% |
| Swedish | 46 | 0.1% |
| Swiss | 33 | 0.1% |
| Syrian | 76 | 0.2% |
| Thai | 9 | 0.0% |
| Ukrainian | 126 | 0.4% |
| Vietnamese | 70 | 0.2% |
| Welsh | 60 | 0.2% |
| Yugoslavian | 30 | 0.1% | View All 70 Rows |
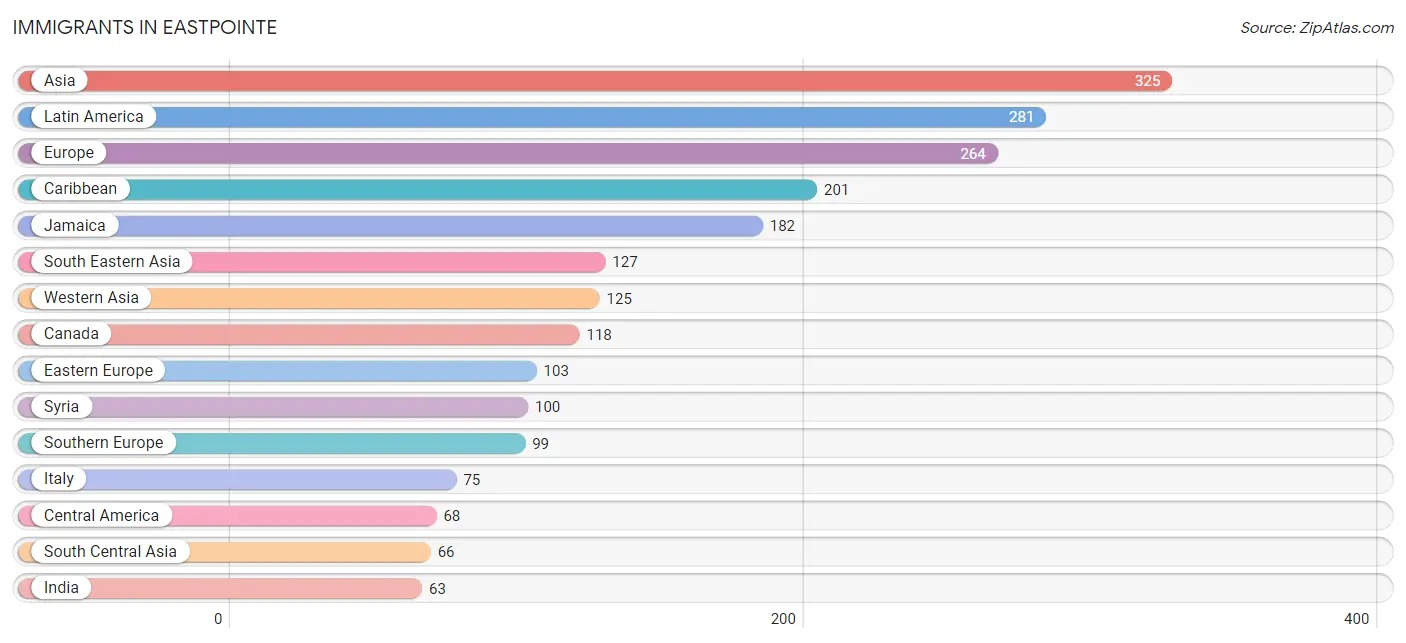
Immigrants in Eastpointe
The most numerous immigrant groups reported in Eastpointe came from Asia (325 | 0.9%), Latin America (281 | 0.8%), Europe (264 | 0.8%), Caribbean (201 | 0.6%), and Jamaica (182 | 0.5%), together accounting for 3.7% of all Eastpointe residents.
| Immigration Origin | # Population | % Population |
| Africa | 59 | 0.2% |
| Asia | 325 | 0.9% |
| Bangladesh | 3 | 0.0% |
| Brazil | 12 | 0.0% |
| Bulgaria | 52 | 0.2% |
| Canada | 118 | 0.4% |
| Caribbean | 201 | 0.6% |
| Central America | 68 | 0.2% |
| Cuba | 19 | 0.1% |
| Denmark | 6 | 0.0% |
| Eastern Africa | 19 | 0.1% |
| Eastern Asia | 7 | 0.0% |
| Eastern Europe | 103 | 0.3% |
| Egypt | 9 | 0.0% |
| Europe | 264 | 0.8% |
| Germany | 36 | 0.1% |
| Greece | 17 | 0.1% |
| India | 63 | 0.2% |
| Iraq | 20 | 0.1% |
| Ireland | 7 | 0.0% |
| Italy | 75 | 0.2% |
| Jamaica | 182 | 0.5% |
| Japan | 7 | 0.0% |
| Kenya | 19 | 0.1% |
| Laos | 33 | 0.1% |
| Latin America | 281 | 0.8% |
| Mexico | 52 | 0.2% |
| Nigeria | 10 | 0.0% |
| Northern Africa | 26 | 0.1% |
| Northern Europe | 26 | 0.1% |
| Panama | 16 | 0.1% |
| Philippines | 16 | 0.1% |
| Poland | 35 | 0.1% |
| Scotland | 13 | 0.0% |
| Senegal | 4 | 0.0% |
| Serbia | 8 | 0.0% |
| South America | 12 | 0.0% |
| South Central Asia | 66 | 0.2% |
| South Eastern Asia | 127 | 0.4% |
| Southern Europe | 99 | 0.3% |
| Sudan | 17 | 0.1% |
| Syria | 100 | 0.3% |
| Thailand | 16 | 0.1% |
| Turkey | 5 | 0.0% |
| Western Africa | 14 | 0.0% |
| Western Asia | 125 | 0.4% |
| Western Europe | 36 | 0.1% | View All 47 Rows |
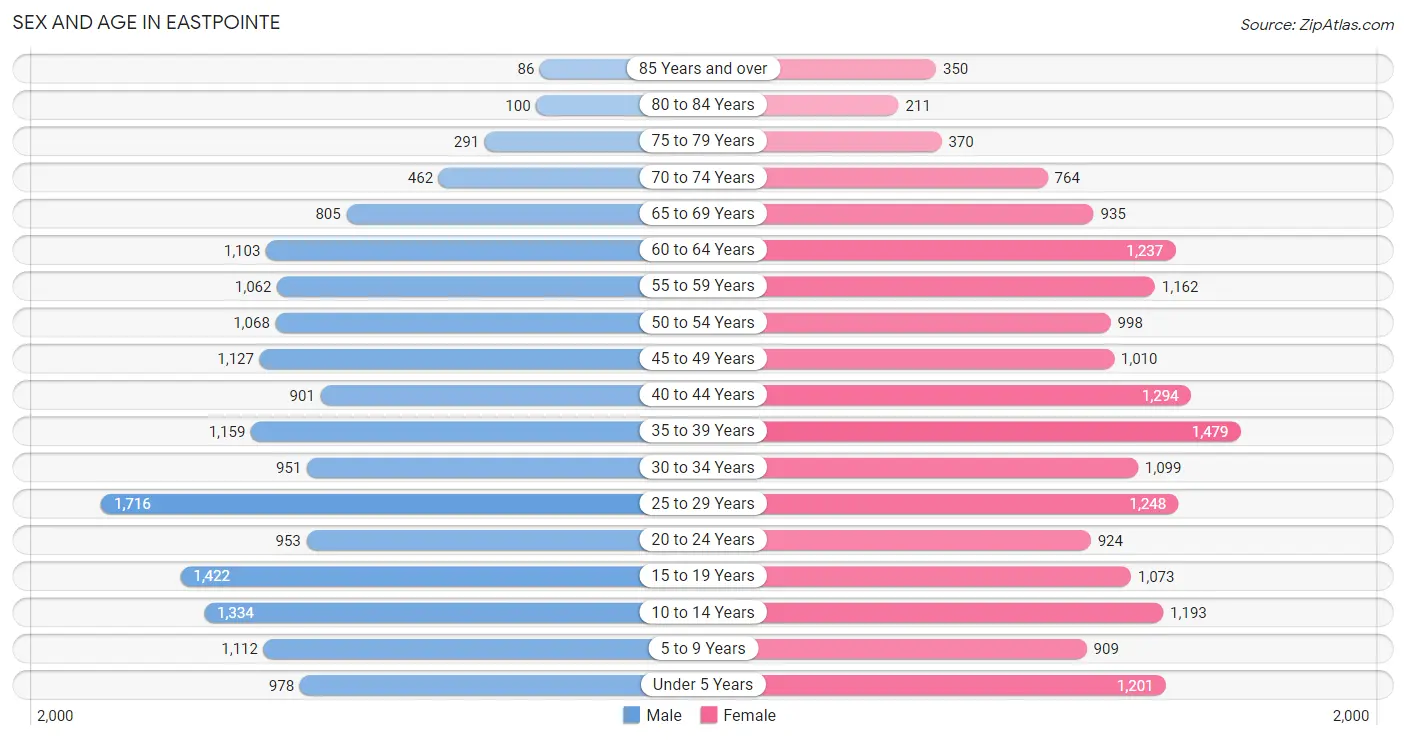
Sex and Age in Eastpointe
Sex and Age in Eastpointe
The most populous age groups in Eastpointe are 25 to 29 Years (1,716 | 10.3%) for men and 35 to 39 Years (1,479 | 8.5%) for women.
| Age Bracket | Male | Female |
| Under 5 Years | 978 (5.9%) | 1,201 (6.9%) |
| 5 to 9 Years | 1,112 (6.7%) | 909 (5.2%) |
| 10 to 14 Years | 1,334 (8.0%) | 1,193 (6.8%) |
| 15 to 19 Years | 1,422 (8.6%) | 1,073 (6.1%) |
| 20 to 24 Years | 953 (5.7%) | 924 (5.3%) |
| 25 to 29 Years | 1,716 (10.3%) | 1,248 (7.1%) |
| 30 to 34 Years | 951 (5.7%) | 1,099 (6.3%) |
| 35 to 39 Years | 1,159 (7.0%) | 1,479 (8.5%) |
| 40 to 44 Years | 901 (5.4%) | 1,294 (7.4%) |
| 45 to 49 Years | 1,127 (6.8%) | 1,010 (5.8%) |
| 50 to 54 Years | 1,068 (6.4%) | 998 (5.7%) |
| 55 to 59 Years | 1,062 (6.4%) | 1,162 (6.7%) |
| 60 to 64 Years | 1,103 (6.6%) | 1,237 (7.1%) |
| 65 to 69 Years | 805 (4.8%) | 935 (5.4%) |
| 70 to 74 Years | 462 (2.8%) | 764 (4.4%) |
| 75 to 79 Years | 291 (1.8%) | 370 (2.1%) |
| 80 to 84 Years | 100 (0.6%) | 211 (1.2%) |
| 85 Years and over | 86 (0.5%) | 350 (2.0%) |
| Total | 16,630 (100.0%) | 17,457 (100.0%) |
Families and Households in Eastpointe
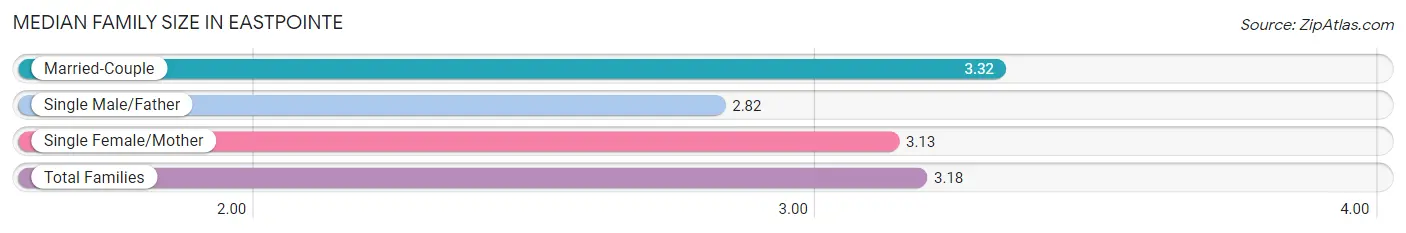
Median Family Size in Eastpointe
The median family size in Eastpointe is 3.18 persons per family, with married-couple families (4,216 | 49.8%) accounting for the largest median family size of 3.32 persons per family. On the other hand, single male/father families (1,113 | 13.2%) represent the smallest median family size with 2.82 persons per family.
| Family Type | # Families | Family Size |
| Married-Couple | 4,216 (49.8%) | 3.32 |
| Single Male/Father | 1,113 (13.2%) | 2.82 |
| Single Female/Mother | 3,138 (37.1%) | 3.13 |
| Total Families | 8,467 (100.0%) | 3.18 |
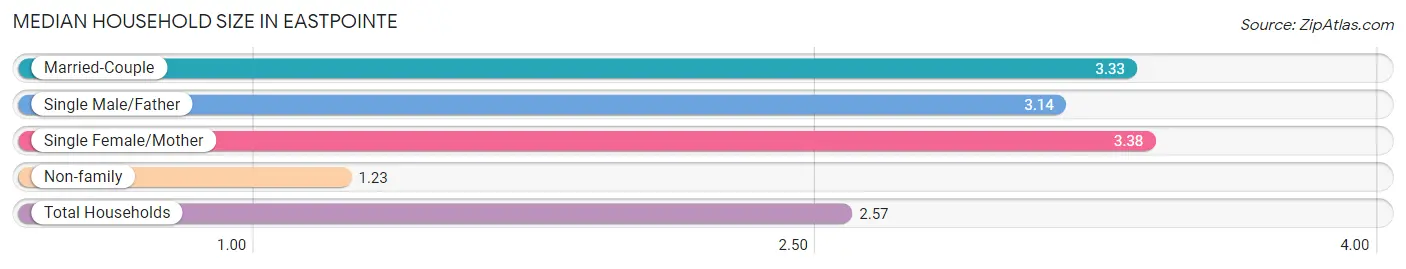
Median Household Size in Eastpointe
The median household size in Eastpointe is 2.57 persons per household, with single female/mother households (3,138 | 23.7%) accounting for the largest median household size of 3.38 persons per household. non-family households (4,765 | 36.0%) represent the smallest median household size with 1.23 persons per household.
| Household Type | # Households | Household Size |
| Married-Couple | 4,216 (31.9%) | 3.33 |
| Single Male/Father | 1,113 (8.4%) | 3.14 |
| Single Female/Mother | 3,138 (23.7%) | 3.38 |
| Non-family | 4,765 (36.0%) | 1.23 |
| Total Households | 13,232 (100.0%) | 2.57 |
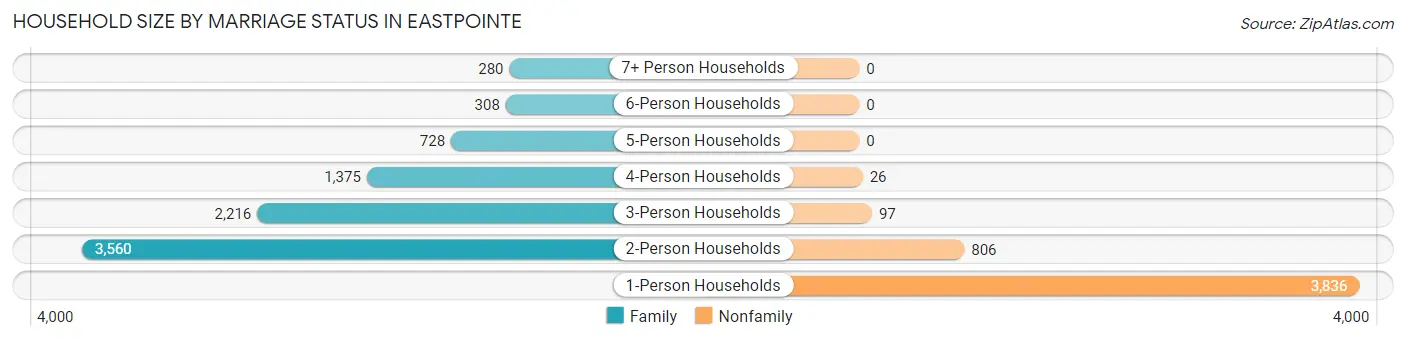
Household Size by Marriage Status in Eastpointe
Out of a total of 13,232 households in Eastpointe, 8,467 (64.0%) are family households, while 4,765 (36.0%) are nonfamily households. The most numerous type of family households are 2-person households, comprising 3,560, and the most common type of nonfamily households are 1-person households, comprising 3,836.
| Household Size | Family Households | Nonfamily Households |
| 1-Person Households | - | 3,836 (29.0%) |
| 2-Person Households | 3,560 (26.9%) | 806 (6.1%) |
| 3-Person Households | 2,216 (16.8%) | 97 (0.7%) |
| 4-Person Households | 1,375 (10.4%) | 26 (0.2%) |
| 5-Person Households | 728 (5.5%) | 0 (0.0%) |
| 6-Person Households | 308 (2.3%) | 0 (0.0%) |
| 7+ Person Households | 280 (2.1%) | 0 (0.0%) |
| Total | 8,467 (64.0%) | 4,765 (36.0%) |
Female Fertility in Eastpointe
Fertility by Age in Eastpointe
Average fertility rate in Eastpointe is 48.0 births per 1,000 women. Women in the age bracket of 20 to 34 years have the highest fertility rate with 65.0 births per 1,000 women. Women in the age bracket of 20 to 34 years acount for 53.0% of all women with births.
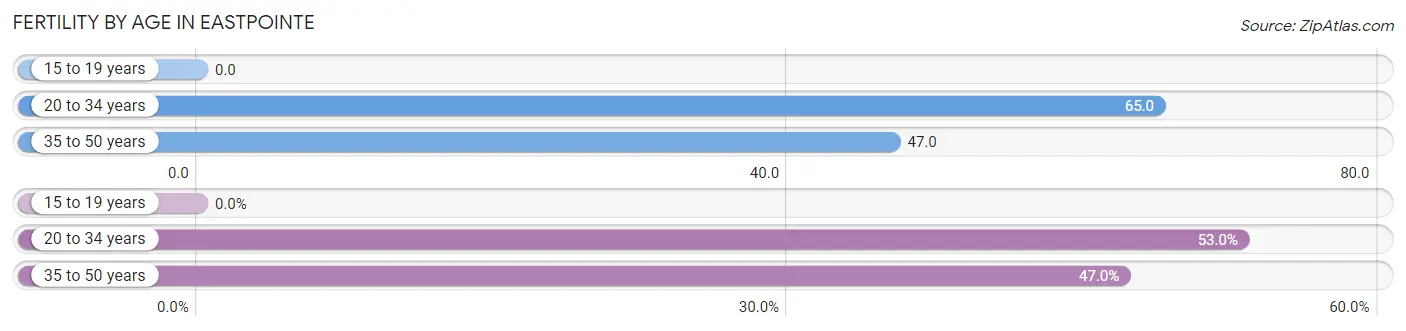
| Age Bracket | Women with Births | Births / 1,000 Women |
| 15 to 19 years | 0 (0.0%) | 0.0 |
| 20 to 34 years | 211 (53.0%) | 65.0 |
| 35 to 50 years | 187 (47.0%) | 47.0 |
| Total | 398 (100.0%) | 48.0 |
Fertility by Age by Marriage Status in Eastpointe
50.0% of women with births (398) in Eastpointe are married. The highest percentage of unmarried women with births falls into 35 to 50 years age bracket with 77.5% of them unmarried at the time of birth, while the lowest percentage of unmarried women with births belong to 20 to 34 years age bracket with 25.6% of them unmarried.
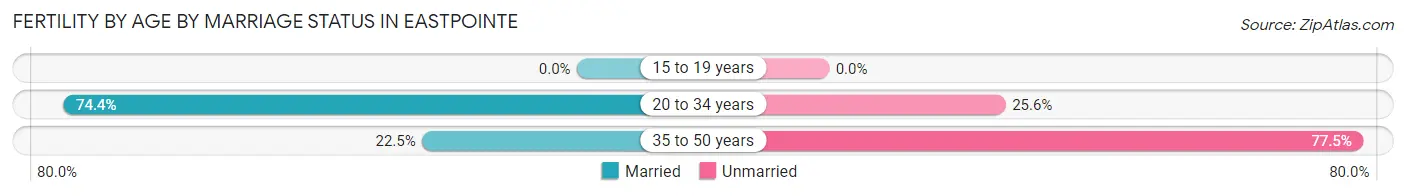
| Age Bracket | Married | Unmarried |
| 15 to 19 years | 0 (0.0%) | 0 (0.0%) |
| 20 to 34 years | 157 (74.4%) | 54 (25.6%) |
| 35 to 50 years | 42 (22.5%) | 145 (77.5%) |
| Total | 199 (50.0%) | 199 (50.0%) |
Fertility by Education in Eastpointe
Average fertility rate in Eastpointe is 48.0 births per 1,000 women. Women with the education attainment of graduate degree have the highest fertility rate of 133.0 births per 1,000 women, while women with the education attainment of less than high school have the lowest fertility at 5.0 births per 1,000 women. Women with the education attainment of high school diploma represent 41.5% of all women with births.
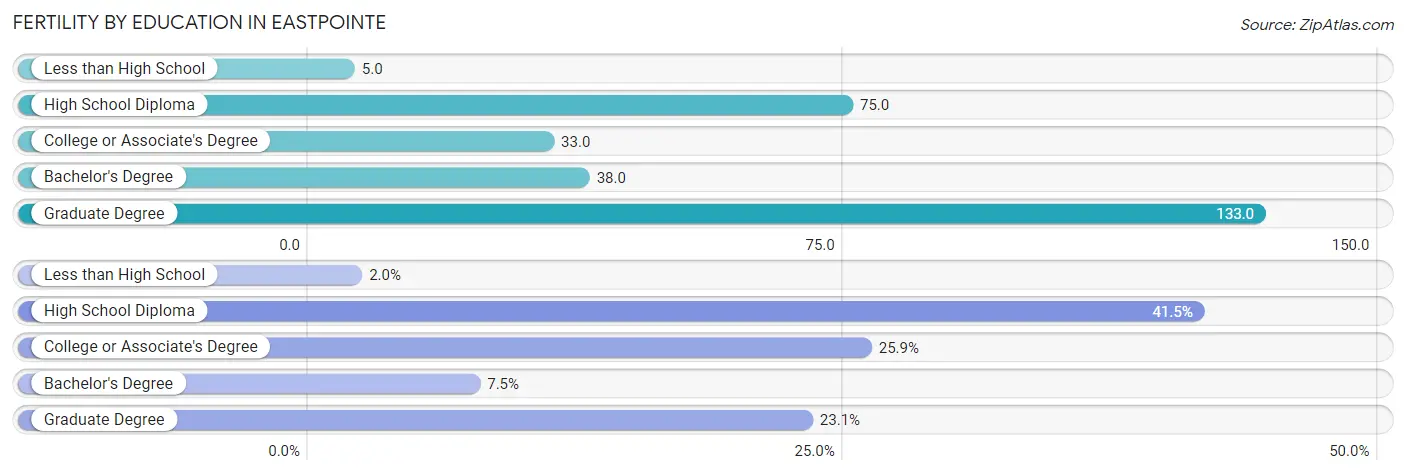
| Educational Attainment | Women with Births | Births / 1,000 Women |
| Less than High School | 8 (2.0%) | 5.0 |
| High School Diploma | 165 (41.5%) | 75.0 |
| College or Associate's Degree | 103 (25.9%) | 33.0 |
| Bachelor's Degree | 30 (7.5%) | 38.0 |
| Graduate Degree | 92 (23.1%) | 133.0 |
| Total | 398 (100.0%) | 48.0 |
Fertility by Education by Marriage Status in Eastpointe
50.0% of women with births in Eastpointe are unmarried. Women with the educational attainment of bachelor's degree are most likely to be married with 73.3% of them married at childbirth, while women with the educational attainment of less than high school are least likely to be married with 100.0% of them unmarried at childbirth.
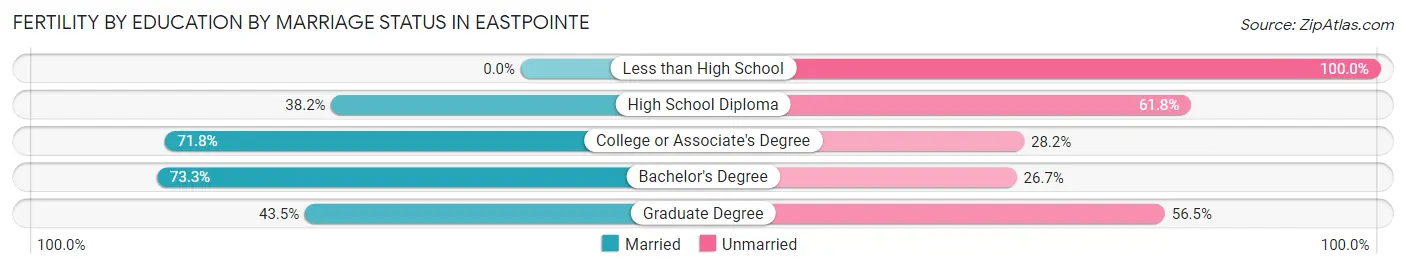
| Educational Attainment | Married | Unmarried |
| Less than High School | 0 (0.0%) | 8 (100.0%) |
| High School Diploma | 63 (38.2%) | 102 (61.8%) |
| College or Associate's Degree | 74 (71.8%) | 29 (28.2%) |
| Bachelor's Degree | 22 (73.3%) | 8 (26.7%) |
| Graduate Degree | 40 (43.5%) | 52 (56.5%) |
| Total | 199 (50.0%) | 199 (50.0%) |
Employment Characteristics in Eastpointe
Employment by Class of Employer in Eastpointe
Among the 14,136 employed individuals in Eastpointe, private company employees (10,972 | 77.6%), not-for-profit organizations (947 | 6.7%), and self-employed (not incorporated) (636 | 4.5%) make up the most common classes of employment.
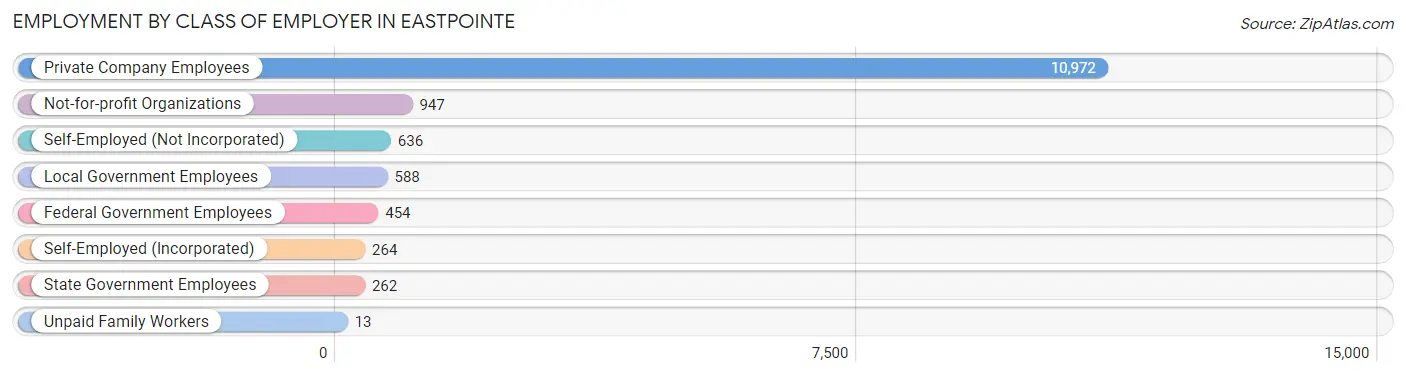
| Employer Class | # Employees | % Employees |
| Private Company Employees | 10,972 | 77.6% |
| Self-Employed (Incorporated) | 264 | 1.9% |
| Self-Employed (Not Incorporated) | 636 | 4.5% |
| Not-for-profit Organizations | 947 | 6.7% |
| Local Government Employees | 588 | 4.2% |
| State Government Employees | 262 | 1.8% |
| Federal Government Employees | 454 | 3.2% |
| Unpaid Family Workers | 13 | 0.1% |
| Total | 14,136 | 100.0% |
Employment Status by Age in Eastpointe
According to the labor force statistics for Eastpointe, out of the total population over 16 years of age (26,988), 61.5% or 16,598 individuals are in the labor force, with 12.1% or 2,008 of them unemployed. The age group with the highest labor force participation rate is 25 to 29 years, with 82.9% or 2,457 individuals in the labor force. Within the labor force, the 16 to 19 years age range has the highest percentage of unemployed individuals, with 43.2% or 403 of them being unemployed.
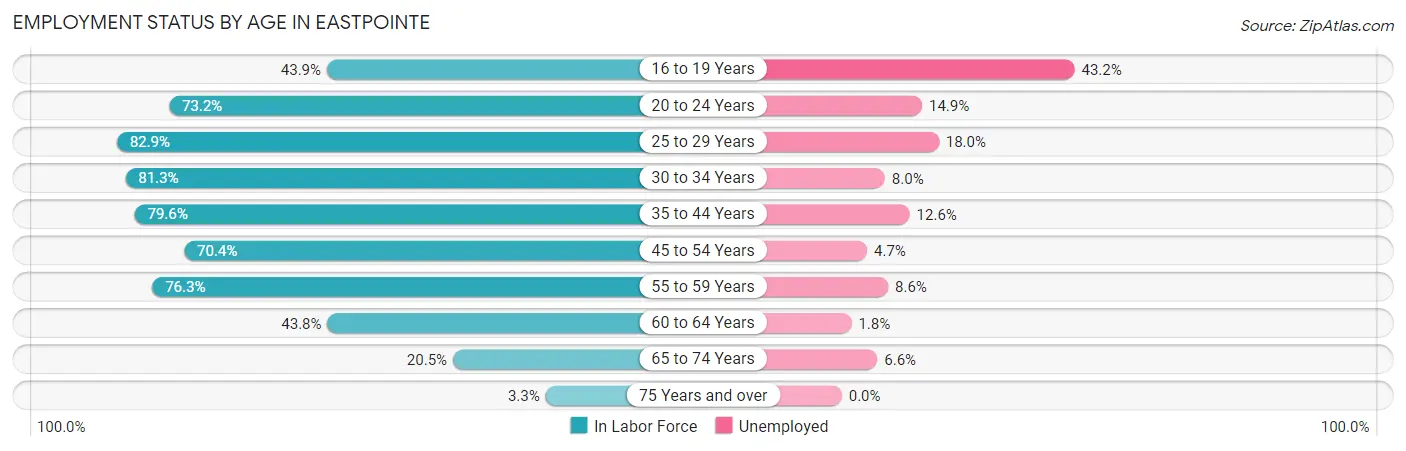
| Age Bracket | In Labor Force | Unemployed |
| 16 to 19 Years | 932 (43.9%) | 403 (43.2%) |
| 20 to 24 Years | 1,374 (73.2%) | 205 (14.9%) |
| 25 to 29 Years | 2,457 (82.9%) | 442 (18.0%) |
| 30 to 34 Years | 1,667 (81.3%) | 133 (8.0%) |
| 35 to 44 Years | 3,847 (79.6%) | 485 (12.6%) |
| 45 to 54 Years | 2,959 (70.4%) | 139 (4.7%) |
| 55 to 59 Years | 1,697 (76.3%) | 146 (8.6%) |
| 60 to 64 Years | 1,025 (43.8%) | 18 (1.8%) |
| 65 to 74 Years | 608 (20.5%) | 40 (6.6%) |
| 75 Years and over | 46 (3.3%) | 0 (0.0%) |
| Total | 16,598 (61.5%) | 2,008 (12.1%) |
Employment Status by Educational Attainment in Eastpointe
According to labor force statistics for Eastpointe, 73.3% of individuals (13,644) out of the total population between 25 and 64 years of age (18,614) are in the labor force, with 10.0% or 1,364 of them being unemployed. The group with the highest labor force participation rate are those with the educational attainment of bachelor's degree or higher, with 86.0% or 2,279 individuals in the labor force. Within the labor force, individuals with less than high school education have the highest percentage of unemployment, with 17.6% or 244 of them being unemployed.
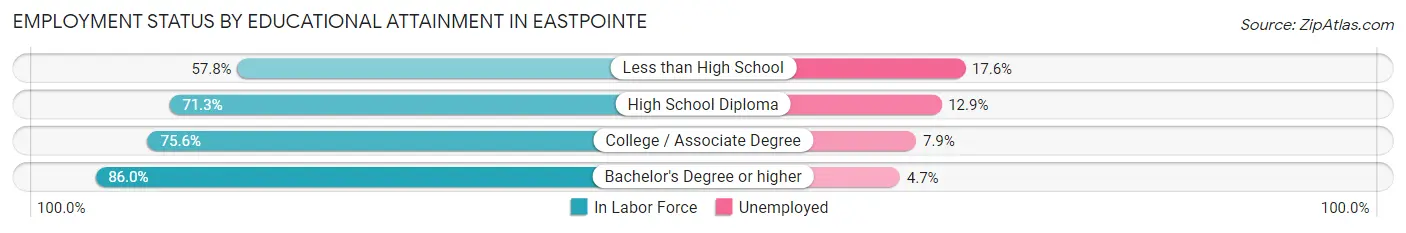
| Educational Attainment | In Labor Force | Unemployed |
| Less than High School | 1,389 (57.8%) | 423 (17.6%) |
| High School Diploma | 4,490 (71.3%) | 812 (12.9%) |
| College / Associate Degree | 5,491 (75.6%) | 574 (7.9%) |
| Bachelor's Degree or higher | 2,279 (86.0%) | 125 (4.7%) |
| Total | 13,644 (73.3%) | 1,861 (10.0%) |
Employment Occupations by Sex in Eastpointe
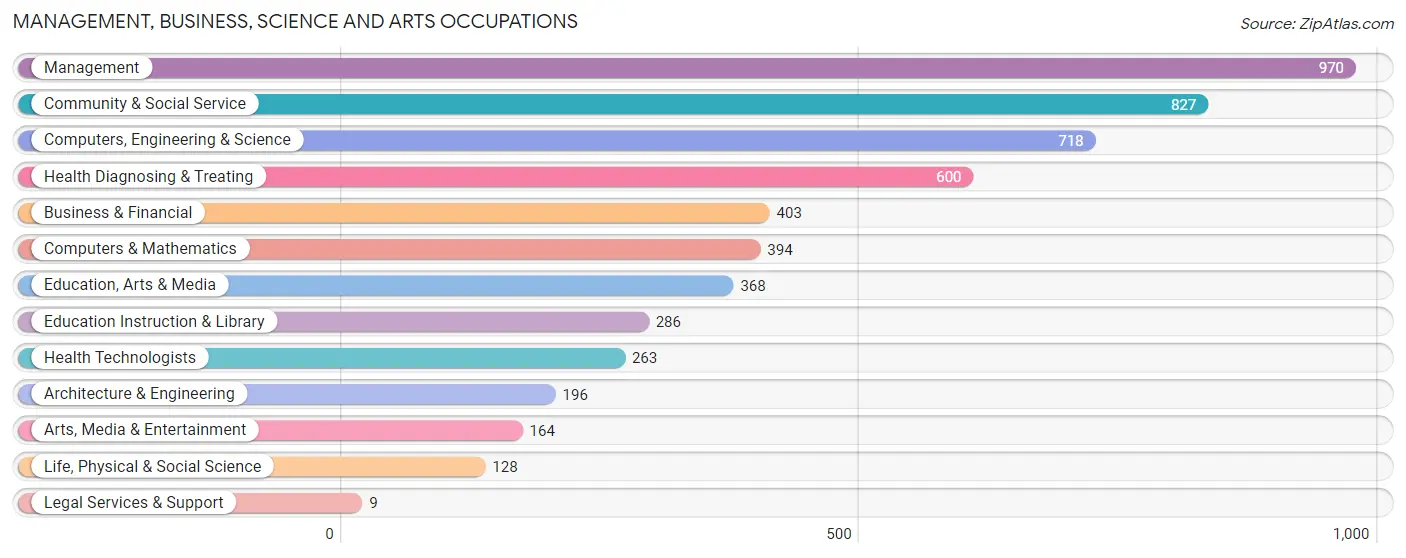
Management, Business, Science and Arts Occupations
The most common Management, Business, Science and Arts occupations in Eastpointe are Management (970 | 6.6%), Community & Social Service (827 | 5.7%), Computers, Engineering & Science (718 | 4.9%), Health Diagnosing & Treating (600 | 4.1%), and Business & Financial (403 | 2.8%).
Management, Business, Science and Arts Occupations by Sex
Within the Management, Business, Science and Arts occupations in Eastpointe, the most male-oriented occupations are Legal Services & Support (100.0%), Computers & Mathematics (72.1%), and Architecture & Engineering (56.6%), while the most female-oriented occupations are Health Technologists (97.0%), Life, Physical & Social Science (92.2%), and Health Diagnosing & Treating (89.2%).
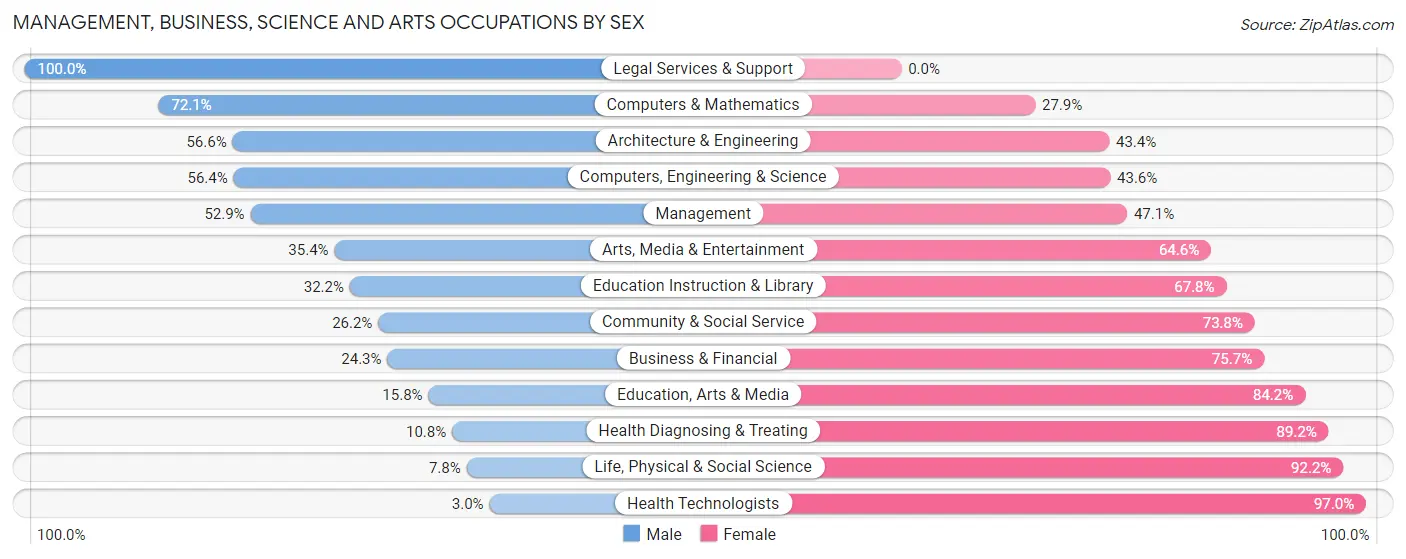
| Occupation | Male | Female |
| Management | 513 (52.9%) | 457 (47.1%) |
| Business & Financial | 98 (24.3%) | 305 (75.7%) |
| Computers, Engineering & Science | 405 (56.4%) | 313 (43.6%) |
| Computers & Mathematics | 284 (72.1%) | 110 (27.9%) |
| Architecture & Engineering | 111 (56.6%) | 85 (43.4%) |
| Life, Physical & Social Science | 10 (7.8%) | 118 (92.2%) |
| Community & Social Service | 217 (26.2%) | 610 (73.8%) |
| Education, Arts & Media | 58 (15.8%) | 310 (84.2%) |
| Legal Services & Support | 9 (100.0%) | 0 (0.0%) |
| Education Instruction & Library | 92 (32.2%) | 194 (67.8%) |
| Arts, Media & Entertainment | 58 (35.4%) | 106 (64.6%) |
| Health Diagnosing & Treating | 65 (10.8%) | 535 (89.2%) |
| Health Technologists | 8 (3.0%) | 255 (97.0%) |
| Total (Category) | 1,298 (36.9%) | 2,220 (63.1%) |
| Total (Overall) | 7,609 (52.1%) | 6,991 (47.9%) |
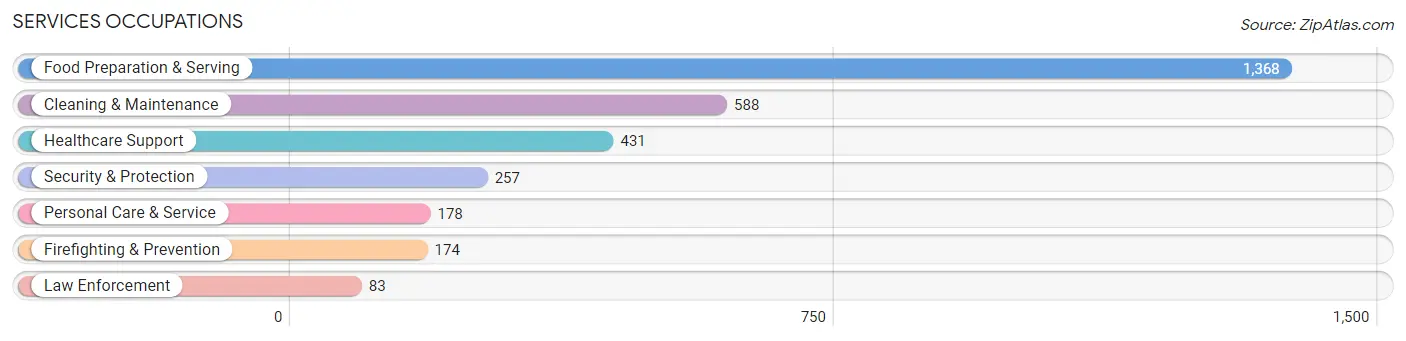
Services Occupations
The most common Services occupations in Eastpointe are Food Preparation & Serving (1,368 | 9.4%), Cleaning & Maintenance (588 | 4.0%), Healthcare Support (431 | 2.9%), Security & Protection (257 | 1.8%), and Personal Care & Service (178 | 1.2%).
Services Occupations by Sex
Within the Services occupations in Eastpointe, the most male-oriented occupations are Law Enforcement (100.0%), Cleaning & Maintenance (70.6%), and Security & Protection (65.0%), while the most female-oriented occupations are Healthcare Support (86.5%), Personal Care & Service (75.3%), and Firefighting & Prevention (51.7%).
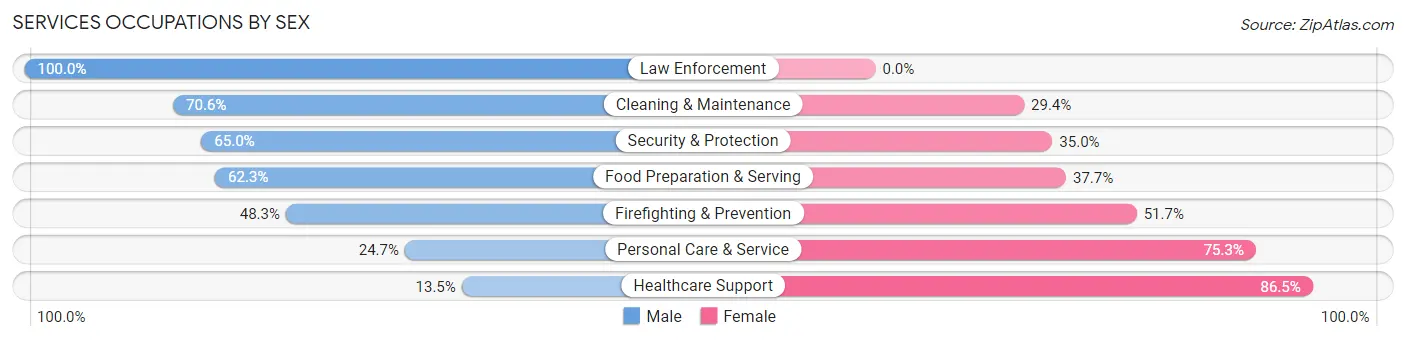
| Occupation | Male | Female |
| Healthcare Support | 58 (13.5%) | 373 (86.5%) |
| Security & Protection | 167 (65.0%) | 90 (35.0%) |
| Firefighting & Prevention | 84 (48.3%) | 90 (51.7%) |
| Law Enforcement | 83 (100.0%) | 0 (0.0%) |
| Food Preparation & Serving | 852 (62.3%) | 516 (37.7%) |
| Cleaning & Maintenance | 415 (70.6%) | 173 (29.4%) |
| Personal Care & Service | 44 (24.7%) | 134 (75.3%) |
| Total (Category) | 1,536 (54.4%) | 1,286 (45.6%) |
| Total (Overall) | 7,609 (52.1%) | 6,991 (47.9%) |
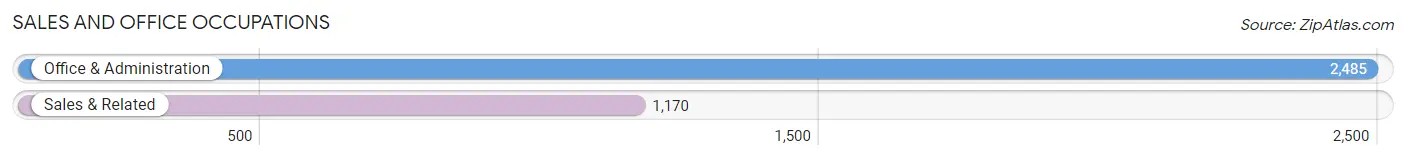
Sales and Office Occupations
The most common Sales and Office occupations in Eastpointe are Office & Administration (2,485 | 17.0%), and Sales & Related (1,170 | 8.0%).
Sales and Office Occupations by Sex
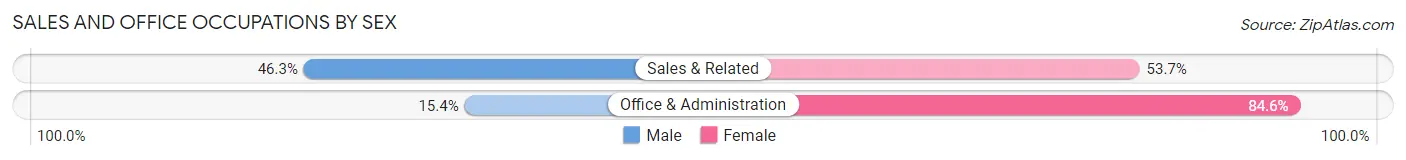
| Occupation | Male | Female |
| Sales & Related | 542 (46.3%) | 628 (53.7%) |
| Office & Administration | 383 (15.4%) | 2,102 (84.6%) |
| Total (Category) | 925 (25.3%) | 2,730 (74.7%) |
| Total (Overall) | 7,609 (52.1%) | 6,991 (47.9%) |
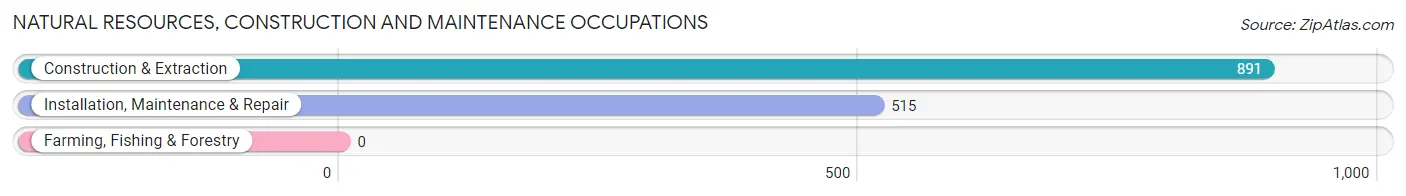
Natural Resources, Construction and Maintenance Occupations
The most common Natural Resources, Construction and Maintenance occupations in Eastpointe are Construction & Extraction (891 | 6.1%), and Installation, Maintenance & Repair (515 | 3.5%).
Natural Resources, Construction and Maintenance Occupations by Sex
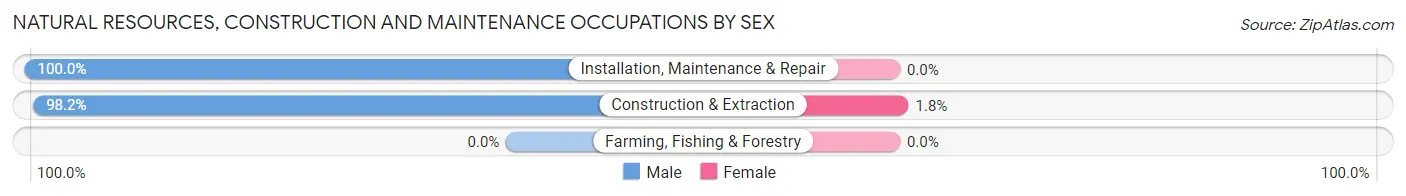
| Occupation | Male | Female |
| Farming, Fishing & Forestry | 0 (0.0%) | 0 (0.0%) |
| Construction & Extraction | 875 (98.2%) | 16 (1.8%) |
| Installation, Maintenance & Repair | 515 (100.0%) | 0 (0.0%) |
| Total (Category) | 1,390 (98.9%) | 16 (1.1%) |
| Total (Overall) | 7,609 (52.1%) | 6,991 (47.9%) |
Production, Transportation and Moving Occupations
The most common Production, Transportation and Moving occupations in Eastpointe are Production (1,797 | 12.3%), Material Moving (728 | 5.0%), and Transportation (674 | 4.6%).
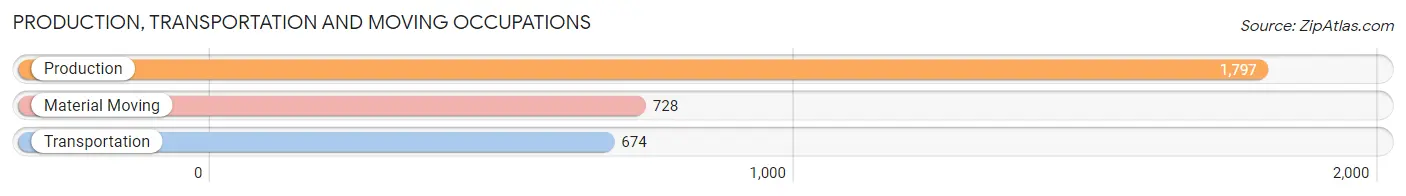
Production, Transportation and Moving Occupations by Sex
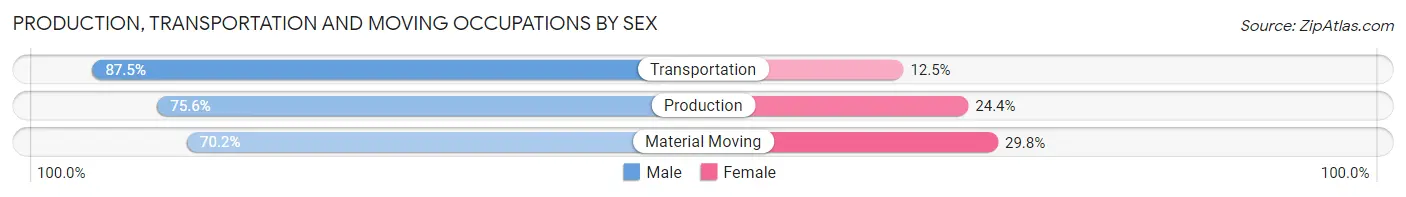
| Occupation | Male | Female |
| Production | 1,359 (75.6%) | 438 (24.4%) |
| Transportation | 590 (87.5%) | 84 (12.5%) |
| Material Moving | 511 (70.2%) | 217 (29.8%) |
| Total (Category) | 2,460 (76.9%) | 739 (23.1%) |
| Total (Overall) | 7,609 (52.1%) | 6,991 (47.9%) |
Employment Industries by Sex in Eastpointe
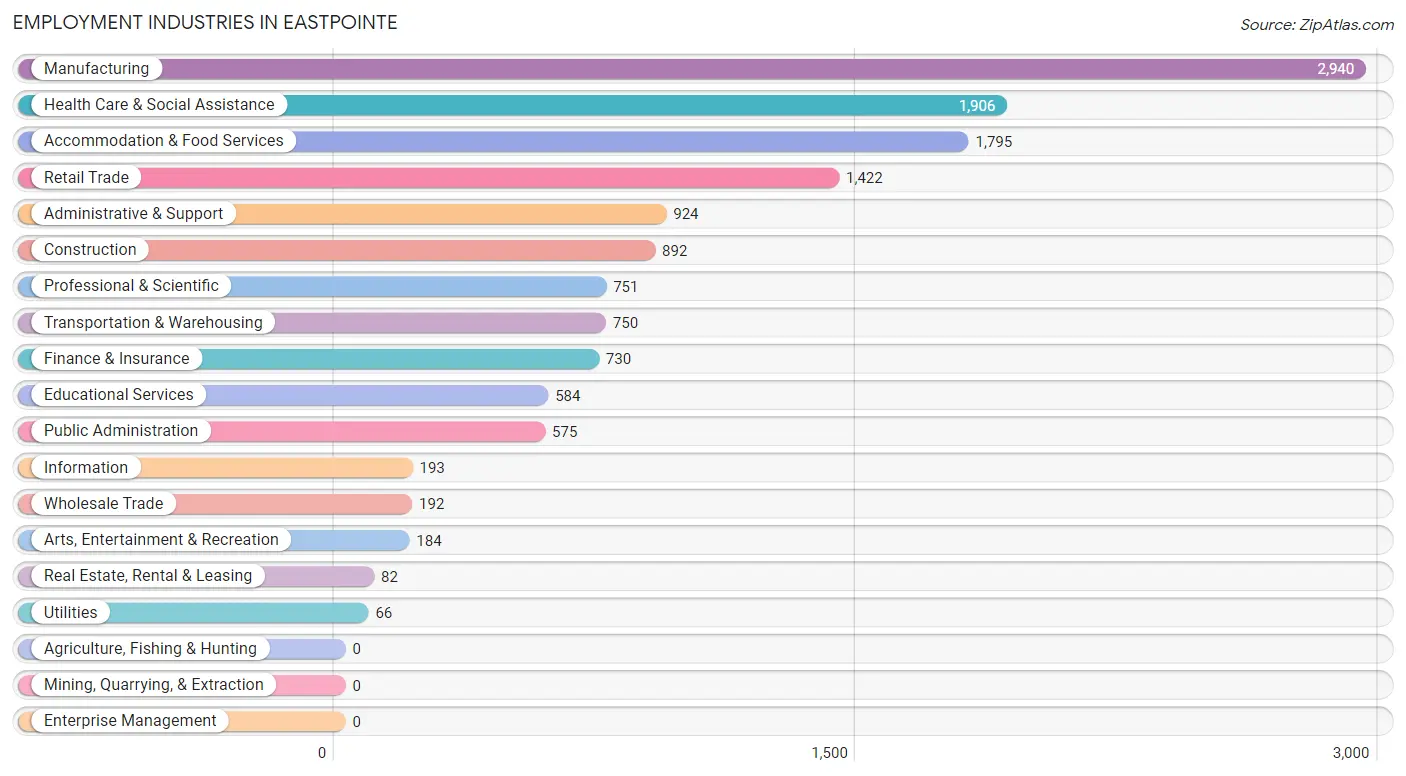
Employment Industries in Eastpointe
The major employment industries in Eastpointe include Manufacturing (2,940 | 20.1%), Health Care & Social Assistance (1,906 | 13.1%), Accommodation & Food Services (1,795 | 12.3%), Retail Trade (1,422 | 9.7%), and Administrative & Support (924 | 6.3%).
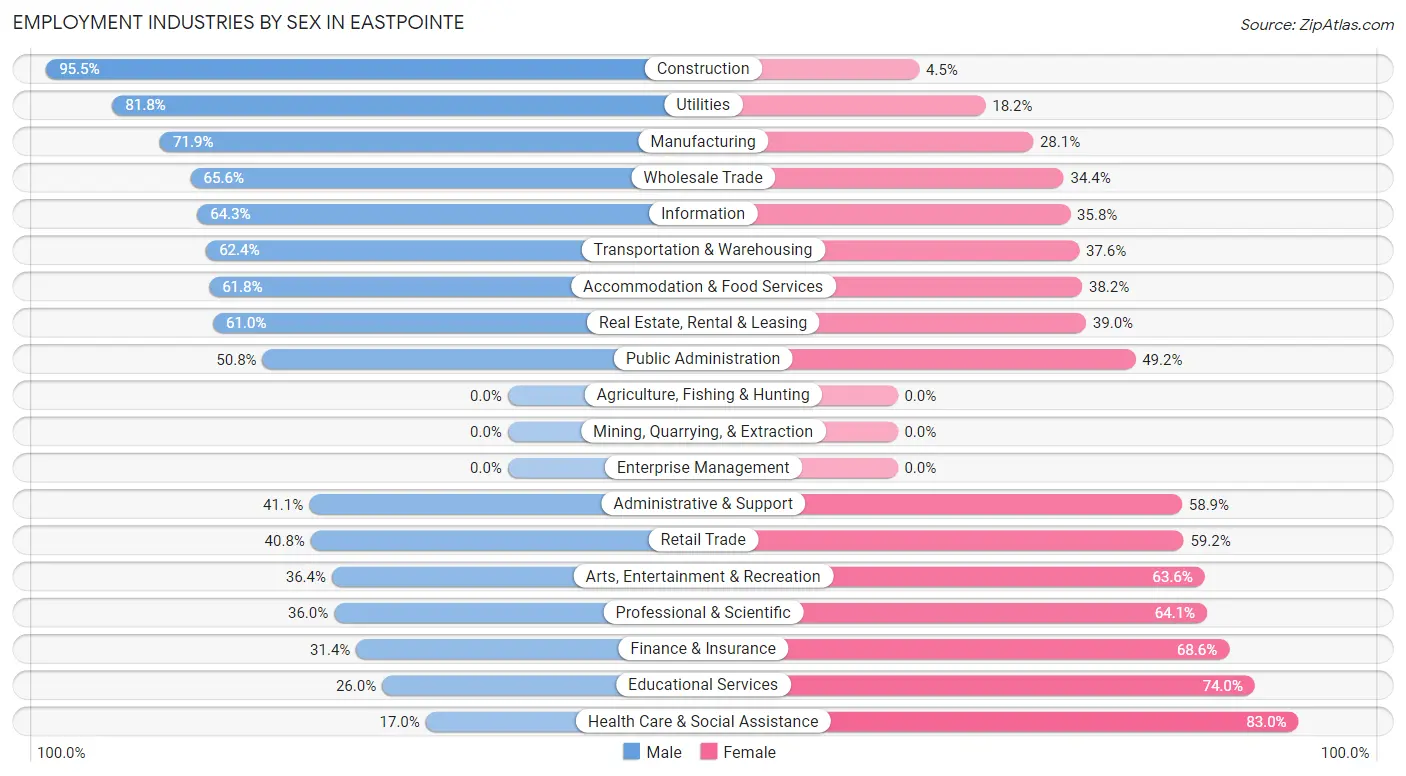
Employment Industries by Sex in Eastpointe
The Eastpointe industries that see more men than women are Construction (95.5%), Utilities (81.8%), and Manufacturing (71.9%), whereas the industries that tend to have a higher number of women are Health Care & Social Assistance (83.0%), Educational Services (74.0%), and Finance & Insurance (68.6%).
| Industry | Male | Female |
| Agriculture, Fishing & Hunting | 0 (0.0%) | 0 (0.0%) |
| Mining, Quarrying, & Extraction | 0 (0.0%) | 0 (0.0%) |
| Construction | 852 (95.5%) | 40 (4.5%) |
| Manufacturing | 2,115 (71.9%) | 825 (28.1%) |
| Wholesale Trade | 126 (65.6%) | 66 (34.4%) |
| Retail Trade | 580 (40.8%) | 842 (59.2%) |
| Transportation & Warehousing | 468 (62.4%) | 282 (37.6%) |
| Utilities | 54 (81.8%) | 12 (18.2%) |
| Information | 124 (64.2%) | 69 (35.7%) |
| Finance & Insurance | 229 (31.4%) | 501 (68.6%) |
| Real Estate, Rental & Leasing | 50 (61.0%) | 32 (39.0%) |
| Professional & Scientific | 270 (35.9%) | 481 (64.0%) |
| Enterprise Management | 0 (0.0%) | 0 (0.0%) |
| Administrative & Support | 380 (41.1%) | 544 (58.9%) |
| Educational Services | 152 (26.0%) | 432 (74.0%) |
| Health Care & Social Assistance | 324 (17.0%) | 1,582 (83.0%) |
| Arts, Entertainment & Recreation | 67 (36.4%) | 117 (63.6%) |
| Accommodation & Food Services | 1,109 (61.8%) | 686 (38.2%) |
| Public Administration | 292 (50.8%) | 283 (49.2%) |
| Total | 7,609 (52.1%) | 6,991 (47.9%) |
Education in Eastpointe
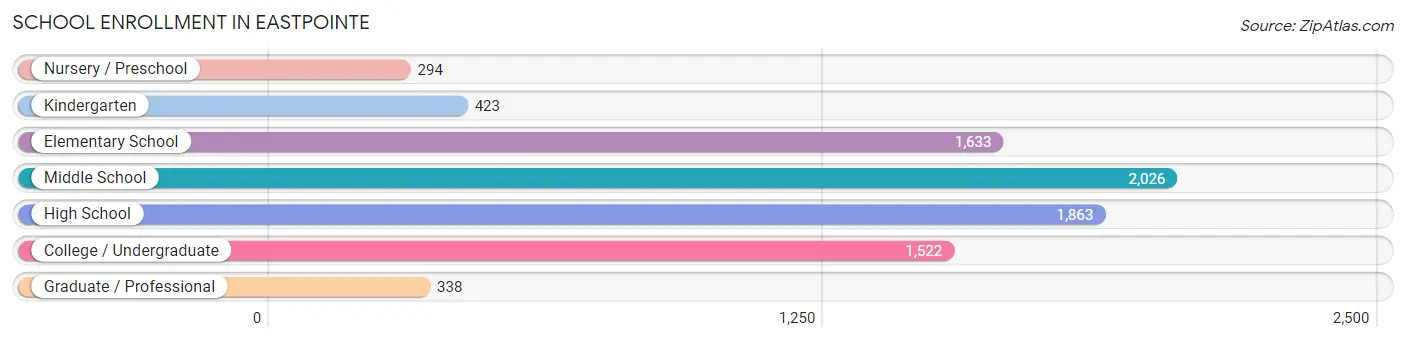
School Enrollment in Eastpointe
The most common levels of schooling among the 8,099 students in Eastpointe are middle school (2,026 | 25.0%), high school (1,863 | 23.0%), and elementary school (1,633 | 20.2%).
| School Level | # Students | % Students |
| Nursery / Preschool | 294 | 3.6% |
| Kindergarten | 423 | 5.2% |
| Elementary School | 1,633 | 20.2% |
| Middle School | 2,026 | 25.0% |
| High School | 1,863 | 23.0% |
| College / Undergraduate | 1,522 | 18.8% |
| Graduate / Professional | 338 | 4.2% |
| Total | 8,099 | 100.0% |
School Enrollment by Age by Funding Source in Eastpointe
Out of a total of 8,099 students who are enrolled in schools in Eastpointe, 786 (9.7%) attend a private institution, while the remaining 7,313 (90.3%) are enrolled in public schools. The age group of 20 to 24 year olds has the highest likelihood of being enrolled in private schools, with 298 (40.6% in the age bracket) enrolled. Conversely, the age group of 18 to 19 year olds has the lowest likelihood of being enrolled in a private school, with 514 (100.0% in the age bracket) attending a public institution.
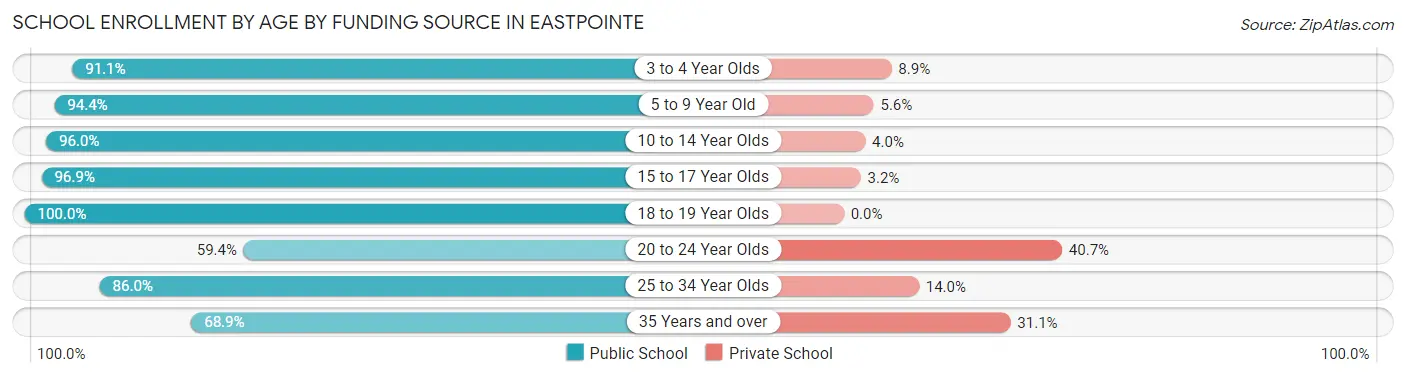
| Age Bracket | Public School | Private School |
| 3 to 4 Year Olds | 205 (91.1%) | 20 (8.9%) |
| 5 to 9 Year Old | 1,751 (94.4%) | 103 (5.6%) |
| 10 to 14 Year Olds | 2,426 (96.0%) | 101 (4.0%) |
| 15 to 17 Year Olds | 1,290 (96.9%) | 42 (3.2%) |
| 18 to 19 Year Olds | 514 (100.0%) | 0 (0.0%) |
| 20 to 24 Year Olds | 435 (59.4%) | 298 (40.6%) |
| 25 to 34 Year Olds | 332 (86.0%) | 54 (14.0%) |
| 35 Years and over | 364 (68.9%) | 164 (31.1%) |
| Total | 7,313 (90.3%) | 786 (9.7%) |
Educational Attainment by Field of Study in Eastpointe
Business (1,113 | 30.5%), science & technology (395 | 10.8%), arts & humanities (364 | 10.0%), education (239 | 6.5%), and psychology (216 | 5.9%) are the most common fields of study among 3,654 individuals in Eastpointe who have obtained a bachelor's degree or higher.
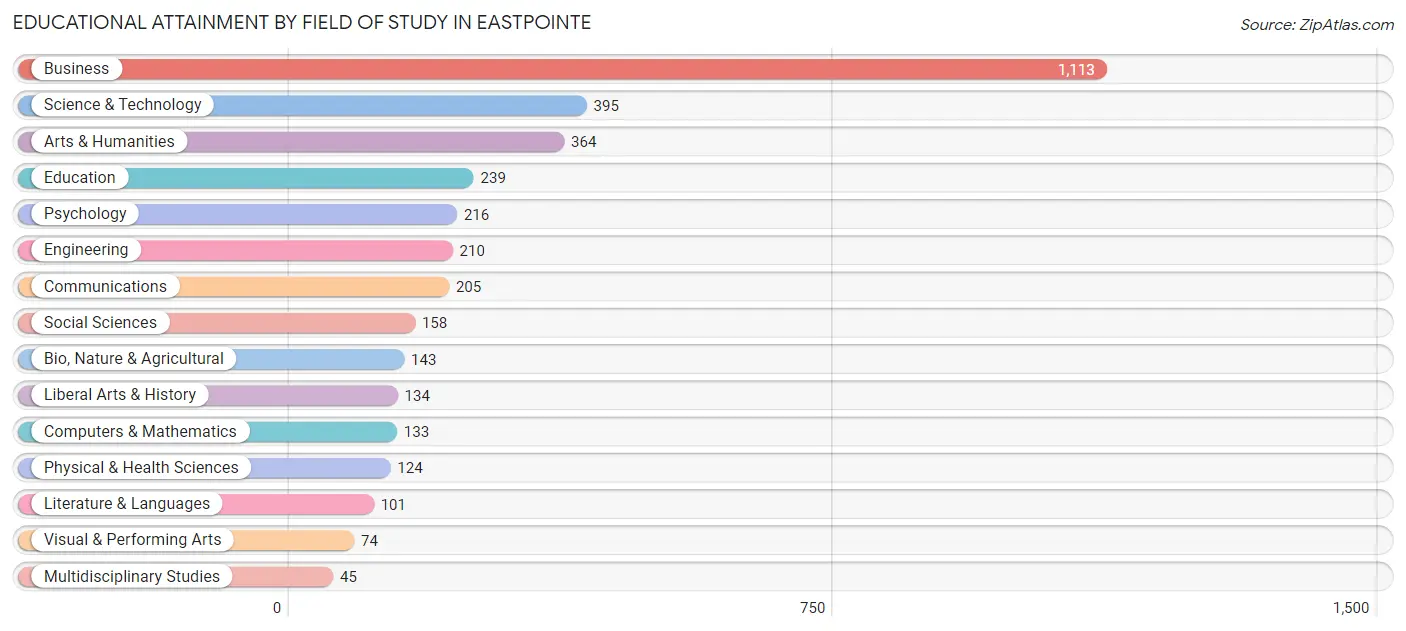
| Field of Study | # Graduates | % Graduates |
| Computers & Mathematics | 133 | 3.6% |
| Bio, Nature & Agricultural | 143 | 3.9% |
| Physical & Health Sciences | 124 | 3.4% |
| Psychology | 216 | 5.9% |
| Social Sciences | 158 | 4.3% |
| Engineering | 210 | 5.8% |
| Multidisciplinary Studies | 45 | 1.2% |
| Science & Technology | 395 | 10.8% |
| Business | 1,113 | 30.5% |
| Education | 239 | 6.5% |
| Literature & Languages | 101 | 2.8% |
| Liberal Arts & History | 134 | 3.7% |
| Visual & Performing Arts | 74 | 2.0% |
| Communications | 205 | 5.6% |
| Arts & Humanities | 364 | 10.0% |
| Total | 3,654 | 100.0% |
Transportation & Commute in Eastpointe
Vehicle Availability by Sex in Eastpointe
The most prevalent vehicle ownership categories in Eastpointe are males with 2 vehicles (3,497, accounting for 47.2%) and females with 2 vehicles (3,348, making up 52.2%).
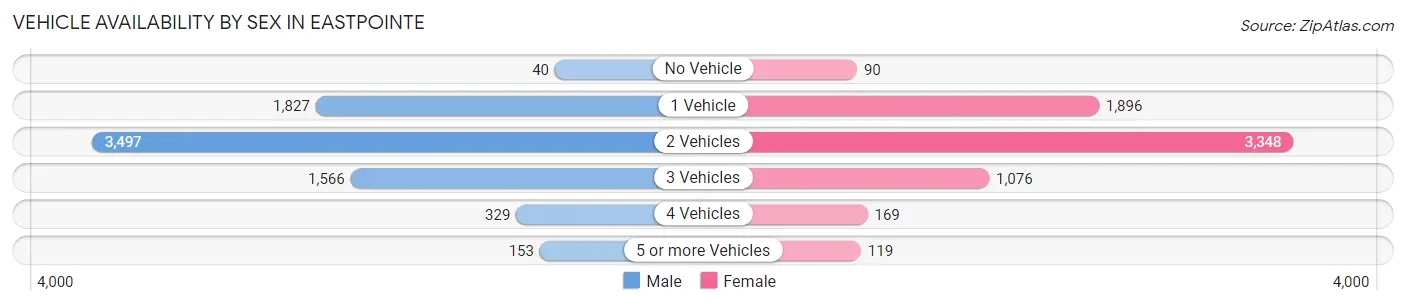
| Vehicles Available | Male | Female |
| No Vehicle | 40 (0.5%) | 90 (1.3%) |
| 1 Vehicle | 1,827 (24.6%) | 1,896 (28.3%) |
| 2 Vehicles | 3,497 (47.2%) | 3,348 (50.0%) |
| 3 Vehicles | 1,566 (21.1%) | 1,076 (16.1%) |
| 4 Vehicles | 329 (4.4%) | 169 (2.5%) |
| 5 or more Vehicles | 153 (2.1%) | 119 (1.8%) |
| Total | 7,412 (100.0%) | 6,698 (100.0%) |
Commute Time in Eastpointe
The most frequently occuring commute durations in Eastpointe are 30 to 34 minutes (2,904 commuters, 22.4%), 20 to 24 minutes (2,262 commuters, 17.4%), and 10 to 14 minutes (1,850 commuters, 14.3%).
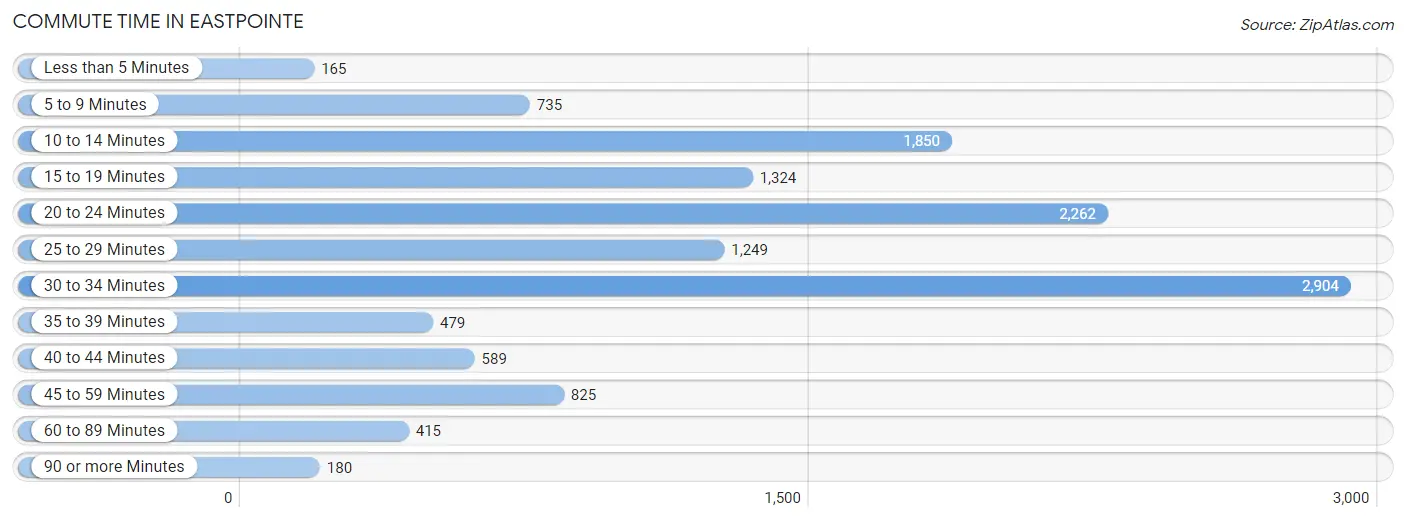
| Commute Time | # Commuters | % Commuters |
| Less than 5 Minutes | 165 | 1.3% |
| 5 to 9 Minutes | 735 | 5.7% |
| 10 to 14 Minutes | 1,850 | 14.3% |
| 15 to 19 Minutes | 1,324 | 10.2% |
| 20 to 24 Minutes | 2,262 | 17.4% |
| 25 to 29 Minutes | 1,249 | 9.6% |
| 30 to 34 Minutes | 2,904 | 22.4% |
| 35 to 39 Minutes | 479 | 3.7% |
| 40 to 44 Minutes | 589 | 4.5% |
| 45 to 59 Minutes | 825 | 6.4% |
| 60 to 89 Minutes | 415 | 3.2% |
| 90 or more Minutes | 180 | 1.4% |
Commute Time by Sex in Eastpointe
The most common commute times in Eastpointe are 30 to 34 minutes (1,673 commuters, 24.1%) for males and 30 to 34 minutes (1,231 commuters, 20.4%) for females.
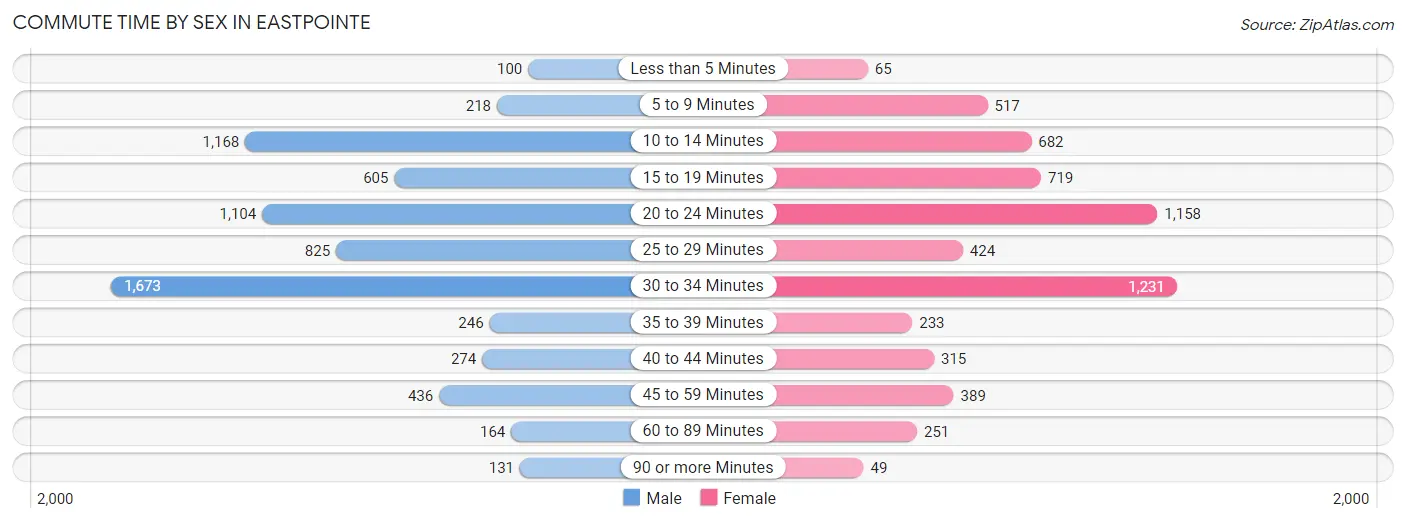
| Commute Time | Male | Female |
| Less than 5 Minutes | 100 (1.4%) | 65 (1.1%) |
| 5 to 9 Minutes | 218 (3.1%) | 517 (8.6%) |
| 10 to 14 Minutes | 1,168 (16.8%) | 682 (11.3%) |
| 15 to 19 Minutes | 605 (8.7%) | 719 (11.9%) |
| 20 to 24 Minutes | 1,104 (15.9%) | 1,158 (19.2%) |
| 25 to 29 Minutes | 825 (11.9%) | 424 (7.0%) |
| 30 to 34 Minutes | 1,673 (24.1%) | 1,231 (20.4%) |
| 35 to 39 Minutes | 246 (3.5%) | 233 (3.9%) |
| 40 to 44 Minutes | 274 (4.0%) | 315 (5.2%) |
| 45 to 59 Minutes | 436 (6.3%) | 389 (6.5%) |
| 60 to 89 Minutes | 164 (2.4%) | 251 (4.2%) |
| 90 or more Minutes | 131 (1.9%) | 49 (0.8%) |
Time of Departure to Work by Sex in Eastpointe
The most frequent times of departure to work in Eastpointe are 4:00 PM to 11:59 PM (1,039, 15.0%) for males and 7:00 AM to 7:29 AM (1,019, 16.9%) for females.
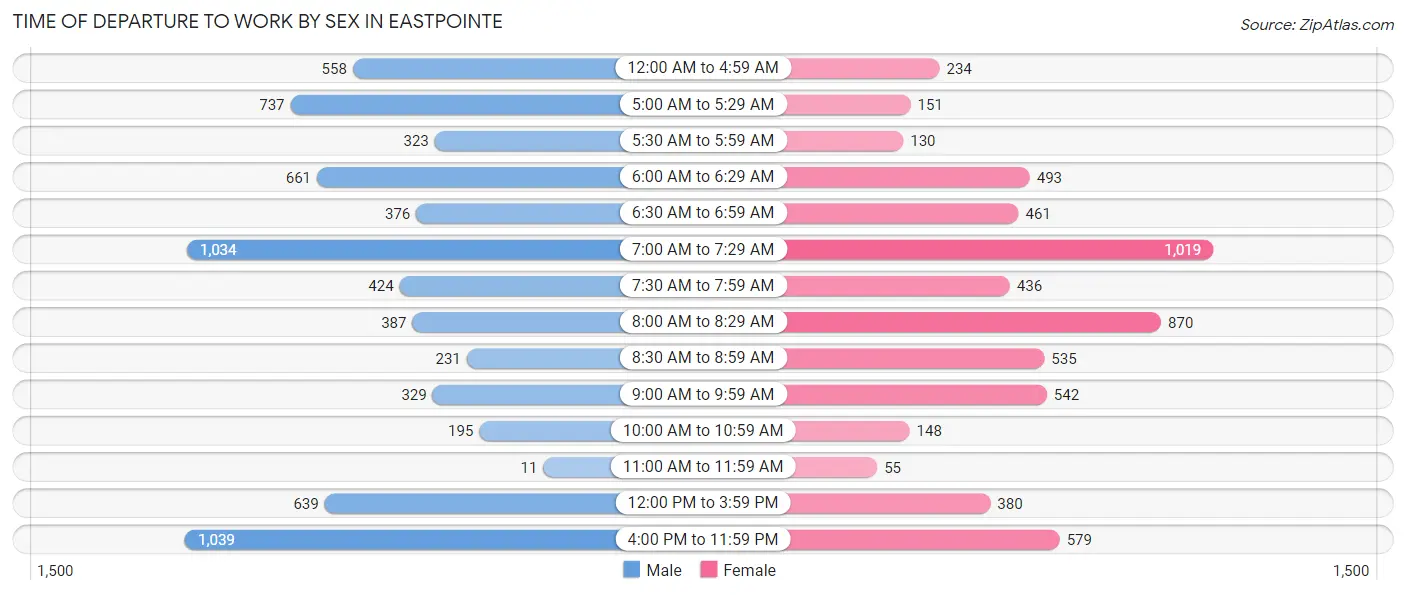
| Time of Departure | Male | Female |
| 12:00 AM to 4:59 AM | 558 (8.0%) | 234 (3.9%) |
| 5:00 AM to 5:29 AM | 737 (10.6%) | 151 (2.5%) |
| 5:30 AM to 5:59 AM | 323 (4.6%) | 130 (2.1%) |
| 6:00 AM to 6:29 AM | 661 (9.5%) | 493 (8.2%) |
| 6:30 AM to 6:59 AM | 376 (5.4%) | 461 (7.6%) |
| 7:00 AM to 7:29 AM | 1,034 (14.9%) | 1,019 (16.9%) |
| 7:30 AM to 7:59 AM | 424 (6.1%) | 436 (7.2%) |
| 8:00 AM to 8:29 AM | 387 (5.6%) | 870 (14.4%) |
| 8:30 AM to 8:59 AM | 231 (3.3%) | 535 (8.9%) |
| 9:00 AM to 9:59 AM | 329 (4.7%) | 542 (9.0%) |
| 10:00 AM to 10:59 AM | 195 (2.8%) | 148 (2.5%) |
| 11:00 AM to 11:59 AM | 11 (0.2%) | 55 (0.9%) |
| 12:00 PM to 3:59 PM | 639 (9.2%) | 380 (6.3%) |
| 4:00 PM to 11:59 PM | 1,039 (15.0%) | 579 (9.6%) |
| Total | 6,944 (100.0%) | 6,033 (100.0%) |
Housing Occupancy in Eastpointe
Occupancy by Ownership in Eastpointe
Of the total 13,232 dwellings in Eastpointe, owner-occupied units account for 9,138 (69.1%), while renter-occupied units make up 4,094 (30.9%).
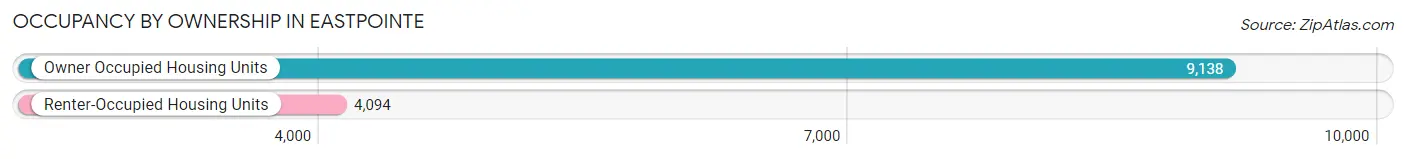
| Occupancy | # Housing Units | % Housing Units |
| Owner Occupied Housing Units | 9,138 | 69.1% |
| Renter-Occupied Housing Units | 4,094 | 30.9% |
| Total Occupied Housing Units | 13,232 | 100.0% |
Occupancy by Household Size in Eastpointe
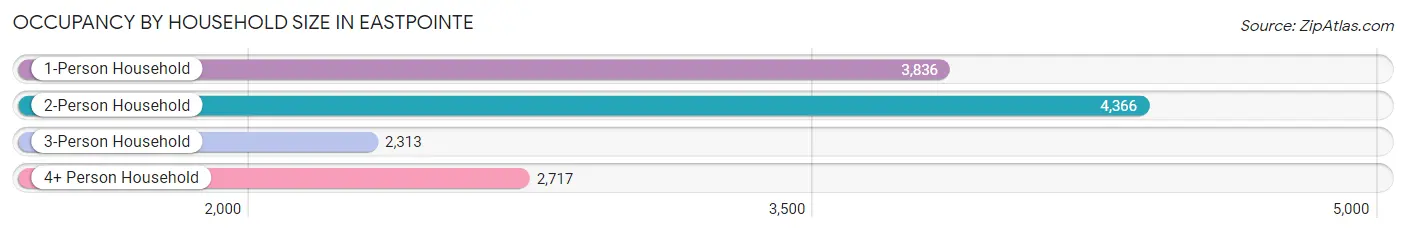
| Household Size | # Housing Units | % Housing Units |
| 1-Person Household | 3,836 | 29.0% |
| 2-Person Household | 4,366 | 33.0% |
| 3-Person Household | 2,313 | 17.5% |
| 4+ Person Household | 2,717 | 20.5% |
| Total Housing Units | 13,232 | 100.0% |
Occupancy by Ownership by Household Size in Eastpointe
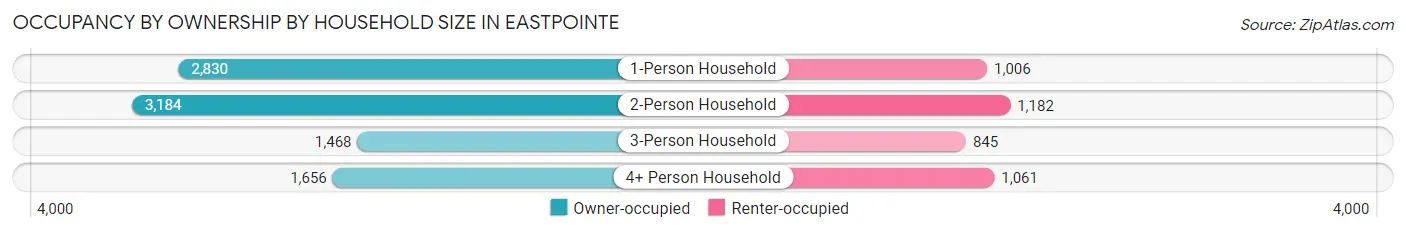
| Household Size | Owner-occupied | Renter-occupied |
| 1-Person Household | 2,830 (73.8%) | 1,006 (26.2%) |
| 2-Person Household | 3,184 (72.9%) | 1,182 (27.1%) |
| 3-Person Household | 1,468 (63.5%) | 845 (36.5%) |
| 4+ Person Household | 1,656 (61.0%) | 1,061 (39.1%) |
| Total Housing Units | 9,138 (69.1%) | 4,094 (30.9%) |
Occupancy by Educational Attainment in Eastpointe
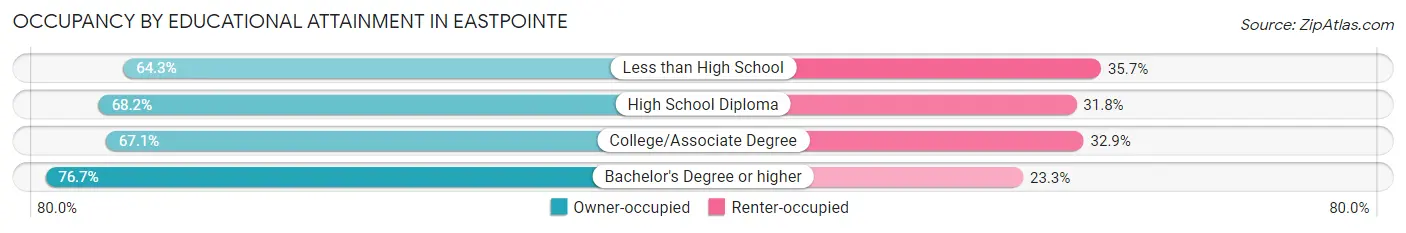
| Household Size | Owner-occupied | Renter-occupied |
| Less than High School | 1,043 (64.3%) | 578 (35.7%) |
| High School Diploma | 2,574 (68.2%) | 1,198 (31.8%) |
| College/Associate Degree | 3,436 (67.1%) | 1,685 (32.9%) |
| Bachelor's Degree or higher | 2,085 (76.7%) | 633 (23.3%) |
Occupancy by Age of Householder in Eastpointe
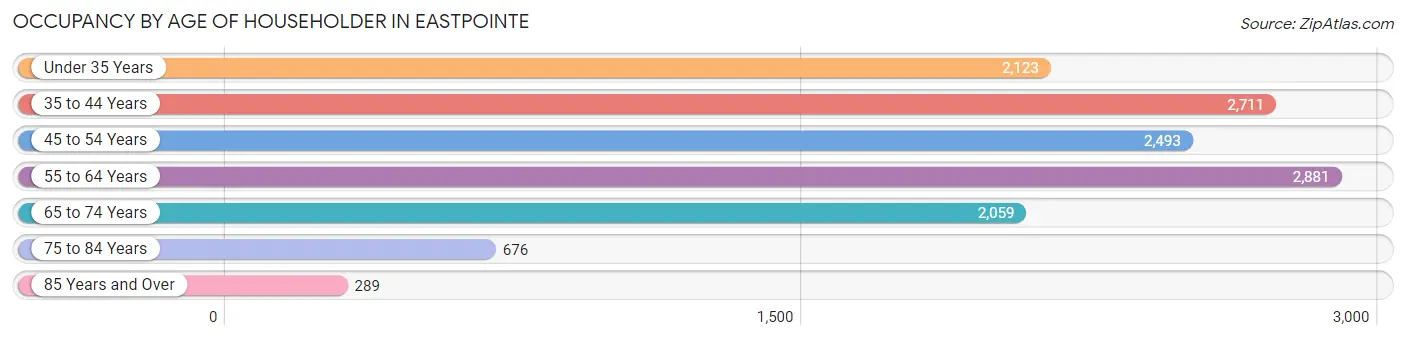
| Age Bracket | # Households | % Households |
| Under 35 Years | 2,123 | 16.0% |
| 35 to 44 Years | 2,711 | 20.5% |
| 45 to 54 Years | 2,493 | 18.8% |
| 55 to 64 Years | 2,881 | 21.8% |
| 65 to 74 Years | 2,059 | 15.6% |
| 75 to 84 Years | 676 | 5.1% |
| 85 Years and Over | 289 | 2.2% |
| Total | 13,232 | 100.0% |
Housing Finances in Eastpointe
Median Income by Occupancy in Eastpointe
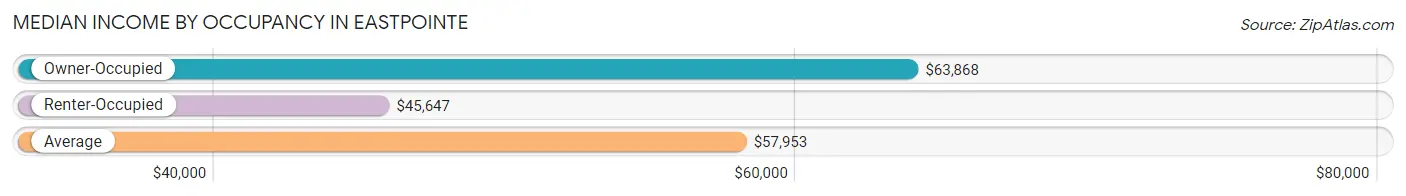
| Occupancy Type | # Households | Median Income |
| Owner-Occupied | 9,138 (69.1%) | $63,868 |
| Renter-Occupied | 4,094 (30.9%) | $45,647 |
| Average | 13,232 (100.0%) | $57,953 |
Occupancy by Householder Income Bracket in Eastpointe
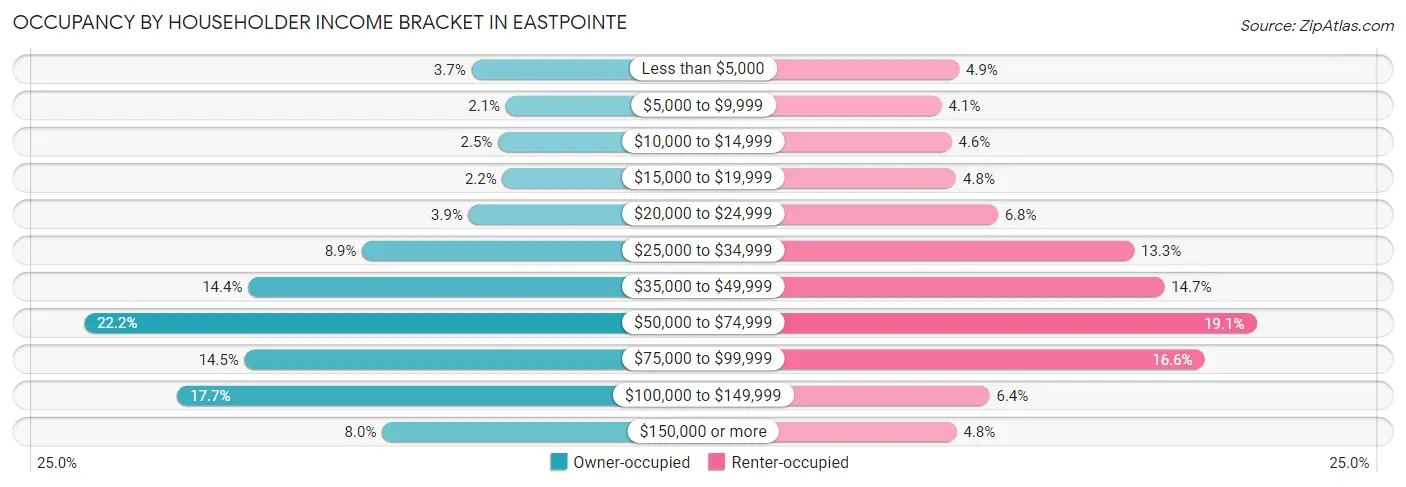
| Income Bracket | Owner-occupied | Renter-occupied |
| Less than $5,000 | 340 (3.7%) | 202 (4.9%) |
| $5,000 to $9,999 | 190 (2.1%) | 168 (4.1%) |
| $10,000 to $14,999 | 224 (2.5%) | 187 (4.6%) |
| $15,000 to $19,999 | 205 (2.2%) | 196 (4.8%) |
| $20,000 to $24,999 | 352 (3.8%) | 277 (6.8%) |
| $25,000 to $34,999 | 815 (8.9%) | 543 (13.3%) |
| $35,000 to $49,999 | 1,311 (14.3%) | 602 (14.7%) |
| $50,000 to $74,999 | 2,026 (22.2%) | 781 (19.1%) |
| $75,000 to $99,999 | 1,327 (14.5%) | 680 (16.6%) |
| $100,000 to $149,999 | 1,620 (17.7%) | 261 (6.4%) |
| $150,000 or more | 728 (8.0%) | 197 (4.8%) |
| Total | 9,138 (100.0%) | 4,094 (100.0%) |
Monthly Housing Cost Tiers in Eastpointe
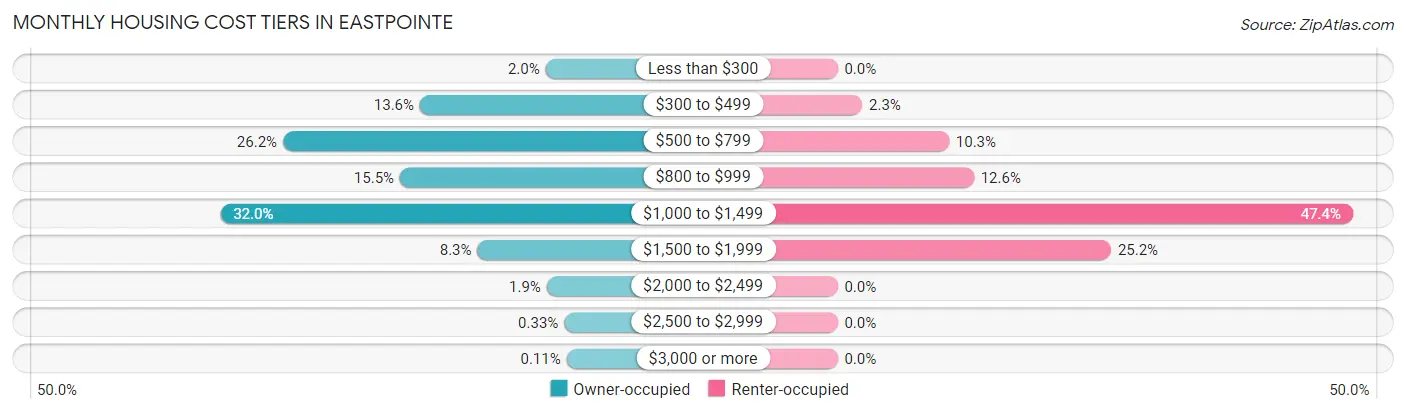
| Monthly Cost | Owner-occupied | Renter-occupied |
| Less than $300 | 186 (2.0%) | 0 (0.0%) |
| $300 to $499 | 1,244 (13.6%) | 93 (2.3%) |
| $500 to $799 | 2,396 (26.2%) | 420 (10.3%) |
| $800 to $999 | 1,412 (15.4%) | 514 (12.6%) |
| $1,000 to $1,499 | 2,923 (32.0%) | 1,942 (47.4%) |
| $1,500 to $1,999 | 760 (8.3%) | 1,031 (25.2%) |
| $2,000 to $2,499 | 177 (1.9%) | 0 (0.0%) |
| $2,500 to $2,999 | 30 (0.3%) | 0 (0.0%) |
| $3,000 or more | 10 (0.1%) | 0 (0.0%) |
| Total | 9,138 (100.0%) | 4,094 (100.0%) |
Physical Housing Characteristics in Eastpointe
Housing Structures in Eastpointe
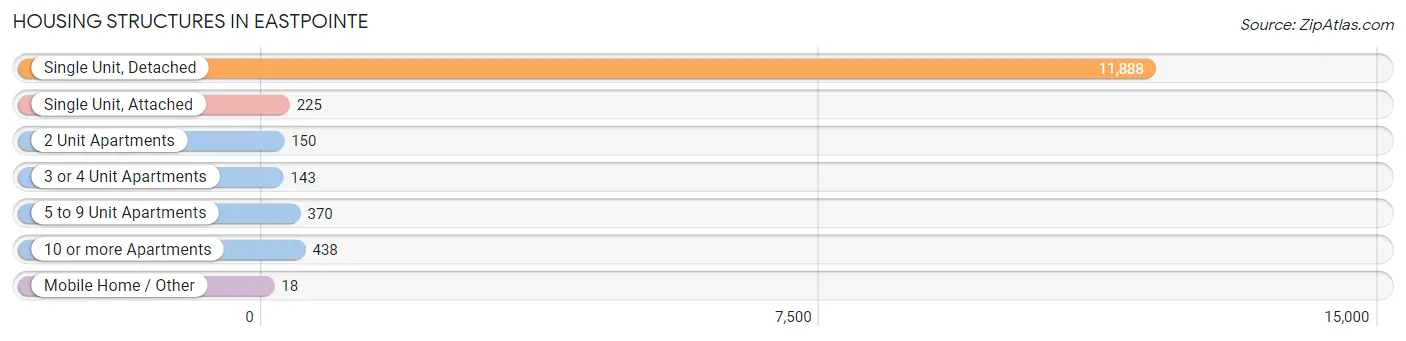
| Structure Type | # Housing Units | % Housing Units |
| Single Unit, Detached | 11,888 | 89.8% |
| Single Unit, Attached | 225 | 1.7% |
| 2 Unit Apartments | 150 | 1.1% |
| 3 or 4 Unit Apartments | 143 | 1.1% |
| 5 to 9 Unit Apartments | 370 | 2.8% |
| 10 or more Apartments | 438 | 3.3% |
| Mobile Home / Other | 18 | 0.1% |
| Total | 13,232 | 100.0% |
Housing Structures by Occupancy in Eastpointe
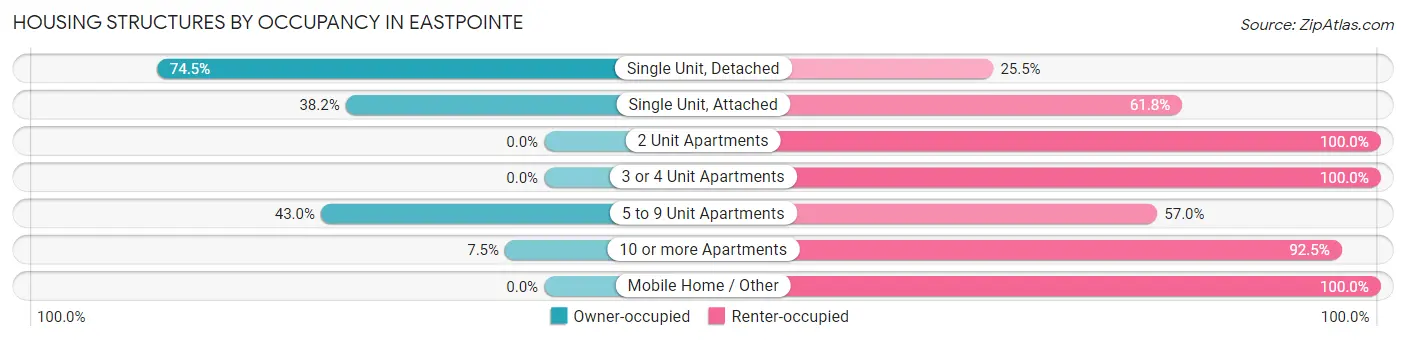
| Structure Type | Owner-occupied | Renter-occupied |
| Single Unit, Detached | 8,860 (74.5%) | 3,028 (25.5%) |
| Single Unit, Attached | 86 (38.2%) | 139 (61.8%) |
| 2 Unit Apartments | 0 (0.0%) | 150 (100.0%) |
| 3 or 4 Unit Apartments | 0 (0.0%) | 143 (100.0%) |
| 5 to 9 Unit Apartments | 159 (43.0%) | 211 (57.0%) |
| 10 or more Apartments | 33 (7.5%) | 405 (92.5%) |
| Mobile Home / Other | 0 (0.0%) | 18 (100.0%) |
| Total | 9,138 (69.1%) | 4,094 (30.9%) |
Housing Structures by Number of Rooms in Eastpointe
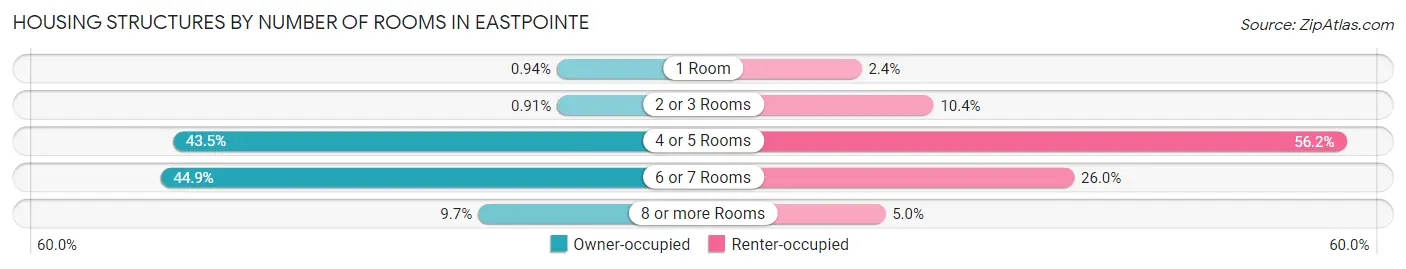
| Number of Rooms | Owner-occupied | Renter-occupied |
| 1 Room | 86 (0.9%) | 98 (2.4%) |
| 2 or 3 Rooms | 83 (0.9%) | 425 (10.4%) |
| 4 or 5 Rooms | 3,979 (43.5%) | 2,301 (56.2%) |
| 6 or 7 Rooms | 4,105 (44.9%) | 1,064 (26.0%) |
| 8 or more Rooms | 885 (9.7%) | 206 (5.0%) |
| Total | 9,138 (100.0%) | 4,094 (100.0%) |
Housing Structure by Heating Type in Eastpointe
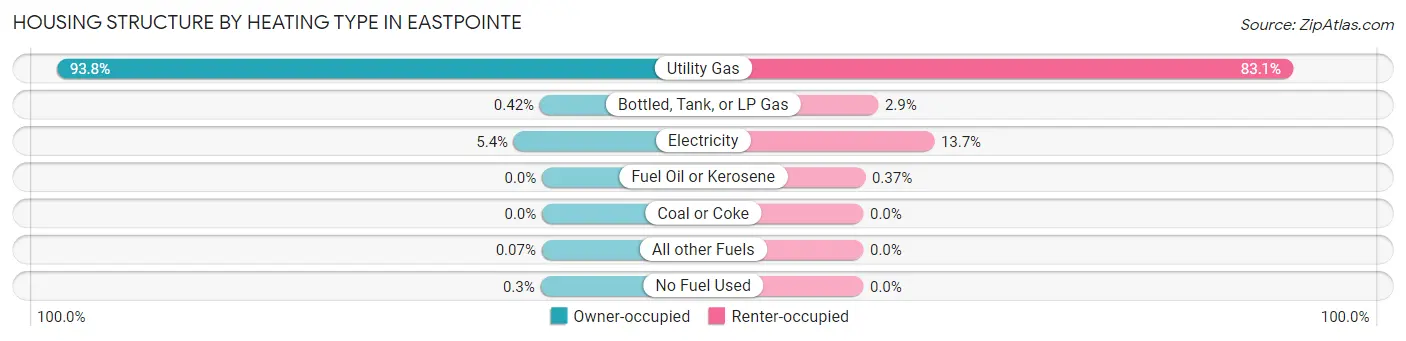
| Heating Type | Owner-occupied | Renter-occupied |
| Utility Gas | 8,570 (93.8%) | 3,400 (83.1%) |
| Bottled, Tank, or LP Gas | 38 (0.4%) | 118 (2.9%) |
| Electricity | 497 (5.4%) | 561 (13.7%) |
| Fuel Oil or Kerosene | 0 (0.0%) | 15 (0.4%) |
| Coal or Coke | 0 (0.0%) | 0 (0.0%) |
| All other Fuels | 6 (0.1%) | 0 (0.0%) |
| No Fuel Used | 27 (0.3%) | 0 (0.0%) |
| Total | 9,138 (100.0%) | 4,094 (100.0%) |
Household Vehicle Usage in Eastpointe
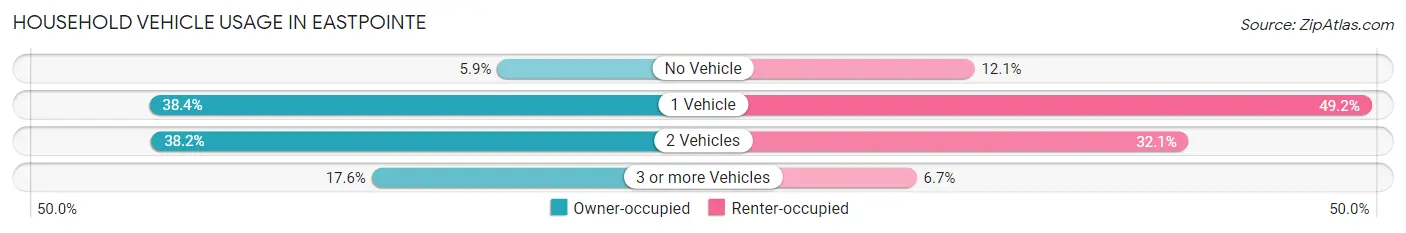
| Vehicles per Household | Owner-occupied | Renter-occupied |
| No Vehicle | 537 (5.9%) | 495 (12.1%) |
| 1 Vehicle | 3,504 (38.4%) | 2,012 (49.1%) |
| 2 Vehicles | 3,489 (38.2%) | 1,313 (32.1%) |
| 3 or more Vehicles | 1,608 (17.6%) | 274 (6.7%) |
| Total | 9,138 (100.0%) | 4,094 (100.0%) |
Real Estate & Mortgages in Eastpointe
Real Estate and Mortgage Overview in Eastpointe
| Characteristic | Without Mortgage | With Mortgage |
| Housing Units | 3,379 | 5,759 |
| Median Property Value | $99,200 | $124,800 |
| Median Household Income | $48,983 | $470 |
| Monthly Housing Costs | $536 | $10 |
| Real Estate Taxes | $2,261 | $112 |
Property Value by Mortgage Status in Eastpointe
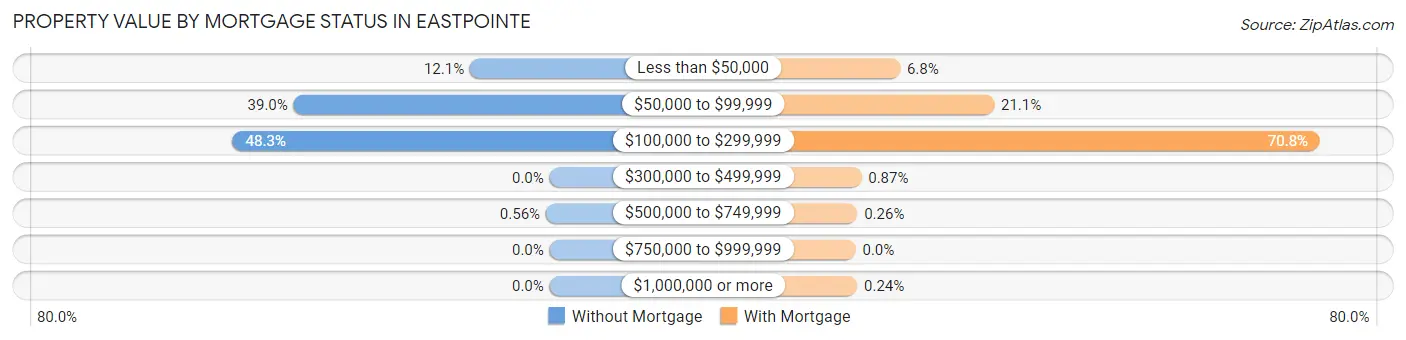
| Property Value | Without Mortgage | With Mortgage |
| Less than $50,000 | 410 (12.1%) | 390 (6.8%) |
| $50,000 to $99,999 | 1,318 (39.0%) | 1,215 (21.1%) |
| $100,000 to $299,999 | 1,632 (48.3%) | 4,075 (70.8%) |
| $300,000 to $499,999 | 0 (0.0%) | 50 (0.9%) |
| $500,000 to $749,999 | 19 (0.6%) | 15 (0.3%) |
| $750,000 to $999,999 | 0 (0.0%) | 0 (0.0%) |
| $1,000,000 or more | 0 (0.0%) | 14 (0.2%) |
| Total | 3,379 (100.0%) | 5,759 (100.0%) |
Household Income by Mortgage Status in Eastpointe
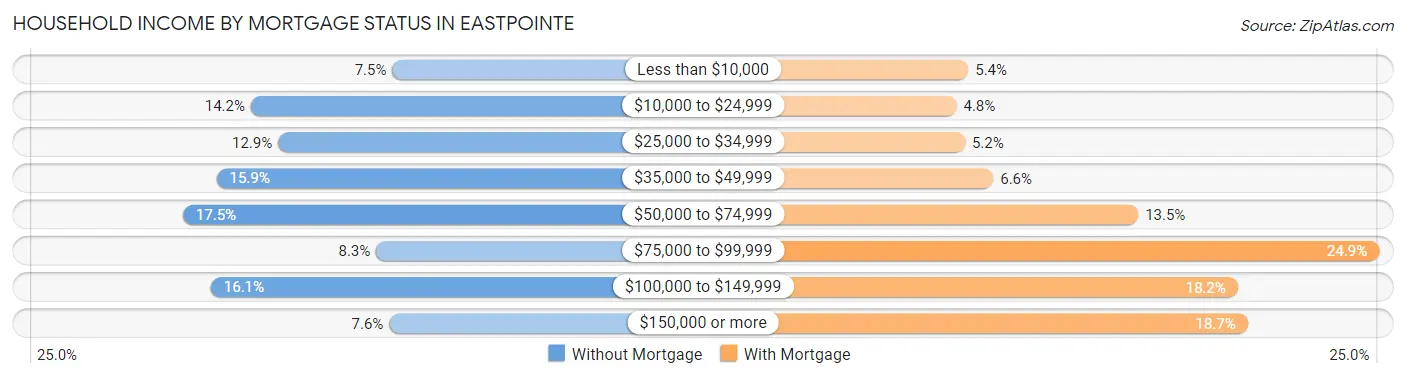
| Household Income | Without Mortgage | With Mortgage |
| Less than $10,000 | 253 (7.5%) | 309 (5.4%) |
| $10,000 to $24,999 | 481 (14.2%) | 277 (4.8%) |
| $25,000 to $34,999 | 437 (12.9%) | 300 (5.2%) |
| $35,000 to $49,999 | 536 (15.9%) | 378 (6.6%) |
| $50,000 to $74,999 | 590 (17.5%) | 775 (13.5%) |
| $75,000 to $99,999 | 279 (8.3%) | 1,436 (24.9%) |
| $100,000 to $149,999 | 545 (16.1%) | 1,048 (18.2%) |
| $150,000 or more | 258 (7.6%) | 1,075 (18.7%) |
| Total | 3,379 (100.0%) | 5,759 (100.0%) |
Property Value to Household Income Ratio in Eastpointe
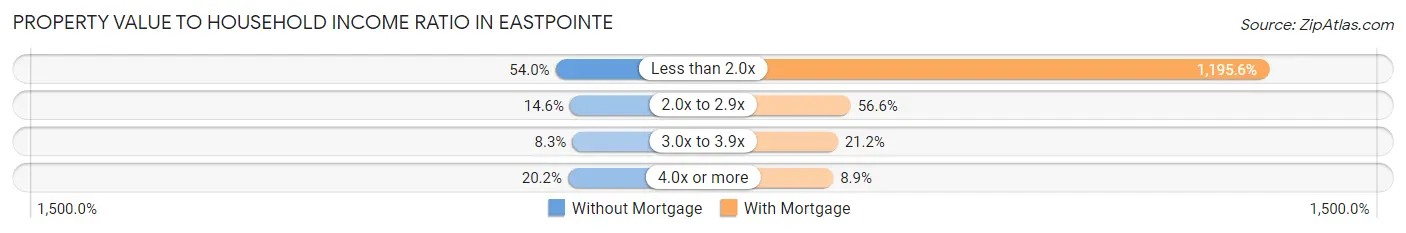
| Value-to-Income Ratio | Without Mortgage | With Mortgage |
| Less than 2.0x | 1,826 (54.0%) | 68,855 (1,195.6%) |
| 2.0x to 2.9x | 494 (14.6%) | 3,262 (56.6%) |
| 3.0x to 3.9x | 280 (8.3%) | 1,218 (21.1%) |
| 4.0x or more | 681 (20.2%) | 513 (8.9%) |
| Total | 3,379 (100.0%) | 5,759 (100.0%) |
Real Estate Taxes by Mortgage Status in Eastpointe
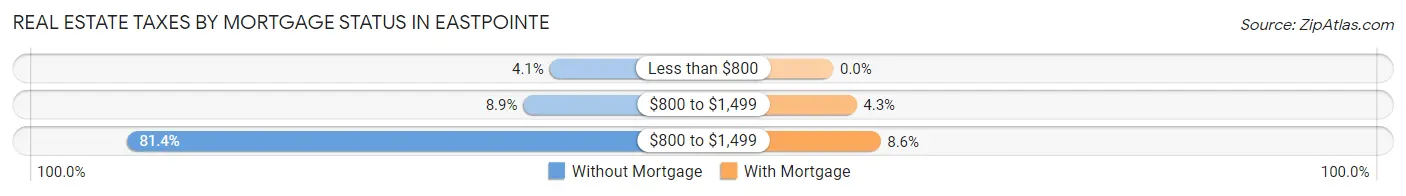
| Property Taxes | Without Mortgage | With Mortgage |
| Less than $800 | 139 (4.1%) | 0 (0.0%) |
| $800 to $1,499 | 301 (8.9%) | 245 (4.3%) |
| $800 to $1,499 | 2,750 (81.4%) | 497 (8.6%) |
| Total | 3,379 (100.0%) | 5,759 (100.0%) |
Health & Disability in Eastpointe
Health Insurance Coverage by Age in Eastpointe
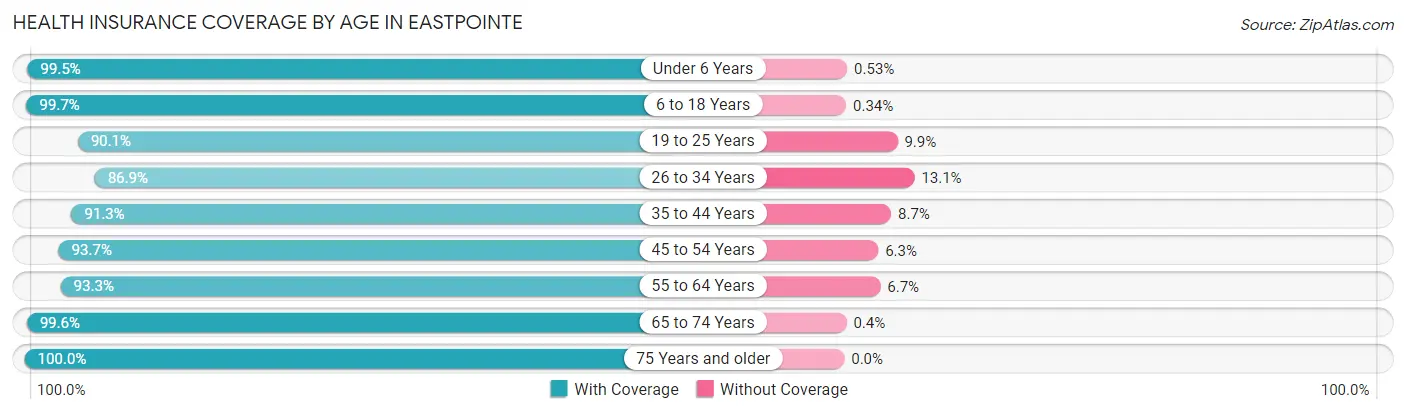
| Age Bracket | With Coverage | Without Coverage |
| Under 6 Years | 2,620 (99.5%) | 14 (0.5%) |
| 6 to 18 Years | 6,076 (99.7%) | 21 (0.3%) |
| 19 to 25 Years | 2,799 (90.1%) | 308 (9.9%) |
| 26 to 34 Years | 3,716 (86.9%) | 559 (13.1%) |
| 35 to 44 Years | 4,411 (91.3%) | 422 (8.7%) |
| 45 to 54 Years | 3,937 (93.7%) | 266 (6.3%) |
| 55 to 64 Years | 4,257 (93.3%) | 307 (6.7%) |
| 65 to 74 Years | 2,954 (99.6%) | 12 (0.4%) |
| 75 Years and older | 1,408 (100.0%) | 0 (0.0%) |
| Total | 32,178 (94.4%) | 1,909 (5.6%) |
Health Insurance Coverage by Citizenship Status in Eastpointe
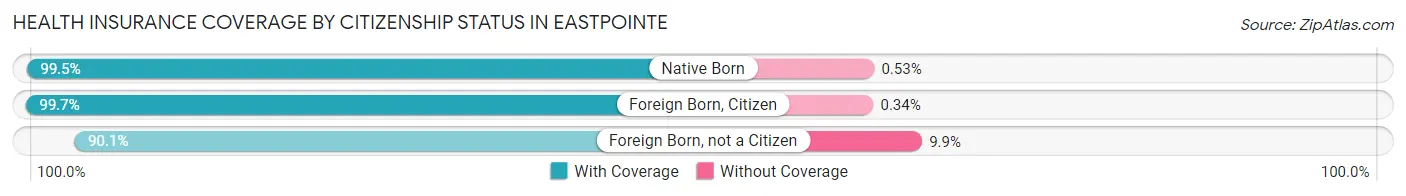
| Citizenship Status | With Coverage | Without Coverage |
| Native Born | 2,620 (99.5%) | 14 (0.5%) |
| Foreign Born, Citizen | 6,076 (99.7%) | 21 (0.3%) |
| Foreign Born, not a Citizen | 2,799 (90.1%) | 308 (9.9%) |
Health Insurance Coverage by Household Income in Eastpointe
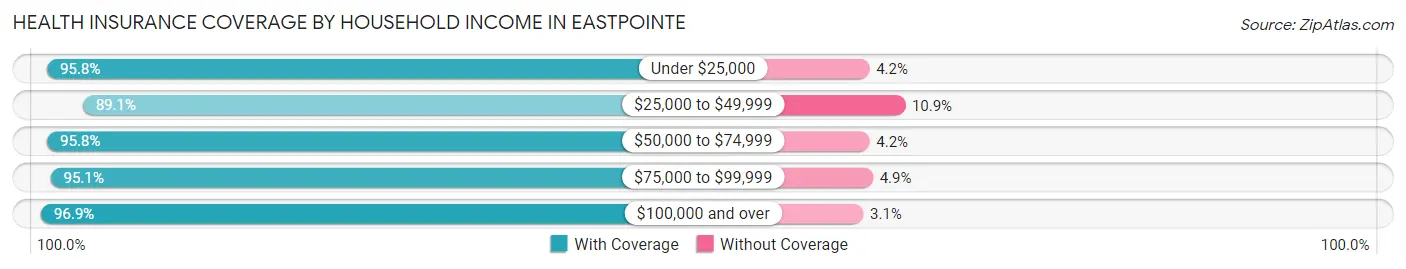
| Household Income | With Coverage | Without Coverage |
| Under $25,000 | 4,335 (95.8%) | 190 (4.2%) |
| $25,000 to $49,999 | 6,964 (89.1%) | 851 (10.9%) |
| $50,000 to $74,999 | 6,558 (95.8%) | 290 (4.2%) |
| $75,000 to $99,999 | 5,636 (95.1%) | 288 (4.9%) |
| $100,000 and over | 8,598 (96.9%) | 271 (3.1%) |
Public vs Private Health Insurance Coverage by Age in Eastpointe
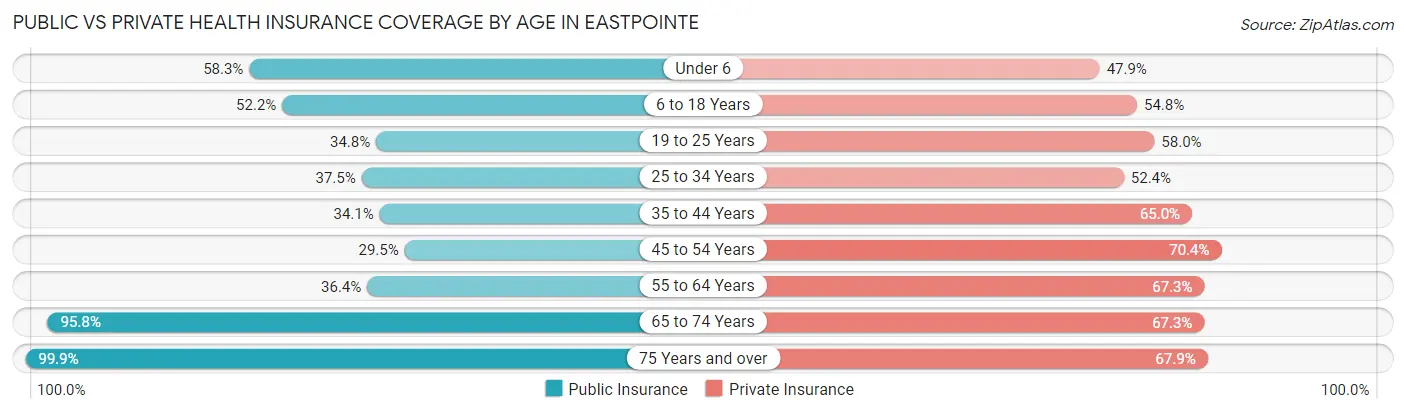
| Age Bracket | Public Insurance | Private Insurance |
| Under 6 | 1,536 (58.3%) | 1,261 (47.9%) |
| 6 to 18 Years | 3,182 (52.2%) | 3,341 (54.8%) |
| 19 to 25 Years | 1,080 (34.8%) | 1,803 (58.0%) |
| 25 to 34 Years | 1,601 (37.4%) | 2,238 (52.3%) |
| 35 to 44 Years | 1,649 (34.1%) | 3,141 (65.0%) |
| 45 to 54 Years | 1,239 (29.5%) | 2,960 (70.4%) |
| 55 to 64 Years | 1,662 (36.4%) | 3,071 (67.3%) |
| 65 to 74 Years | 2,840 (95.8%) | 1,995 (67.3%) |
| 75 Years and over | 1,406 (99.9%) | 956 (67.9%) |
| Total | 16,195 (47.5%) | 20,766 (60.9%) |
Disability Status by Sex by Age in Eastpointe
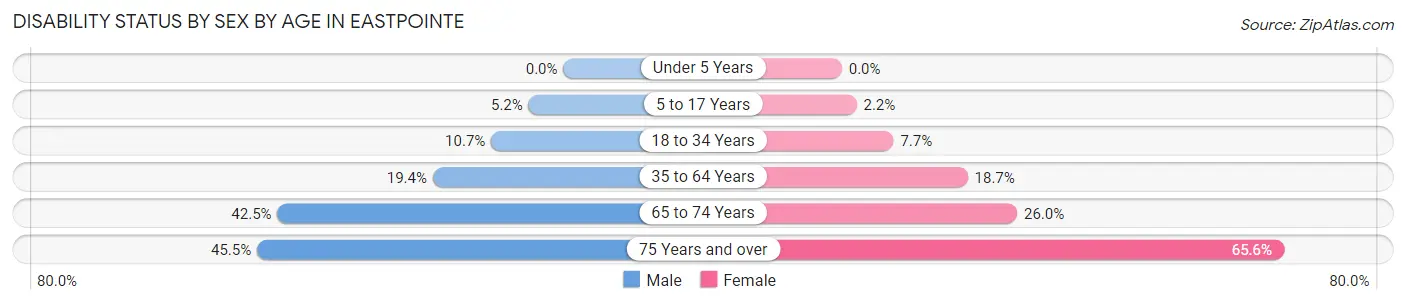
| Age Bracket | Male | Female |
| Under 5 Years | 0 (0.0%) | 0 (0.0%) |
| 5 to 17 Years | 177 (5.2%) | 58 (2.2%) |
| 18 to 34 Years | 435 (10.7%) | 291 (7.7%) |
| 35 to 64 Years | 1,244 (19.4%) | 1,341 (18.7%) |
| 65 to 74 Years | 538 (42.5%) | 442 (26.0%) |
| 75 Years and over | 217 (45.5%) | 611 (65.6%) |
Disability Class by Sex by Age in Eastpointe
Disability Class: Hearing Difficulty
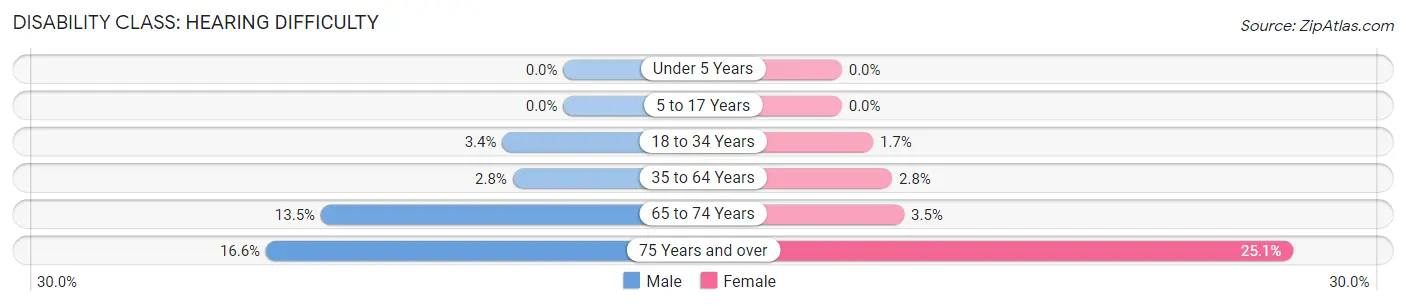
| Age Bracket | Male | Female |
| Under 5 Years | 0 (0.0%) | 0 (0.0%) |
| 5 to 17 Years | 0 (0.0%) | 0 (0.0%) |
| 18 to 34 Years | 138 (3.4%) | 66 (1.7%) |
| 35 to 64 Years | 181 (2.8%) | 201 (2.8%) |
| 65 to 74 Years | 171 (13.5%) | 59 (3.5%) |
| 75 Years and over | 79 (16.6%) | 234 (25.1%) |
Disability Class: Vision Difficulty
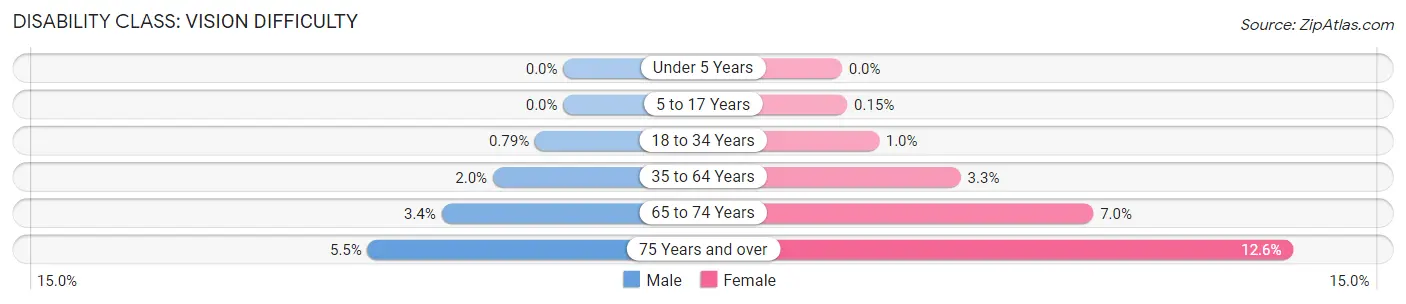
| Age Bracket | Male | Female |
| Under 5 Years | 0 (0.0%) | 0 (0.0%) |
| 5 to 17 Years | 0 (0.0%) | 4 (0.2%) |
| 18 to 34 Years | 32 (0.8%) | 39 (1.0%) |
| 35 to 64 Years | 126 (2.0%) | 238 (3.3%) |
| 65 to 74 Years | 43 (3.4%) | 119 (7.0%) |
| 75 Years and over | 26 (5.4%) | 117 (12.6%) |
Disability Class: Cognitive Difficulty
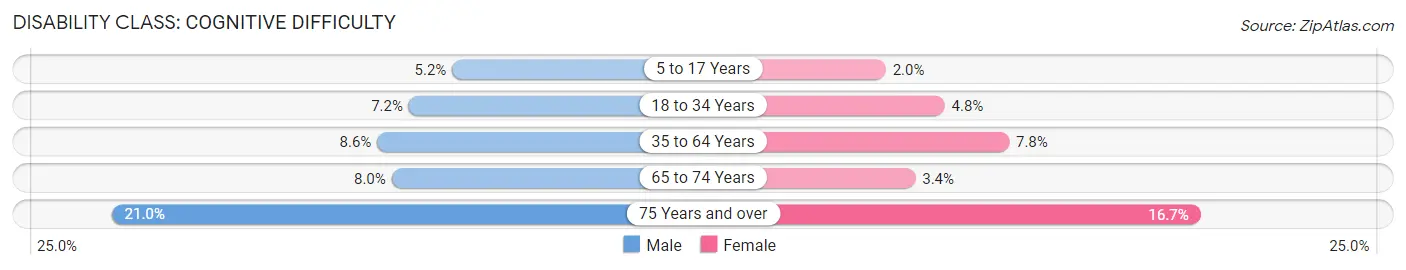
| Age Bracket | Male | Female |
| 5 to 17 Years | 177 (5.2%) | 54 (2.0%) |
| 18 to 34 Years | 291 (7.2%) | 181 (4.8%) |
| 35 to 64 Years | 555 (8.6%) | 557 (7.8%) |
| 65 to 74 Years | 101 (8.0%) | 58 (3.4%) |
| 75 Years and over | 100 (21.0%) | 155 (16.7%) |
Disability Class: Ambulatory Difficulty
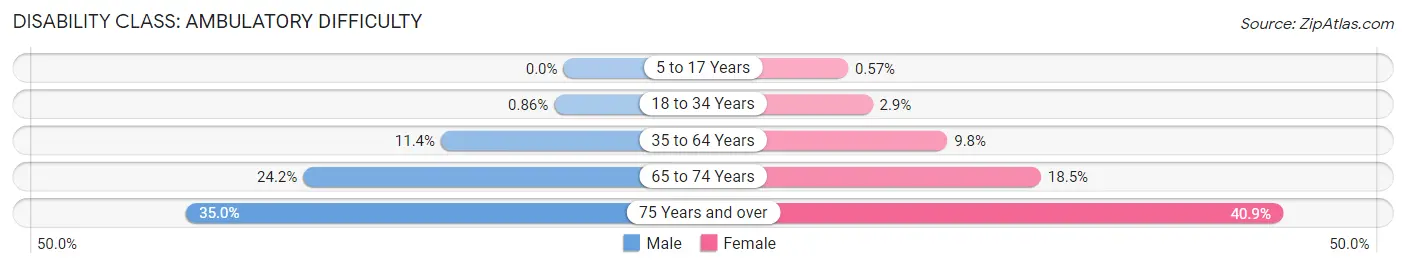
| Age Bracket | Male | Female |
| 5 to 17 Years | 0 (0.0%) | 15 (0.6%) |
| 18 to 34 Years | 35 (0.9%) | 108 (2.9%) |
| 35 to 64 Years | 730 (11.4%) | 703 (9.8%) |
| 65 to 74 Years | 306 (24.1%) | 314 (18.5%) |
| 75 Years and over | 167 (35.0%) | 381 (40.9%) |
Disability Class: Self-Care Difficulty
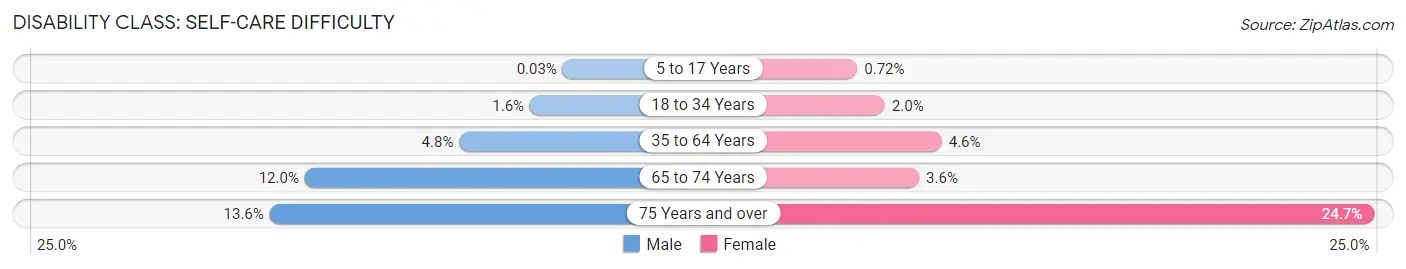
| Age Bracket | Male | Female |
| 5 to 17 Years | 1 (0.0%) | 19 (0.7%) |
| 18 to 34 Years | 63 (1.5%) | 76 (2.0%) |
| 35 to 64 Years | 310 (4.8%) | 333 (4.6%) |
| 65 to 74 Years | 152 (12.0%) | 61 (3.6%) |
| 75 Years and over | 65 (13.6%) | 230 (24.7%) |
Technology Access in Eastpointe
Computing Device Access in Eastpointe
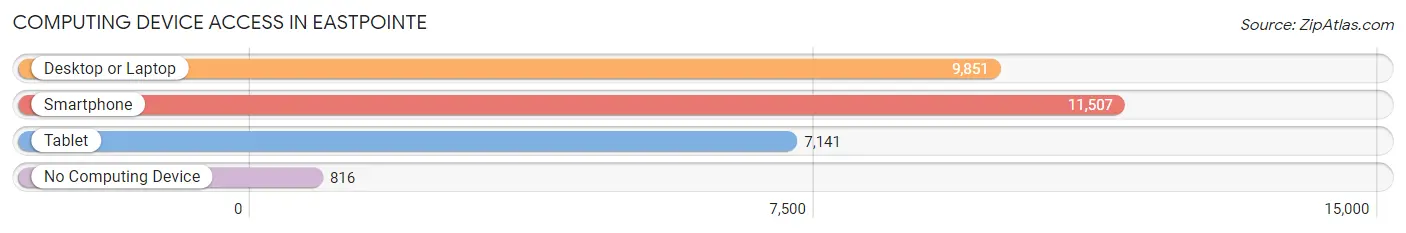
| Device Type | # Households | % Households |
| Desktop or Laptop | 9,851 | 74.5% |
| Smartphone | 11,507 | 87.0% |
| Tablet | 7,141 | 54.0% |
| No Computing Device | 816 | 6.2% |
| Total | 13,232 | 100.0% |
Internet Access in Eastpointe
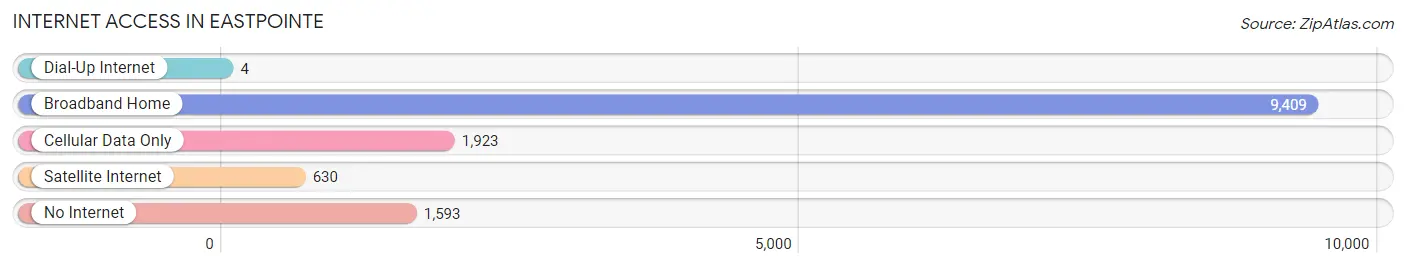
| Internet Type | # Households | % Households |
| Dial-Up Internet | 4 | 0.0% |
| Broadband Home | 9,409 | 71.1% |
| Cellular Data Only | 1,923 | 14.5% |
| Satellite Internet | 630 | 4.8% |
| No Internet | 1,593 | 12.0% |
| Total | 13,232 | 100.0% |
Eastpointe Summary
Eastpointe, Michigan is a city located in Macomb County, Michigan. It is a suburb of Detroit and is part of the Metro Detroit area. The city was originally known as Halfway, as it was located halfway between the cities of Detroit and Mount Clemens. The city was incorporated in 1992 and changed its name to Eastpointe in 1997.
History
The area that is now Eastpointe was originally inhabited by the Potawatomi Native American tribe. The first European settlers arrived in the area in the early 1800s. The area was originally known as Halfway, as it was located halfway between the cities of Detroit and Mount Clemens. The area was primarily agricultural until the late 19th century, when it began to develop into a residential area.
In 1894, the area was incorporated as the village of Halfway. The village was annexed by the city of East Detroit in 1897. In 1924, the village was reincorporated as the city of East Detroit. The city was renamed Eastpointe in 1997.
Geography
Eastpointe is located in Macomb County, Michigan. It is situated on the east side of the Detroit River, approximately 15 miles northeast of downtown Detroit. The city covers an area of 4.3 square miles and has a population of 32,442, according to the 2010 census.
The city is bordered by the cities of Roseville to the north, St. Clair Shores to the east, and Warren to the south. The city is also bordered by the Detroit River to the west.
Economy
The economy of Eastpointe is largely based on the automotive industry. The city is home to several automotive suppliers, including Lear Corporation, Magna International, and TRW Automotive. The city is also home to several retail stores, including Walmart, Target, and Meijer.
The city is also home to several manufacturing companies, including Eastpointe Manufacturing, Eastpointe Plastics, and Eastpointe Tool & Die. The city is also home to several medical facilities, including St. John Macomb-Oakland Hospital and Beaumont Hospital.
Demographics
As of the 2010 census, the population of Eastpointe was 32,442. The racial makeup of the city was 79.2% White, 15.3% African American, 0.5% Native American, 1.2% Asian, 0.1% Pacific Islander, 1.2% from other races, and 2.5% from two or more races. Hispanic or Latino of any race were 3.7% of the population.
The median household income in Eastpointe was $45,945, and the median family income was $54,945. The per capita income for the city was $21,945. About 11.2% of the population was below the poverty line.
Common Questions
What is Per Capita Income in Eastpointe?
Per Capita income in Eastpointe is $27,019.
What is the Median Family Income in Eastpointe?
Median Family Income in Eastpointe is $63,174.
What is the Median Household income in Eastpointe?
Median Household Income in Eastpointe is $57,953.
What is Income or Wage Gap in Eastpointe?
Income or Wage Gap in Eastpointe is 19.8%.
Women in Eastpointe earn 80.2 cents for every dollar earned by a man.
What is Family Income Deficit in Eastpointe?
Family Income Deficit in Eastpointe is $10,613.
Families that are below poverty line in Eastpointe earn $10,613 less on average than the poverty threshold level.
What is Inequality or Gini Index in Eastpointe?
Inequality or Gini Index in Eastpointe is 0.39.
What is the Total Population of Eastpointe?
Total Population of Eastpointe is 34,087.
What is the Total Male Population of Eastpointe?
Total Male Population of Eastpointe is 16,630.
What is the Total Female Population of Eastpointe?
Total Female Population of Eastpointe is 17,457.
What is the Ratio of Males per 100 Females in Eastpointe?
There are 95.26 Males per 100 Females in Eastpointe.
What is the Ratio of Females per 100 Males in Eastpointe?
There are 104.97 Females per 100 Males in Eastpointe.
What is the Median Population Age in Eastpointe?
Median Population Age in Eastpointe is 36.4 Years.
What is the Average Family Size in Eastpointe
Average Family Size in Eastpointe is 3.2 People.
What is the Average Household Size in Eastpointe
Average Household Size in Eastpointe is 2.6 People.
How Large is the Labor Force in Eastpointe?
There are 16,598 People in the Labor Forcein in Eastpointe.
What is the Percentage of People in the Labor Force in Eastpointe?
61.5% of People are in the Labor Force in Eastpointe.
What is the Unemployment Rate in Eastpointe?
Unemployment Rate in Eastpointe is 12.1%.