Allegan, MI Map & Demographics
Allegan Map
Allegan Overview
$23,306
PER CAPITA INCOME
$52,083
AVG FAMILY INCOME
$42,162
AVG HOUSEHOLD INCOME
15.9%
WAGE / INCOME GAP [ % ]
84.1¢/ $1
WAGE / INCOME GAP [ $ ]
0.38
INEQUALITY / GINI INDEX
5,180
TOTAL POPULATION
2,538
MALE POPULATION
2,642
FEMALE POPULATION
96.06
MALES / 100 FEMALES
104.10
FEMALES / 100 MALES
34.1
MEDIAN AGE
3.0
AVG FAMILY SIZE
2.5
AVG HOUSEHOLD SIZE
2,034
LABOR FORCE [ PEOPLE ]
49.0%
PERCENT IN LABOR FORCE
2.7%
UNEMPLOYMENT RATE
Allegan Zip Codes
Allegan Area Codes
Income in Allegan
Income Overview in Allegan
Per Capita Income in Allegan is $23,306, while median incomes of families and households are $52,083 and $42,162 respectively.
| Characteristic | Number | Measure |
| Per Capita Income | 5,180 | $23,306 |
| Median Family Income | 1,314 | $52,083 |
| Mean Family Income | 1,314 | $57,778 |
| Median Household Income | 1,968 | $42,162 |
| Mean Household Income | 1,968 | $57,820 |
| Income Deficit | 1,314 | $0 |
| Wage / Income Gap (%) | 5,180 | 15.92% |
| Wage / Income Gap ($) | 5,180 | 84.08¢ per $1 |
| Gini / Inequality Index | 5,180 | 0.38 |
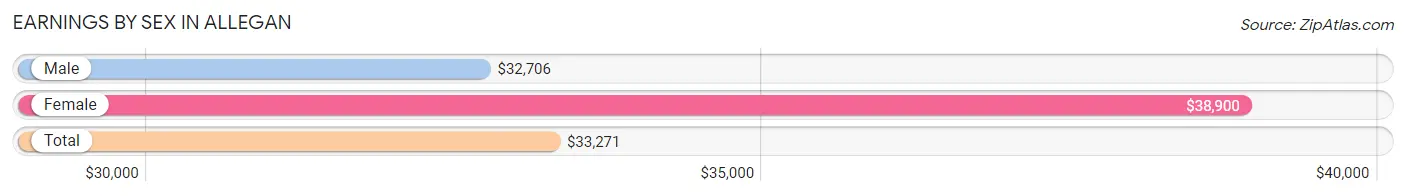
Earnings by Sex in Allegan
Average Earnings in Allegan are $33,271, $32,706 for men and $38,900 for women, a difference of 15.9%.
| Sex | Number | Average Earnings |
| Male | 1,377 (56.2%) | $32,706 |
| Female | 1,072 (43.8%) | $38,900 |
| Total | 2,449 (100.0%) | $33,271 |
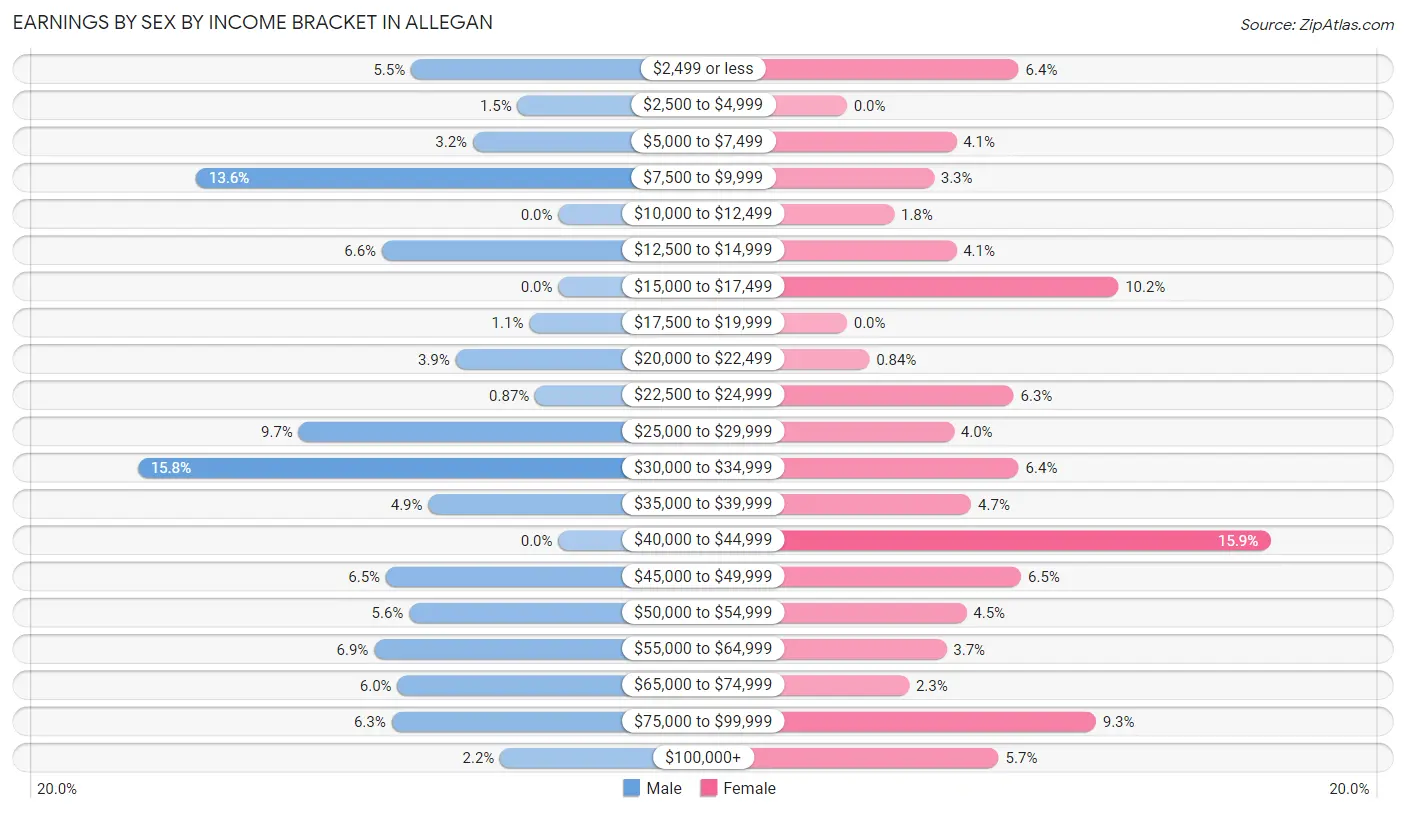
Earnings by Sex by Income Bracket in Allegan
The most common earnings brackets in Allegan are $30,000 to $34,999 for men (217 | 15.8%) and $40,000 to $44,999 for women (170 | 15.9%).
| Income | Male | Female |
| $2,499 or less | 76 (5.5%) | 69 (6.4%) |
| $2,500 to $4,999 | 21 (1.5%) | 0 (0.0%) |
| $5,000 to $7,499 | 44 (3.2%) | 44 (4.1%) |
| $7,500 to $9,999 | 187 (13.6%) | 35 (3.3%) |
| $10,000 to $12,499 | 0 (0.0%) | 19 (1.8%) |
| $12,500 to $14,999 | 91 (6.6%) | 44 (4.1%) |
| $15,000 to $17,499 | 0 (0.0%) | 109 (10.2%) |
| $17,500 to $19,999 | 15 (1.1%) | 0 (0.0%) |
| $20,000 to $22,499 | 53 (3.8%) | 9 (0.8%) |
| $22,500 to $24,999 | 12 (0.9%) | 67 (6.2%) |
| $25,000 to $29,999 | 134 (9.7%) | 43 (4.0%) |
| $30,000 to $34,999 | 217 (15.8%) | 69 (6.4%) |
| $35,000 to $39,999 | 67 (4.9%) | 50 (4.7%) |
| $40,000 to $44,999 | 0 (0.0%) | 170 (15.9%) |
| $45,000 to $49,999 | 89 (6.5%) | 70 (6.5%) |
| $50,000 to $54,999 | 77 (5.6%) | 48 (4.5%) |
| $55,000 to $64,999 | 95 (6.9%) | 40 (3.7%) |
| $65,000 to $74,999 | 83 (6.0%) | 25 (2.3%) |
| $75,000 to $99,999 | 86 (6.2%) | 100 (9.3%) |
| $100,000+ | 30 (2.2%) | 61 (5.7%) |
| Total | 1,377 (100.0%) | 1,072 (100.0%) |
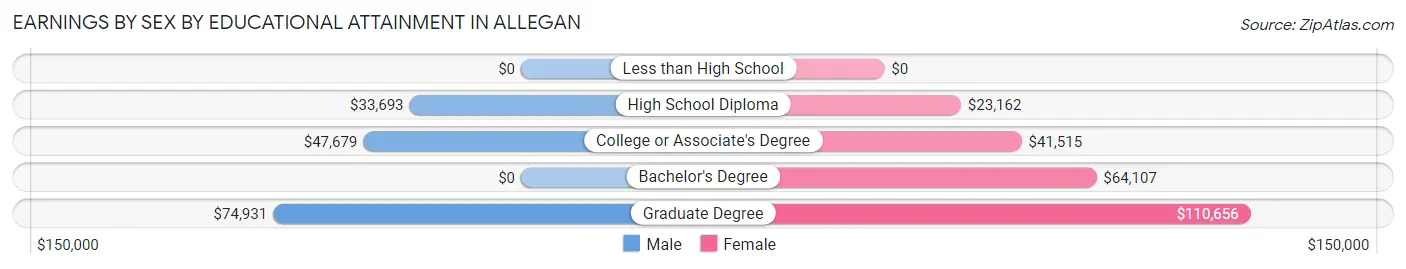
Earnings by Sex by Educational Attainment in Allegan
Average earnings in Allegan are $35,921 for men and $41,104 for women, a difference of 12.6%. Men with an educational attainment of graduate degree enjoy the highest average annual earnings of $74,931, while those with high school diploma education earn the least with $33,693. Women with an educational attainment of graduate degree earn the most with the average annual earnings of $110,656, while those with high school diploma education have the smallest earnings of $23,162.
| Educational Attainment | Male Income | Female Income |
| Less than High School | - | - |
| High School Diploma | $33,693 | $23,162 |
| College or Associate's Degree | $47,679 | $41,515 |
| Bachelor's Degree | - | - |
| Graduate Degree | $74,931 | $110,656 |
| Total | $35,921 | $41,104 |
Family Income in Allegan
Family Income Brackets in Allegan
According to the Allegan family income data, there are 420 families falling into the $25,000 to $34,999 income range, which is the most common income bracket and makes up 32.0% of all families. Conversely, the $10,000 to $14,999 income bracket is the least frequent group with only 14 families (1.1%) belonging to this category.
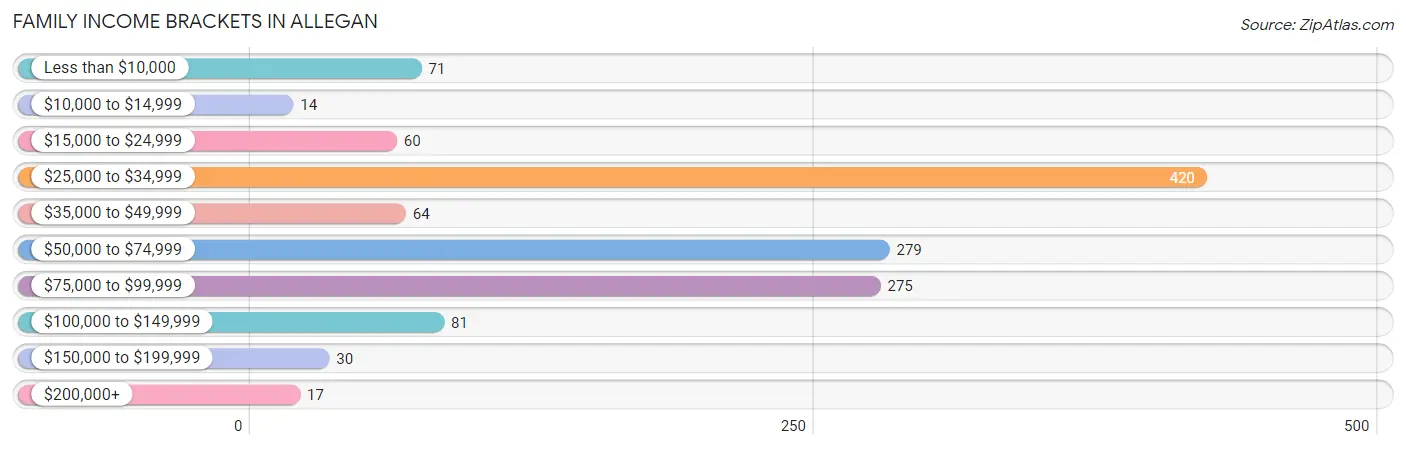
| Income Bracket | # Families | % Families |
| Less than $10,000 | 71 | 5.4% |
| $10,000 to $14,999 | 14 | 1.1% |
| $15,000 to $24,999 | 60 | 4.6% |
| $25,000 to $34,999 | 420 | 32.0% |
| $35,000 to $49,999 | 64 | 4.9% |
| $50,000 to $74,999 | 279 | 21.2% |
| $75,000 to $99,999 | 275 | 20.9% |
| $100,000 to $149,999 | 81 | 6.2% |
| $150,000 to $199,999 | 30 | 2.3% |
| $200,000+ | 17 | 1.3% |
Family Income by Famaliy Size in Allegan
7+ person families (55 | 4.2%) account for the highest median family income in Allegan with $130,156 per family, while 4-person families (217 | 16.5%) have the highest median income of $21,439 per family member.
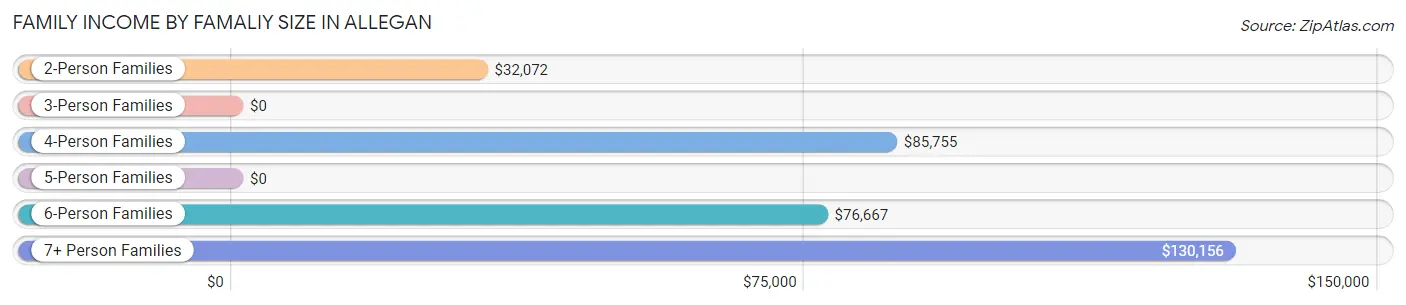
| Income Bracket | # Families | Median Income |
| 2-Person Families | 818 (62.3%) | $32,072 |
| 3-Person Families | 82 (6.2%) | $0 |
| 4-Person Families | 217 (16.5%) | $85,755 |
| 5-Person Families | 54 (4.1%) | $0 |
| 6-Person Families | 88 (6.7%) | $76,667 |
| 7+ Person Families | 55 (4.2%) | $130,156 |
| Total | 1,314 (100.0%) | $52,083 |
Family Income by Number of Earners in Allegan
The median family income in Allegan is $52,083, with families comprising 3+ earners (106) having the highest median family income of $131,563, while families with no earners (204) have the lowest median family income of $27,297, accounting for 8.1% and 15.5% of families, respectively.
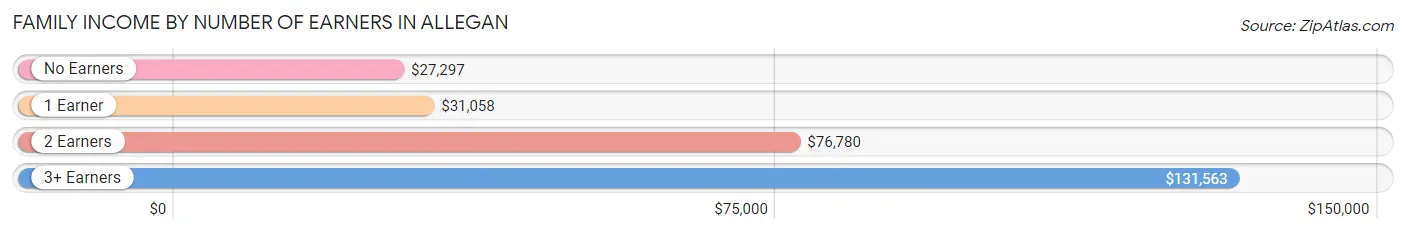
| Number of Earners | # Families | Median Income |
| No Earners | 204 (15.5%) | $27,297 |
| 1 Earner | 696 (53.0%) | $31,058 |
| 2 Earners | 308 (23.4%) | $76,780 |
| 3+ Earners | 106 (8.1%) | $131,563 |
| Total | 1,314 (100.0%) | $52,083 |
Household Income in Allegan
Household Income Brackets in Allegan
With 596 households falling in the category, the $25,000 to $34,999 income range is the most frequent in Allegan, accounting for 30.3% of all households. In contrast, only 18 households (0.9%) fall into the less than $10,000 income bracket, making it the least populous group.
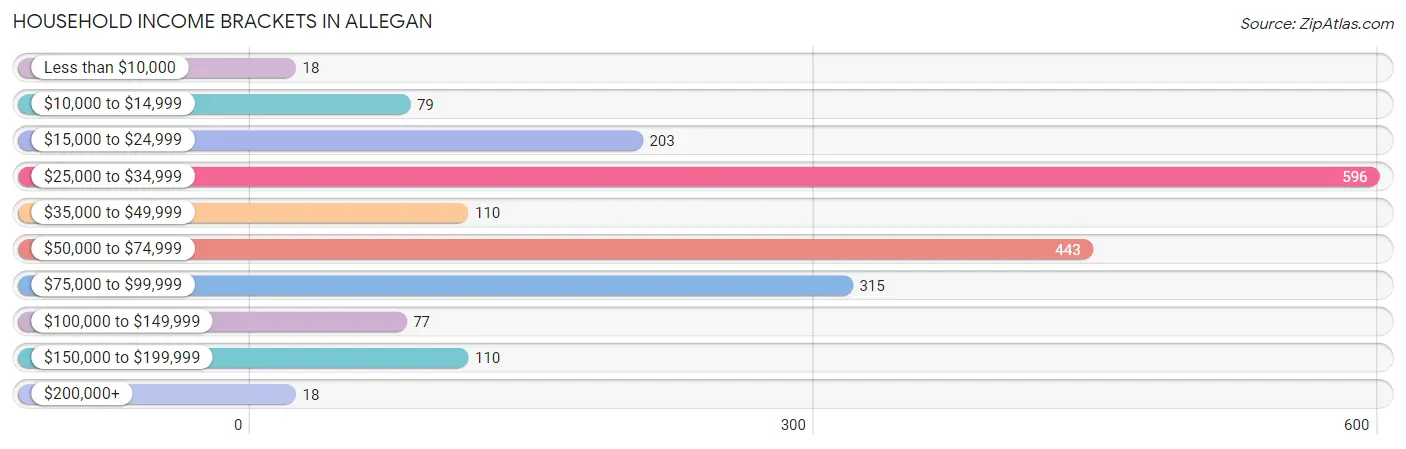
| Income Bracket | # Households | % Households |
| Less than $10,000 | 18 | 0.9% |
| $10,000 to $14,999 | 79 | 4.0% |
| $15,000 to $24,999 | 203 | 10.3% |
| $25,000 to $34,999 | 596 | 30.3% |
| $35,000 to $49,999 | 110 | 5.6% |
| $50,000 to $74,999 | 443 | 22.5% |
| $75,000 to $99,999 | 315 | 16.0% |
| $100,000 to $149,999 | 77 | 3.9% |
| $150,000 to $199,999 | 110 | 5.6% |
| $200,000+ | 18 | 0.9% |
Household Income by Householder Age in Allegan
The median household income in Allegan is $42,162, with the highest median household income of $60,417 found in the 25 to 44 years age bracket for the primary householder. A total of 571 households (29.0%) fall into this category. Meanwhile, the 15 to 24 years age bracket for the primary householder has the lowest median household income of $0, with 121 households (6.1%) in this group.
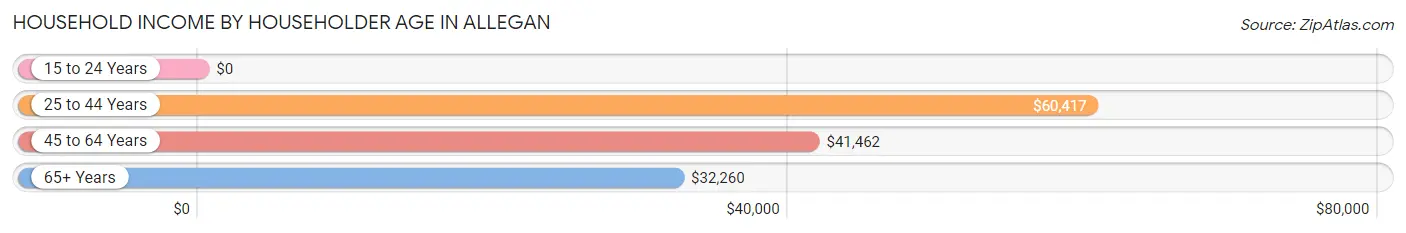
| Income Bracket | # Households | Median Income |
| 15 to 24 Years | 121 (6.1%) | $0 |
| 25 to 44 Years | 571 (29.0%) | $60,417 |
| 45 to 64 Years | 760 (38.6%) | $41,462 |
| 65+ Years | 516 (26.2%) | $32,260 |
| Total | 1,968 (100.0%) | $42,162 |
Poverty in Allegan
Income Below Poverty by Sex and Age in Allegan
With 11.0% poverty level for males and 16.2% for females among the residents of Allegan, 16 and 17 year old males and under 5 year old females are the most vulnerable to poverty, with 18 males (34.0%) and 40 females (31.0%) in their respective age groups living below the poverty level.
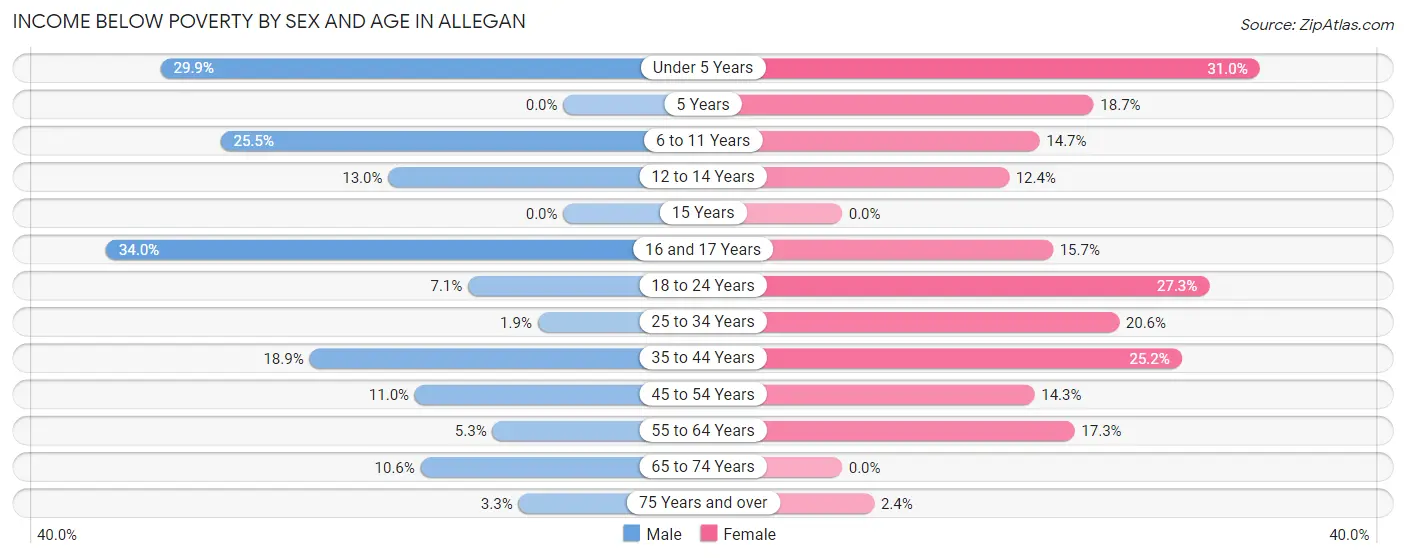
| Age Bracket | Male | Female |
| Under 5 Years | 61 (29.9%) | 40 (31.0%) |
| 5 Years | 0 (0.0%) | 17 (18.7%) |
| 6 to 11 Years | 42 (25.5%) | 27 (14.7%) |
| 12 to 14 Years | 13 (13.0%) | 14 (12.4%) |
| 15 Years | 0 (0.0%) | 0 (0.0%) |
| 16 and 17 Years | 18 (34.0%) | 13 (15.7%) |
| 18 to 24 Years | 40 (7.1%) | 69 (27.3%) |
| 25 to 34 Years | 6 (1.9%) | 72 (20.6%) |
| 35 to 44 Years | 23 (18.9%) | 57 (25.2%) |
| 45 to 54 Years | 14 (11.0%) | 36 (14.3%) |
| 55 to 64 Years | 22 (5.3%) | 67 (17.3%) |
| 65 to 74 Years | 16 (10.6%) | 0 (0.0%) |
| 75 Years and over | 4 (3.3%) | 6 (2.4%) |
| Total | 259 (11.0%) | 418 (16.2%) |
Income Above Poverty by Sex and Age in Allegan
According to the poverty statistics in Allegan, males aged 5 years and females aged 65 to 74 years are the age groups that are most secure financially, with 100.0% of males and 100.0% of females in these age groups living above the poverty line.
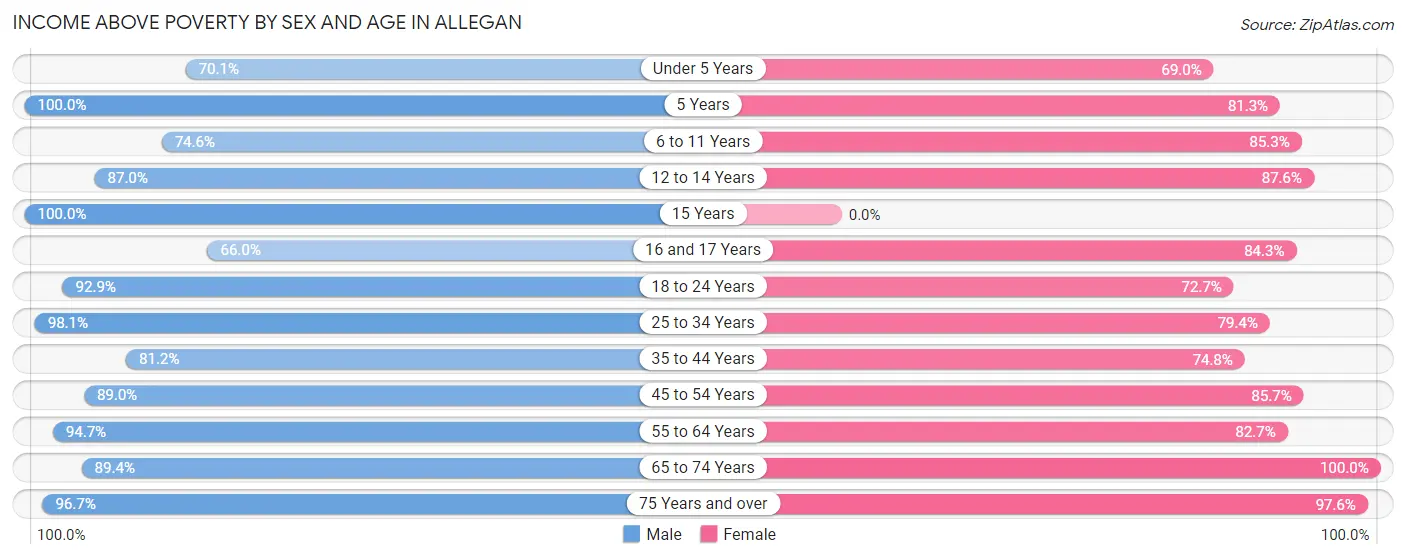
| Age Bracket | Male | Female |
| Under 5 Years | 143 (70.1%) | 89 (69.0%) |
| 5 Years | 10 (100.0%) | 74 (81.3%) |
| 6 to 11 Years | 123 (74.6%) | 157 (85.3%) |
| 12 to 14 Years | 87 (87.0%) | 99 (87.6%) |
| 15 Years | 10 (100.0%) | 0 (0.0%) |
| 16 and 17 Years | 35 (66.0%) | 70 (84.3%) |
| 18 to 24 Years | 526 (92.9%) | 184 (72.7%) |
| 25 to 34 Years | 309 (98.1%) | 278 (79.4%) |
| 35 to 44 Years | 99 (81.1%) | 169 (74.8%) |
| 45 to 54 Years | 113 (89.0%) | 216 (85.7%) |
| 55 to 64 Years | 396 (94.7%) | 321 (82.7%) |
| 65 to 74 Years | 135 (89.4%) | 265 (100.0%) |
| 75 Years and over | 116 (96.7%) | 245 (97.6%) |
| Total | 2,102 (89.0%) | 2,167 (83.8%) |
Income Below Poverty Among Married-Couple Families in Allegan
The poverty statistics for married-couple families in Allegan show that 5.0% or 41 of the total 819 families live below the poverty line. Families with 3 or 4 children have the highest poverty rate of 11.1%, comprising of 11 families. On the other hand, families with 5 or more children have the lowest poverty rate of 0.0%, which includes 0 families.
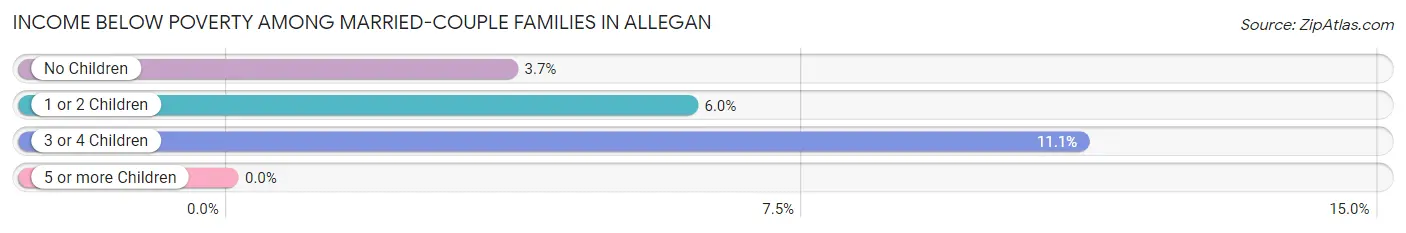
| Children | Above Poverty | Below Poverty |
| No Children | 475 (96.4%) | 18 (3.6%) |
| 1 or 2 Children | 188 (94.0%) | 12 (6.0%) |
| 3 or 4 Children | 88 (88.9%) | 11 (11.1%) |
| 5 or more Children | 27 (100.0%) | 0 (0.0%) |
| Total | 778 (95.0%) | 41 (5.0%) |
Income Below Poverty Among Single-Parent Households in Allegan
According to the poverty data in Allegan, 19.2% or 14 single-father households and 24.4% or 103 single-mother households are living below the poverty line. Among single-father households, those with 1 or 2 children have the highest poverty rate, with 14 households (25.5%) experiencing poverty. Likewise, among single-mother households, those with 3 or 4 children have the highest poverty rate, with 17 households (46.0%) falling below the poverty line.
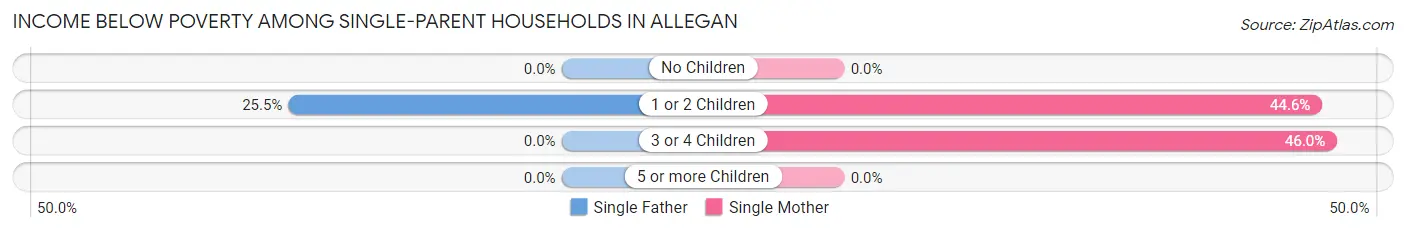
| Children | Single Father | Single Mother |
| No Children | 0 (0.0%) | 0 (0.0%) |
| 1 or 2 Children | 14 (25.5%) | 86 (44.6%) |
| 3 or 4 Children | 0 (0.0%) | 17 (46.0%) |
| 5 or more Children | 0 (0.0%) | 0 (0.0%) |
| Total | 14 (19.2%) | 103 (24.4%) |
Income Below Poverty Among Married-Couple vs Single-Parent Households in Allegan
The poverty data for Allegan shows that 41 of the married-couple family households (5.0%) and 117 of the single-parent households (23.6%) are living below the poverty level. Within the married-couple family households, those with 3 or 4 children have the highest poverty rate, with 11 households (11.1%) falling below the poverty line. Among the single-parent households, those with 3 or 4 children have the highest poverty rate, with 17 household (46.0%) living below poverty.
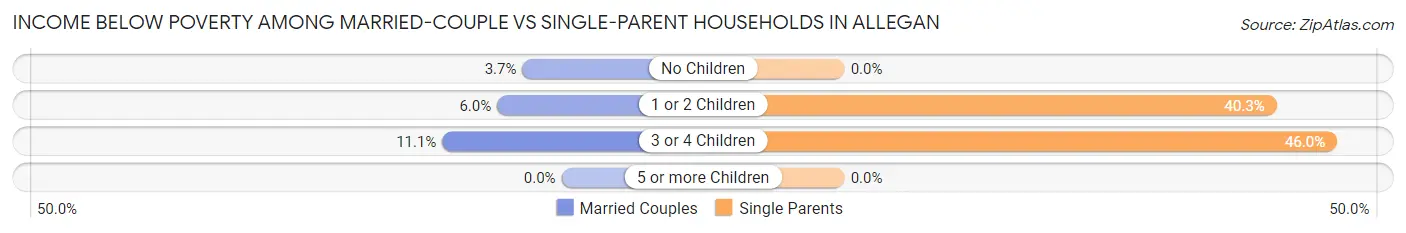
| Children | Married-Couple Families | Single-Parent Households |
| No Children | 18 (3.6%) | 0 (0.0%) |
| 1 or 2 Children | 12 (6.0%) | 100 (40.3%) |
| 3 or 4 Children | 11 (11.1%) | 17 (46.0%) |
| 5 or more Children | 0 (0.0%) | 0 (0.0%) |
| Total | 41 (5.0%) | 117 (23.6%) |
Race in Allegan
The most populous races in Allegan are White / Caucasian (4,253 | 82.1%), Two or more Races (381 | 7.4%), and Hispanic or Latino (349 | 6.7%).
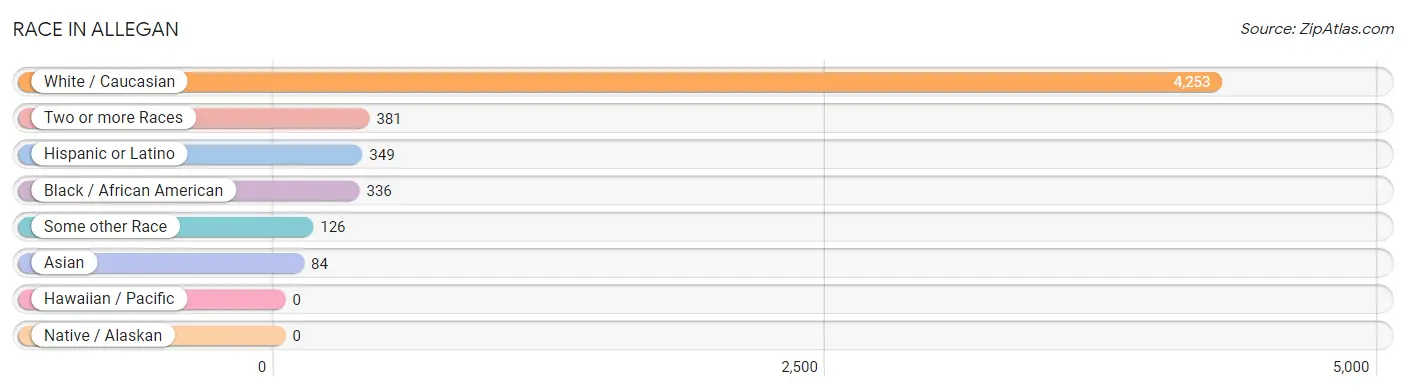
| Race | # Population | % Population |
| Asian | 84 | 1.6% |
| Black / African American | 336 | 6.5% |
| Hawaiian / Pacific | 0 | 0.0% |
| Hispanic or Latino | 349 | 6.7% |
| Native / Alaskan | 0 | 0.0% |
| White / Caucasian | 4,253 | 82.1% |
| Two or more Races | 381 | 7.4% |
| Some other Race | 126 | 2.4% |
| Total | 5,180 | 100.0% |
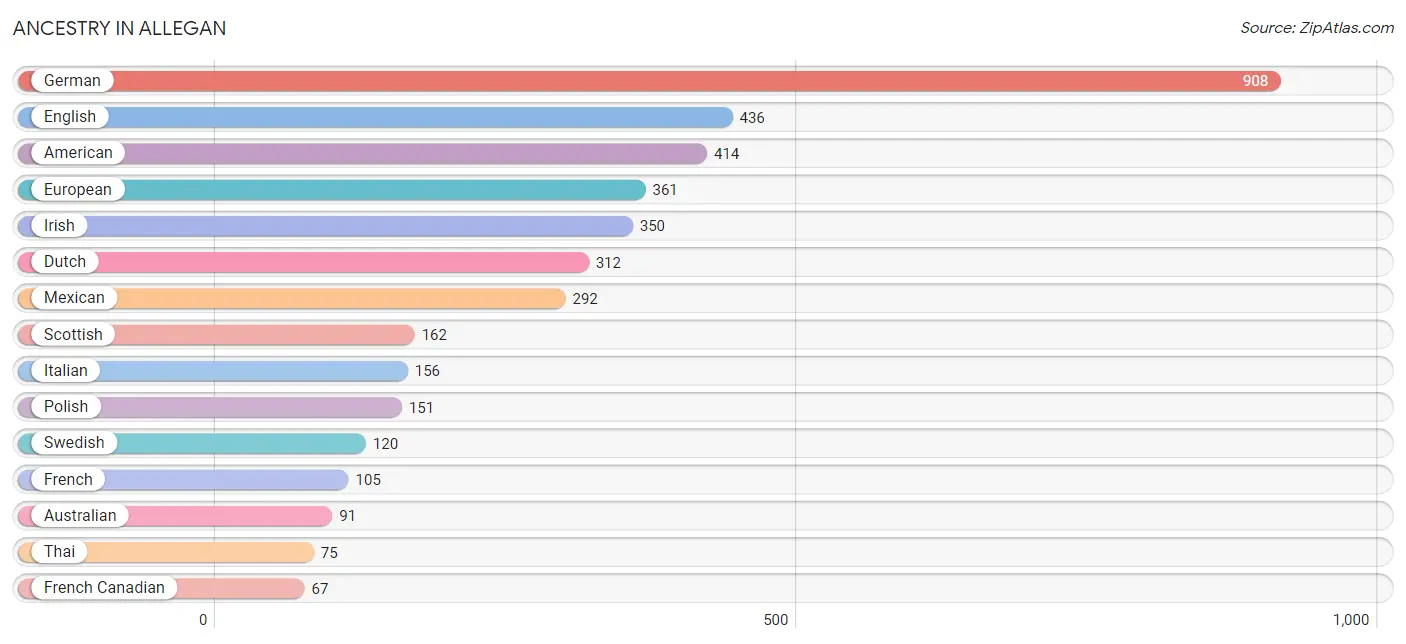
Ancestry in Allegan
The most populous ancestries reported in Allegan are German (908 | 17.5%), English (436 | 8.4%), American (414 | 8.0%), European (361 | 7.0%), and Irish (350 | 6.8%), together accounting for 47.7% of all Allegan residents.
| Ancestry | # Population | % Population |
| African | 25 | 0.5% |
| American | 414 | 8.0% |
| Australian | 91 | 1.8% |
| Austrian | 48 | 0.9% |
| Bhutanese | 9 | 0.2% |
| Burmese | 10 | 0.2% |
| Canadian | 16 | 0.3% |
| Cherokee | 40 | 0.8% |
| Chippewa | 35 | 0.7% |
| Czech | 8 | 0.2% |
| Danish | 56 | 1.1% |
| Dutch | 312 | 6.0% |
| English | 436 | 8.4% |
| European | 361 | 7.0% |
| Finnish | 40 | 0.8% |
| French | 105 | 2.0% |
| French Canadian | 67 | 1.3% |
| German | 908 | 17.5% |
| Greek | 11 | 0.2% |
| Hungarian | 27 | 0.5% |
| Irish | 350 | 6.8% |
| Italian | 156 | 3.0% |
| Mexican | 292 | 5.6% |
| Northern European | 14 | 0.3% |
| Norwegian | 16 | 0.3% |
| Polish | 151 | 2.9% |
| Potawatomi | 28 | 0.5% |
| Puerto Rican | 35 | 0.7% |
| Scotch-Irish | 17 | 0.3% |
| Scottish | 162 | 3.1% |
| Seminole | 17 | 0.3% |
| Serbian | 11 | 0.2% |
| Spaniard | 19 | 0.4% |
| Spanish | 3 | 0.1% |
| Subsaharan African | 25 | 0.5% |
| Swedish | 120 | 2.3% |
| Thai | 75 | 1.5% | View All 37 Rows |
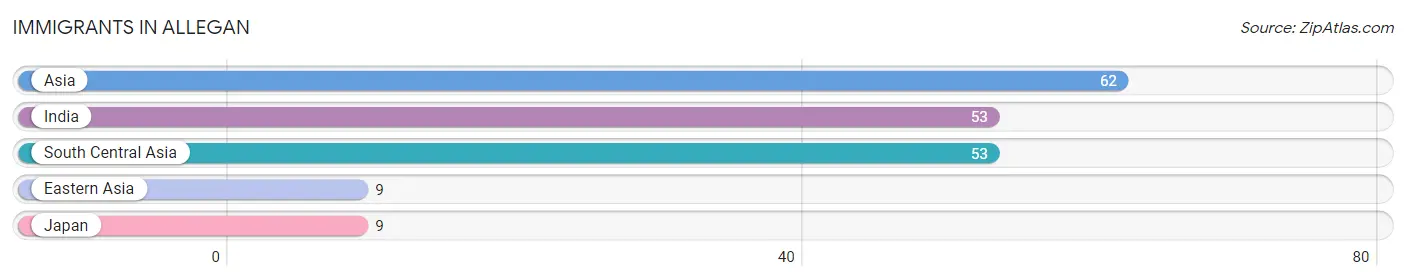
Immigrants in Allegan
The most numerous immigrant groups reported in Allegan came from Asia (62 | 1.2%), India (53 | 1.0%), South Central Asia (53 | 1.0%), Eastern Asia (9 | 0.2%), and Japan (9 | 0.2%), together accounting for 3.6% of all Allegan residents.
| Immigration Origin | # Population | % Population |
| Asia | 62 | 1.2% |
| Eastern Asia | 9 | 0.2% |
| India | 53 | 1.0% |
| Japan | 9 | 0.2% |
| South Central Asia | 53 | 1.0% | View All 5 Rows |
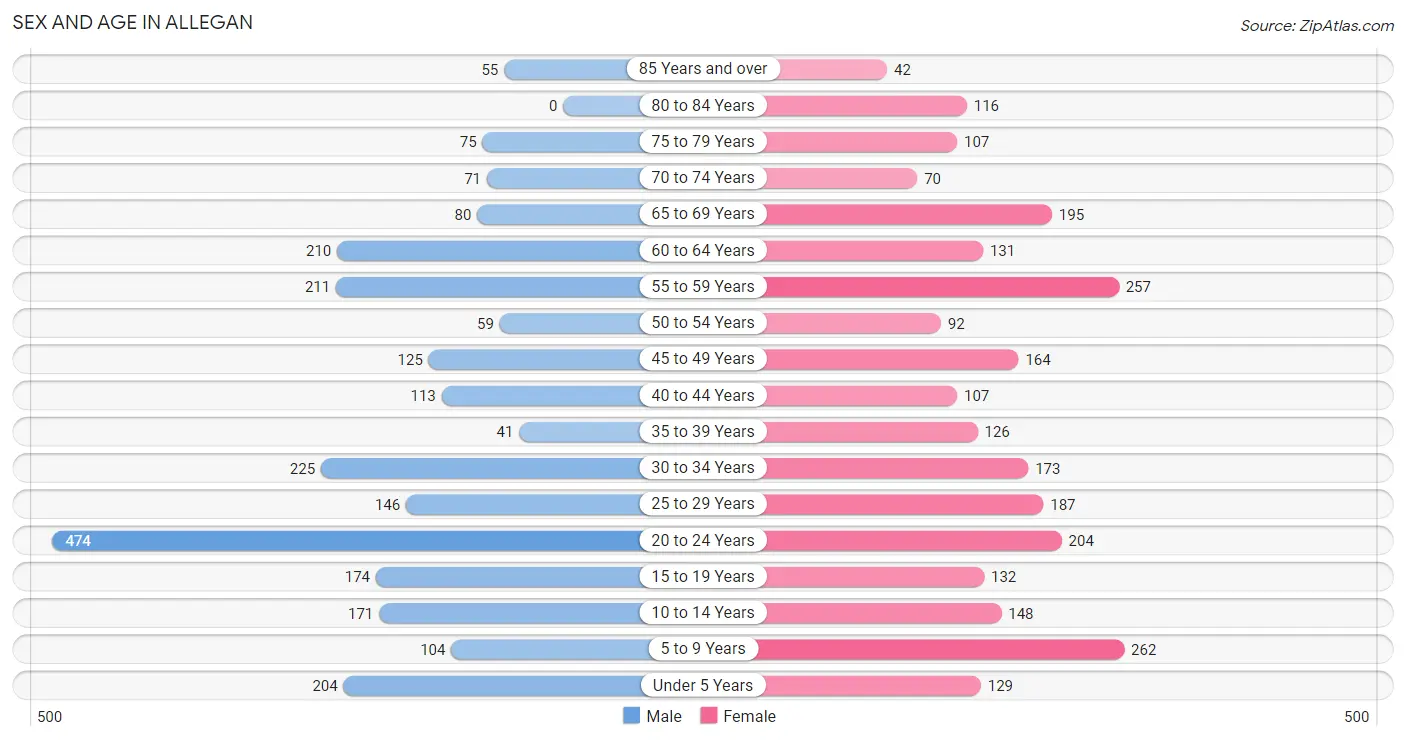
Sex and Age in Allegan
Sex and Age in Allegan
The most populous age groups in Allegan are 20 to 24 Years (474 | 18.7%) for men and 5 to 9 Years (262 | 9.9%) for women.
| Age Bracket | Male | Female |
| Under 5 Years | 204 (8.0%) | 129 (4.9%) |
| 5 to 9 Years | 104 (4.1%) | 262 (9.9%) |
| 10 to 14 Years | 171 (6.7%) | 148 (5.6%) |
| 15 to 19 Years | 174 (6.9%) | 132 (5.0%) |
| 20 to 24 Years | 474 (18.7%) | 204 (7.7%) |
| 25 to 29 Years | 146 (5.8%) | 187 (7.1%) |
| 30 to 34 Years | 225 (8.9%) | 173 (6.6%) |
| 35 to 39 Years | 41 (1.6%) | 126 (4.8%) |
| 40 to 44 Years | 113 (4.4%) | 107 (4.1%) |
| 45 to 49 Years | 125 (4.9%) | 164 (6.2%) |
| 50 to 54 Years | 59 (2.3%) | 92 (3.5%) |
| 55 to 59 Years | 211 (8.3%) | 257 (9.7%) |
| 60 to 64 Years | 210 (8.3%) | 131 (5.0%) |
| 65 to 69 Years | 80 (3.2%) | 195 (7.4%) |
| 70 to 74 Years | 71 (2.8%) | 70 (2.6%) |
| 75 to 79 Years | 75 (3.0%) | 107 (4.1%) |
| 80 to 84 Years | 0 (0.0%) | 116 (4.4%) |
| 85 Years and over | 55 (2.2%) | 42 (1.6%) |
| Total | 2,538 (100.0%) | 2,642 (100.0%) |
Families and Households in Allegan
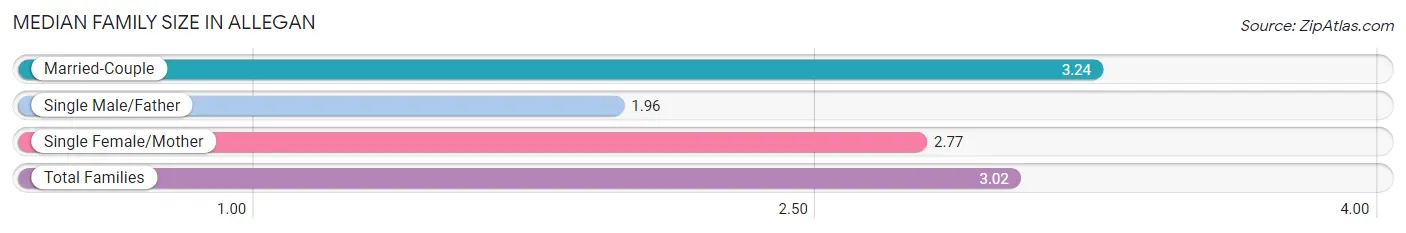
Median Family Size in Allegan
The median family size in Allegan is 3.02 persons per family, with married-couple families (819 | 62.3%) accounting for the largest median family size of 3.24 persons per family. On the other hand, single male/father families (73 | 5.6%) represent the smallest median family size with 1.96 persons per family.
| Family Type | # Families | Family Size |
| Married-Couple | 819 (62.3%) | 3.24 |
| Single Male/Father | 73 (5.6%) | 1.96 |
| Single Female/Mother | 422 (32.1%) | 2.77 |
| Total Families | 1,314 (100.0%) | 3.02 |
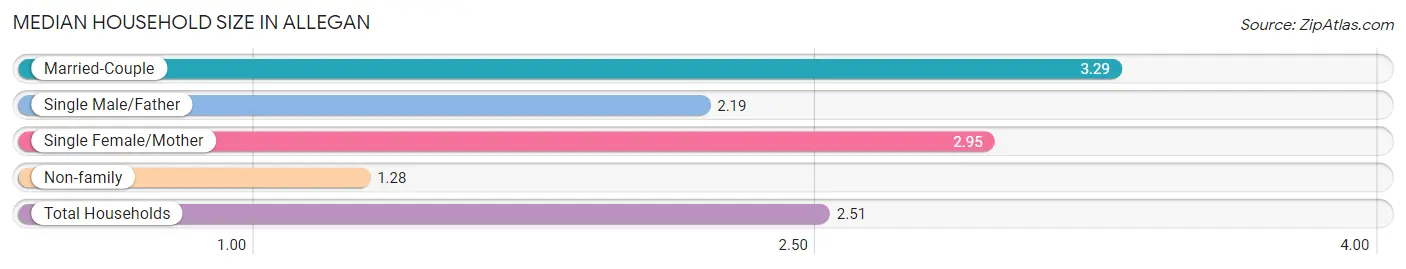
Median Household Size in Allegan
The median household size in Allegan is 2.51 persons per household, with married-couple households (819 | 41.6%) accounting for the largest median household size of 3.29 persons per household. non-family households (654 | 33.2%) represent the smallest median household size with 1.28 persons per household.
| Household Type | # Households | Household Size |
| Married-Couple | 819 (41.6%) | 3.29 |
| Single Male/Father | 73 (3.7%) | 2.19 |
| Single Female/Mother | 422 (21.4%) | 2.95 |
| Non-family | 654 (33.2%) | 1.28 |
| Total Households | 1,968 (100.0%) | 2.51 |
Household Size by Marriage Status in Allegan
Out of a total of 1,968 households in Allegan, 1,314 (66.8%) are family households, while 654 (33.2%) are nonfamily households. The most numerous type of family households are 2-person households, comprising 728, and the most common type of nonfamily households are 1-person households, comprising 501.
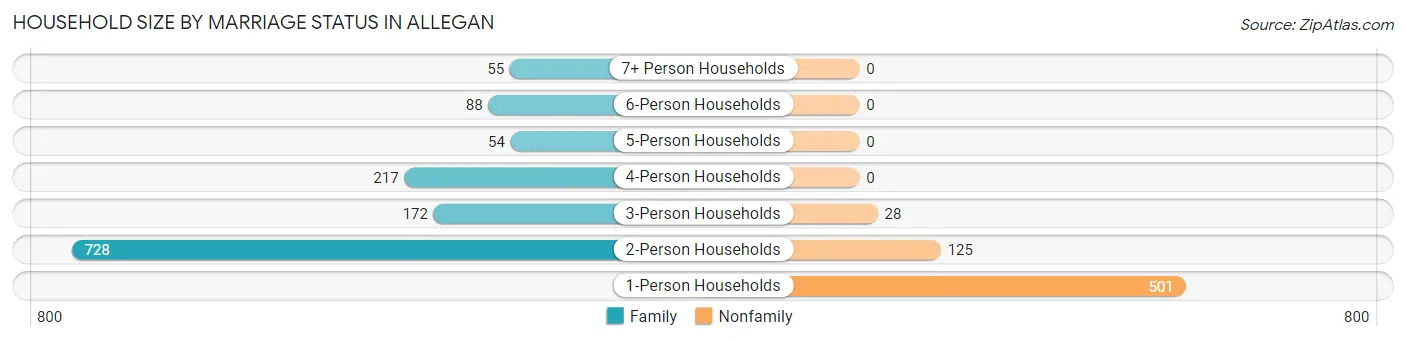
| Household Size | Family Households | Nonfamily Households |
| 1-Person Households | - | 501 (25.5%) |
| 2-Person Households | 728 (37.0%) | 125 (6.4%) |
| 3-Person Households | 172 (8.7%) | 28 (1.4%) |
| 4-Person Households | 217 (11.0%) | 0 (0.0%) |
| 5-Person Households | 54 (2.7%) | 0 (0.0%) |
| 6-Person Households | 88 (4.5%) | 0 (0.0%) |
| 7+ Person Households | 55 (2.8%) | 0 (0.0%) |
| Total | 1,314 (66.8%) | 654 (33.2%) |
Female Fertility in Allegan
Fertility by Age in Allegan
Average fertility rate in Allegan is 131.0 births per 1,000 women. Women in the age bracket of 20 to 34 years have the highest fertility rate with 257.0 births per 1,000 women. Women in the age bracket of 20 to 34 years acount for 100.0% of all women with births.
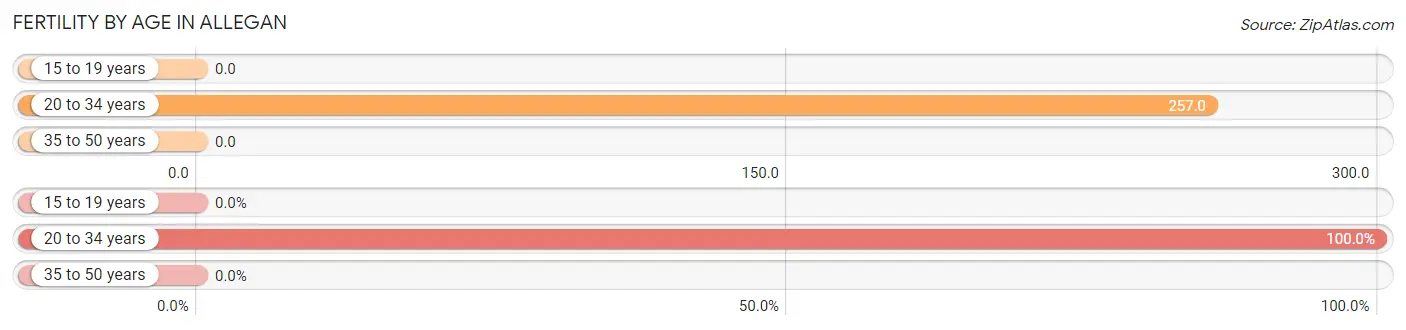
| Age Bracket | Women with Births | Births / 1,000 Women |
| 15 to 19 years | 0 (0.0%) | 0.0 |
| 20 to 34 years | 145 (100.0%) | 257.0 |
| 35 to 50 years | 0 (0.0%) | 0.0 |
| Total | 145 (100.0%) | 131.0 |
Fertility by Age by Marriage Status in Allegan
21.4% of women with births (145) in Allegan are married. The highest percentage of unmarried women with births falls into 20 to 34 years age bracket with 78.6% of them unmarried at the time of birth, while the lowest percentage of unmarried women with births belong to 20 to 34 years age bracket with 78.6% of them unmarried.
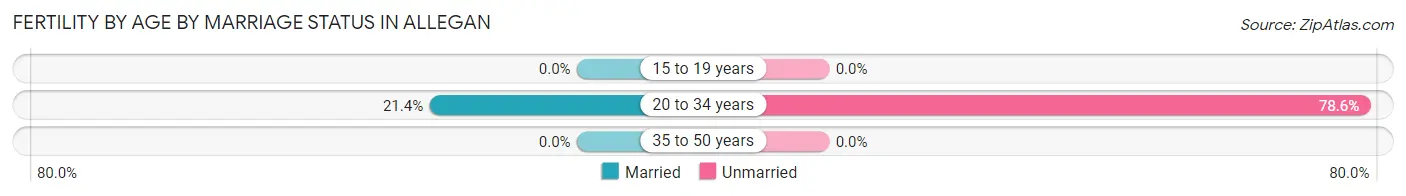
| Age Bracket | Married | Unmarried |
| 15 to 19 years | 0 (0.0%) | 0 (0.0%) |
| 20 to 34 years | 31 (21.4%) | 114 (78.6%) |
| 35 to 50 years | 0 (0.0%) | 0 (0.0%) |
| Total | 31 (21.4%) | 114 (78.6%) |
Fertility by Education in Allegan
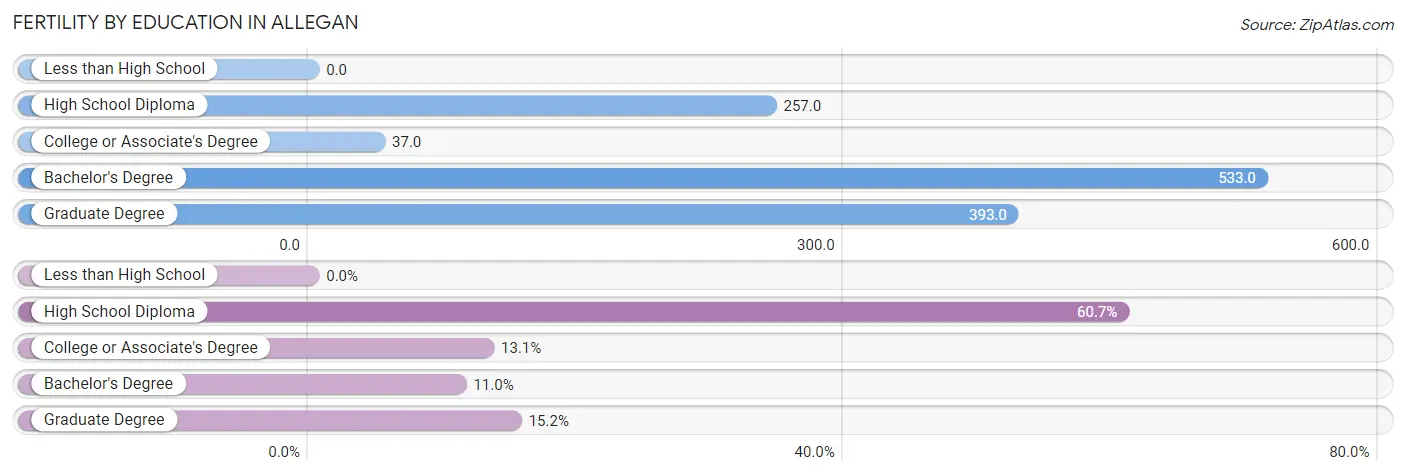
| Educational Attainment | Women with Births | Births / 1,000 Women |
| Less than High School | 0 (0.0%) | 0.0 |
| High School Diploma | 88 (60.7%) | 257.0 |
| College or Associate's Degree | 19 (13.1%) | 37.0 |
| Bachelor's Degree | 16 (11.0%) | 533.0 |
| Graduate Degree | 22 (15.2%) | 393.0 |
| Total | 145 (100.0%) | 131.0 |
Fertility by Education by Marriage Status in Allegan
78.6% of women with births in Allegan are unmarried. Women with the educational attainment of graduate degree are most likely to be married with 100.0% of them married at childbirth, while women with the educational attainment of college or associate's degree are least likely to be married with 100.0% of them unmarried at childbirth.
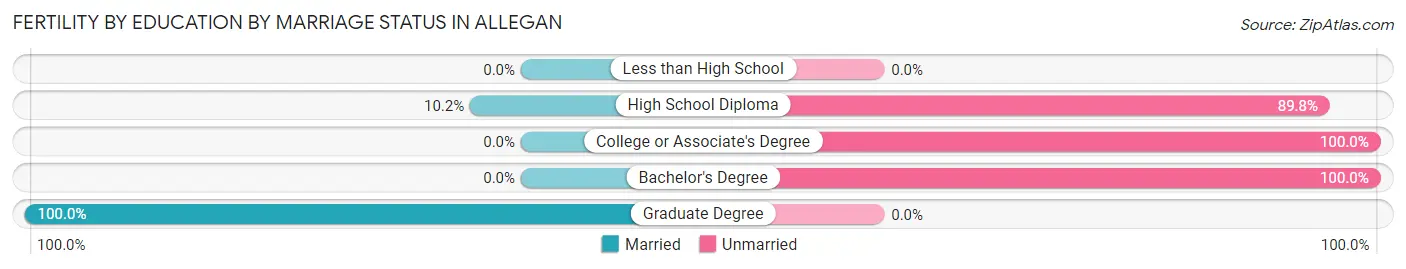
| Educational Attainment | Married | Unmarried |
| Less than High School | 0 (0.0%) | 0 (0.0%) |
| High School Diploma | 9 (10.2%) | 79 (89.8%) |
| College or Associate's Degree | 0 (0.0%) | 19 (100.0%) |
| Bachelor's Degree | 0 (0.0%) | 16 (100.0%) |
| Graduate Degree | 22 (100.0%) | 0 (0.0%) |
| Total | 31 (21.4%) | 114 (78.6%) |
Employment Characteristics in Allegan
Employment by Class of Employer in Allegan
Among the 1,915 employed individuals in Allegan, private company employees (1,478 | 77.2%), not-for-profit organizations (217 | 11.3%), and local government employees (82 | 4.3%) make up the most common classes of employment.
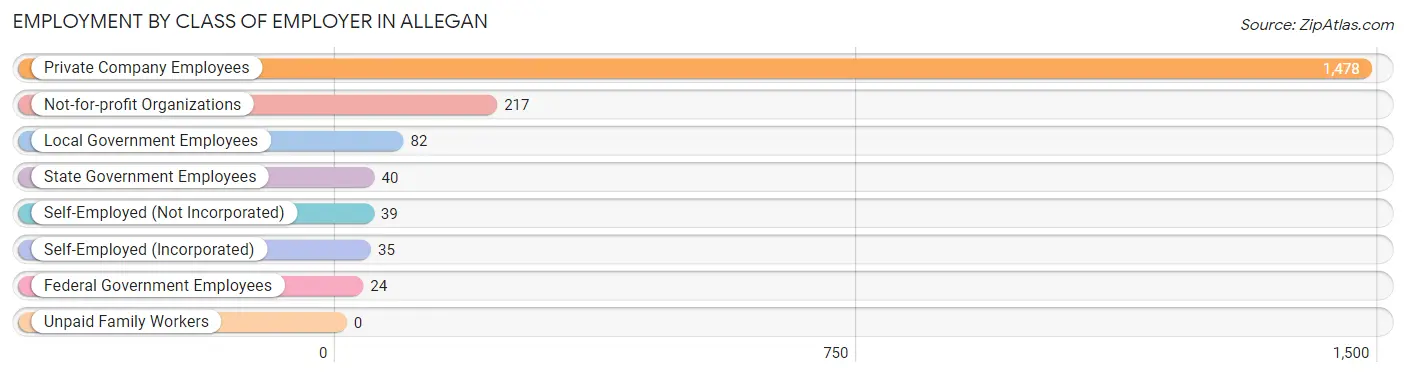
| Employer Class | # Employees | % Employees |
| Private Company Employees | 1,478 | 77.2% |
| Self-Employed (Incorporated) | 35 | 1.8% |
| Self-Employed (Not Incorporated) | 39 | 2.0% |
| Not-for-profit Organizations | 217 | 11.3% |
| Local Government Employees | 82 | 4.3% |
| State Government Employees | 40 | 2.1% |
| Federal Government Employees | 24 | 1.3% |
| Unpaid Family Workers | 0 | 0.0% |
| Total | 1,915 | 100.0% |
Employment Status by Age in Allegan
According to the labor force statistics for Allegan, out of the total population over 16 years of age (4,152), 49.0% or 2,034 individuals are in the labor force, with 2.7% or 55 of them unemployed. The age group with the highest labor force participation rate is 25 to 29 years, with 79.3% or 264 individuals in the labor force. Within the labor force, the 16 to 19 years age range has the highest percentage of unemployed individuals, with 25.5% or 28 of them being unemployed.
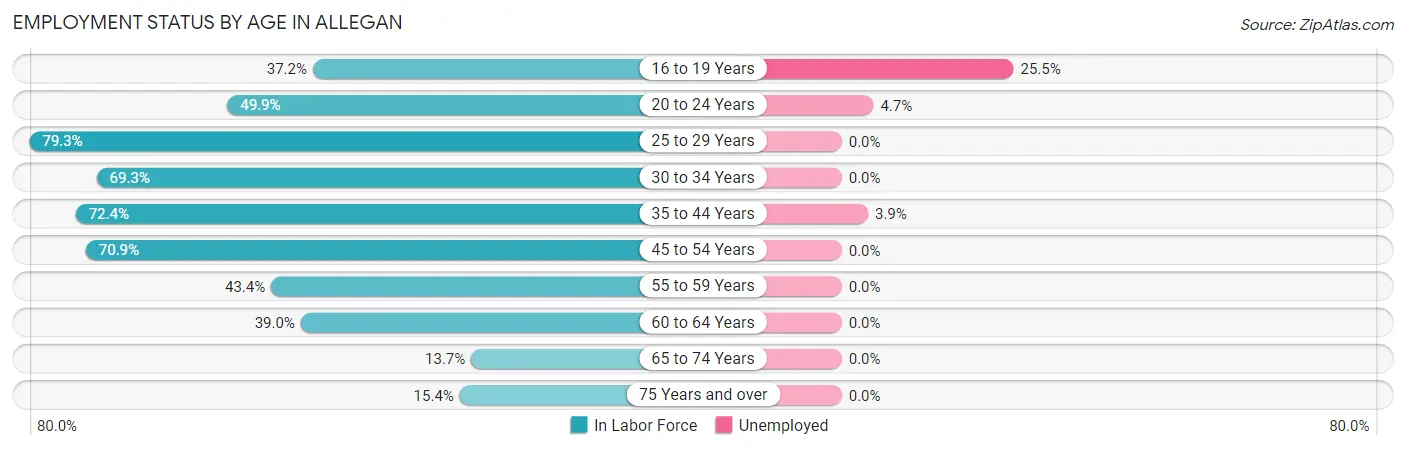
| Age Bracket | In Labor Force | Unemployed |
| 16 to 19 Years | 110 (37.2%) | 28 (25.5%) |
| 20 to 24 Years | 338 (49.9%) | 16 (4.7%) |
| 25 to 29 Years | 264 (79.3%) | 0 (0.0%) |
| 30 to 34 Years | 276 (69.3%) | 0 (0.0%) |
| 35 to 44 Years | 280 (72.4%) | 11 (3.9%) |
| 45 to 54 Years | 312 (70.9%) | 0 (0.0%) |
| 55 to 59 Years | 203 (43.4%) | 0 (0.0%) |
| 60 to 64 Years | 133 (39.0%) | 0 (0.0%) |
| 65 to 74 Years | 57 (13.7%) | 0 (0.0%) |
| 75 Years and over | 61 (15.4%) | 0 (0.0%) |
| Total | 2,034 (49.0%) | 55 (2.7%) |
Employment Status by Educational Attainment in Allegan
According to labor force statistics for Allegan, 62.0% of individuals (1,468) out of the total population between 25 and 64 years of age (2,367) are in the labor force, with 0.7% or 10 of them being unemployed. The group with the highest labor force participation rate are those with the educational attainment of college / associate degree, with 71.9% or 797 individuals in the labor force. Within the labor force, individuals with high school diploma education have the highest percentage of unemployment, with 2.4% or 11 of them being unemployed.
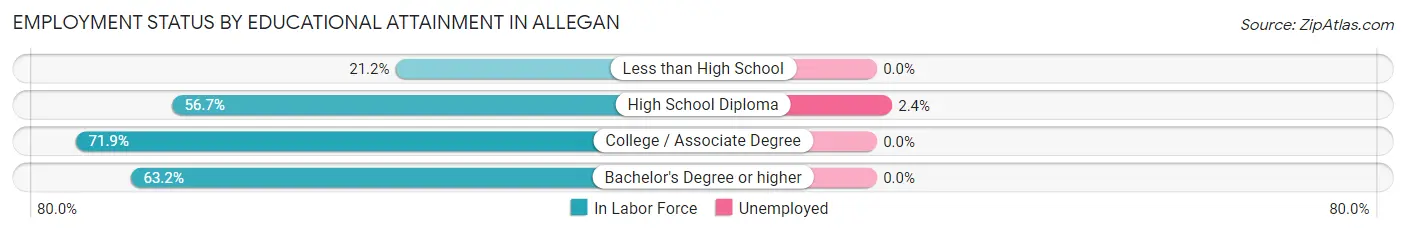
| Educational Attainment | In Labor Force | Unemployed |
| Less than High School | 36 (21.2%) | 0 (0.0%) |
| High School Diploma | 460 (56.7%) | 19 (2.4%) |
| College / Associate Degree | 797 (71.9%) | 0 (0.0%) |
| Bachelor's Degree or higher | 175 (63.2%) | 0 (0.0%) |
| Total | 1,468 (62.0%) | 17 (0.7%) |
Employment Occupations by Sex in Allegan
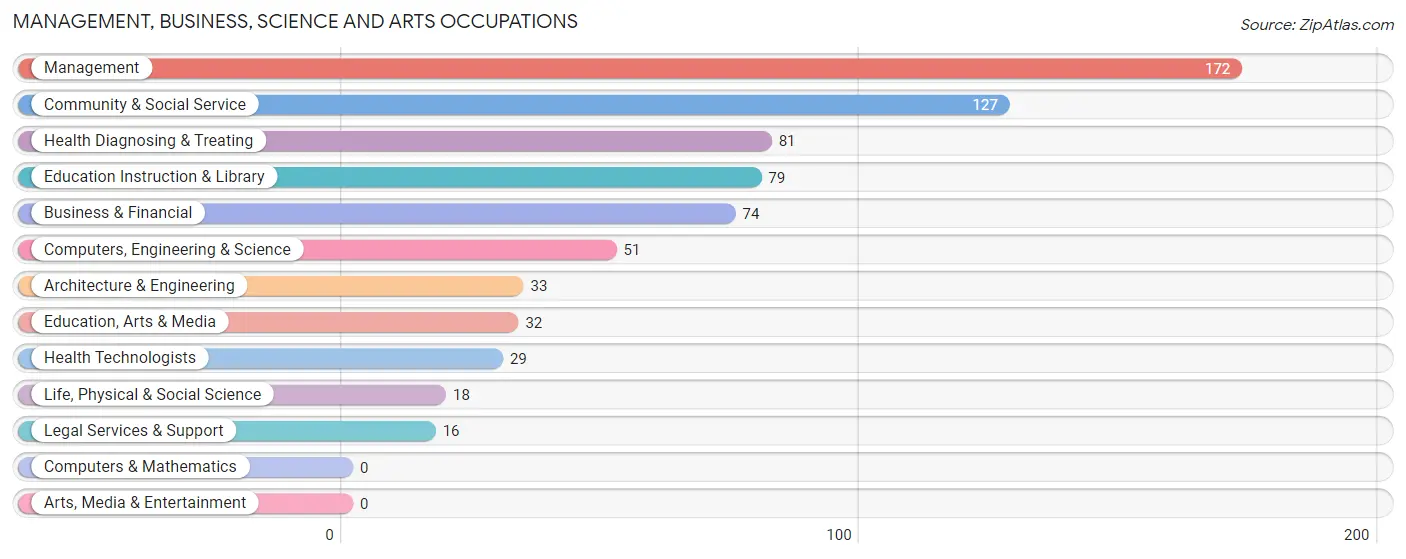
Management, Business, Science and Arts Occupations
The most common Management, Business, Science and Arts occupations in Allegan are Management (172 | 8.7%), Community & Social Service (127 | 6.4%), Health Diagnosing & Treating (81 | 4.1%), Education Instruction & Library (79 | 4.0%), and Business & Financial (74 | 3.7%).
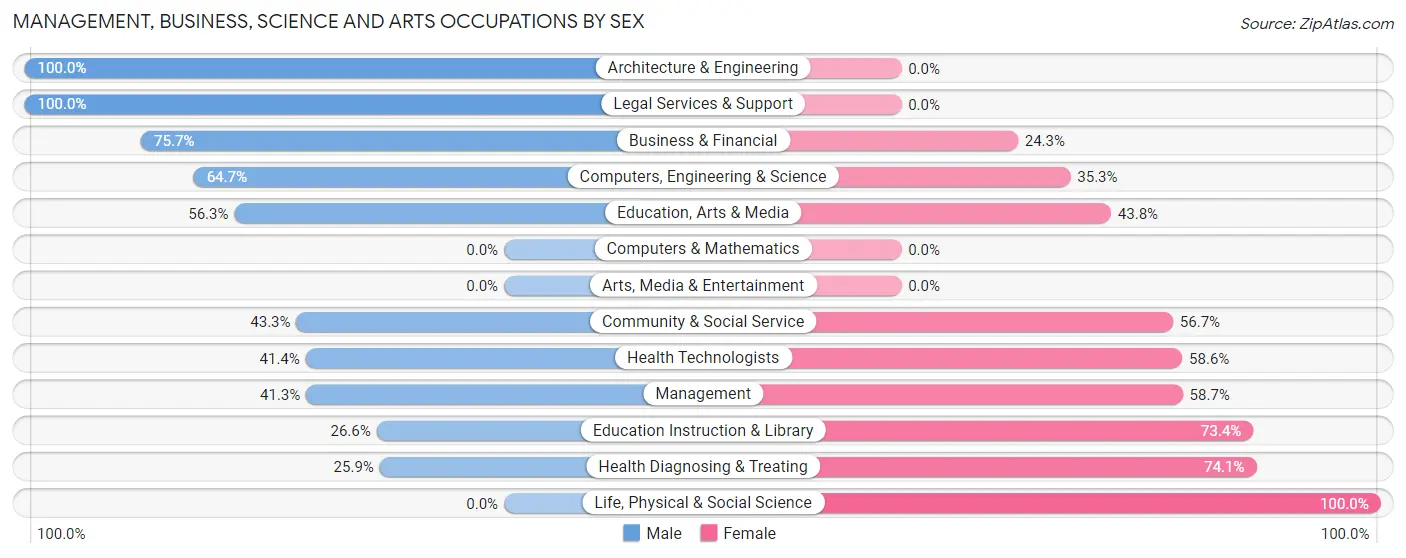
Management, Business, Science and Arts Occupations by Sex
Within the Management, Business, Science and Arts occupations in Allegan, the most male-oriented occupations are Architecture & Engineering (100.0%), Legal Services & Support (100.0%), and Business & Financial (75.7%), while the most female-oriented occupations are Life, Physical & Social Science (100.0%), Health Diagnosing & Treating (74.1%), and Education Instruction & Library (73.4%).
| Occupation | Male | Female |
| Management | 71 (41.3%) | 101 (58.7%) |
| Business & Financial | 56 (75.7%) | 18 (24.3%) |
| Computers, Engineering & Science | 33 (64.7%) | 18 (35.3%) |
| Computers & Mathematics | 0 (0.0%) | 0 (0.0%) |
| Architecture & Engineering | 33 (100.0%) | 0 (0.0%) |
| Life, Physical & Social Science | 0 (0.0%) | 18 (100.0%) |
| Community & Social Service | 55 (43.3%) | 72 (56.7%) |
| Education, Arts & Media | 18 (56.2%) | 14 (43.8%) |
| Legal Services & Support | 16 (100.0%) | 0 (0.0%) |
| Education Instruction & Library | 21 (26.6%) | 58 (73.4%) |
| Arts, Media & Entertainment | 0 (0.0%) | 0 (0.0%) |
| Health Diagnosing & Treating | 21 (25.9%) | 60 (74.1%) |
| Health Technologists | 12 (41.4%) | 17 (58.6%) |
| Total (Category) | 236 (46.7%) | 269 (53.3%) |
| Total (Overall) | 931 (47.0%) | 1,048 (53.0%) |
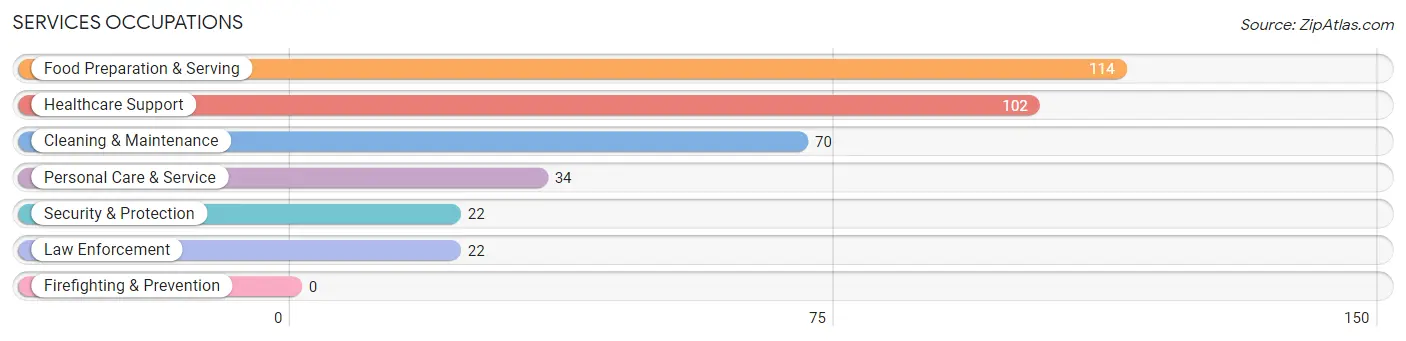
Services Occupations
The most common Services occupations in Allegan are Food Preparation & Serving (114 | 5.8%), Healthcare Support (102 | 5.1%), Cleaning & Maintenance (70 | 3.5%), Personal Care & Service (34 | 1.7%), and Security & Protection (22 | 1.1%).
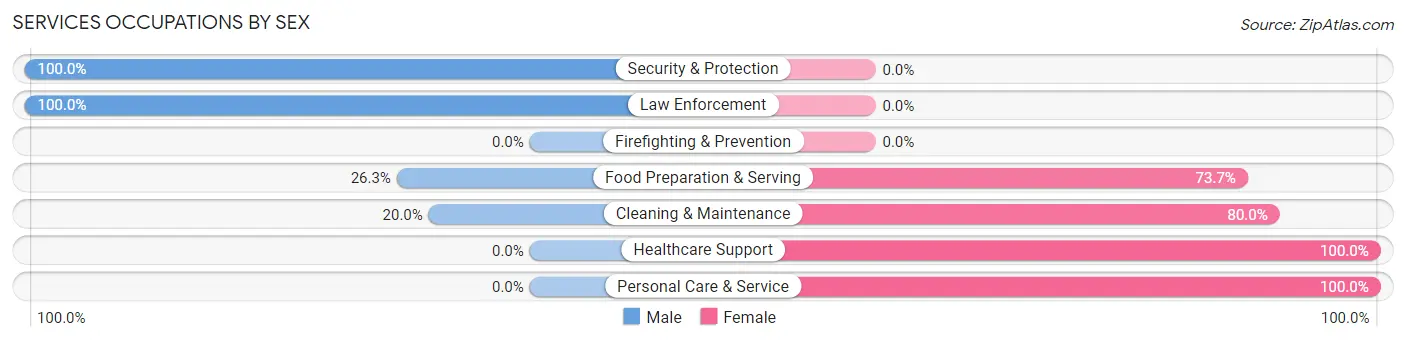
Services Occupations by Sex
Within the Services occupations in Allegan, the most male-oriented occupations are Security & Protection (100.0%), Law Enforcement (100.0%), and Food Preparation & Serving (26.3%), while the most female-oriented occupations are Healthcare Support (100.0%), Personal Care & Service (100.0%), and Cleaning & Maintenance (80.0%).
| Occupation | Male | Female |
| Healthcare Support | 0 (0.0%) | 102 (100.0%) |
| Security & Protection | 22 (100.0%) | 0 (0.0%) |
| Firefighting & Prevention | 0 (0.0%) | 0 (0.0%) |
| Law Enforcement | 22 (100.0%) | 0 (0.0%) |
| Food Preparation & Serving | 30 (26.3%) | 84 (73.7%) |
| Cleaning & Maintenance | 14 (20.0%) | 56 (80.0%) |
| Personal Care & Service | 0 (0.0%) | 34 (100.0%) |
| Total (Category) | 66 (19.3%) | 276 (80.7%) |
| Total (Overall) | 931 (47.0%) | 1,048 (53.0%) |
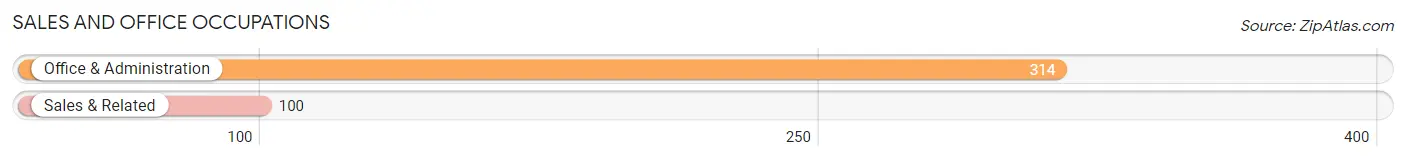
Sales and Office Occupations
The most common Sales and Office occupations in Allegan are Office & Administration (314 | 15.9%), and Sales & Related (100 | 5.1%).
Sales and Office Occupations by Sex
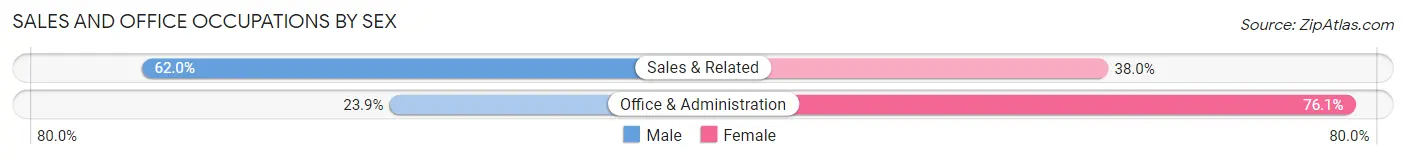
| Occupation | Male | Female |
| Sales & Related | 62 (62.0%) | 38 (38.0%) |
| Office & Administration | 75 (23.9%) | 239 (76.1%) |
| Total (Category) | 137 (33.1%) | 277 (66.9%) |
| Total (Overall) | 931 (47.0%) | 1,048 (53.0%) |
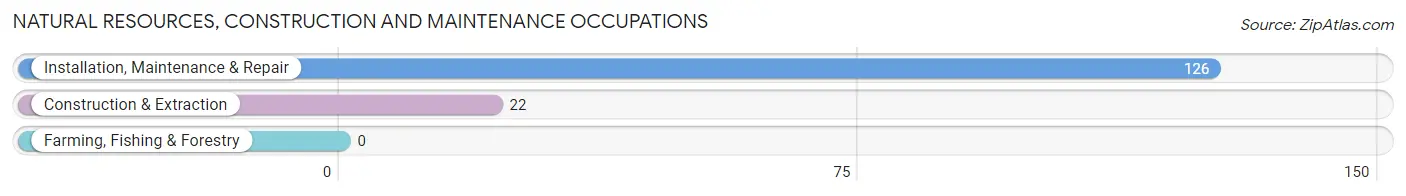
Natural Resources, Construction and Maintenance Occupations
The most common Natural Resources, Construction and Maintenance occupations in Allegan are Installation, Maintenance & Repair (126 | 6.4%), and Construction & Extraction (22 | 1.1%).
Natural Resources, Construction and Maintenance Occupations by Sex
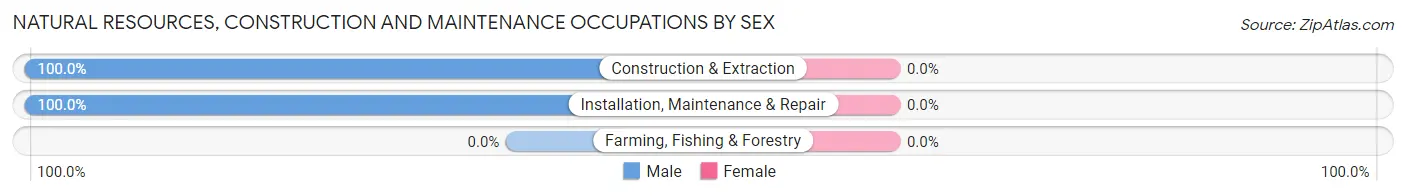
| Occupation | Male | Female |
| Farming, Fishing & Forestry | 0 (0.0%) | 0 (0.0%) |
| Construction & Extraction | 22 (100.0%) | 0 (0.0%) |
| Installation, Maintenance & Repair | 126 (100.0%) | 0 (0.0%) |
| Total (Category) | 148 (100.0%) | 0 (0.0%) |
| Total (Overall) | 931 (47.0%) | 1,048 (53.0%) |
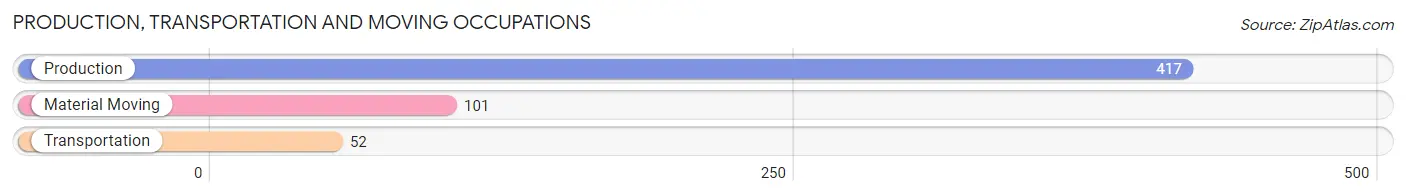
Production, Transportation and Moving Occupations
The most common Production, Transportation and Moving occupations in Allegan are Production (417 | 21.1%), Material Moving (101 | 5.1%), and Transportation (52 | 2.6%).
Production, Transportation and Moving Occupations by Sex
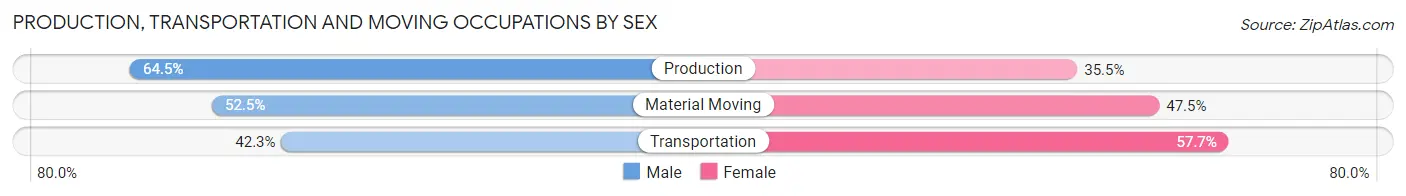
| Occupation | Male | Female |
| Production | 269 (64.5%) | 148 (35.5%) |
| Transportation | 22 (42.3%) | 30 (57.7%) |
| Material Moving | 53 (52.5%) | 48 (47.5%) |
| Total (Category) | 344 (60.4%) | 226 (39.7%) |
| Total (Overall) | 931 (47.0%) | 1,048 (53.0%) |
Employment Industries by Sex in Allegan
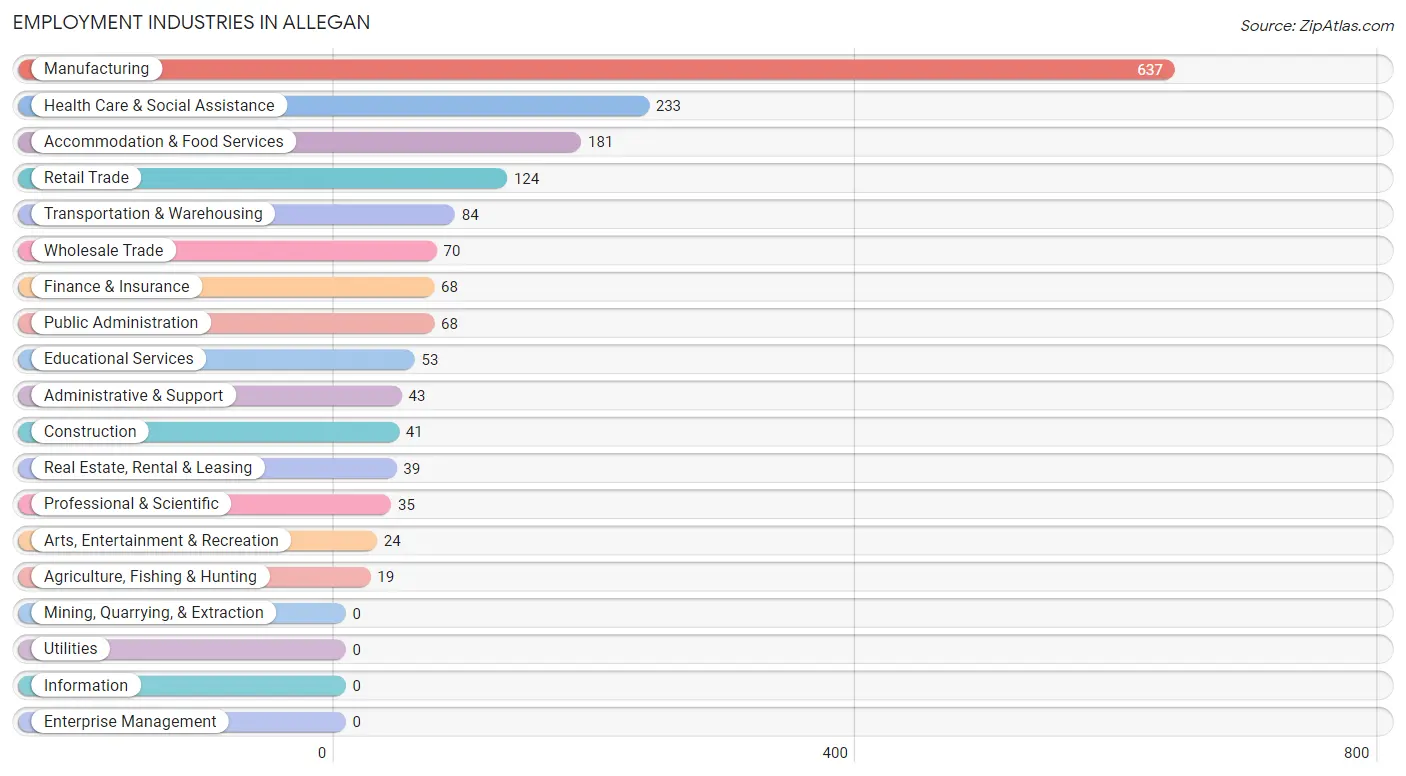
Employment Industries in Allegan
The major employment industries in Allegan include Manufacturing (637 | 32.2%), Health Care & Social Assistance (233 | 11.8%), Accommodation & Food Services (181 | 9.1%), Retail Trade (124 | 6.3%), and Transportation & Warehousing (84 | 4.2%).
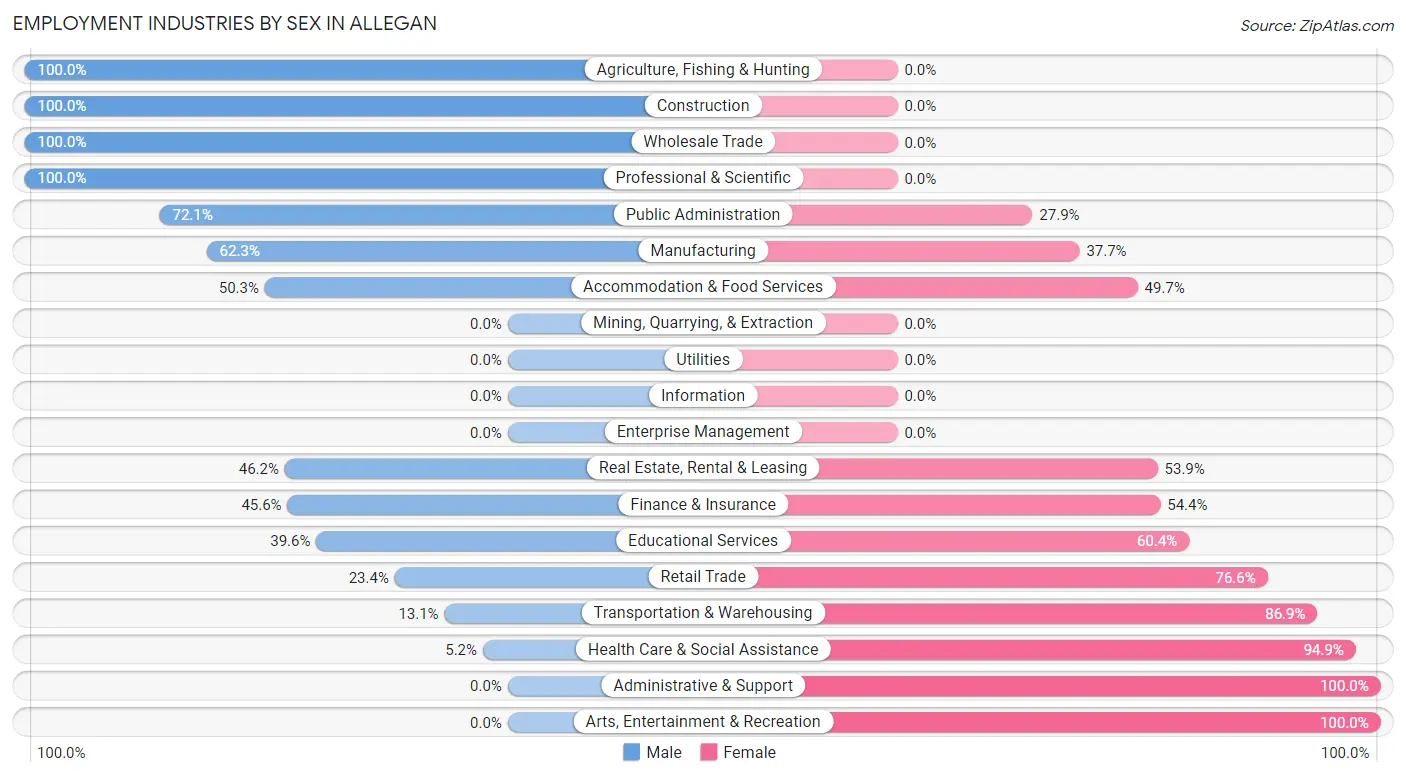
Employment Industries by Sex in Allegan
The Allegan industries that see more men than women are Agriculture, Fishing & Hunting (100.0%), Construction (100.0%), and Wholesale Trade (100.0%), whereas the industries that tend to have a higher number of women are Administrative & Support (100.0%), Arts, Entertainment & Recreation (100.0%), and Health Care & Social Assistance (94.9%).
| Industry | Male | Female |
| Agriculture, Fishing & Hunting | 19 (100.0%) | 0 (0.0%) |
| Mining, Quarrying, & Extraction | 0 (0.0%) | 0 (0.0%) |
| Construction | 41 (100.0%) | 0 (0.0%) |
| Manufacturing | 397 (62.3%) | 240 (37.7%) |
| Wholesale Trade | 70 (100.0%) | 0 (0.0%) |
| Retail Trade | 29 (23.4%) | 95 (76.6%) |
| Transportation & Warehousing | 11 (13.1%) | 73 (86.9%) |
| Utilities | 0 (0.0%) | 0 (0.0%) |
| Information | 0 (0.0%) | 0 (0.0%) |
| Finance & Insurance | 31 (45.6%) | 37 (54.4%) |
| Real Estate, Rental & Leasing | 18 (46.2%) | 21 (53.8%) |
| Professional & Scientific | 35 (100.0%) | 0 (0.0%) |
| Enterprise Management | 0 (0.0%) | 0 (0.0%) |
| Administrative & Support | 0 (0.0%) | 43 (100.0%) |
| Educational Services | 21 (39.6%) | 32 (60.4%) |
| Health Care & Social Assistance | 12 (5.1%) | 221 (94.9%) |
| Arts, Entertainment & Recreation | 0 (0.0%) | 24 (100.0%) |
| Accommodation & Food Services | 91 (50.3%) | 90 (49.7%) |
| Public Administration | 49 (72.1%) | 19 (27.9%) |
| Total | 931 (47.0%) | 1,048 (53.0%) |
Education in Allegan
School Enrollment in Allegan
The most common levels of schooling among the 1,142 students in Allegan are elementary school (325 | 28.5%), high school (240 | 21.0%), and college / undergraduate (213 | 18.6%).
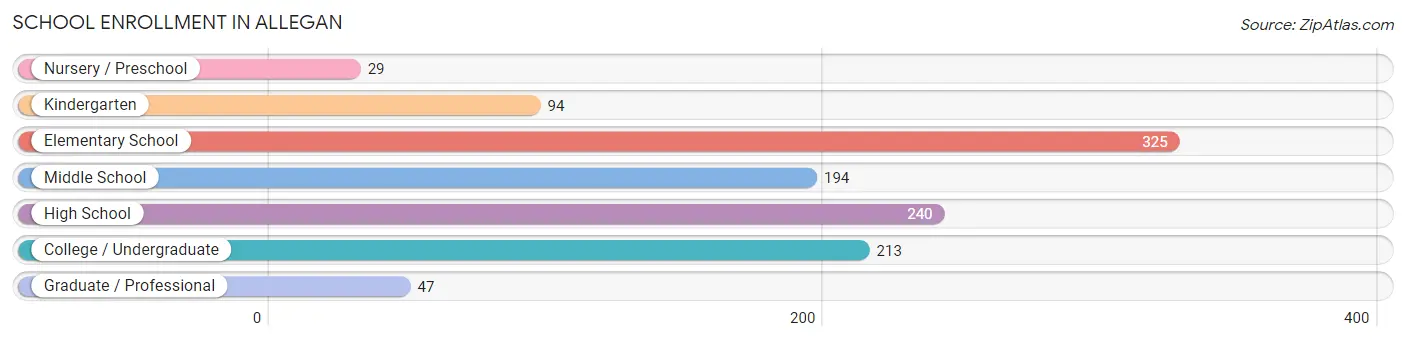
| School Level | # Students | % Students |
| Nursery / Preschool | 29 | 2.5% |
| Kindergarten | 94 | 8.2% |
| Elementary School | 325 | 28.5% |
| Middle School | 194 | 17.0% |
| High School | 240 | 21.0% |
| College / Undergraduate | 213 | 18.6% |
| Graduate / Professional | 47 | 4.1% |
| Total | 1,142 | 100.0% |
School Enrollment by Age by Funding Source in Allegan
Out of a total of 1,142 students who are enrolled in schools in Allegan, 13 (1.1%) attend a private institution, while the remaining 1,129 (98.9%) are enrolled in public schools. The age group of 35 years and over has the highest likelihood of being enrolled in private schools, with 12 (48.0% in the age bracket) enrolled. Conversely, the age group of 3 to 4 year olds has the lowest likelihood of being enrolled in a private school, with 9 (100.0% in the age bracket) attending a public institution.
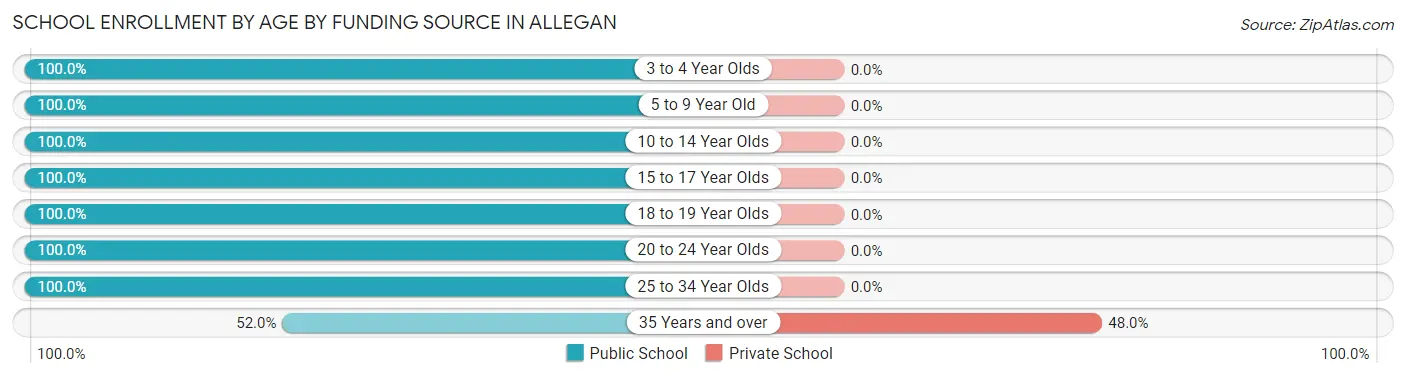
| Age Bracket | Public School | Private School |
| 3 to 4 Year Olds | 9 (100.0%) | 0 (0.0%) |
| 5 to 9 Year Old | 366 (100.0%) | 0 (0.0%) |
| 10 to 14 Year Olds | 319 (100.0%) | 0 (0.0%) |
| 15 to 17 Year Olds | 146 (100.0%) | 0 (0.0%) |
| 18 to 19 Year Olds | 73 (100.0%) | 0 (0.0%) |
| 20 to 24 Year Olds | 121 (100.0%) | 0 (0.0%) |
| 25 to 34 Year Olds | 83 (100.0%) | 0 (0.0%) |
| 35 Years and over | 13 (52.0%) | 12 (48.0%) |
| Total | 1,129 (98.9%) | 13 (1.1%) |
Educational Attainment by Field of Study in Allegan
Business (152 | 36.7%), education (139 | 33.6%), arts & humanities (31 | 7.5%), liberal arts & history (28 | 6.8%), and science & technology (22 | 5.3%) are the most common fields of study among 414 individuals in Allegan who have obtained a bachelor's degree or higher.
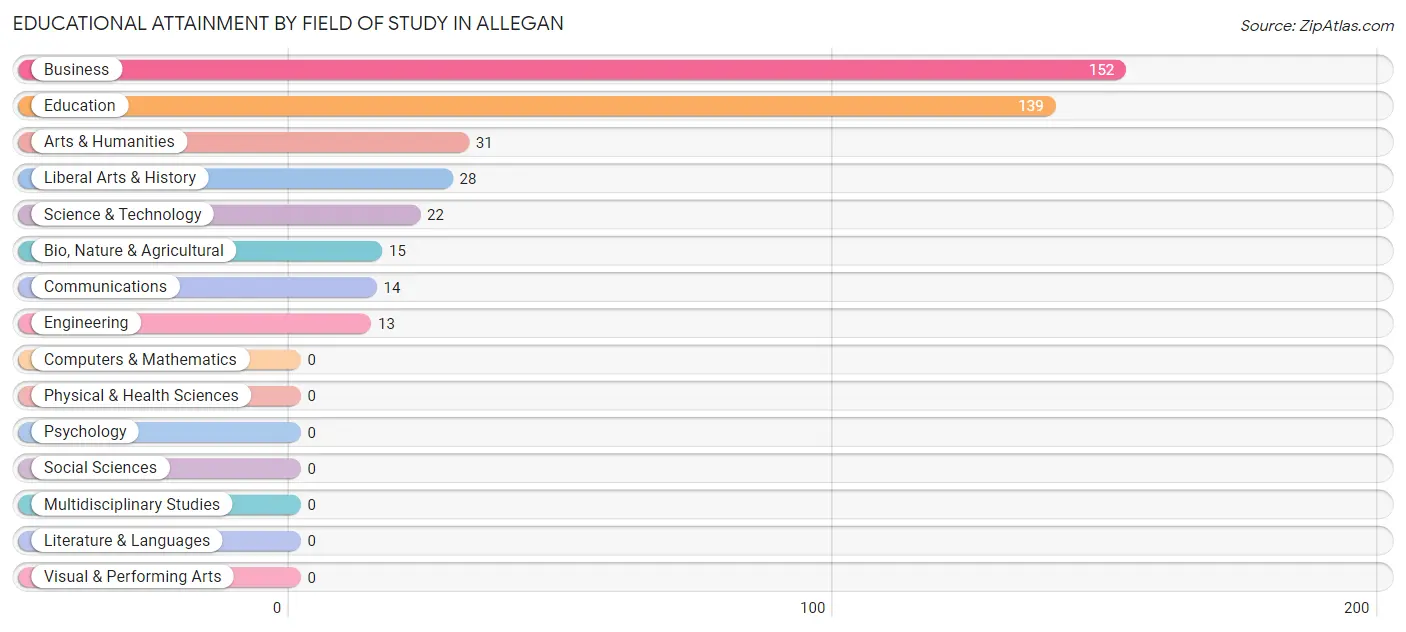
| Field of Study | # Graduates | % Graduates |
| Computers & Mathematics | 0 | 0.0% |
| Bio, Nature & Agricultural | 15 | 3.6% |
| Physical & Health Sciences | 0 | 0.0% |
| Psychology | 0 | 0.0% |
| Social Sciences | 0 | 0.0% |
| Engineering | 13 | 3.1% |
| Multidisciplinary Studies | 0 | 0.0% |
| Science & Technology | 22 | 5.3% |
| Business | 152 | 36.7% |
| Education | 139 | 33.6% |
| Literature & Languages | 0 | 0.0% |
| Liberal Arts & History | 28 | 6.8% |
| Visual & Performing Arts | 0 | 0.0% |
| Communications | 14 | 3.4% |
| Arts & Humanities | 31 | 7.5% |
| Total | 414 | 100.0% |
Transportation & Commute in Allegan
Vehicle Availability by Sex in Allegan
The most prevalent vehicle ownership categories in Allegan are males with 2 vehicles (430, accounting for 46.2%) and females with 2 vehicles (249, making up 43.7%).
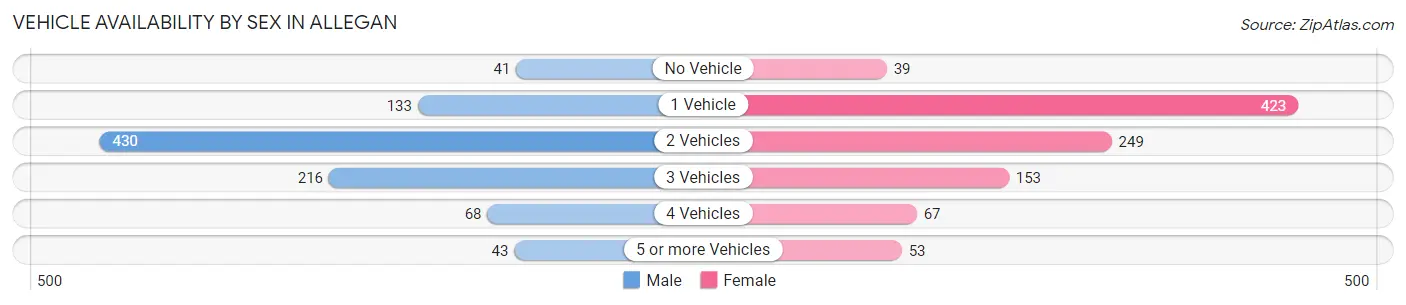
| Vehicles Available | Male | Female |
| No Vehicle | 41 (4.4%) | 39 (4.0%) |
| 1 Vehicle | 133 (14.3%) | 423 (43.0%) |
| 2 Vehicles | 430 (46.2%) | 249 (25.3%) |
| 3 Vehicles | 216 (23.2%) | 153 (15.5%) |
| 4 Vehicles | 68 (7.3%) | 67 (6.8%) |
| 5 or more Vehicles | 43 (4.6%) | 53 (5.4%) |
| Total | 931 (100.0%) | 984 (100.0%) |
Commute Time in Allegan
The most frequently occuring commute durations in Allegan are 5 to 9 minutes (423 commuters, 22.8%), 10 to 14 minutes (359 commuters, 19.4%), and 45 to 59 minutes (247 commuters, 13.3%).
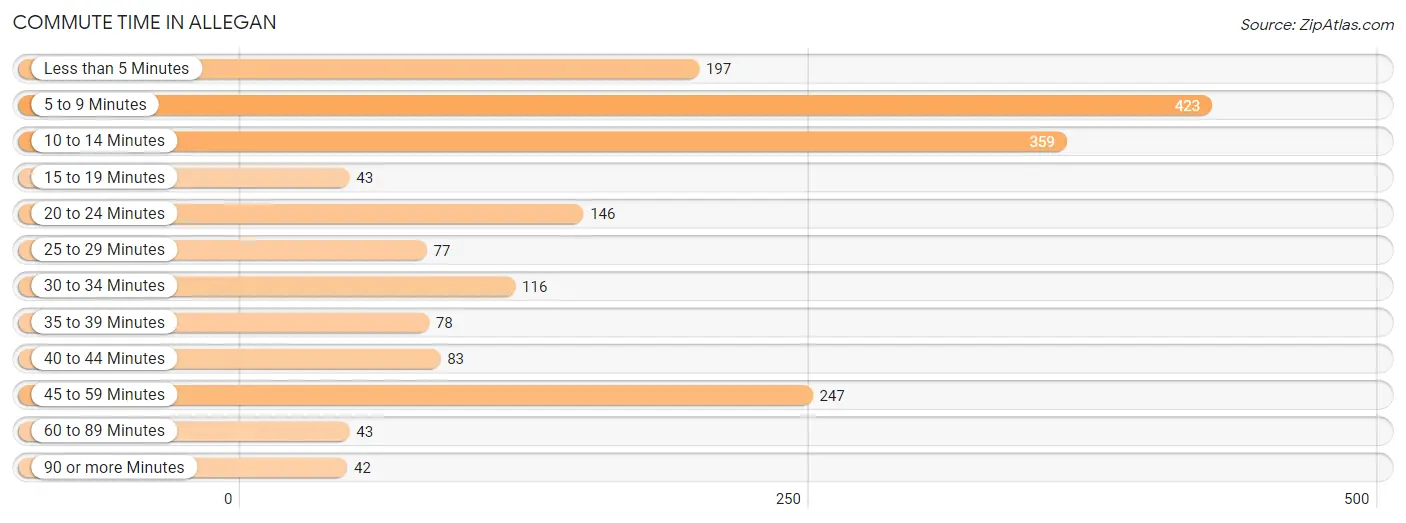
| Commute Time | # Commuters | % Commuters |
| Less than 5 Minutes | 197 | 10.6% |
| 5 to 9 Minutes | 423 | 22.8% |
| 10 to 14 Minutes | 359 | 19.4% |
| 15 to 19 Minutes | 43 | 2.3% |
| 20 to 24 Minutes | 146 | 7.9% |
| 25 to 29 Minutes | 77 | 4.2% |
| 30 to 34 Minutes | 116 | 6.3% |
| 35 to 39 Minutes | 78 | 4.2% |
| 40 to 44 Minutes | 83 | 4.5% |
| 45 to 59 Minutes | 247 | 13.3% |
| 60 to 89 Minutes | 43 | 2.3% |
| 90 or more Minutes | 42 | 2.3% |
Commute Time by Sex in Allegan
The most common commute times in Allegan are 5 to 9 minutes (318 commuters, 34.2%) for males and 10 to 14 minutes (224 commuters, 24.3%) for females.
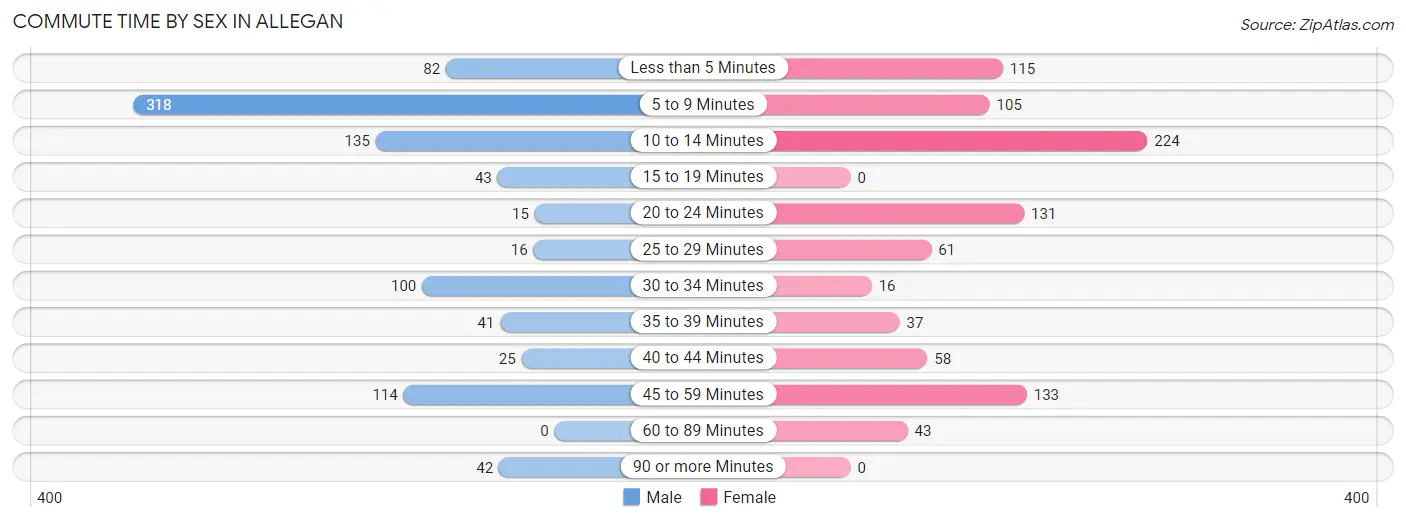
| Commute Time | Male | Female |
| Less than 5 Minutes | 82 (8.8%) | 115 (12.5%) |
| 5 to 9 Minutes | 318 (34.2%) | 105 (11.4%) |
| 10 to 14 Minutes | 135 (14.5%) | 224 (24.3%) |
| 15 to 19 Minutes | 43 (4.6%) | 0 (0.0%) |
| 20 to 24 Minutes | 15 (1.6%) | 131 (14.2%) |
| 25 to 29 Minutes | 16 (1.7%) | 61 (6.6%) |
| 30 to 34 Minutes | 100 (10.7%) | 16 (1.7%) |
| 35 to 39 Minutes | 41 (4.4%) | 37 (4.0%) |
| 40 to 44 Minutes | 25 (2.7%) | 58 (6.3%) |
| 45 to 59 Minutes | 114 (12.2%) | 133 (14.4%) |
| 60 to 89 Minutes | 0 (0.0%) | 43 (4.7%) |
| 90 or more Minutes | 42 (4.5%) | 0 (0.0%) |
Time of Departure to Work by Sex in Allegan
The most frequent times of departure to work in Allegan are 6:00 AM to 6:29 AM (165, 17.7%) for males and 7:30 AM to 7:59 AM (191, 20.7%) for females.
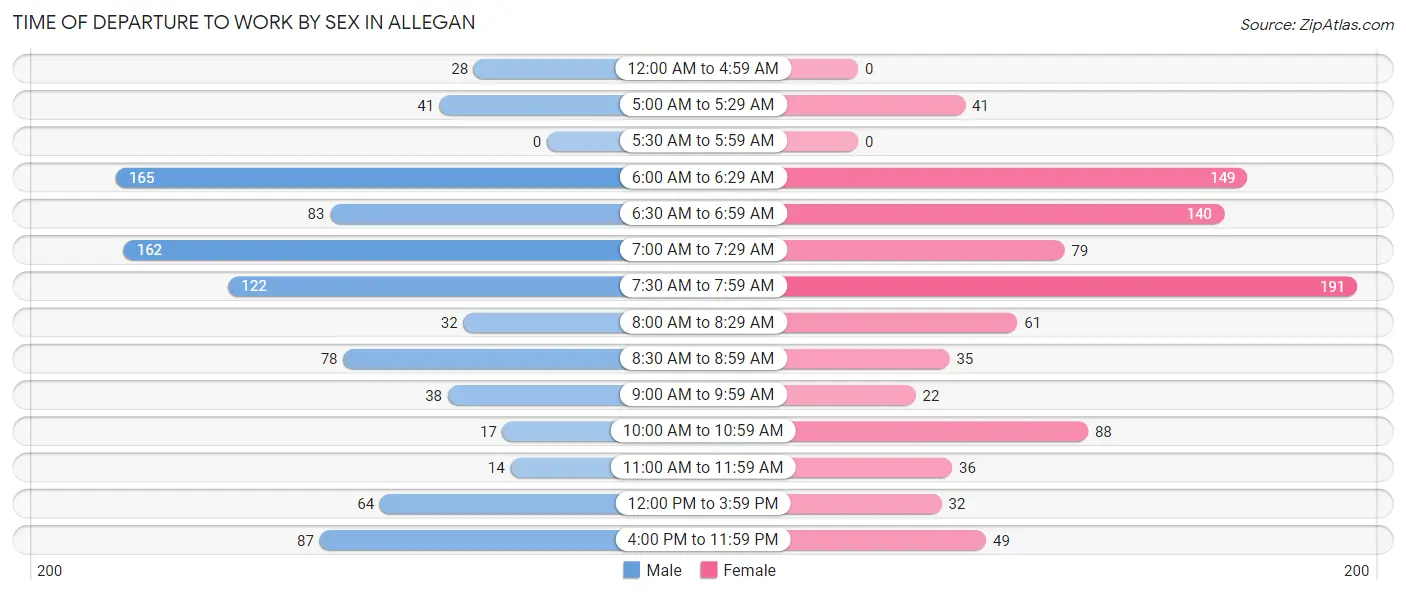
| Time of Departure | Male | Female |
| 12:00 AM to 4:59 AM | 28 (3.0%) | 0 (0.0%) |
| 5:00 AM to 5:29 AM | 41 (4.4%) | 41 (4.4%) |
| 5:30 AM to 5:59 AM | 0 (0.0%) | 0 (0.0%) |
| 6:00 AM to 6:29 AM | 165 (17.7%) | 149 (16.1%) |
| 6:30 AM to 6:59 AM | 83 (8.9%) | 140 (15.2%) |
| 7:00 AM to 7:29 AM | 162 (17.4%) | 79 (8.6%) |
| 7:30 AM to 7:59 AM | 122 (13.1%) | 191 (20.7%) |
| 8:00 AM to 8:29 AM | 32 (3.4%) | 61 (6.6%) |
| 8:30 AM to 8:59 AM | 78 (8.4%) | 35 (3.8%) |
| 9:00 AM to 9:59 AM | 38 (4.1%) | 22 (2.4%) |
| 10:00 AM to 10:59 AM | 17 (1.8%) | 88 (9.5%) |
| 11:00 AM to 11:59 AM | 14 (1.5%) | 36 (3.9%) |
| 12:00 PM to 3:59 PM | 64 (6.9%) | 32 (3.5%) |
| 4:00 PM to 11:59 PM | 87 (9.3%) | 49 (5.3%) |
| Total | 931 (100.0%) | 923 (100.0%) |
Housing Occupancy in Allegan
Occupancy by Ownership in Allegan
Of the total 1,968 dwellings in Allegan, owner-occupied units account for 1,249 (63.5%), while renter-occupied units make up 719 (36.5%).
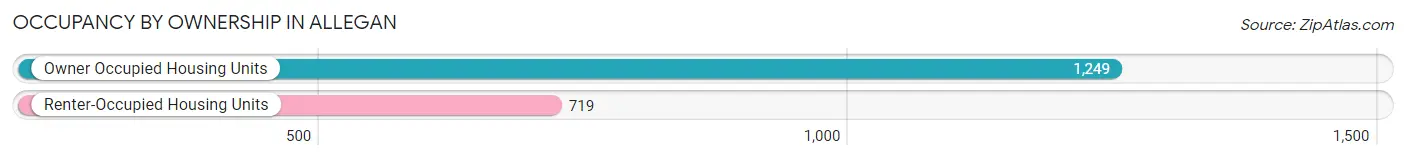
| Occupancy | # Housing Units | % Housing Units |
| Owner Occupied Housing Units | 1,249 | 63.5% |
| Renter-Occupied Housing Units | 719 | 36.5% |
| Total Occupied Housing Units | 1,968 | 100.0% |
Occupancy by Household Size in Allegan
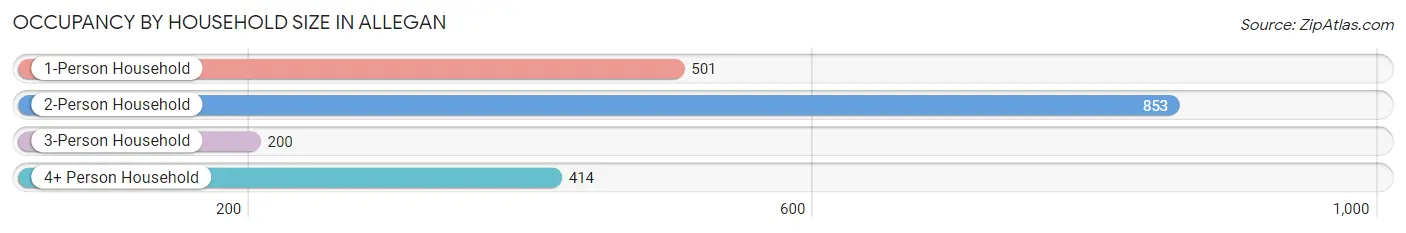
| Household Size | # Housing Units | % Housing Units |
| 1-Person Household | 501 | 25.5% |
| 2-Person Household | 853 | 43.3% |
| 3-Person Household | 200 | 10.2% |
| 4+ Person Household | 414 | 21.0% |
| Total Housing Units | 1,968 | 100.0% |
Occupancy by Ownership by Household Size in Allegan
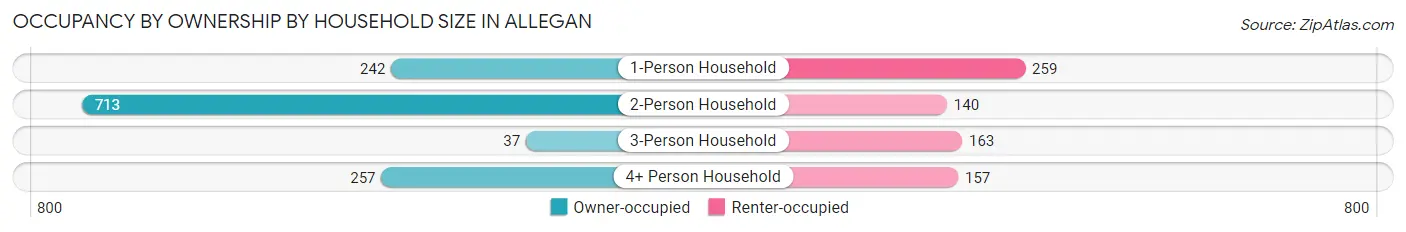
| Household Size | Owner-occupied | Renter-occupied |
| 1-Person Household | 242 (48.3%) | 259 (51.7%) |
| 2-Person Household | 713 (83.6%) | 140 (16.4%) |
| 3-Person Household | 37 (18.5%) | 163 (81.5%) |
| 4+ Person Household | 257 (62.1%) | 157 (37.9%) |
| Total Housing Units | 1,249 (63.5%) | 719 (36.5%) |
Occupancy by Educational Attainment in Allegan
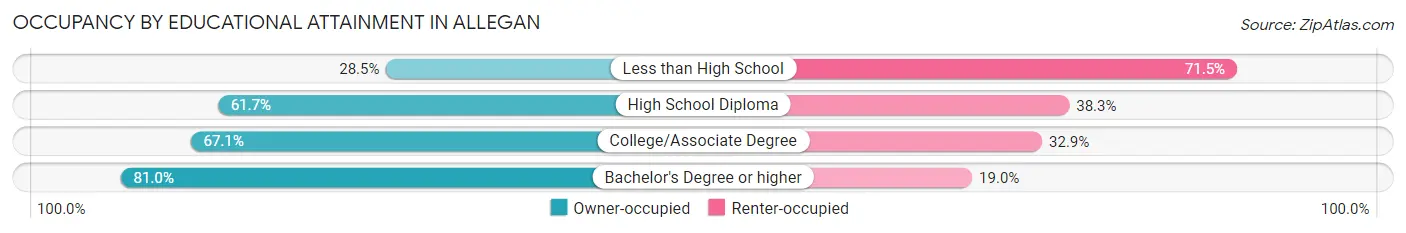
| Household Size | Owner-occupied | Renter-occupied |
| Less than High School | 43 (28.5%) | 108 (71.5%) |
| High School Diploma | 511 (61.7%) | 317 (38.3%) |
| College/Associate Degree | 512 (67.1%) | 251 (32.9%) |
| Bachelor's Degree or higher | 183 (81.0%) | 43 (19.0%) |
Occupancy by Age of Householder in Allegan
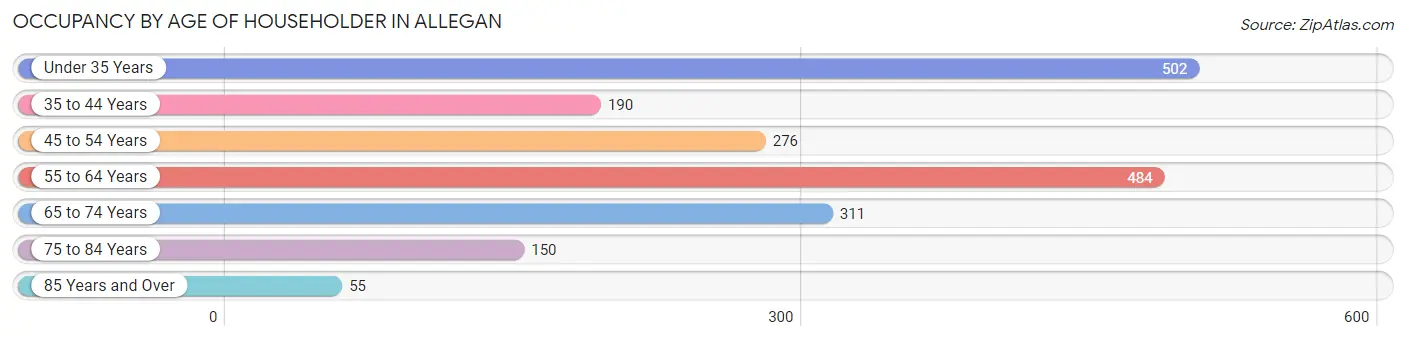
| Age Bracket | # Households | % Households |
| Under 35 Years | 502 | 25.5% |
| 35 to 44 Years | 190 | 9.7% |
| 45 to 54 Years | 276 | 14.0% |
| 55 to 64 Years | 484 | 24.6% |
| 65 to 74 Years | 311 | 15.8% |
| 75 to 84 Years | 150 | 7.6% |
| 85 Years and Over | 55 | 2.8% |
| Total | 1,968 | 100.0% |
Housing Finances in Allegan
Median Income by Occupancy in Allegan
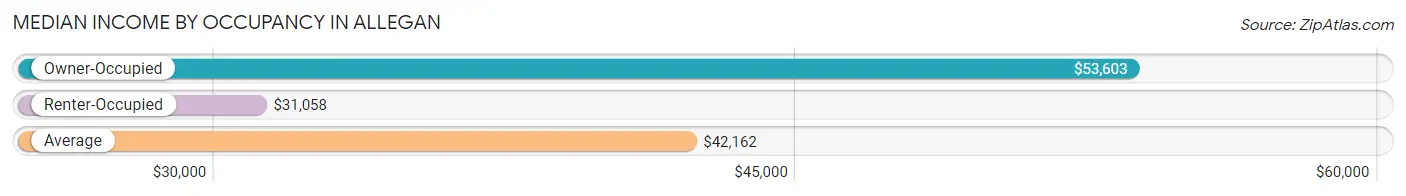
| Occupancy Type | # Households | Median Income |
| Owner-Occupied | 1,249 (63.5%) | $53,603 |
| Renter-Occupied | 719 (36.5%) | $31,058 |
| Average | 1,968 (100.0%) | $42,162 |
Occupancy by Householder Income Bracket in Allegan
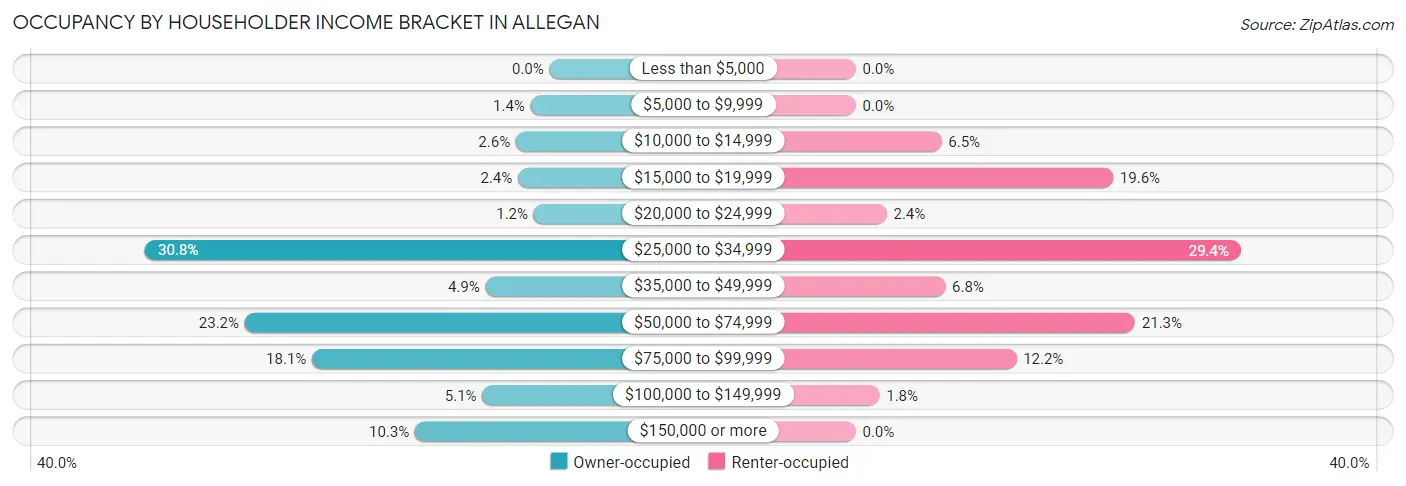
| Income Bracket | Owner-occupied | Renter-occupied |
| Less than $5,000 | 0 (0.0%) | 0 (0.0%) |
| $5,000 to $9,999 | 18 (1.4%) | 0 (0.0%) |
| $10,000 to $14,999 | 32 (2.6%) | 47 (6.5%) |
| $15,000 to $19,999 | 30 (2.4%) | 141 (19.6%) |
| $20,000 to $24,999 | 15 (1.2%) | 17 (2.4%) |
| $25,000 to $34,999 | 385 (30.8%) | 211 (29.3%) |
| $35,000 to $49,999 | 61 (4.9%) | 49 (6.8%) |
| $50,000 to $74,999 | 290 (23.2%) | 153 (21.3%) |
| $75,000 to $99,999 | 226 (18.1%) | 88 (12.2%) |
| $100,000 to $149,999 | 64 (5.1%) | 13 (1.8%) |
| $150,000 or more | 128 (10.2%) | 0 (0.0%) |
| Total | 1,249 (100.0%) | 719 (100.0%) |
Monthly Housing Cost Tiers in Allegan
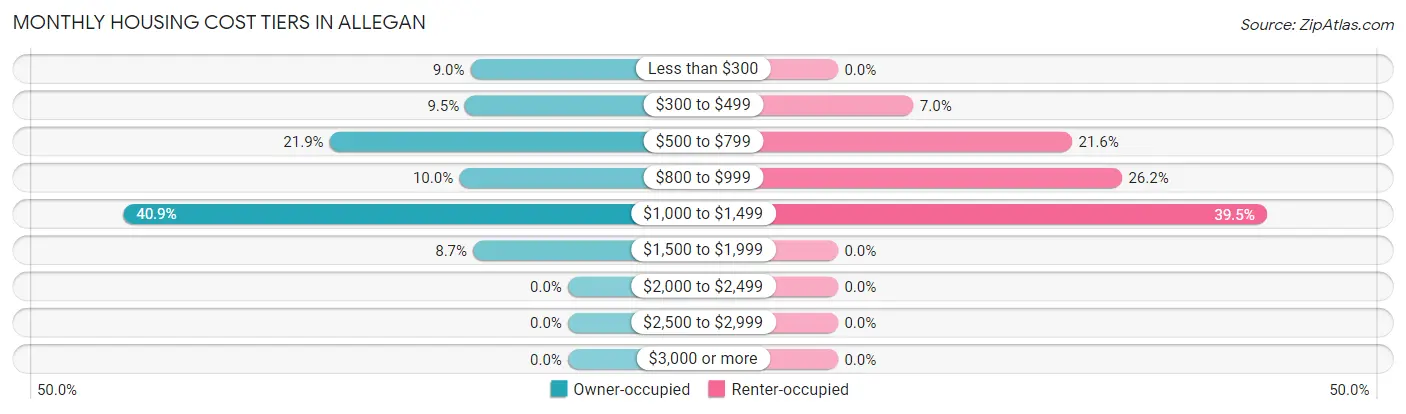
| Monthly Cost | Owner-occupied | Renter-occupied |
| Less than $300 | 112 (9.0%) | 0 (0.0%) |
| $300 to $499 | 118 (9.5%) | 50 (7.0%) |
| $500 to $799 | 274 (21.9%) | 155 (21.6%) |
| $800 to $999 | 125 (10.0%) | 188 (26.2%) |
| $1,000 to $1,499 | 511 (40.9%) | 284 (39.5%) |
| $1,500 to $1,999 | 109 (8.7%) | 0 (0.0%) |
| $2,000 to $2,499 | 0 (0.0%) | 0 (0.0%) |
| $2,500 to $2,999 | 0 (0.0%) | 0 (0.0%) |
| $3,000 or more | 0 (0.0%) | 0 (0.0%) |
| Total | 1,249 (100.0%) | 719 (100.0%) |
Physical Housing Characteristics in Allegan
Housing Structures in Allegan
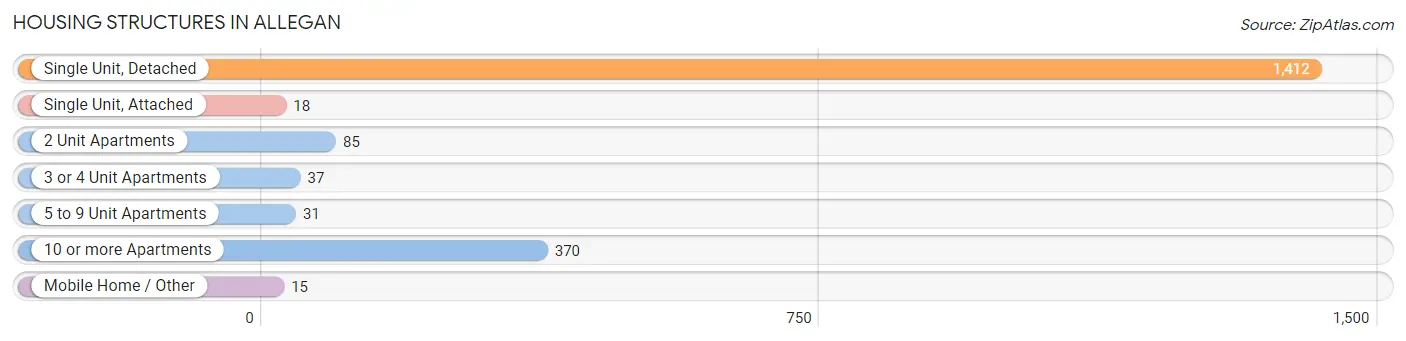
| Structure Type | # Housing Units | % Housing Units |
| Single Unit, Detached | 1,412 | 71.8% |
| Single Unit, Attached | 18 | 0.9% |
| 2 Unit Apartments | 85 | 4.3% |
| 3 or 4 Unit Apartments | 37 | 1.9% |
| 5 to 9 Unit Apartments | 31 | 1.6% |
| 10 or more Apartments | 370 | 18.8% |
| Mobile Home / Other | 15 | 0.8% |
| Total | 1,968 | 100.0% |
Housing Structures by Occupancy in Allegan
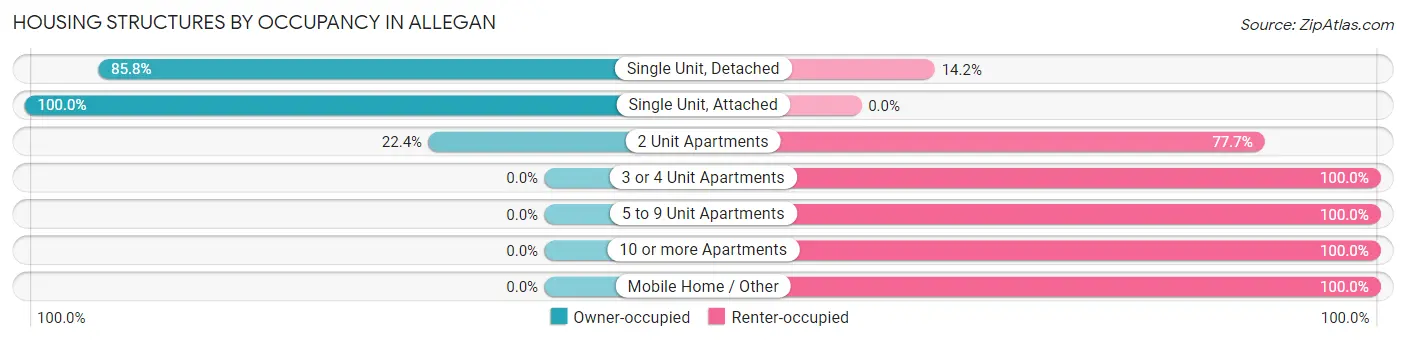
| Structure Type | Owner-occupied | Renter-occupied |
| Single Unit, Detached | 1,212 (85.8%) | 200 (14.2%) |
| Single Unit, Attached | 18 (100.0%) | 0 (0.0%) |
| 2 Unit Apartments | 19 (22.4%) | 66 (77.6%) |
| 3 or 4 Unit Apartments | 0 (0.0%) | 37 (100.0%) |
| 5 to 9 Unit Apartments | 0 (0.0%) | 31 (100.0%) |
| 10 or more Apartments | 0 (0.0%) | 370 (100.0%) |
| Mobile Home / Other | 0 (0.0%) | 15 (100.0%) |
| Total | 1,249 (63.5%) | 719 (36.5%) |
Housing Structures by Number of Rooms in Allegan
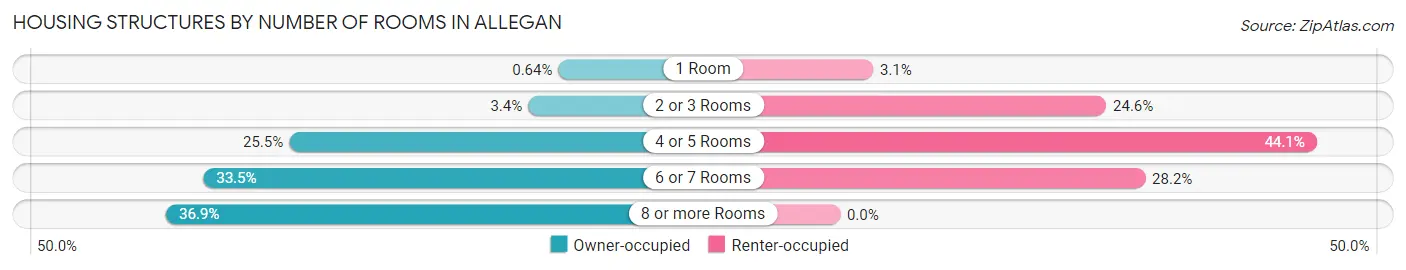
| Number of Rooms | Owner-occupied | Renter-occupied |
| 1 Room | 8 (0.6%) | 22 (3.1%) |
| 2 or 3 Rooms | 43 (3.4%) | 177 (24.6%) |
| 4 or 5 Rooms | 319 (25.5%) | 317 (44.1%) |
| 6 or 7 Rooms | 418 (33.5%) | 203 (28.2%) |
| 8 or more Rooms | 461 (36.9%) | 0 (0.0%) |
| Total | 1,249 (100.0%) | 719 (100.0%) |
Housing Structure by Heating Type in Allegan
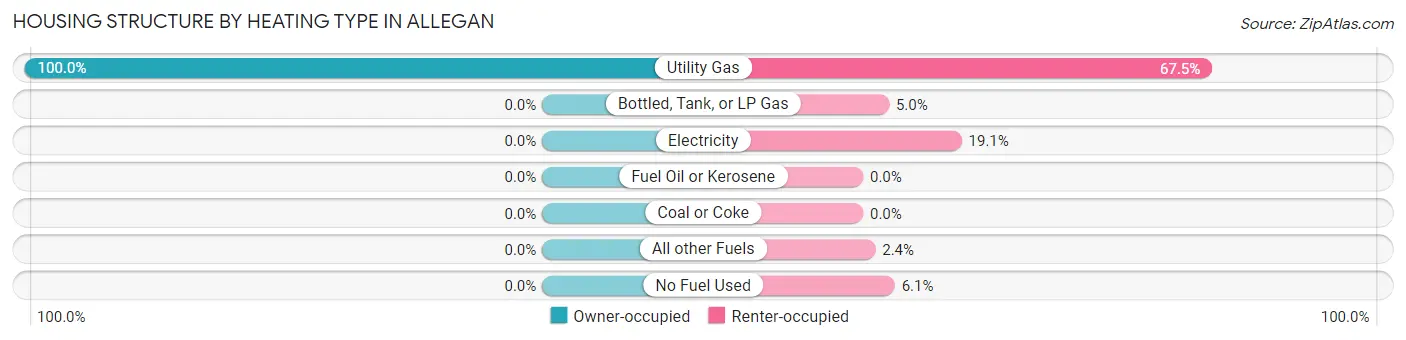
| Heating Type | Owner-occupied | Renter-occupied |
| Utility Gas | 1,249 (100.0%) | 485 (67.4%) |
| Bottled, Tank, or LP Gas | 0 (0.0%) | 36 (5.0%) |
| Electricity | 0 (0.0%) | 137 (19.1%) |
| Fuel Oil or Kerosene | 0 (0.0%) | 0 (0.0%) |
| Coal or Coke | 0 (0.0%) | 0 (0.0%) |
| All other Fuels | 0 (0.0%) | 17 (2.4%) |
| No Fuel Used | 0 (0.0%) | 44 (6.1%) |
| Total | 1,249 (100.0%) | 719 (100.0%) |
Household Vehicle Usage in Allegan
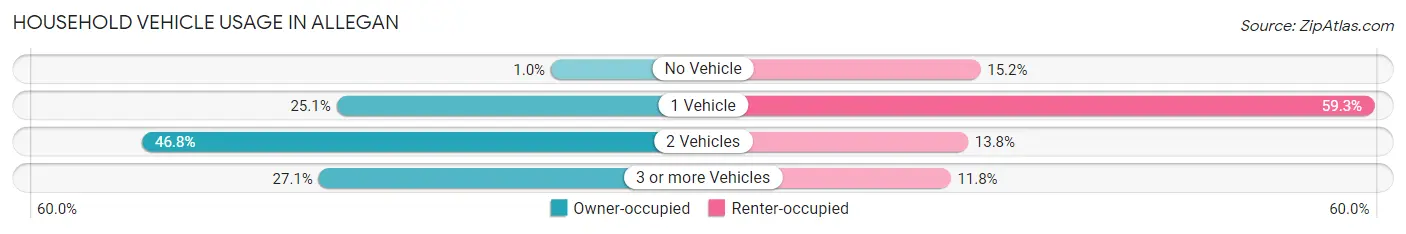
| Vehicles per Household | Owner-occupied | Renter-occupied |
| No Vehicle | 13 (1.0%) | 109 (15.2%) |
| 1 Vehicle | 313 (25.1%) | 426 (59.3%) |
| 2 Vehicles | 585 (46.8%) | 99 (13.8%) |
| 3 or more Vehicles | 338 (27.1%) | 85 (11.8%) |
| Total | 1,249 (100.0%) | 719 (100.0%) |
Real Estate & Mortgages in Allegan
Real Estate and Mortgage Overview in Allegan
| Characteristic | Without Mortgage | With Mortgage |
| Housing Units | 441 | 808 |
| Median Property Value | $132,700 | $153,000 |
| Median Household Income | $61,680 | $50 |
| Monthly Housing Costs | $468 | $0 |
| Real Estate Taxes | $1,669 | $27 |
Property Value by Mortgage Status in Allegan
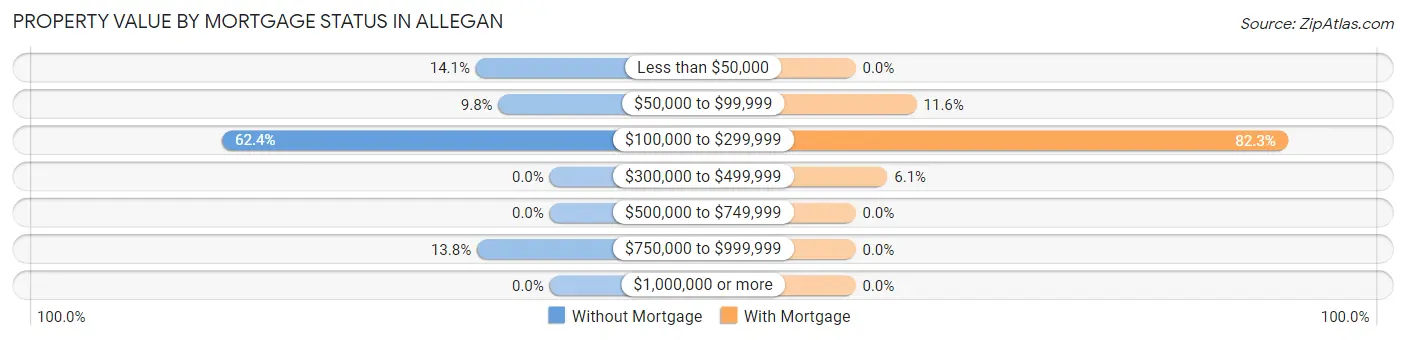
| Property Value | Without Mortgage | With Mortgage |
| Less than $50,000 | 62 (14.1%) | 0 (0.0%) |
| $50,000 to $99,999 | 43 (9.8%) | 94 (11.6%) |
| $100,000 to $299,999 | 275 (62.4%) | 665 (82.3%) |
| $300,000 to $499,999 | 0 (0.0%) | 49 (6.1%) |
| $500,000 to $749,999 | 0 (0.0%) | 0 (0.0%) |
| $750,000 to $999,999 | 61 (13.8%) | 0 (0.0%) |
| $1,000,000 or more | 0 (0.0%) | 0 (0.0%) |
| Total | 441 (100.0%) | 808 (100.0%) |
Household Income by Mortgage Status in Allegan
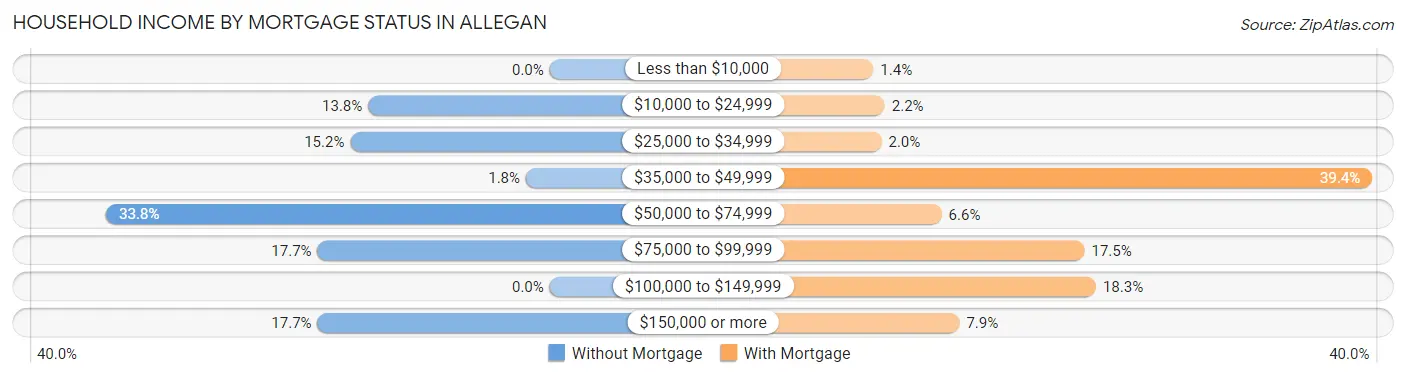
| Household Income | Without Mortgage | With Mortgage |
| Less than $10,000 | 0 (0.0%) | 11 (1.4%) |
| $10,000 to $24,999 | 61 (13.8%) | 18 (2.2%) |
| $25,000 to $34,999 | 67 (15.2%) | 16 (2.0%) |
| $35,000 to $49,999 | 8 (1.8%) | 318 (39.4%) |
| $50,000 to $74,999 | 149 (33.8%) | 53 (6.6%) |
| $75,000 to $99,999 | 78 (17.7%) | 141 (17.4%) |
| $100,000 to $149,999 | 0 (0.0%) | 148 (18.3%) |
| $150,000 or more | 78 (17.7%) | 64 (7.9%) |
| Total | 441 (100.0%) | 808 (100.0%) |
Property Value to Household Income Ratio in Allegan
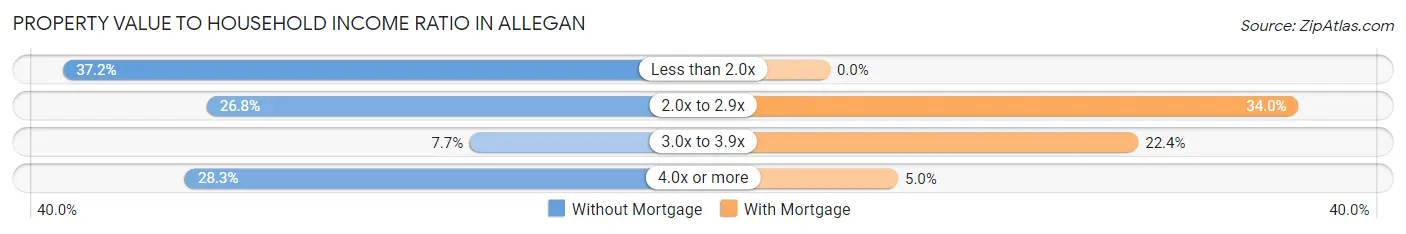
| Value-to-Income Ratio | Without Mortgage | With Mortgage |
| Less than 2.0x | 164 (37.2%) | 0 (0.0%) |
| 2.0x to 2.9x | 118 (26.8%) | 275 (34.0%) |
| 3.0x to 3.9x | 34 (7.7%) | 181 (22.4%) |
| 4.0x or more | 125 (28.3%) | 40 (5.0%) |
| Total | 441 (100.0%) | 808 (100.0%) |
Real Estate Taxes by Mortgage Status in Allegan
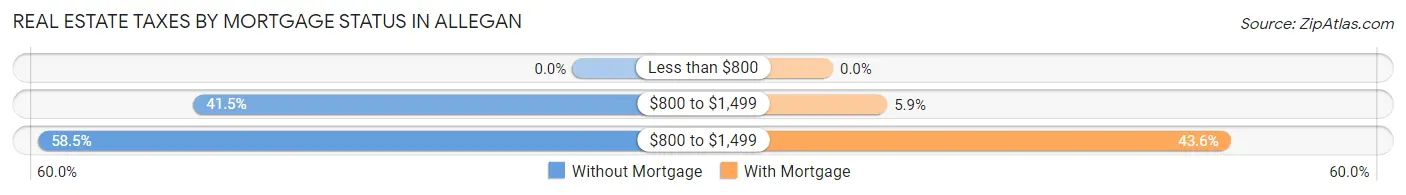
| Property Taxes | Without Mortgage | With Mortgage |
| Less than $800 | 0 (0.0%) | 0 (0.0%) |
| $800 to $1,499 | 183 (41.5%) | 48 (5.9%) |
| $800 to $1,499 | 258 (58.5%) | 352 (43.6%) |
| Total | 441 (100.0%) | 808 (100.0%) |
Health & Disability in Allegan
Health Insurance Coverage by Age in Allegan
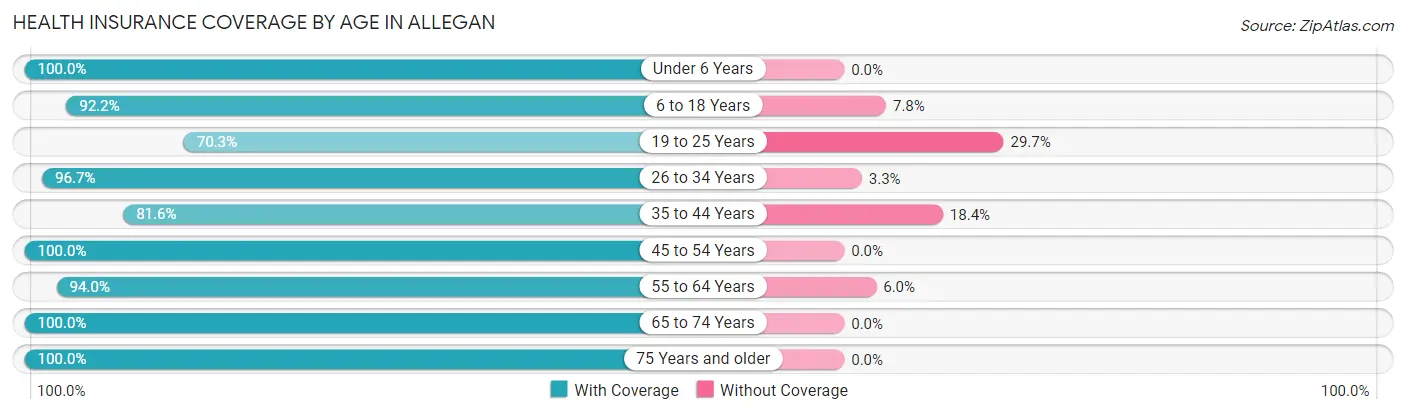
| Age Bracket | With Coverage | Without Coverage |
| Under 6 Years | 434 (100.0%) | 0 (0.0%) |
| 6 to 18 Years | 747 (92.2%) | 63 (7.8%) |
| 19 to 25 Years | 580 (70.3%) | 245 (29.7%) |
| 26 to 34 Years | 560 (96.7%) | 19 (3.3%) |
| 35 to 44 Years | 284 (81.6%) | 64 (18.4%) |
| 45 to 54 Years | 379 (100.0%) | 0 (0.0%) |
| 55 to 64 Years | 758 (94.0%) | 48 (6.0%) |
| 65 to 74 Years | 416 (100.0%) | 0 (0.0%) |
| 75 Years and older | 371 (100.0%) | 0 (0.0%) |
| Total | 4,529 (91.2%) | 439 (8.8%) |
Health Insurance Coverage by Citizenship Status in Allegan
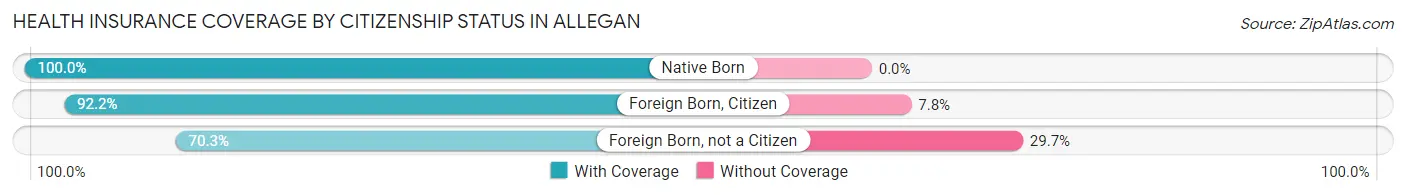
| Citizenship Status | With Coverage | Without Coverage |
| Native Born | 434 (100.0%) | 0 (0.0%) |
| Foreign Born, Citizen | 747 (92.2%) | 63 (7.8%) |
| Foreign Born, not a Citizen | 580 (70.3%) | 245 (29.7%) |
Health Insurance Coverage by Household Income in Allegan
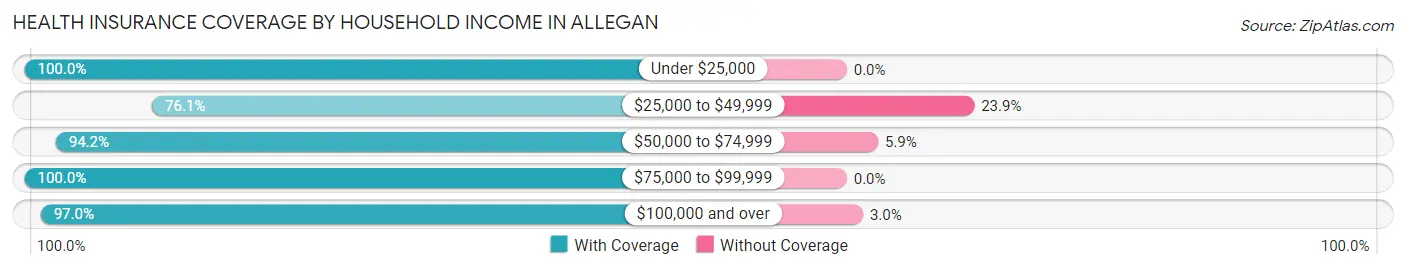
| Household Income | With Coverage | Without Coverage |
| Under $25,000 | 516 (100.0%) | 0 (0.0%) |
| $25,000 to $49,999 | 1,125 (76.1%) | 353 (23.9%) |
| $50,000 to $74,999 | 1,014 (94.2%) | 63 (5.9%) |
| $75,000 to $99,999 | 1,109 (100.0%) | 0 (0.0%) |
| $100,000 and over | 736 (97.0%) | 23 (3.0%) |
Public vs Private Health Insurance Coverage by Age in Allegan
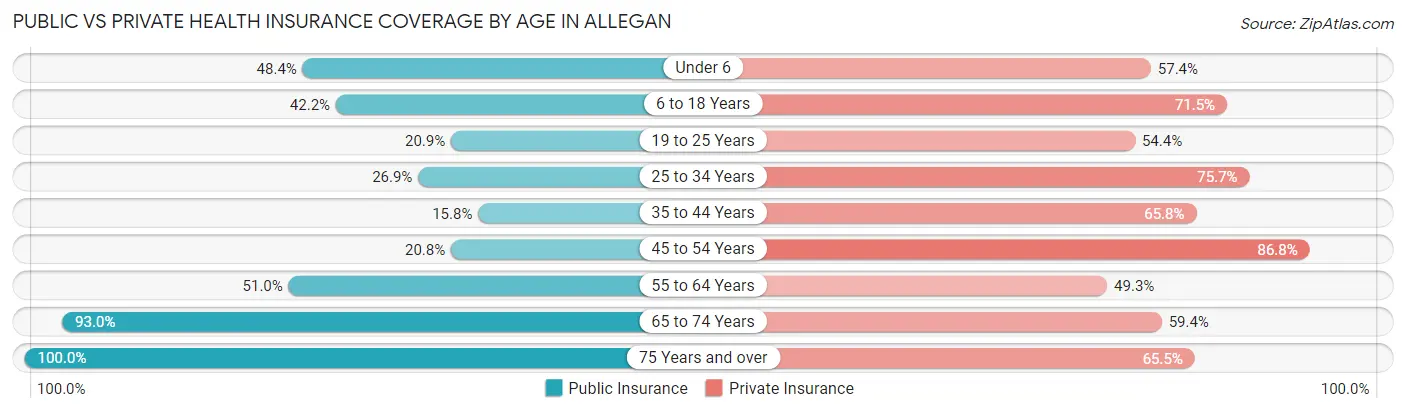
| Age Bracket | Public Insurance | Private Insurance |
| Under 6 | 210 (48.4%) | 249 (57.4%) |
| 6 to 18 Years | 342 (42.2%) | 579 (71.5%) |
| 19 to 25 Years | 172 (20.8%) | 449 (54.4%) |
| 25 to 34 Years | 156 (26.9%) | 438 (75.6%) |
| 35 to 44 Years | 55 (15.8%) | 229 (65.8%) |
| 45 to 54 Years | 79 (20.8%) | 329 (86.8%) |
| 55 to 64 Years | 411 (51.0%) | 397 (49.3%) |
| 65 to 74 Years | 387 (93.0%) | 247 (59.4%) |
| 75 Years and over | 371 (100.0%) | 243 (65.5%) |
| Total | 2,183 (43.9%) | 3,160 (63.6%) |
Disability Status by Sex by Age in Allegan
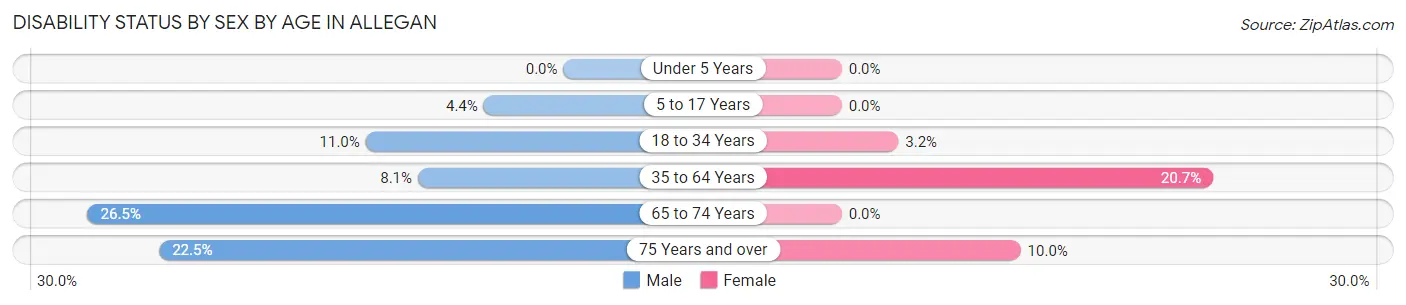
| Age Bracket | Male | Female |
| Under 5 Years | 0 (0.0%) | 0 (0.0%) |
| 5 to 17 Years | 15 (4.4%) | 0 (0.0%) |
| 18 to 34 Years | 97 (11.0%) | 19 (3.2%) |
| 35 to 64 Years | 54 (8.1%) | 179 (20.7%) |
| 65 to 74 Years | 40 (26.5%) | 0 (0.0%) |
| 75 Years and over | 27 (22.5%) | 25 (10.0%) |
Disability Class by Sex by Age in Allegan
Disability Class: Hearing Difficulty
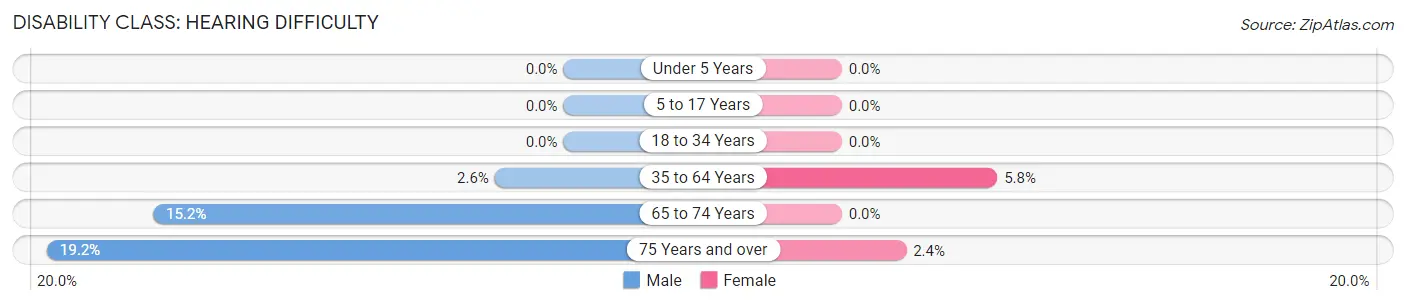
| Age Bracket | Male | Female |
| Under 5 Years | 0 (0.0%) | 0 (0.0%) |
| 5 to 17 Years | 0 (0.0%) | 0 (0.0%) |
| 18 to 34 Years | 0 (0.0%) | 0 (0.0%) |
| 35 to 64 Years | 17 (2.5%) | 50 (5.8%) |
| 65 to 74 Years | 23 (15.2%) | 0 (0.0%) |
| 75 Years and over | 23 (19.2%) | 6 (2.4%) |
Disability Class: Vision Difficulty
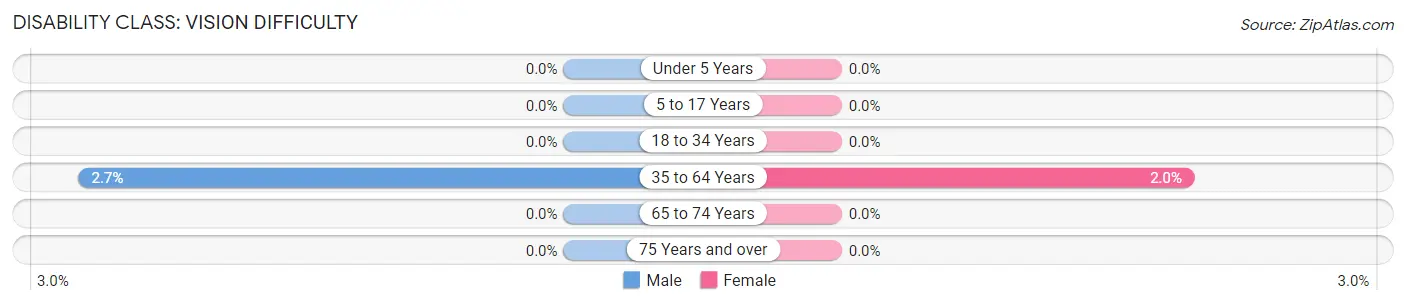
| Age Bracket | Male | Female |
| Under 5 Years | 0 (0.0%) | 0 (0.0%) |
| 5 to 17 Years | 0 (0.0%) | 0 (0.0%) |
| 18 to 34 Years | 0 (0.0%) | 0 (0.0%) |
| 35 to 64 Years | 18 (2.7%) | 17 (2.0%) |
| 65 to 74 Years | 0 (0.0%) | 0 (0.0%) |
| 75 Years and over | 0 (0.0%) | 0 (0.0%) |
Disability Class: Cognitive Difficulty
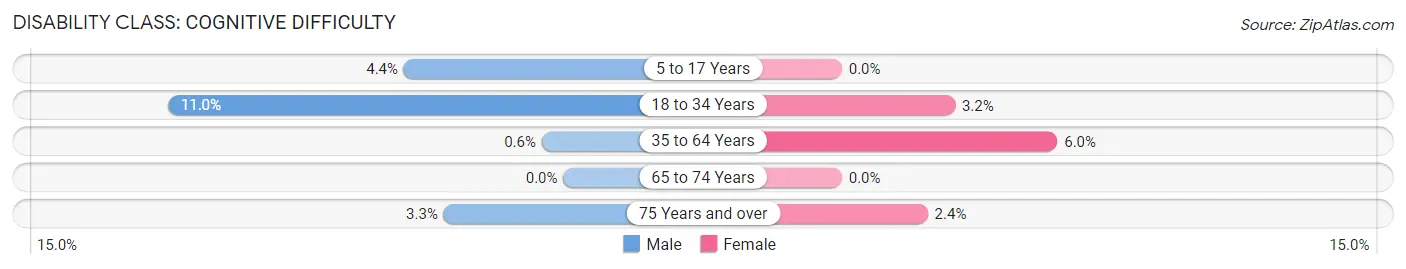
| Age Bracket | Male | Female |
| 5 to 17 Years | 15 (4.4%) | 0 (0.0%) |
| 18 to 34 Years | 97 (11.0%) | 19 (3.2%) |
| 35 to 64 Years | 4 (0.6%) | 52 (6.0%) |
| 65 to 74 Years | 0 (0.0%) | 0 (0.0%) |
| 75 Years and over | 4 (3.3%) | 6 (2.4%) |
Disability Class: Ambulatory Difficulty
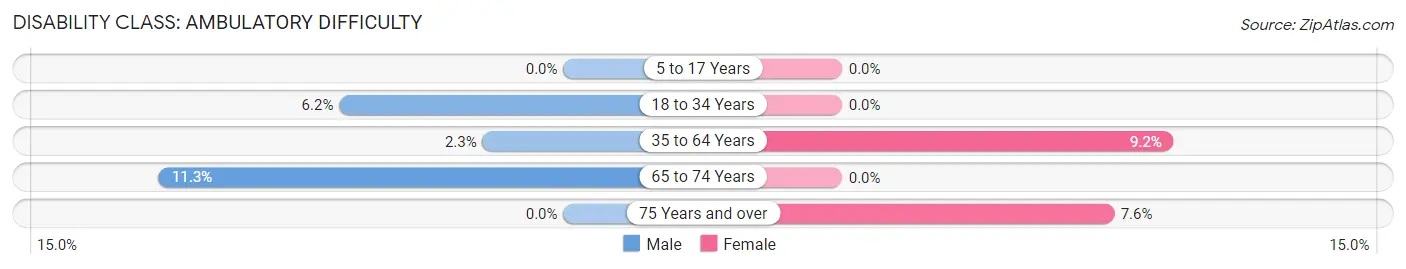
| Age Bracket | Male | Female |
| 5 to 17 Years | 0 (0.0%) | 0 (0.0%) |
| 18 to 34 Years | 55 (6.2%) | 0 (0.0%) |
| 35 to 64 Years | 15 (2.2%) | 80 (9.2%) |
| 65 to 74 Years | 17 (11.3%) | 0 (0.0%) |
| 75 Years and over | 0 (0.0%) | 19 (7.6%) |
Disability Class: Self-Care Difficulty
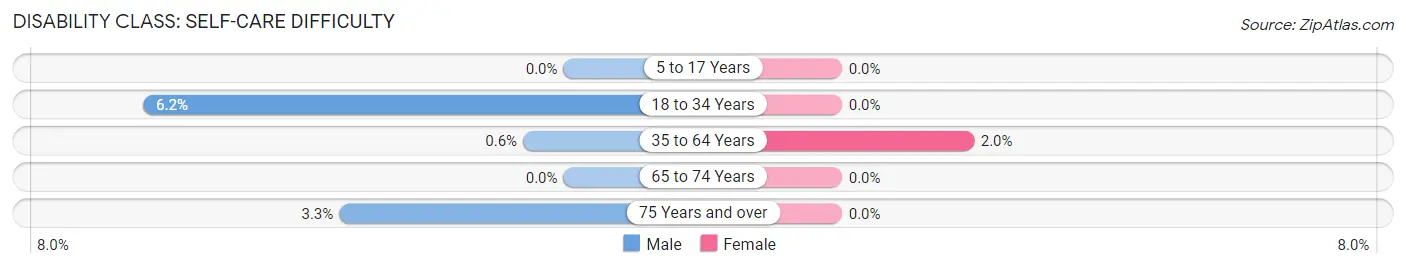
| Age Bracket | Male | Female |
| 5 to 17 Years | 0 (0.0%) | 0 (0.0%) |
| 18 to 34 Years | 55 (6.2%) | 0 (0.0%) |
| 35 to 64 Years | 4 (0.6%) | 17 (2.0%) |
| 65 to 74 Years | 0 (0.0%) | 0 (0.0%) |
| 75 Years and over | 4 (3.3%) | 0 (0.0%) |
Technology Access in Allegan
Computing Device Access in Allegan
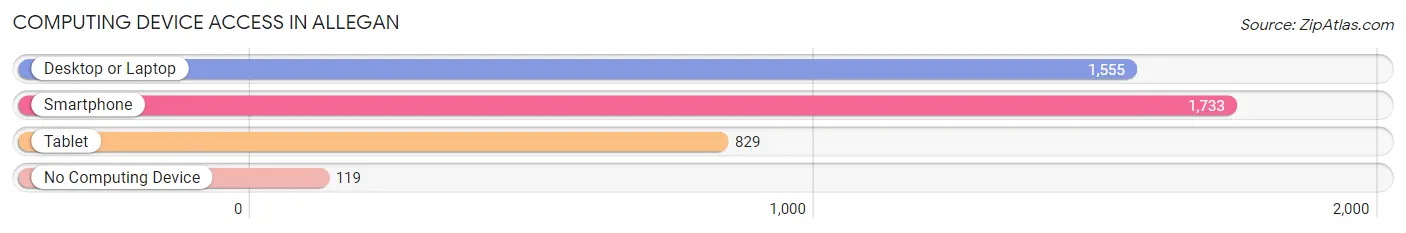
| Device Type | # Households | % Households |
| Desktop or Laptop | 1,555 | 79.0% |
| Smartphone | 1,733 | 88.1% |
| Tablet | 829 | 42.1% |
| No Computing Device | 119 | 6.0% |
| Total | 1,968 | 100.0% |
Internet Access in Allegan
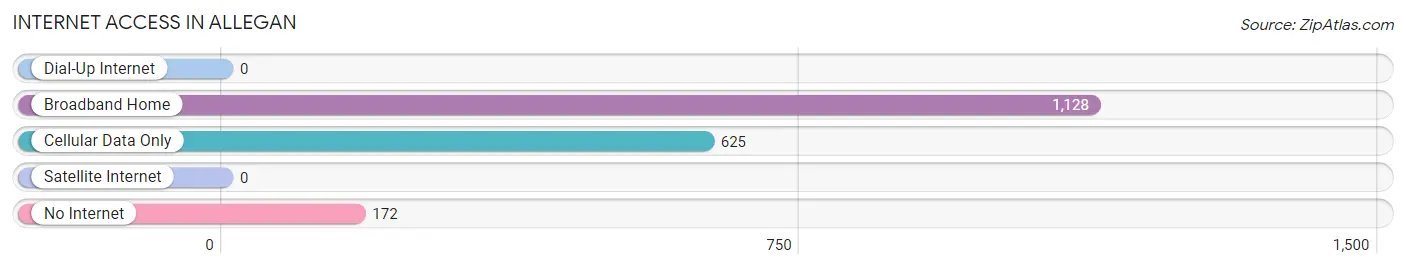
| Internet Type | # Households | % Households |
| Dial-Up Internet | 0 | 0.0% |
| Broadband Home | 1,128 | 57.3% |
| Cellular Data Only | 625 | 31.8% |
| Satellite Internet | 0 | 0.0% |
| No Internet | 172 | 8.7% |
| Total | 1,968 | 100.0% |
Allegan Summary
Allegan is a city located in the southwestern corner of Michigan, in Allegan County. It is situated on the Kalamazoo River, about 40 miles south of Grand Rapids. The city has a population of 5,076, according to the 2010 census.
History
The area that is now Allegan was first settled in 1833 by a group of settlers from New York. The settlement was originally called "Alleganville" and was located on the banks of the Kalamazoo River. The name was changed to Allegan in 1837.
The city was incorporated in 1855 and was an important stop on the Grand Rapids and Indiana Railroad. The railroad brought new industry to the area, including a sawmill, a grist mill, and a woolen mill.
In the late 19th century, Allegan became a popular tourist destination. The city was home to several resorts, including the Allegan House, the Allegan Hotel, and the Allegan Inn.
Geography
Allegan is located in the southwestern corner of Michigan, in Allegan County. It is situated on the Kalamazoo River, about 40 miles south of Grand Rapids. The city has a total area of 4.2 square miles, all of which is land.
The city is located in a hilly region of Michigan, with the highest point being the Allegan State Game Area, which is located just south of the city. The city is also home to several lakes, including Lake Allegan, Lake Doster, and Lake Michigan.
Economy
Allegan's economy is largely based on manufacturing and agriculture. The city is home to several manufacturing companies, including Allegan Plastics, Allegan Tool & Die, and Allegan Metal Products.
Agriculture is also an important part of the local economy. The city is home to several farms, including dairy farms, vegetable farms, and fruit farms.
Demographics
As of the 2010 census, Allegan had a population of 5,076. The racial makeup of the city was 94.2% White, 1.3% African American, 0.7% Native American, 0.7% Asian, 0.1% Pacific Islander, 1.2% from other races, and 1.9% from two or more races. Hispanic or Latino of any race were 3.2% of the population.
The median household income in Allegan was $41,945, and the median family income was $50,919. The per capita income for the city was $20,945. About 11.2% of families and 14.2% of the population were below the poverty line, including 19.2% of those under age 18 and 8.2% of those age 65 or over.
Common Questions
What is Per Capita Income in Allegan?
Per Capita income in Allegan is $23,306.
What is the Median Family Income in Allegan?
Median Family Income in Allegan is $52,083.
What is the Median Household income in Allegan?
Median Household Income in Allegan is $42,162.
What is Income or Wage Gap in Allegan?
Income or Wage Gap in Allegan is 15.9%.
Women in Allegan earn 84.1 cents for every dollar earned by a man.
What is Inequality or Gini Index in Allegan?
Inequality or Gini Index in Allegan is 0.38.
What is the Total Population of Allegan?
Total Population of Allegan is 5,180.
What is the Total Male Population of Allegan?
Total Male Population of Allegan is 2,538.
What is the Total Female Population of Allegan?
Total Female Population of Allegan is 2,642.
What is the Ratio of Males per 100 Females in Allegan?
There are 96.06 Males per 100 Females in Allegan.
What is the Ratio of Females per 100 Males in Allegan?
There are 104.10 Females per 100 Males in Allegan.
What is the Median Population Age in Allegan?
Median Population Age in Allegan is 34.1 Years.
What is the Average Family Size in Allegan
Average Family Size in Allegan is 3.0 People.
What is the Average Household Size in Allegan
Average Household Size in Allegan is 2.5 People.
How Large is the Labor Force in Allegan?
There are 2,034 People in the Labor Forcein in Allegan.
What is the Percentage of People in the Labor Force in Allegan?
49.0% of People are in the Labor Force in Allegan.
What is the Unemployment Rate in Allegan?
Unemployment Rate in Allegan is 2.7%.