Portage, MI Map & Demographics
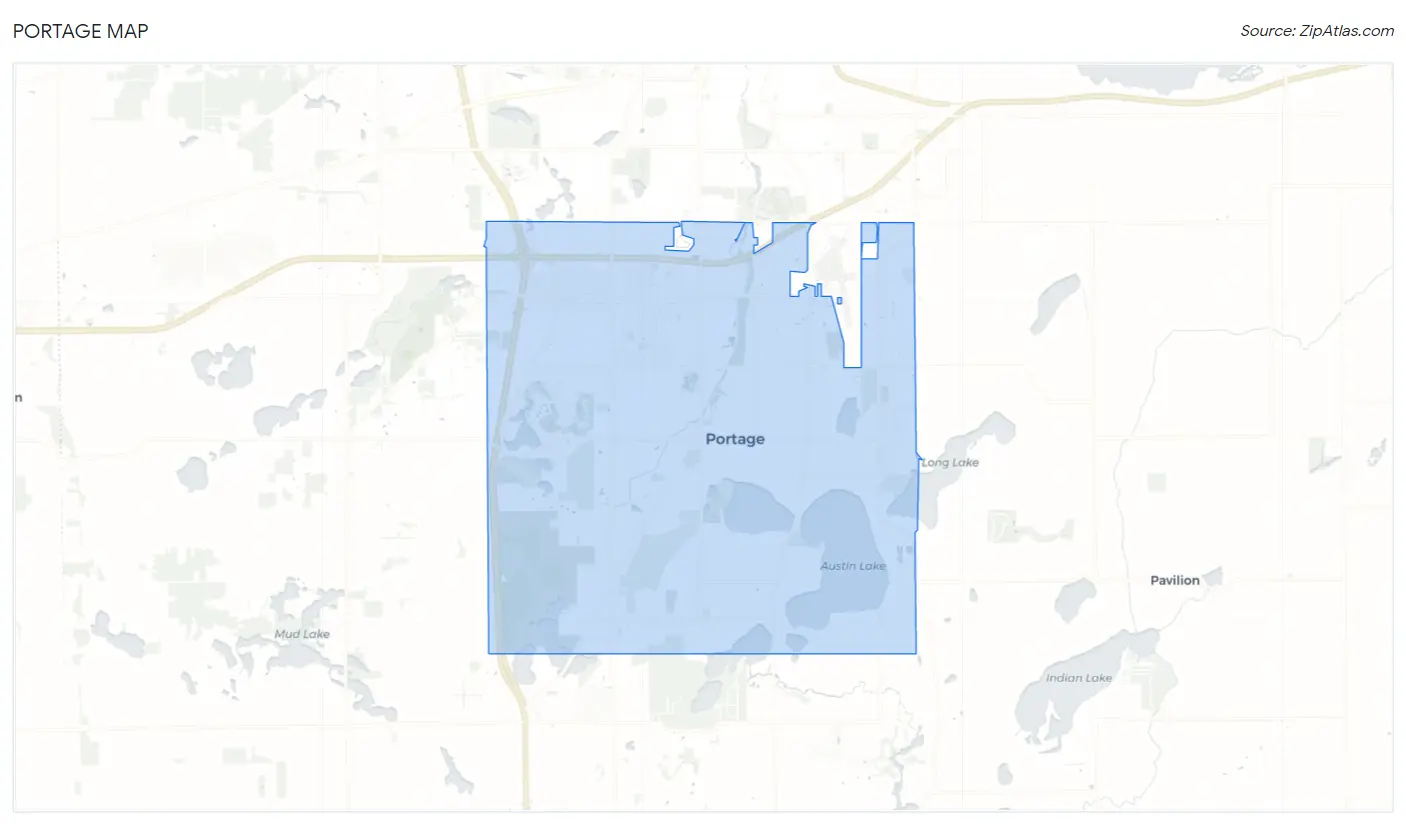
Portage Map
Portage Overview
$42,122
PER CAPITA INCOME
$102,922
AVG FAMILY INCOME
$74,837
AVG HOUSEHOLD INCOME
32.8%
WAGE / INCOME GAP [ % ]
67.2¢/ $1
WAGE / INCOME GAP [ $ ]
0.43
INEQUALITY / GINI INDEX
48,936
TOTAL POPULATION
23,889
MALE POPULATION
25,047
FEMALE POPULATION
95.38
MALES / 100 FEMALES
104.85
FEMALES / 100 MALES
36.7
MEDIAN AGE
3.1
AVG FAMILY SIZE
2.4
AVG HOUSEHOLD SIZE
27,066
LABOR FORCE [ PEOPLE ]
69.0%
PERCENT IN LABOR FORCE
6.1%
UNEMPLOYMENT RATE
Portage Area Codes
Income in Portage
Income Overview in Portage
Per Capita Income in Portage is $42,122, while median incomes of families and households are $102,922 and $74,837 respectively.
| Characteristic | Number | Measure |
| Per Capita Income | 48,936 | $42,122 |
| Median Family Income | 12,469 | $102,922 |
| Mean Family Income | 12,469 | $123,915 |
| Median Household Income | 20,370 | $74,837 |
| Mean Household Income | 20,370 | $99,510 |
| Income Deficit | 12,469 | $0 |
| Wage / Income Gap (%) | 48,936 | 32.82% |
| Wage / Income Gap ($) | 48,936 | 67.18¢ per $1 |
| Gini / Inequality Index | 48,936 | 0.43 |
Earnings by Sex in Portage
Average Earnings in Portage are $44,724, $52,991 for men and $35,600 for women, a difference of 32.8%.
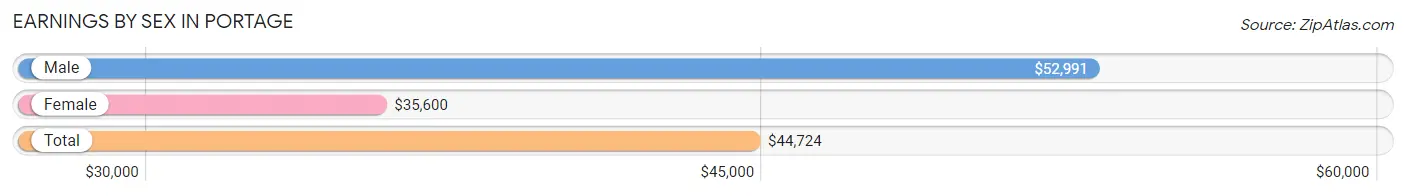
| Sex | Number | Average Earnings |
| Male | 14,528 (52.1%) | $52,991 |
| Female | 13,370 (47.9%) | $35,600 |
| Total | 27,898 (100.0%) | $44,724 |
Earnings by Sex by Income Bracket in Portage
The most common earnings brackets in Portage are $100,000+ for men (3,081 | 21.2%) and $100,000+ for women (1,286 | 9.6%).
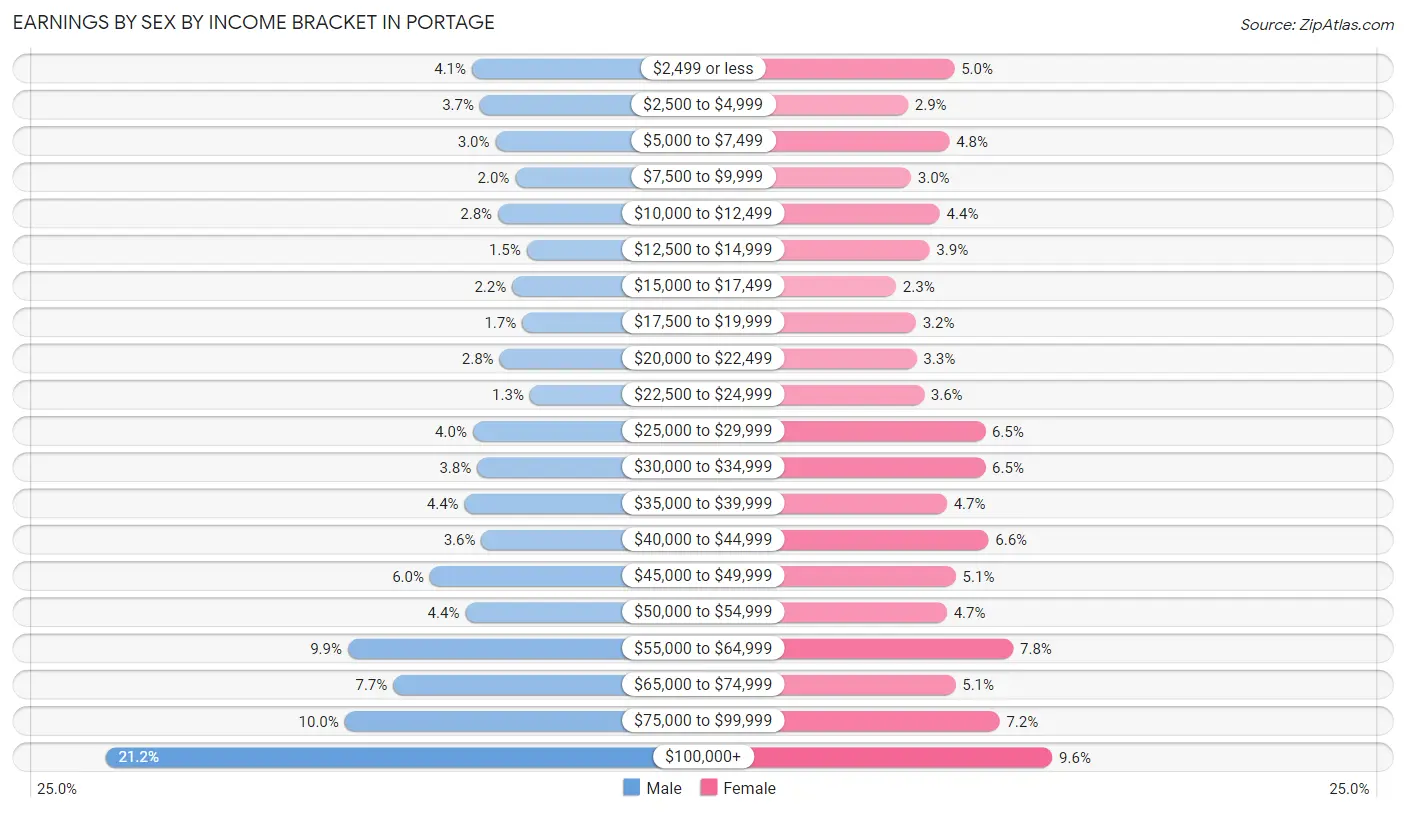
| Income | Male | Female |
| $2,499 or less | 588 (4.1%) | 673 (5.0%) |
| $2,500 to $4,999 | 535 (3.7%) | 382 (2.9%) |
| $5,000 to $7,499 | 428 (2.9%) | 642 (4.8%) |
| $7,500 to $9,999 | 293 (2.0%) | 401 (3.0%) |
| $10,000 to $12,499 | 411 (2.8%) | 582 (4.3%) |
| $12,500 to $14,999 | 217 (1.5%) | 518 (3.9%) |
| $15,000 to $17,499 | 315 (2.2%) | 307 (2.3%) |
| $17,500 to $19,999 | 247 (1.7%) | 432 (3.2%) |
| $20,000 to $22,499 | 401 (2.8%) | 436 (3.3%) |
| $22,500 to $24,999 | 194 (1.3%) | 482 (3.6%) |
| $25,000 to $29,999 | 583 (4.0%) | 865 (6.5%) |
| $30,000 to $34,999 | 553 (3.8%) | 867 (6.5%) |
| $35,000 to $39,999 | 639 (4.4%) | 626 (4.7%) |
| $40,000 to $44,999 | 525 (3.6%) | 886 (6.6%) |
| $45,000 to $49,999 | 874 (6.0%) | 682 (5.1%) |
| $50,000 to $54,999 | 633 (4.4%) | 626 (4.7%) |
| $55,000 to $64,999 | 1,432 (9.9%) | 1,042 (7.8%) |
| $65,000 to $74,999 | 1,125 (7.7%) | 679 (5.1%) |
| $75,000 to $99,999 | 1,454 (10.0%) | 956 (7.1%) |
| $100,000+ | 3,081 (21.2%) | 1,286 (9.6%) |
| Total | 14,528 (100.0%) | 13,370 (100.0%) |
Earnings by Sex by Educational Attainment in Portage
Average earnings in Portage are $61,872 for men and $43,895 for women, a difference of 29.1%. Men with an educational attainment of graduate degree enjoy the highest average annual earnings of $105,711, while those with less than high school education earn the least with $39,500. Women with an educational attainment of graduate degree earn the most with the average annual earnings of $72,600, while those with less than high school education have the smallest earnings of $26,744.
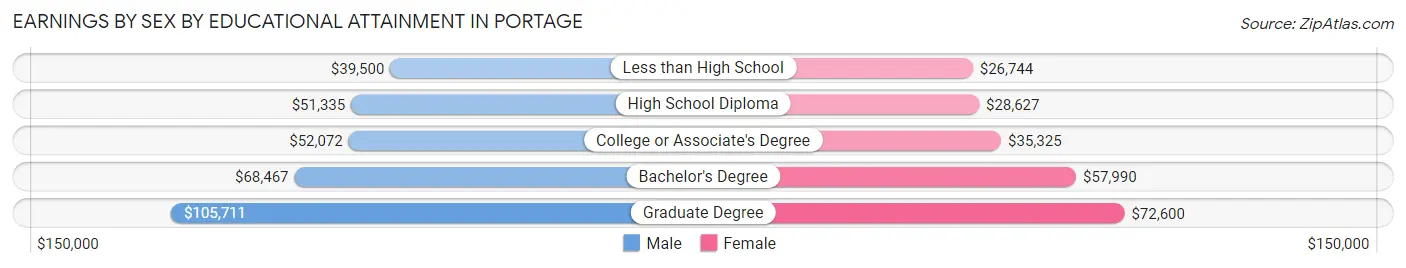
| Educational Attainment | Male Income | Female Income |
| Less than High School | $39,500 | $26,744 |
| High School Diploma | $51,335 | $28,627 |
| College or Associate's Degree | $52,072 | $35,325 |
| Bachelor's Degree | $68,467 | $57,990 |
| Graduate Degree | $105,711 | $72,600 |
| Total | $61,872 | $43,895 |
Family Income in Portage
Family Income Brackets in Portage
According to the Portage family income data, there are 2,855 families falling into the $100,000 to $149,999 income range, which is the most common income bracket and makes up 22.9% of all families. Conversely, the $10,000 to $14,999 income bracket is the least frequent group with only 137 families (1.1%) belonging to this category.
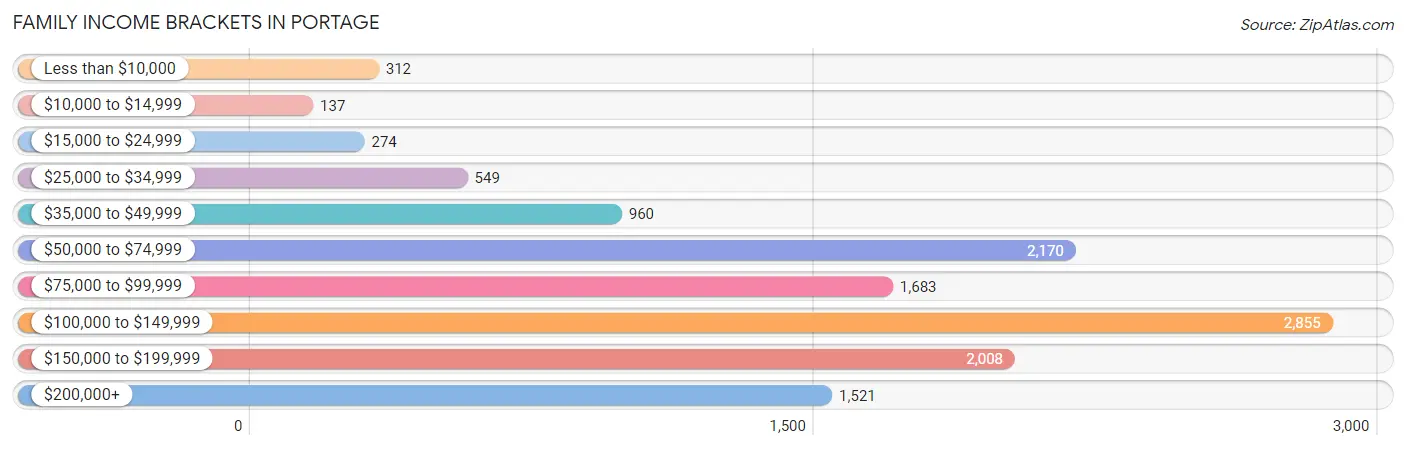
| Income Bracket | # Families | % Families |
| Less than $10,000 | 312 | 2.5% |
| $10,000 to $14,999 | 137 | 1.1% |
| $15,000 to $24,999 | 274 | 2.2% |
| $25,000 to $34,999 | 549 | 4.4% |
| $35,000 to $49,999 | 960 | 7.7% |
| $50,000 to $74,999 | 2,170 | 17.4% |
| $75,000 to $99,999 | 1,683 | 13.5% |
| $100,000 to $149,999 | 2,855 | 22.9% |
| $150,000 to $199,999 | 2,008 | 16.1% |
| $200,000+ | 1,521 | 12.2% |
Family Income by Famaliy Size in Portage
7+ person families (69 | 0.5%) account for the highest median family income in Portage with $171,319 per family, while 2-person families (5,947 | 47.7%) have the highest median income of $43,848 per family member.
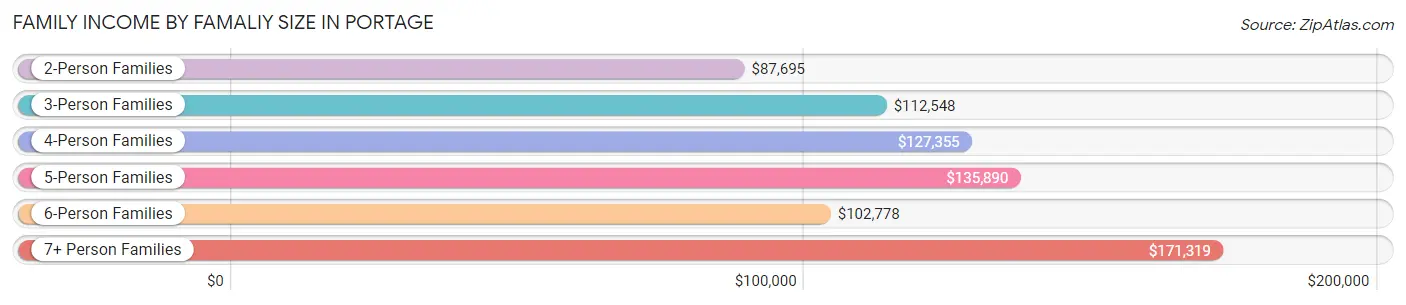
| Income Bracket | # Families | Median Income |
| 2-Person Families | 5,947 (47.7%) | $87,695 |
| 3-Person Families | 2,662 (21.3%) | $112,548 |
| 4-Person Families | 2,618 (21.0%) | $127,355 |
| 5-Person Families | 945 (7.6%) | $135,890 |
| 6-Person Families | 228 (1.8%) | $102,778 |
| 7+ Person Families | 69 (0.5%) | $171,319 |
| Total | 12,469 (100.0%) | $102,922 |
Family Income by Number of Earners in Portage
The median family income in Portage is $102,922, with families comprising 3+ earners (1,581) having the highest median family income of $151,044, while families with 1 earner (3,720) have the lowest median family income of $70,903, accounting for 12.7% and 29.8% of families, respectively.
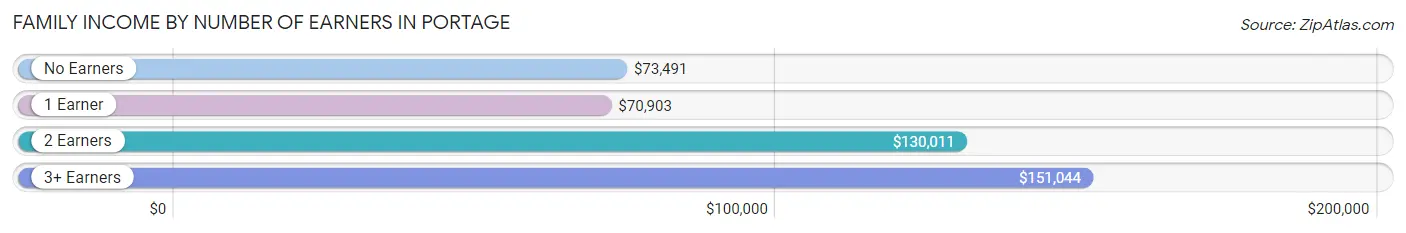
| Number of Earners | # Families | Median Income |
| No Earners | 1,887 (15.1%) | $73,491 |
| 1 Earner | 3,720 (29.8%) | $70,903 |
| 2 Earners | 5,281 (42.3%) | $130,011 |
| 3+ Earners | 1,581 (12.7%) | $151,044 |
| Total | 12,469 (100.0%) | $102,922 |
Household Income in Portage
Household Income Brackets in Portage
With 4,196 households falling in the category, the $50,000 to $74,999 income range is the most frequent in Portage, accounting for 20.6% of all households. In contrast, only 469 households (2.3%) fall into the $10,000 to $14,999 income bracket, making it the least populous group.
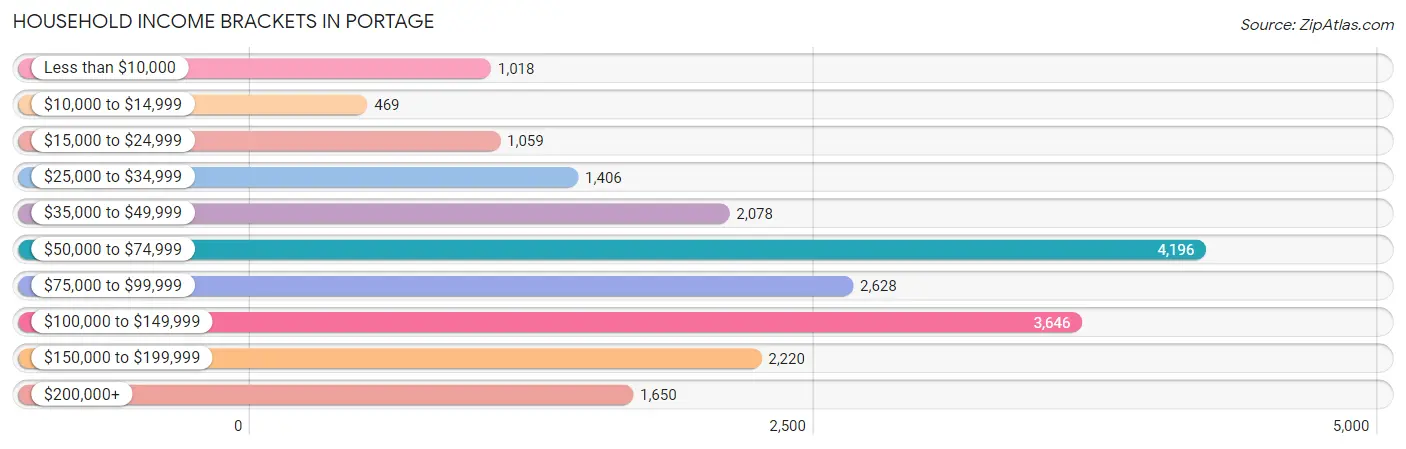
| Income Bracket | # Households | % Households |
| Less than $10,000 | 1,018 | 5.0% |
| $10,000 to $14,999 | 469 | 2.3% |
| $15,000 to $24,999 | 1,059 | 5.2% |
| $25,000 to $34,999 | 1,406 | 6.9% |
| $35,000 to $49,999 | 2,078 | 10.2% |
| $50,000 to $74,999 | 4,196 | 20.6% |
| $75,000 to $99,999 | 2,628 | 12.9% |
| $100,000 to $149,999 | 3,646 | 17.9% |
| $150,000 to $199,999 | 2,220 | 10.9% |
| $200,000+ | 1,650 | 8.1% |
Household Income by Householder Age in Portage
The median household income in Portage is $74,837, with the highest median household income of $100,430 found in the 45 to 64 years age bracket for the primary householder. A total of 6,667 households (32.7%) fall into this category. Meanwhile, the 15 to 24 years age bracket for the primary householder has the lowest median household income of $48,681, with 1,471 households (7.2%) in this group.
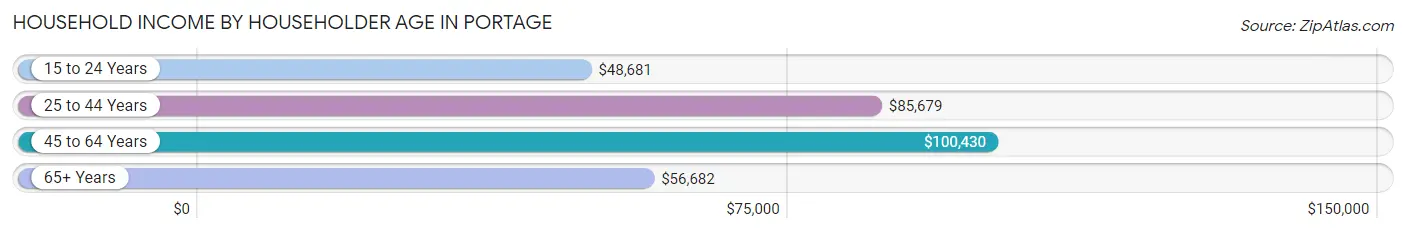
| Income Bracket | # Households | Median Income |
| 15 to 24 Years | 1,471 (7.2%) | $48,681 |
| 25 to 44 Years | 6,789 (33.3%) | $85,679 |
| 45 to 64 Years | 6,667 (32.7%) | $100,430 |
| 65+ Years | 5,443 (26.7%) | $56,682 |
| Total | 20,370 (100.0%) | $74,837 |
Poverty in Portage
Income Below Poverty by Sex and Age in Portage
With 6.6% poverty level for males and 8.9% for females among the residents of Portage, under 5 year old males and 18 to 24 year old females are the most vulnerable to poverty, with 268 males (17.6%) and 577 females (23.0%) in their respective age groups living below the poverty level.
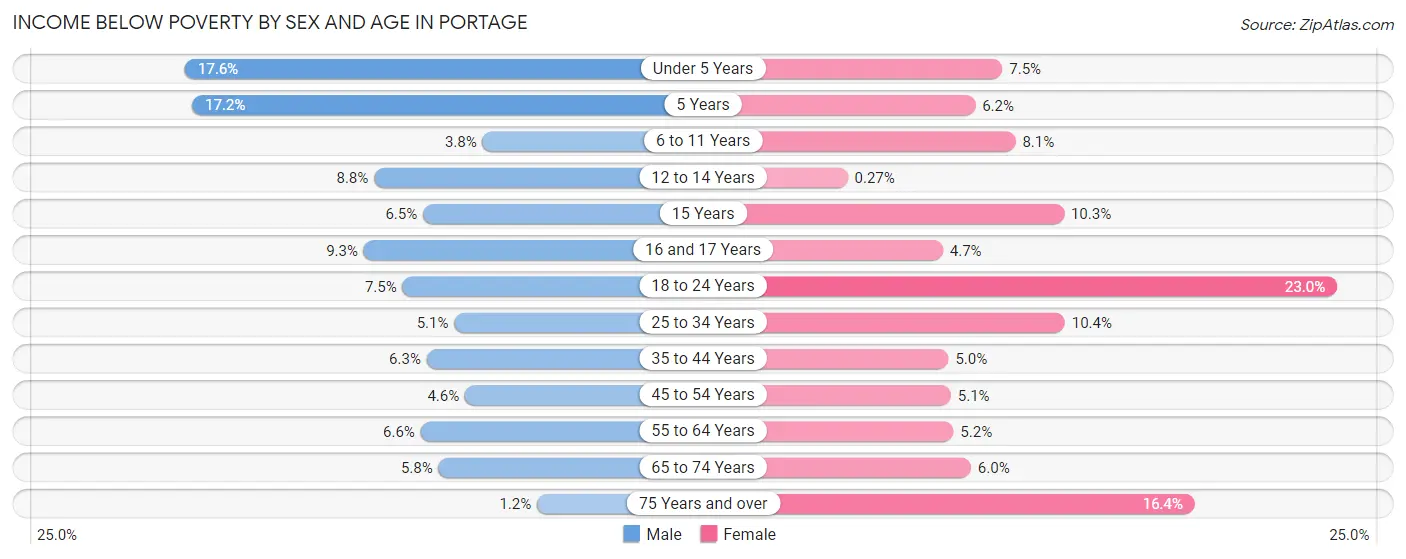
| Age Bracket | Male | Female |
| Under 5 Years | 268 (17.6%) | 101 (7.4%) |
| 5 Years | 56 (17.2%) | 21 (6.2%) |
| 6 to 11 Years | 68 (3.7%) | 124 (8.1%) |
| 12 to 14 Years | 83 (8.8%) | 3 (0.3%) |
| 15 Years | 19 (6.5%) | 37 (10.3%) |
| 16 and 17 Years | 56 (9.3%) | 27 (4.7%) |
| 18 to 24 Years | 211 (7.5%) | 577 (23.0%) |
| 25 to 34 Years | 175 (5.1%) | 386 (10.3%) |
| 35 to 44 Years | 182 (6.3%) | 145 (5.0%) |
| 45 to 54 Years | 129 (4.6%) | 137 (5.1%) |
| 55 to 64 Years | 192 (6.6%) | 157 (5.2%) |
| 65 to 74 Years | 117 (5.8%) | 154 (6.0%) |
| 75 Years and over | 17 (1.2%) | 346 (16.4%) |
| Total | 1,573 (6.6%) | 2,215 (8.9%) |
Income Above Poverty by Sex and Age in Portage
According to the poverty statistics in Portage, males aged 75 years and over and females aged 12 to 14 years are the age groups that are most secure financially, with 98.8% of males and 99.7% of females in these age groups living above the poverty line.
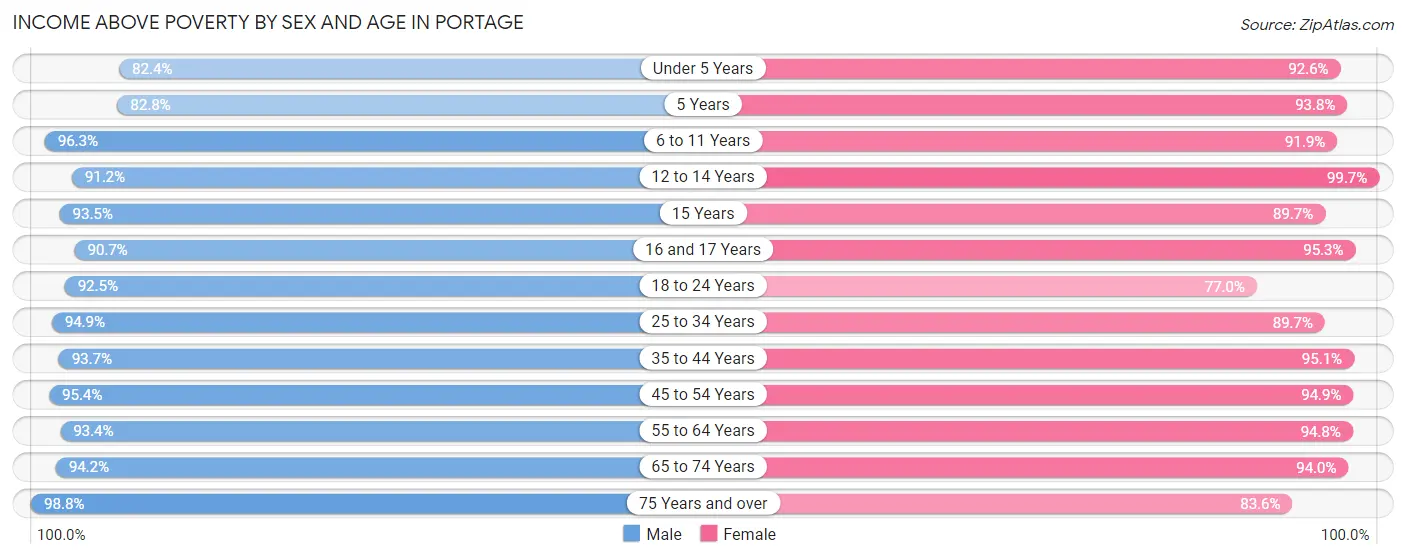
| Age Bracket | Male | Female |
| Under 5 Years | 1,258 (82.4%) | 1,255 (92.5%) |
| 5 Years | 269 (82.8%) | 318 (93.8%) |
| 6 to 11 Years | 1,744 (96.3%) | 1,414 (91.9%) |
| 12 to 14 Years | 862 (91.2%) | 1,093 (99.7%) |
| 15 Years | 273 (93.5%) | 322 (89.7%) |
| 16 and 17 Years | 549 (90.7%) | 549 (95.3%) |
| 18 to 24 Years | 2,617 (92.5%) | 1,934 (77.0%) |
| 25 to 34 Years | 3,282 (94.9%) | 3,344 (89.6%) |
| 35 to 44 Years | 2,687 (93.7%) | 2,787 (95.1%) |
| 45 to 54 Years | 2,697 (95.4%) | 2,571 (94.9%) |
| 55 to 64 Years | 2,710 (93.4%) | 2,876 (94.8%) |
| 65 to 74 Years | 1,902 (94.2%) | 2,417 (94.0%) |
| 75 Years and over | 1,375 (98.8%) | 1,766 (83.6%) |
| Total | 22,225 (93.4%) | 22,646 (91.1%) |
Income Below Poverty Among Married-Couple Families in Portage
The poverty statistics for married-couple families in Portage show that 1.7% or 164 of the total 9,881 families live below the poverty line. Families with 3 or 4 children have the highest poverty rate of 2.5%, comprising of 17 families. On the other hand, families with 5 or more children have the lowest poverty rate of 0.0%, which includes 0 families.
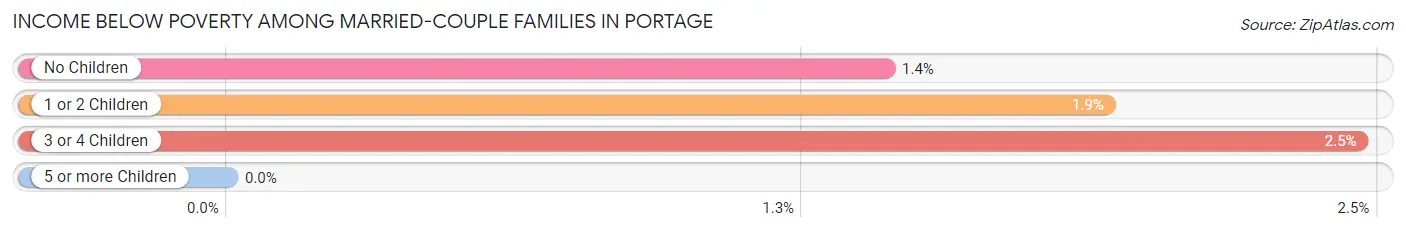
| Children | Above Poverty | Below Poverty |
| No Children | 5,650 (98.6%) | 82 (1.4%) |
| 1 or 2 Children | 3,347 (98.1%) | 65 (1.9%) |
| 3 or 4 Children | 675 (97.5%) | 17 (2.5%) |
| 5 or more Children | 45 (100.0%) | 0 (0.0%) |
| Total | 9,717 (98.3%) | 164 (1.7%) |
Income Below Poverty Among Single-Parent Households in Portage
According to the poverty data in Portage, 2.5% or 13 single-father households and 21.2% or 436 single-mother households are living below the poverty line. Among single-father households, those with no children have the highest poverty rate, with 13 households (4.9%) experiencing poverty. Likewise, among single-mother households, those with 3 or 4 children have the highest poverty rate, with 157 households (59.7%) falling below the poverty line.
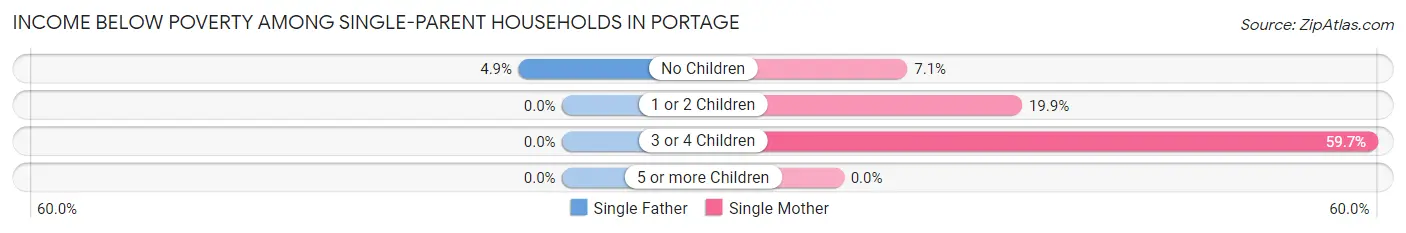
| Children | Single Father | Single Mother |
| No Children | 13 (4.9%) | 44 (7.1%) |
| 1 or 2 Children | 0 (0.0%) | 235 (19.9%) |
| 3 or 4 Children | 0 (0.0%) | 157 (59.7%) |
| 5 or more Children | 0 (0.0%) | 0 (0.0%) |
| Total | 13 (2.5%) | 436 (21.2%) |
Income Below Poverty Among Married-Couple vs Single-Parent Households in Portage
The poverty data for Portage shows that 164 of the married-couple family households (1.7%) and 449 of the single-parent households (17.3%) are living below the poverty level. Within the married-couple family households, those with 3 or 4 children have the highest poverty rate, with 17 households (2.5%) falling below the poverty line. Among the single-parent households, those with 3 or 4 children have the highest poverty rate, with 157 household (59.7%) living below poverty.
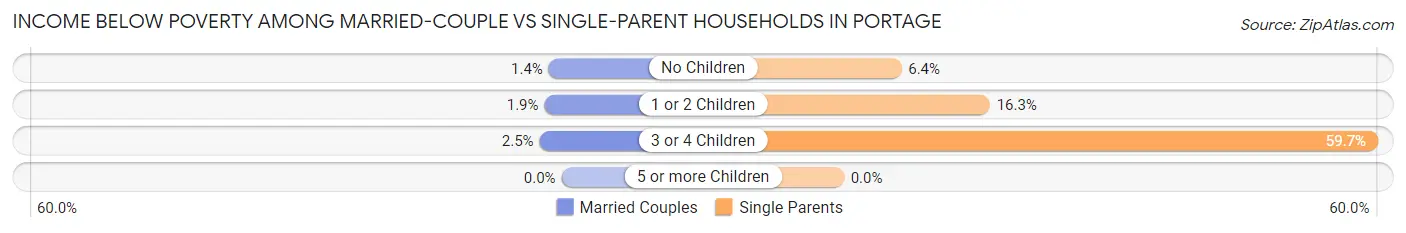
| Children | Married-Couple Families | Single-Parent Households |
| No Children | 82 (1.4%) | 57 (6.4%) |
| 1 or 2 Children | 65 (1.9%) | 235 (16.3%) |
| 3 or 4 Children | 17 (2.5%) | 157 (59.7%) |
| 5 or more Children | 0 (0.0%) | 0 (0.0%) |
| Total | 164 (1.7%) | 449 (17.3%) |
Race in Portage
The most populous races in Portage are White / Caucasian (41,338 | 84.5%), Two or more Races (2,765 | 5.7%), and Hispanic or Latino (2,601 | 5.3%).
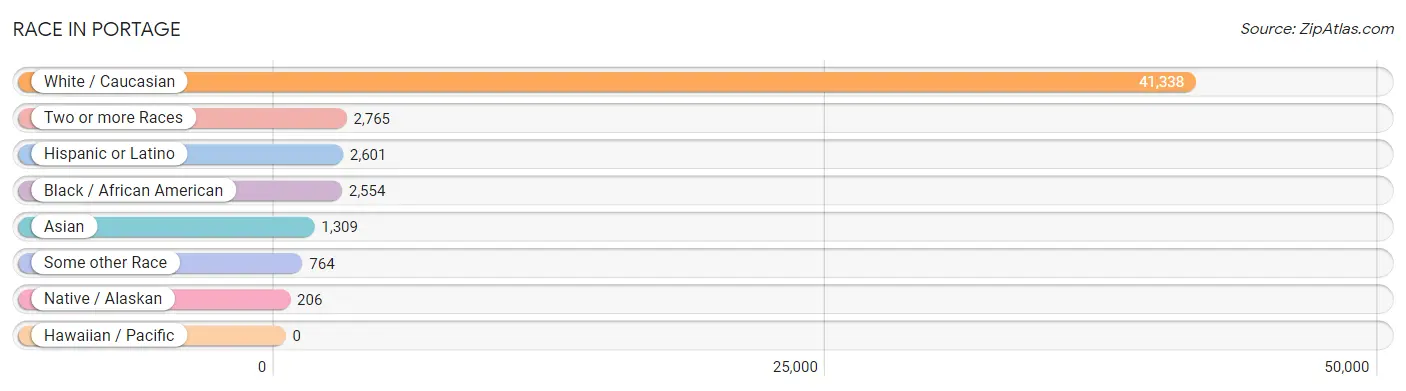
| Race | # Population | % Population |
| Asian | 1,309 | 2.7% |
| Black / African American | 2,554 | 5.2% |
| Hawaiian / Pacific | 0 | 0.0% |
| Hispanic or Latino | 2,601 | 5.3% |
| Native / Alaskan | 206 | 0.4% |
| White / Caucasian | 41,338 | 84.5% |
| Two or more Races | 2,765 | 5.7% |
| Some other Race | 764 | 1.6% |
| Total | 48,936 | 100.0% |
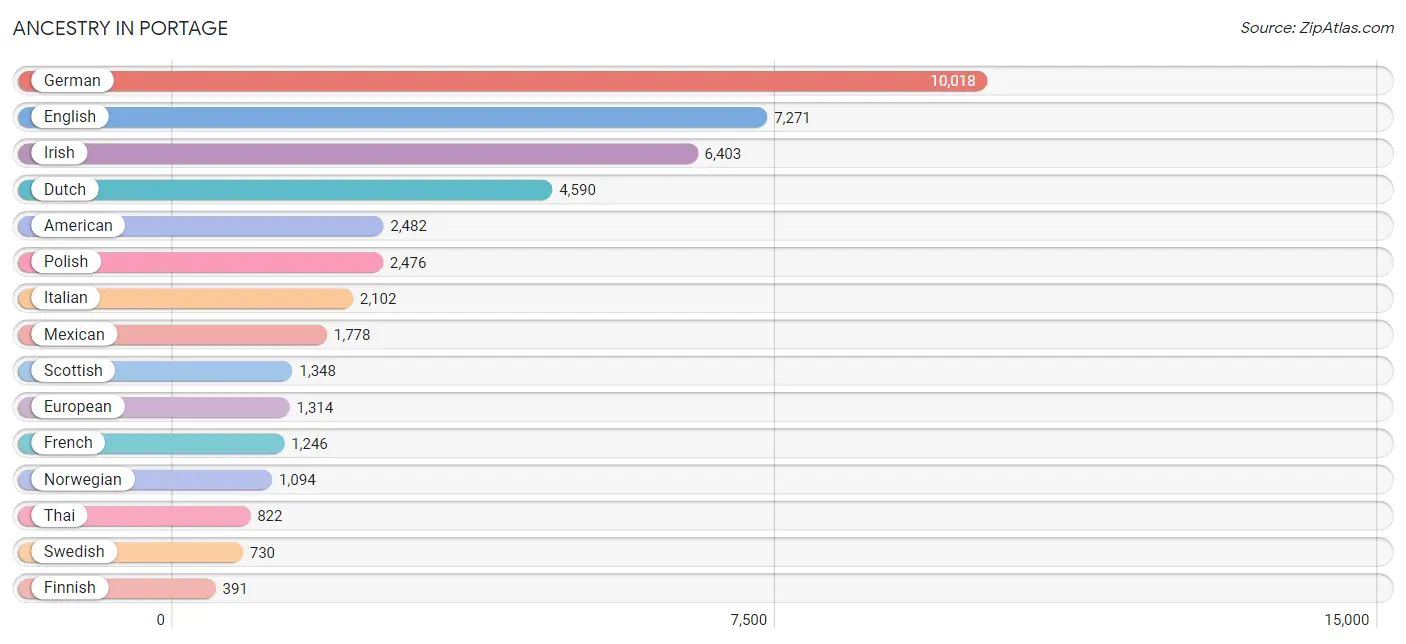
Ancestry in Portage
The most populous ancestries reported in Portage are German (10,018 | 20.5%), English (7,271 | 14.9%), Irish (6,403 | 13.1%), Dutch (4,590 | 9.4%), and American (2,482 | 5.1%), together accounting for 62.9% of all Portage residents.
| Ancestry | # Population | % Population |
| African | 188 | 0.4% |
| Albanian | 9 | 0.0% |
| American | 2,482 | 5.1% |
| Arab | 278 | 0.6% |
| Armenian | 83 | 0.2% |
| Australian | 26 | 0.1% |
| Austrian | 63 | 0.1% |
| Belgian | 165 | 0.3% |
| Bhutanese | 184 | 0.4% |
| Blackfeet | 12 | 0.0% |
| Brazilian | 57 | 0.1% |
| British | 269 | 0.5% |
| Bulgarian | 29 | 0.1% |
| Burmese | 128 | 0.3% |
| Canadian | 113 | 0.2% |
| Central American | 121 | 0.3% |
| Central American Indian | 29 | 0.1% |
| Cherokee | 63 | 0.1% |
| Cheyenne | 9 | 0.0% |
| Chickasaw | 7 | 0.0% |
| Chilean | 10 | 0.0% |
| Chippewa | 96 | 0.2% |
| Colombian | 19 | 0.0% |
| Croatian | 61 | 0.1% |
| Cuban | 63 | 0.1% |
| Czech | 132 | 0.3% |
| Czechoslovakian | 52 | 0.1% |
| Danish | 209 | 0.4% |
| Dominican | 12 | 0.0% |
| Dutch | 4,590 | 9.4% |
| Eastern European | 135 | 0.3% |
| Ecuadorian | 99 | 0.2% |
| Egyptian | 60 | 0.1% |
| English | 7,271 | 14.9% |
| Ethiopian | 22 | 0.0% |
| European | 1,314 | 2.7% |
| Finnish | 391 | 0.8% |
| French | 1,246 | 2.5% |
| French Canadian | 320 | 0.6% |
| German | 10,018 | 20.5% |
| Ghanaian | 13 | 0.0% |
| Greek | 323 | 0.7% |
| Guatemalan | 69 | 0.1% |
| Guyanese | 24 | 0.1% |
| Hungarian | 322 | 0.7% |
| Icelander | 38 | 0.1% |
| Indian (Asian) | 222 | 0.4% |
| Indonesian | 35 | 0.1% |
| Iranian | 28 | 0.1% |
| Irish | 6,403 | 13.1% |
| Iroquois | 7 | 0.0% |
| Israeli | 5 | 0.0% |
| Italian | 2,102 | 4.3% |
| Jamaican | 32 | 0.1% |
| Kenyan | 12 | 0.0% |
| Korean | 254 | 0.5% |
| Latvian | 28 | 0.1% |
| Lebanese | 190 | 0.4% |
| Lithuanian | 125 | 0.3% |
| Macedonian | 44 | 0.1% |
| Maltese | 17 | 0.0% |
| Mexican | 1,778 | 3.6% |
| Mexican American Indian | 106 | 0.2% |
| Native Hawaiian | 63 | 0.1% |
| Nicaraguan | 52 | 0.1% |
| Nigerian | 93 | 0.2% |
| Northern European | 191 | 0.4% |
| Norwegian | 1,094 | 2.2% |
| Ottawa | 42 | 0.1% |
| Pakistani | 41 | 0.1% |
| Peruvian | 39 | 0.1% |
| Polish | 2,476 | 5.1% |
| Portuguese | 35 | 0.1% |
| Potawatomi | 53 | 0.1% |
| Puerto Rican | 163 | 0.3% |
| Romanian | 98 | 0.2% |
| Russian | 282 | 0.6% |
| Scandinavian | 374 | 0.8% |
| Scotch-Irish | 348 | 0.7% |
| Scottish | 1,348 | 2.8% |
| Seminole | 12 | 0.0% |
| Serbian | 91 | 0.2% |
| Sioux | 8 | 0.0% |
| Slovak | 145 | 0.3% |
| Slovene | 11 | 0.0% |
| South American | 332 | 0.7% |
| Spaniard | 12 | 0.0% |
| Spanish | 97 | 0.2% |
| Sri Lankan | 111 | 0.2% |
| Subsaharan African | 340 | 0.7% |
| Swedish | 730 | 1.5% |
| Swiss | 103 | 0.2% |
| Syrian | 28 | 0.1% |
| Thai | 822 | 1.7% |
| Trinidadian and Tobagonian | 12 | 0.0% |
| Ukrainian | 52 | 0.1% |
| Venezuelan | 165 | 0.3% |
| Welsh | 367 | 0.7% |
| Yugoslavian | 58 | 0.1% |
| Zimbabwean | 6 | 0.0% | View All 100 Rows |
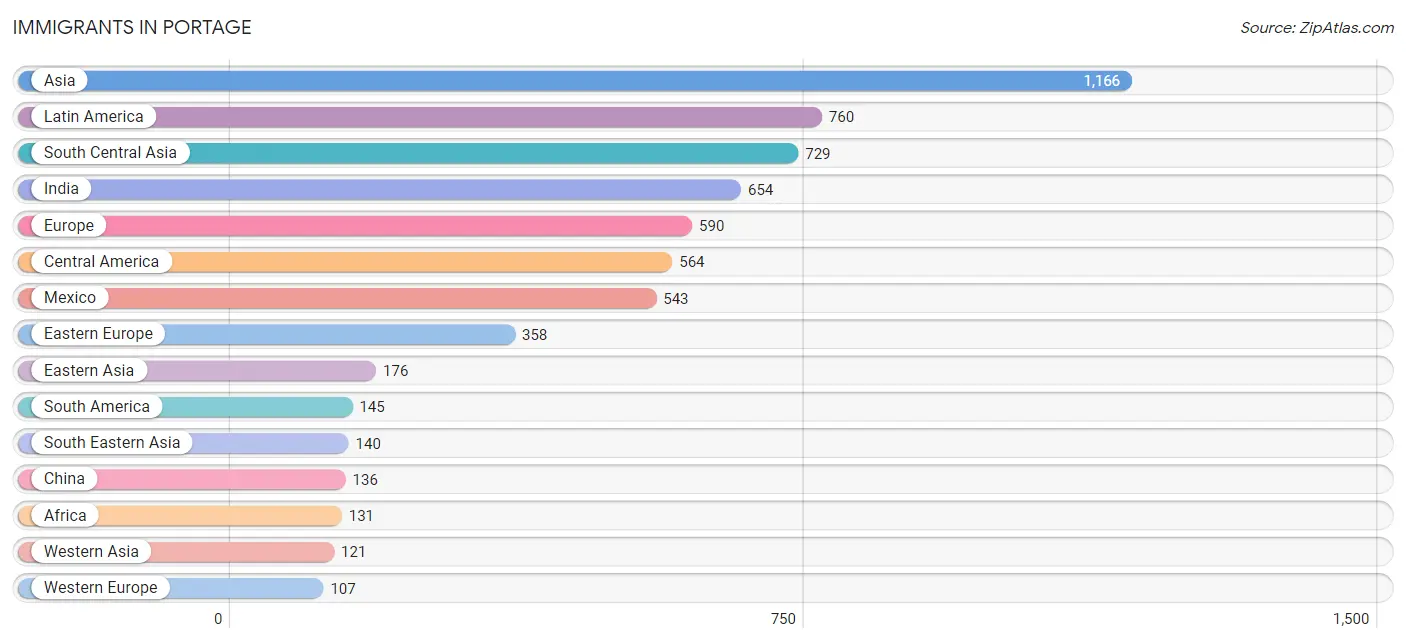
Immigrants in Portage
The most numerous immigrant groups reported in Portage came from Asia (1,166 | 2.4%), Latin America (760 | 1.5%), South Central Asia (729 | 1.5%), India (654 | 1.3%), and Europe (590 | 1.2%), together accounting for 8.0% of all Portage residents.
| Immigration Origin | # Population | % Population |
| Africa | 131 | 0.3% |
| Asia | 1,166 | 2.4% |
| Azores | 9 | 0.0% |
| Belgium | 21 | 0.0% |
| Bosnia and Herzegovina | 12 | 0.0% |
| Brazil | 88 | 0.2% |
| Canada | 62 | 0.1% |
| Caribbean | 51 | 0.1% |
| Central America | 564 | 1.1% |
| China | 136 | 0.3% |
| Costa Rica | 12 | 0.0% |
| Cuba | 51 | 0.1% |
| Czechoslovakia | 5 | 0.0% |
| Eastern Africa | 28 | 0.1% |
| Eastern Asia | 176 | 0.4% |
| Eastern Europe | 358 | 0.7% |
| Ecuador | 26 | 0.1% |
| Egypt | 24 | 0.1% |
| England | 77 | 0.2% |
| Ethiopia | 22 | 0.0% |
| Europe | 590 | 1.2% |
| Germany | 49 | 0.1% |
| Greece | 39 | 0.1% |
| Guatemala | 9 | 0.0% |
| Hong Kong | 74 | 0.2% |
| Hungary | 21 | 0.0% |
| India | 654 | 1.3% |
| Iran | 28 | 0.1% |
| Israel | 27 | 0.1% |
| Japan | 10 | 0.0% |
| Korea | 30 | 0.1% |
| Kuwait | 8 | 0.0% |
| Latin America | 760 | 1.5% |
| Lebanon | 43 | 0.1% |
| Malaysia | 25 | 0.1% |
| Mexico | 543 | 1.1% |
| Netherlands | 37 | 0.1% |
| Nigeria | 67 | 0.1% |
| Northern Africa | 24 | 0.1% |
| Northern Europe | 77 | 0.2% |
| Pakistan | 28 | 0.1% |
| Philippines | 35 | 0.1% |
| Poland | 72 | 0.2% |
| Portugal | 9 | 0.0% |
| Romania | 76 | 0.2% |
| Russia | 80 | 0.2% |
| Saudi Arabia | 43 | 0.1% |
| Senegal | 8 | 0.0% |
| Sierra Leone | 4 | 0.0% |
| South America | 145 | 0.3% |
| South Central Asia | 729 | 1.5% |
| South Eastern Asia | 140 | 0.3% |
| Southern Europe | 48 | 0.1% |
| Sri Lanka | 19 | 0.0% |
| Thailand | 1 | 0.0% |
| Ukraine | 7 | 0.0% |
| Venezuela | 31 | 0.1% |
| Vietnam | 44 | 0.1% |
| Western Africa | 79 | 0.2% |
| Western Asia | 121 | 0.3% |
| Western Europe | 107 | 0.2% |
| Zimbabwe | 6 | 0.0% | View All 62 Rows |
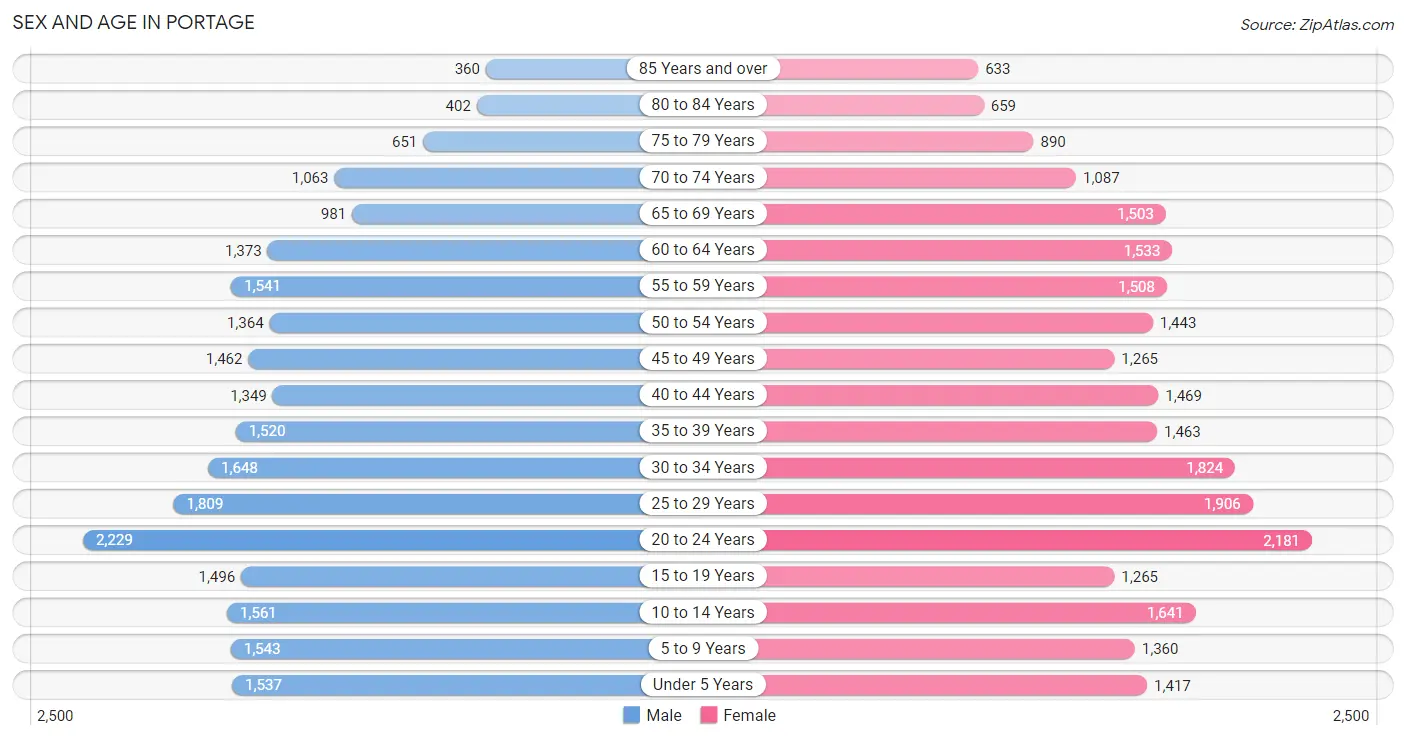
Sex and Age in Portage
Sex and Age in Portage
The most populous age groups in Portage are 20 to 24 Years (2,229 | 9.3%) for men and 20 to 24 Years (2,181 | 8.7%) for women.
| Age Bracket | Male | Female |
| Under 5 Years | 1,537 (6.4%) | 1,417 (5.7%) |
| 5 to 9 Years | 1,543 (6.5%) | 1,360 (5.4%) |
| 10 to 14 Years | 1,561 (6.5%) | 1,641 (6.6%) |
| 15 to 19 Years | 1,496 (6.3%) | 1,265 (5.1%) |
| 20 to 24 Years | 2,229 (9.3%) | 2,181 (8.7%) |
| 25 to 29 Years | 1,809 (7.6%) | 1,906 (7.6%) |
| 30 to 34 Years | 1,648 (6.9%) | 1,824 (7.3%) |
| 35 to 39 Years | 1,520 (6.4%) | 1,463 (5.8%) |
| 40 to 44 Years | 1,349 (5.7%) | 1,469 (5.9%) |
| 45 to 49 Years | 1,462 (6.1%) | 1,265 (5.1%) |
| 50 to 54 Years | 1,364 (5.7%) | 1,443 (5.8%) |
| 55 to 59 Years | 1,541 (6.5%) | 1,508 (6.0%) |
| 60 to 64 Years | 1,373 (5.8%) | 1,533 (6.1%) |
| 65 to 69 Years | 981 (4.1%) | 1,503 (6.0%) |
| 70 to 74 Years | 1,063 (4.4%) | 1,087 (4.3%) |
| 75 to 79 Years | 651 (2.7%) | 890 (3.5%) |
| 80 to 84 Years | 402 (1.7%) | 659 (2.6%) |
| 85 Years and over | 360 (1.5%) | 633 (2.5%) |
| Total | 23,889 (100.0%) | 25,047 (100.0%) |
Families and Households in Portage
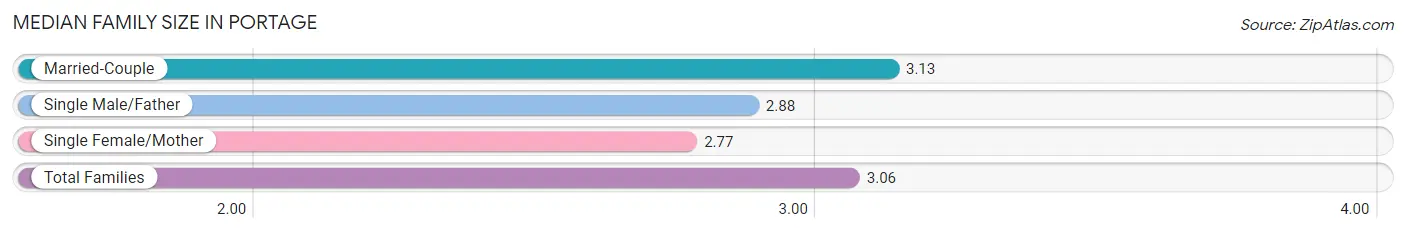
Median Family Size in Portage
The median family size in Portage is 3.06 persons per family, with married-couple families (9,881 | 79.2%) accounting for the largest median family size of 3.13 persons per family. On the other hand, single female/mother families (2,060 | 16.5%) represent the smallest median family size with 2.77 persons per family.
| Family Type | # Families | Family Size |
| Married-Couple | 9,881 (79.2%) | 3.13 |
| Single Male/Father | 528 (4.2%) | 2.88 |
| Single Female/Mother | 2,060 (16.5%) | 2.77 |
| Total Families | 12,469 (100.0%) | 3.06 |
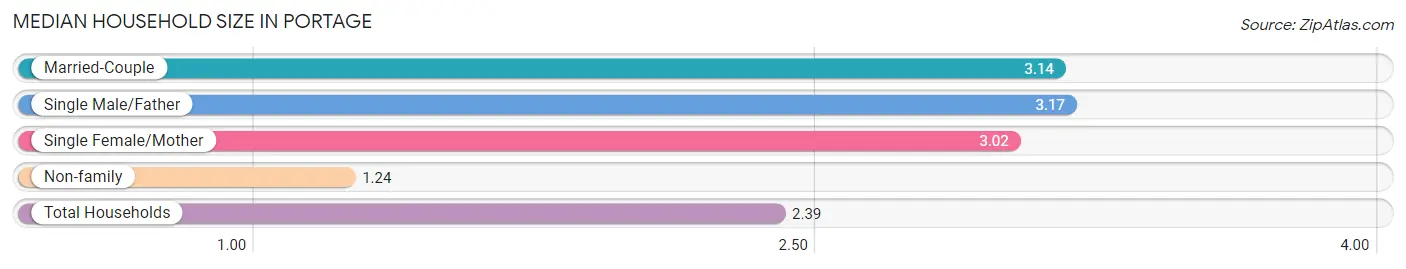
Median Household Size in Portage
The median household size in Portage is 2.39 persons per household, with single male/father households (528 | 2.6%) accounting for the largest median household size of 3.17 persons per household. non-family households (7,901 | 38.8%) represent the smallest median household size with 1.24 persons per household.
| Household Type | # Households | Household Size |
| Married-Couple | 9,881 (48.5%) | 3.14 |
| Single Male/Father | 528 (2.6%) | 3.17 |
| Single Female/Mother | 2,060 (10.1%) | 3.02 |
| Non-family | 7,901 (38.8%) | 1.24 |
| Total Households | 20,370 (100.0%) | 2.39 |
Household Size by Marriage Status in Portage
Out of a total of 20,370 households in Portage, 12,469 (61.2%) are family households, while 7,901 (38.8%) are nonfamily households. The most numerous type of family households are 2-person households, comprising 5,646, and the most common type of nonfamily households are 1-person households, comprising 6,339.
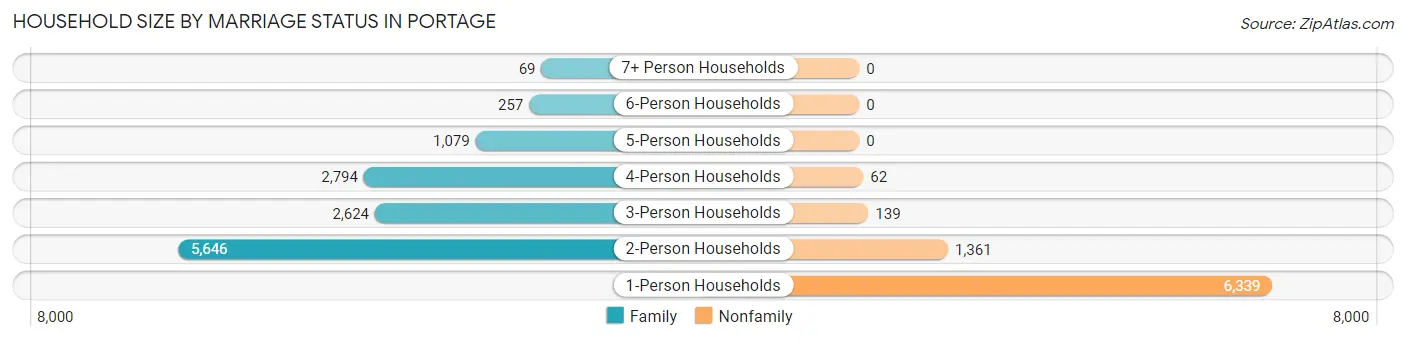
| Household Size | Family Households | Nonfamily Households |
| 1-Person Households | - | 6,339 (31.1%) |
| 2-Person Households | 5,646 (27.7%) | 1,361 (6.7%) |
| 3-Person Households | 2,624 (12.9%) | 139 (0.7%) |
| 4-Person Households | 2,794 (13.7%) | 62 (0.3%) |
| 5-Person Households | 1,079 (5.3%) | 0 (0.0%) |
| 6-Person Households | 257 (1.3%) | 0 (0.0%) |
| 7+ Person Households | 69 (0.3%) | 0 (0.0%) |
| Total | 12,469 (61.2%) | 7,901 (38.8%) |
Female Fertility in Portage
Fertility by Age in Portage
Average fertility rate in Portage is 42.0 births per 1,000 women. Women in the age bracket of 20 to 34 years have the highest fertility rate with 63.0 births per 1,000 women. Women in the age bracket of 20 to 34 years acount for 75.0% of all women with births.
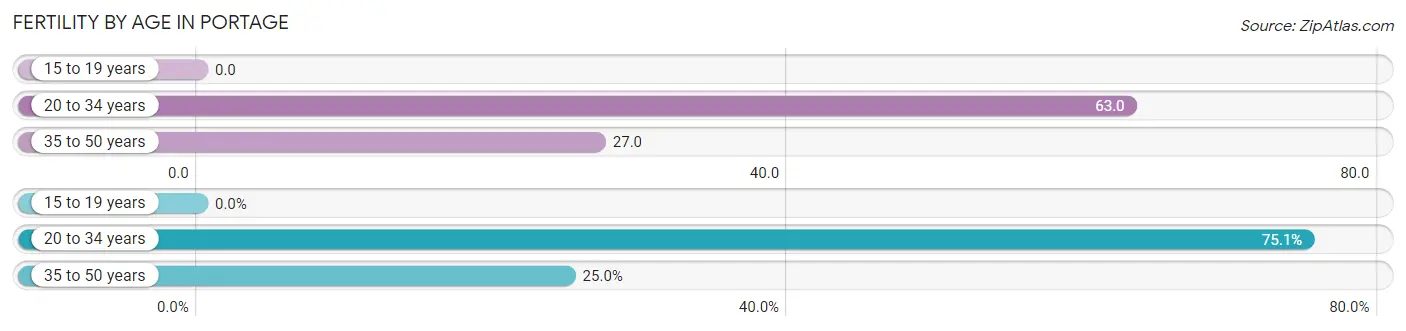
| Age Bracket | Women with Births | Births / 1,000 Women |
| 15 to 19 years | 0 (0.0%) | 0.0 |
| 20 to 34 years | 373 (75.0%) | 63.0 |
| 35 to 50 years | 124 (24.9%) | 27.0 |
| Total | 497 (100.0%) | 42.0 |
Fertility by Age by Marriage Status in Portage
86.1% of women with births (497) in Portage are married. The highest percentage of unmarried women with births falls into 35 to 50 years age bracket with 25.8% of them unmarried at the time of birth, while the lowest percentage of unmarried women with births belong to 20 to 34 years age bracket with 9.9% of them unmarried.
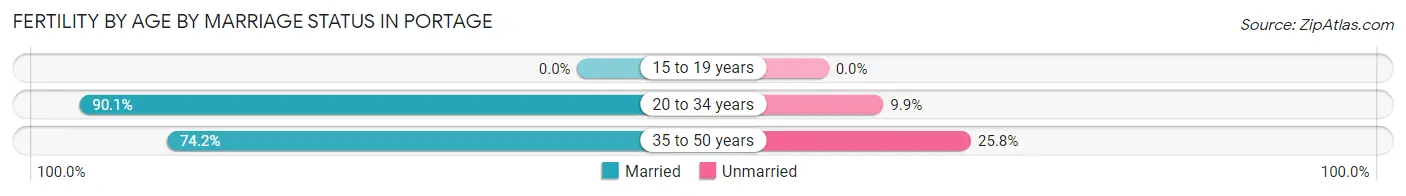
| Age Bracket | Married | Unmarried |
| 15 to 19 years | 0 (0.0%) | 0 (0.0%) |
| 20 to 34 years | 336 (90.1%) | 37 (9.9%) |
| 35 to 50 years | 92 (74.2%) | 32 (25.8%) |
| Total | 428 (86.1%) | 69 (13.9%) |
Fertility by Education in Portage
Average fertility rate in Portage is 42.0 births per 1,000 women. Women with the education attainment of graduate degree have the highest fertility rate of 63.0 births per 1,000 women, while women with the education attainment of less than high school have the lowest fertility at 14.0 births per 1,000 women. Women with the education attainment of bachelor's degree represent 34.6% of all women with births.
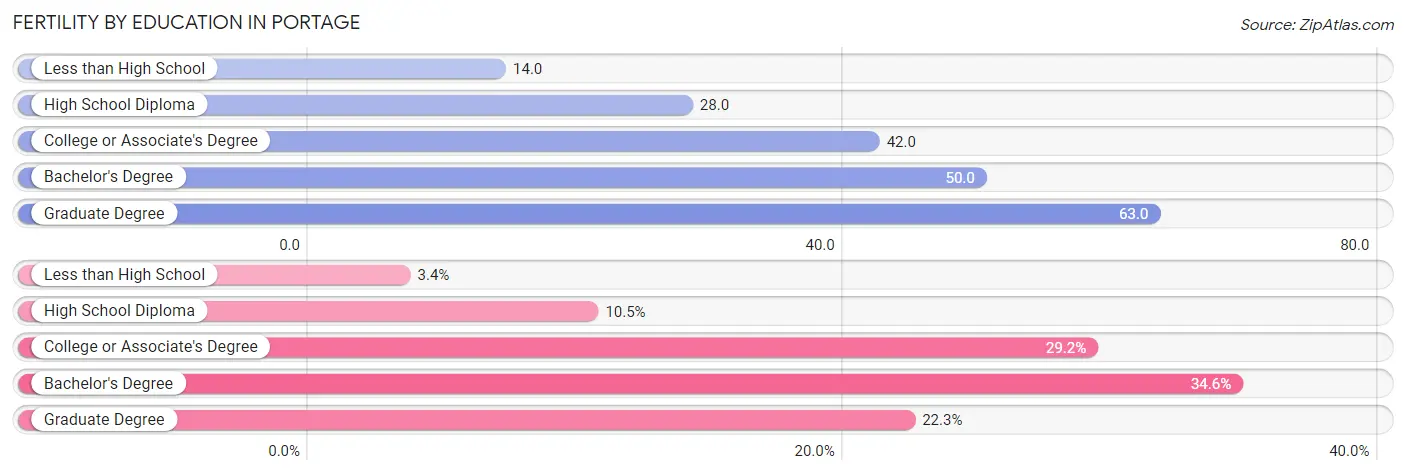
| Educational Attainment | Women with Births | Births / 1,000 Women |
| Less than High School | 17 (3.4%) | 14.0 |
| High School Diploma | 52 (10.5%) | 28.0 |
| College or Associate's Degree | 145 (29.2%) | 42.0 |
| Bachelor's Degree | 172 (34.6%) | 50.0 |
| Graduate Degree | 111 (22.3%) | 63.0 |
| Total | 497 (100.0%) | 42.0 |
Fertility by Education by Marriage Status in Portage
13.9% of women with births in Portage are unmarried. Women with the educational attainment of college or associate's degree are most likely to be married with 100.0% of them married at childbirth, while women with the educational attainment of less than high school are least likely to be married with 100.0% of them unmarried at childbirth.
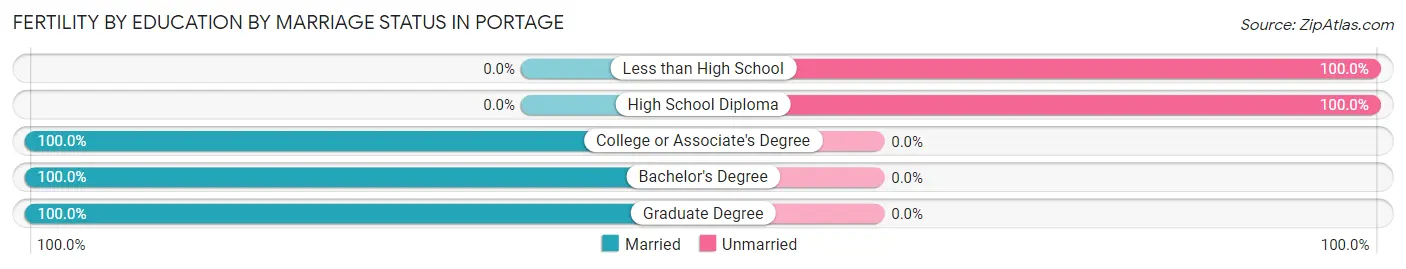
| Educational Attainment | Married | Unmarried |
| Less than High School | 0 (0.0%) | 17 (100.0%) |
| High School Diploma | 0 (0.0%) | 52 (100.0%) |
| College or Associate's Degree | 145 (100.0%) | 0 (0.0%) |
| Bachelor's Degree | 172 (100.0%) | 0 (0.0%) |
| Graduate Degree | 111 (100.0%) | 0 (0.0%) |
| Total | 428 (86.1%) | 69 (13.9%) |
Employment Characteristics in Portage
Employment by Class of Employer in Portage
Among the 25,113 employed individuals in Portage, private company employees (17,423 | 69.4%), not-for-profit organizations (2,989 | 11.9%), and local government employees (1,801 | 7.2%) make up the most common classes of employment.
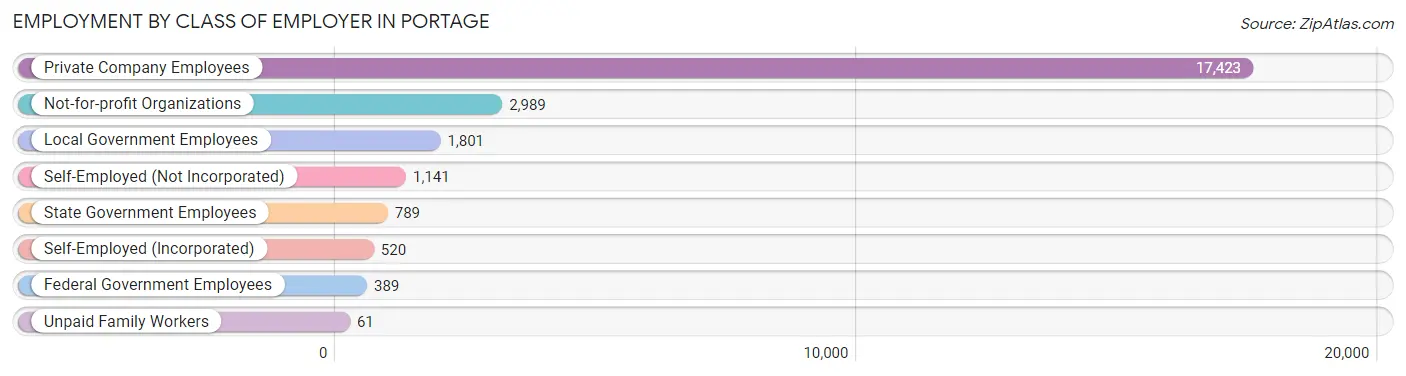
| Employer Class | # Employees | % Employees |
| Private Company Employees | 17,423 | 69.4% |
| Self-Employed (Incorporated) | 520 | 2.1% |
| Self-Employed (Not Incorporated) | 1,141 | 4.5% |
| Not-for-profit Organizations | 2,989 | 11.9% |
| Local Government Employees | 1,801 | 7.2% |
| State Government Employees | 789 | 3.1% |
| Federal Government Employees | 389 | 1.5% |
| Unpaid Family Workers | 61 | 0.2% |
| Total | 25,113 | 100.0% |
Employment Status by Age in Portage
According to the labor force statistics for Portage, out of the total population over 16 years of age (39,226), 69.0% or 27,066 individuals are in the labor force, with 6.1% or 1,651 of them unemployed. The age group with the highest labor force participation rate is 20 to 24 years, with 93.0% or 4,101 individuals in the labor force. Within the labor force, the 16 to 19 years age range has the highest percentage of unemployed individuals, with 12.9% or 173 of them being unemployed.
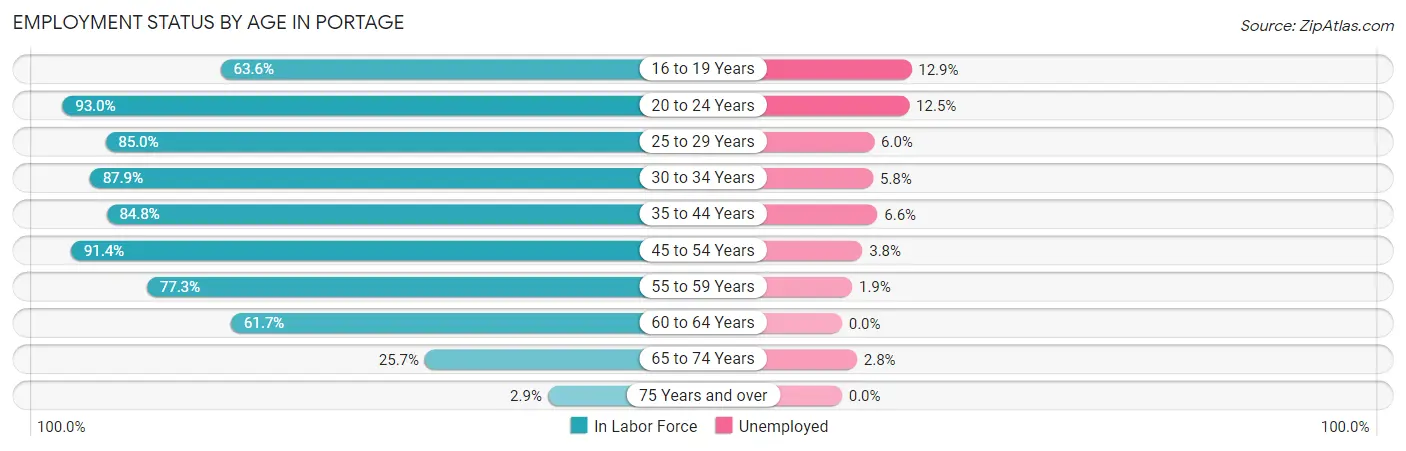
| Age Bracket | In Labor Force | Unemployed |
| 16 to 19 Years | 1,342 (63.6%) | 173 (12.9%) |
| 20 to 24 Years | 4,101 (93.0%) | 513 (12.5%) |
| 25 to 29 Years | 3,158 (85.0%) | 189 (6.0%) |
| 30 to 34 Years | 3,052 (87.9%) | 177 (5.8%) |
| 35 to 44 Years | 4,919 (84.8%) | 325 (6.6%) |
| 45 to 54 Years | 5,058 (91.4%) | 192 (3.8%) |
| 55 to 59 Years | 2,357 (77.3%) | 45 (1.9%) |
| 60 to 64 Years | 1,793 (61.7%) | 0 (0.0%) |
| 65 to 74 Years | 1,191 (25.7%) | 33 (2.8%) |
| 75 Years and over | 104 (2.9%) | 0 (0.0%) |
| Total | 27,066 (69.0%) | 1,651 (6.1%) |
Employment Status by Educational Attainment in Portage
According to labor force statistics for Portage, 83.1% of individuals (20,340) out of the total population between 25 and 64 years of age (24,477) are in the labor force, with 4.6% or 936 of them being unemployed. The group with the highest labor force participation rate are those with the educational attainment of bachelor's degree or higher, with 87.6% or 10,461 individuals in the labor force. Within the labor force, individuals with less than high school education have the highest percentage of unemployment, with 17.8% or 80 of them being unemployed.
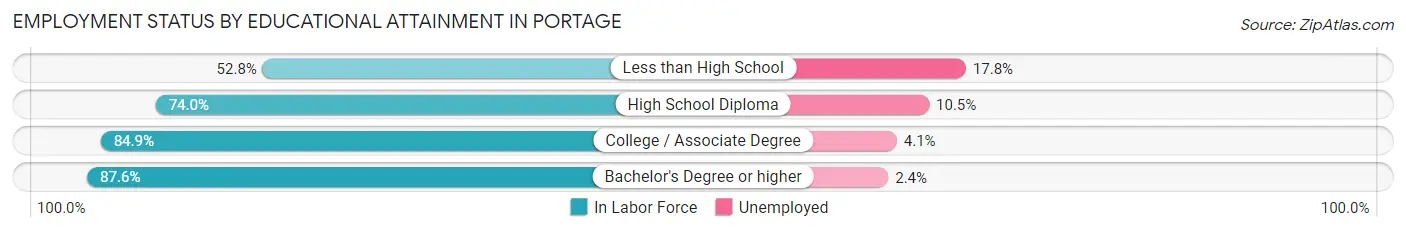
| Educational Attainment | In Labor Force | Unemployed |
| Less than High School | 450 (52.8%) | 152 (17.8%) |
| High School Diploma | 3,357 (74.0%) | 476 (10.5%) |
| College / Associate Degree | 6,067 (84.9%) | 293 (4.1%) |
| Bachelor's Degree or higher | 10,461 (87.6%) | 287 (2.4%) |
| Total | 20,340 (83.1%) | 1,126 (4.6%) |
Employment Occupations by Sex in Portage
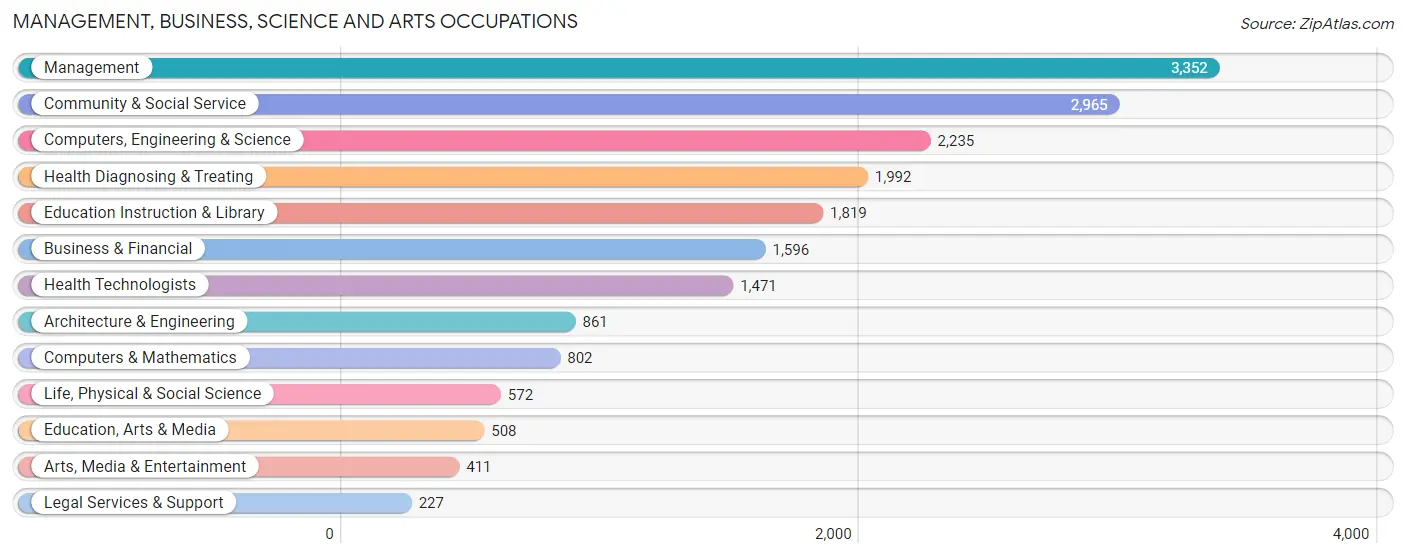
Management, Business, Science and Arts Occupations
The most common Management, Business, Science and Arts occupations in Portage are Management (3,352 | 13.2%), Community & Social Service (2,965 | 11.7%), Computers, Engineering & Science (2,235 | 8.8%), Health Diagnosing & Treating (1,992 | 7.9%), and Education Instruction & Library (1,819 | 7.2%).
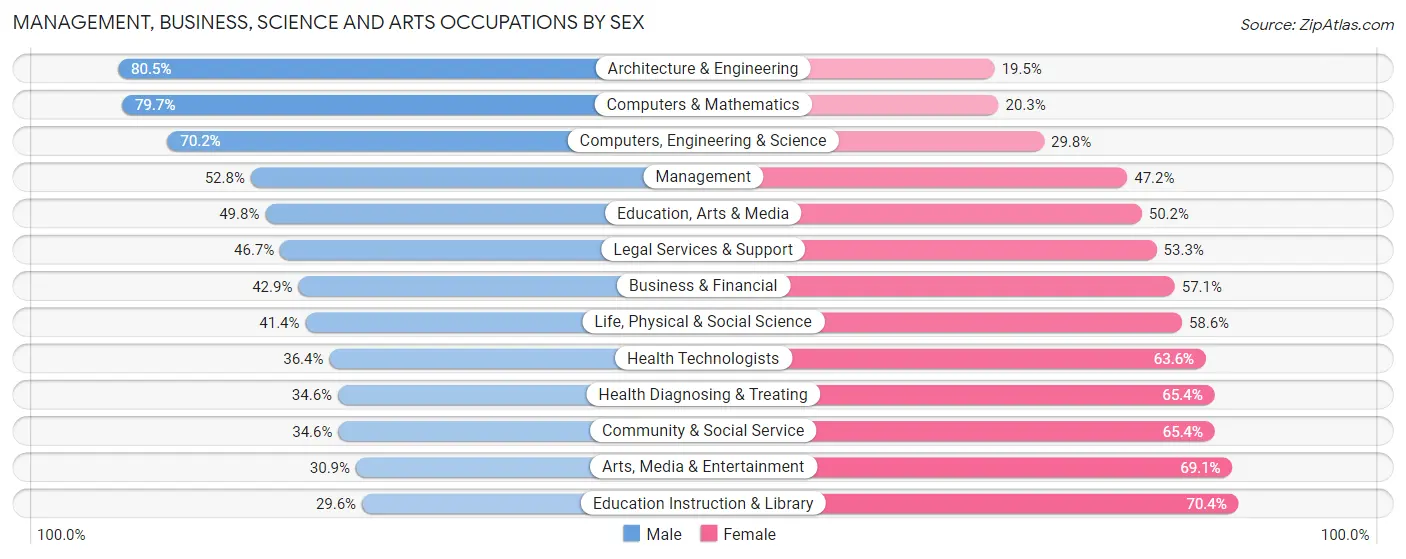
Management, Business, Science and Arts Occupations by Sex
Within the Management, Business, Science and Arts occupations in Portage, the most male-oriented occupations are Architecture & Engineering (80.5%), Computers & Mathematics (79.7%), and Computers, Engineering & Science (70.2%), while the most female-oriented occupations are Education Instruction & Library (70.4%), Arts, Media & Entertainment (69.1%), and Community & Social Service (65.4%).
| Occupation | Male | Female |
| Management | 1,771 (52.8%) | 1,581 (47.2%) |
| Business & Financial | 685 (42.9%) | 911 (57.1%) |
| Computers, Engineering & Science | 1,569 (70.2%) | 666 (29.8%) |
| Computers & Mathematics | 639 (79.7%) | 163 (20.3%) |
| Architecture & Engineering | 693 (80.5%) | 168 (19.5%) |
| Life, Physical & Social Science | 237 (41.4%) | 335 (58.6%) |
| Community & Social Service | 1,025 (34.6%) | 1,940 (65.4%) |
| Education, Arts & Media | 253 (49.8%) | 255 (50.2%) |
| Legal Services & Support | 106 (46.7%) | 121 (53.3%) |
| Education Instruction & Library | 539 (29.6%) | 1,280 (70.4%) |
| Arts, Media & Entertainment | 127 (30.9%) | 284 (69.1%) |
| Health Diagnosing & Treating | 690 (34.6%) | 1,302 (65.4%) |
| Health Technologists | 536 (36.4%) | 935 (63.6%) |
| Total (Category) | 5,740 (47.3%) | 6,400 (52.7%) |
| Total (Overall) | 13,260 (52.3%) | 12,115 (47.7%) |
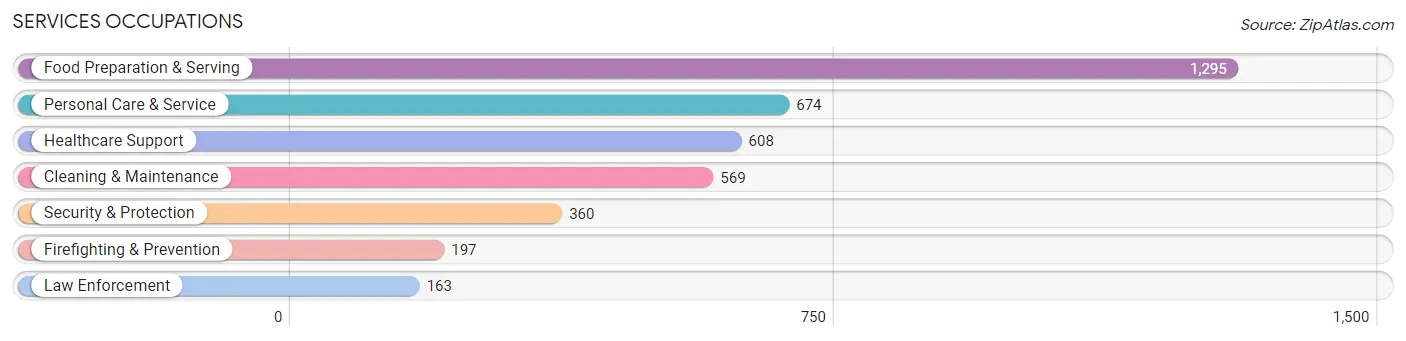
Services Occupations
The most common Services occupations in Portage are Food Preparation & Serving (1,295 | 5.1%), Personal Care & Service (674 | 2.7%), Healthcare Support (608 | 2.4%), Cleaning & Maintenance (569 | 2.2%), and Security & Protection (360 | 1.4%).
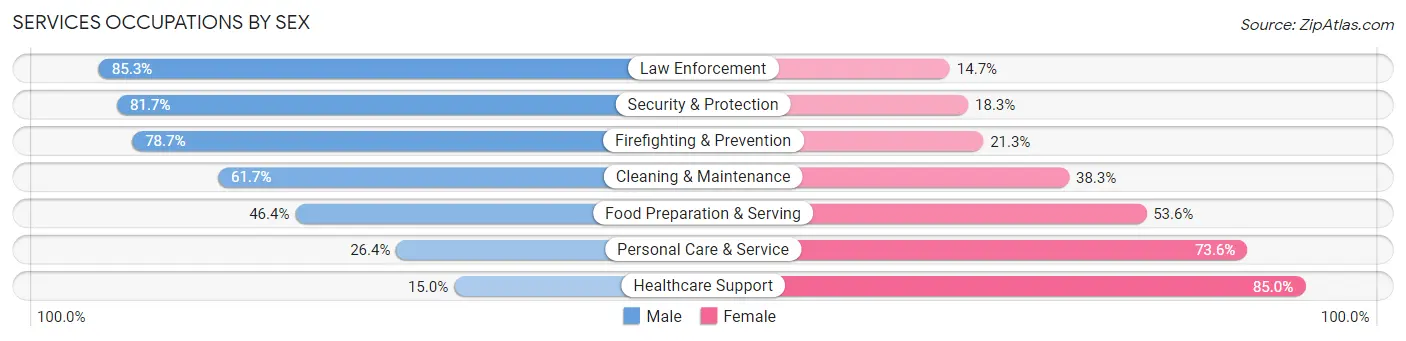
Services Occupations by Sex
Within the Services occupations in Portage, the most male-oriented occupations are Law Enforcement (85.3%), Security & Protection (81.7%), and Firefighting & Prevention (78.7%), while the most female-oriented occupations are Healthcare Support (85.0%), Personal Care & Service (73.6%), and Food Preparation & Serving (53.6%).
| Occupation | Male | Female |
| Healthcare Support | 91 (15.0%) | 517 (85.0%) |
| Security & Protection | 294 (81.7%) | 66 (18.3%) |
| Firefighting & Prevention | 155 (78.7%) | 42 (21.3%) |
| Law Enforcement | 139 (85.3%) | 24 (14.7%) |
| Food Preparation & Serving | 601 (46.4%) | 694 (53.6%) |
| Cleaning & Maintenance | 351 (61.7%) | 218 (38.3%) |
| Personal Care & Service | 178 (26.4%) | 496 (73.6%) |
| Total (Category) | 1,515 (43.2%) | 1,991 (56.8%) |
| Total (Overall) | 13,260 (52.3%) | 12,115 (47.7%) |
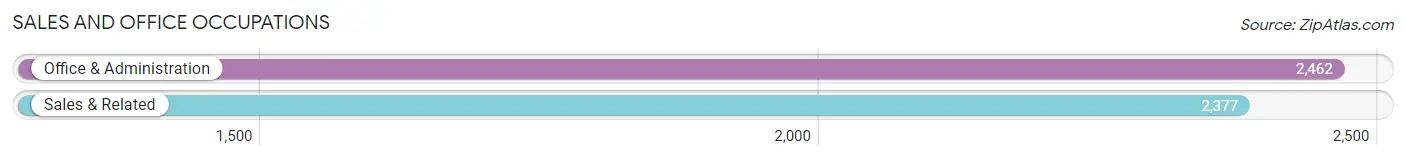
Sales and Office Occupations
The most common Sales and Office occupations in Portage are Office & Administration (2,462 | 9.7%), and Sales & Related (2,377 | 9.4%).
Sales and Office Occupations by Sex
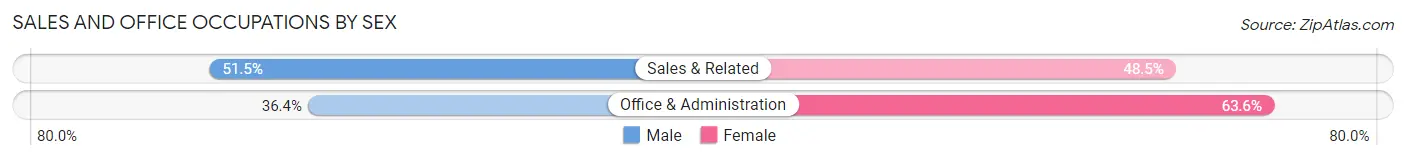
| Occupation | Male | Female |
| Sales & Related | 1,225 (51.5%) | 1,152 (48.5%) |
| Office & Administration | 897 (36.4%) | 1,565 (63.6%) |
| Total (Category) | 2,122 (43.9%) | 2,717 (56.1%) |
| Total (Overall) | 13,260 (52.3%) | 12,115 (47.7%) |
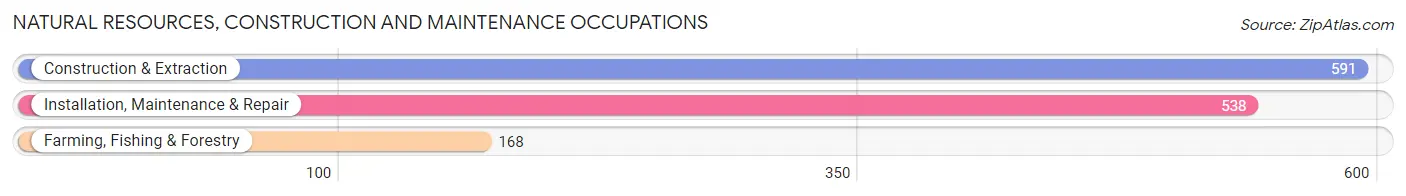
Natural Resources, Construction and Maintenance Occupations
The most common Natural Resources, Construction and Maintenance occupations in Portage are Construction & Extraction (591 | 2.3%), Installation, Maintenance & Repair (538 | 2.1%), and Farming, Fishing & Forestry (168 | 0.7%).
Natural Resources, Construction and Maintenance Occupations by Sex
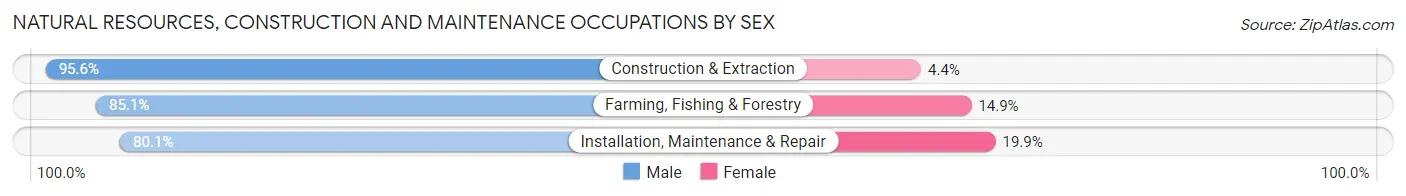
| Occupation | Male | Female |
| Farming, Fishing & Forestry | 143 (85.1%) | 25 (14.9%) |
| Construction & Extraction | 565 (95.6%) | 26 (4.4%) |
| Installation, Maintenance & Repair | 431 (80.1%) | 107 (19.9%) |
| Total (Category) | 1,139 (87.8%) | 158 (12.2%) |
| Total (Overall) | 13,260 (52.3%) | 12,115 (47.7%) |
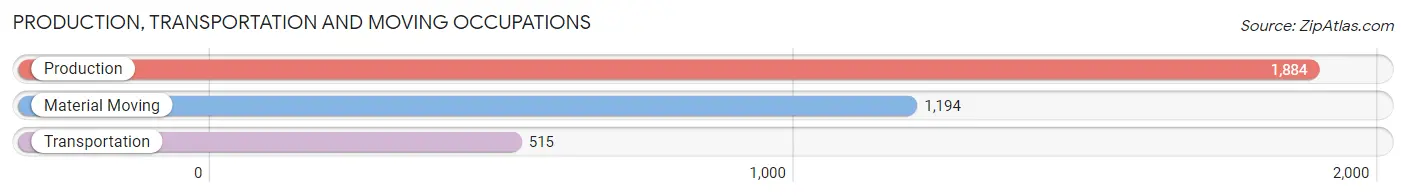
Production, Transportation and Moving Occupations
The most common Production, Transportation and Moving occupations in Portage are Production (1,884 | 7.4%), Material Moving (1,194 | 4.7%), and Transportation (515 | 2.0%).
Production, Transportation and Moving Occupations by Sex
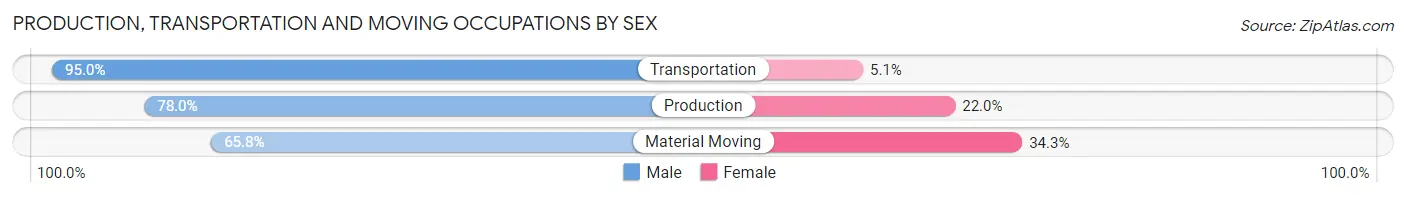
| Occupation | Male | Female |
| Production | 1,470 (78.0%) | 414 (22.0%) |
| Transportation | 489 (95.0%) | 26 (5.1%) |
| Material Moving | 785 (65.7%) | 409 (34.3%) |
| Total (Category) | 2,744 (76.4%) | 849 (23.6%) |
| Total (Overall) | 13,260 (52.3%) | 12,115 (47.7%) |
Employment Industries by Sex in Portage
Employment Industries in Portage
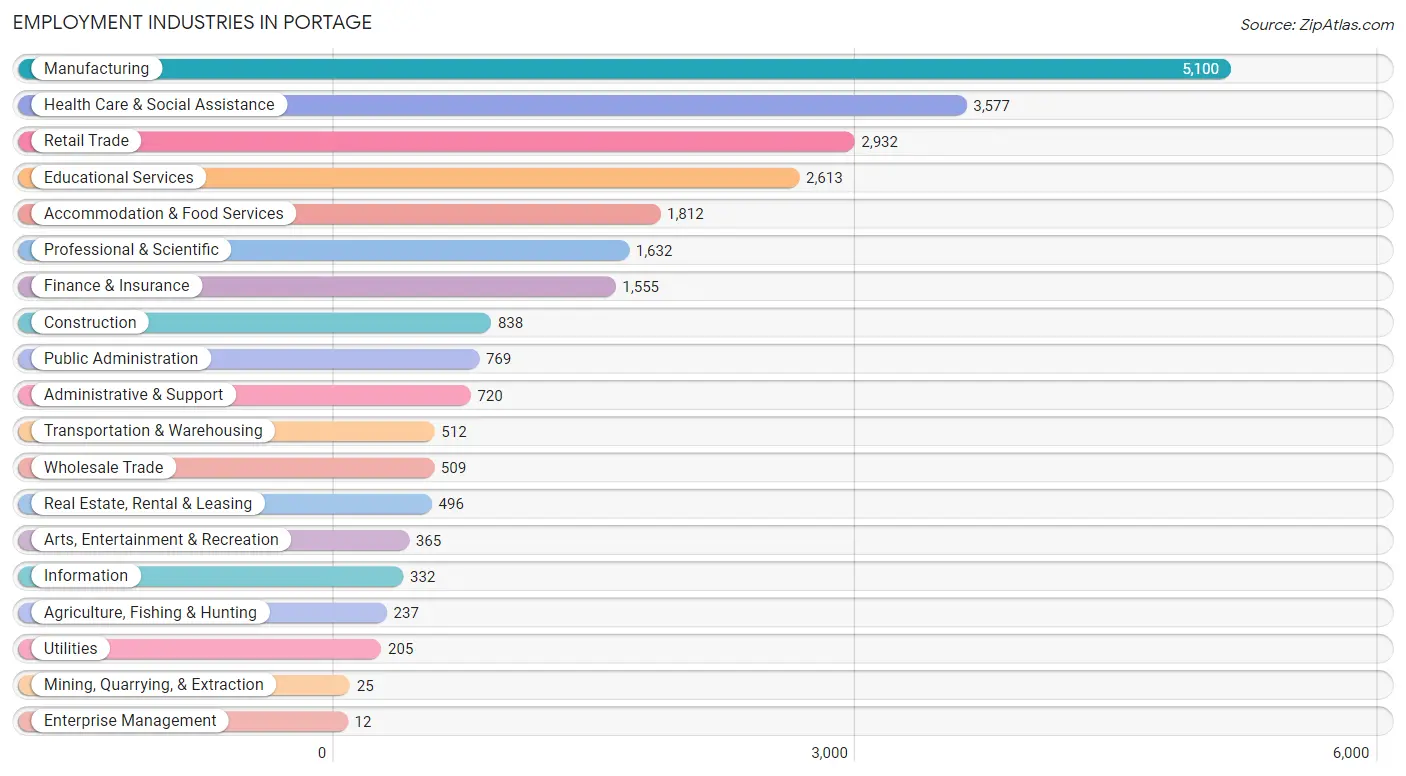
The major employment industries in Portage include Manufacturing (5,100 | 20.1%), Health Care & Social Assistance (3,577 | 14.1%), Retail Trade (2,932 | 11.6%), Educational Services (2,613 | 10.3%), and Accommodation & Food Services (1,812 | 7.1%).
Employment Industries by Sex in Portage
The Portage industries that see more men than women are Mining, Quarrying, & Extraction (100.0%), Enterprise Management (100.0%), and Construction (83.9%), whereas the industries that tend to have a higher number of women are Health Care & Social Assistance (72.6%), Educational Services (68.7%), and Real Estate, Rental & Leasing (62.5%).
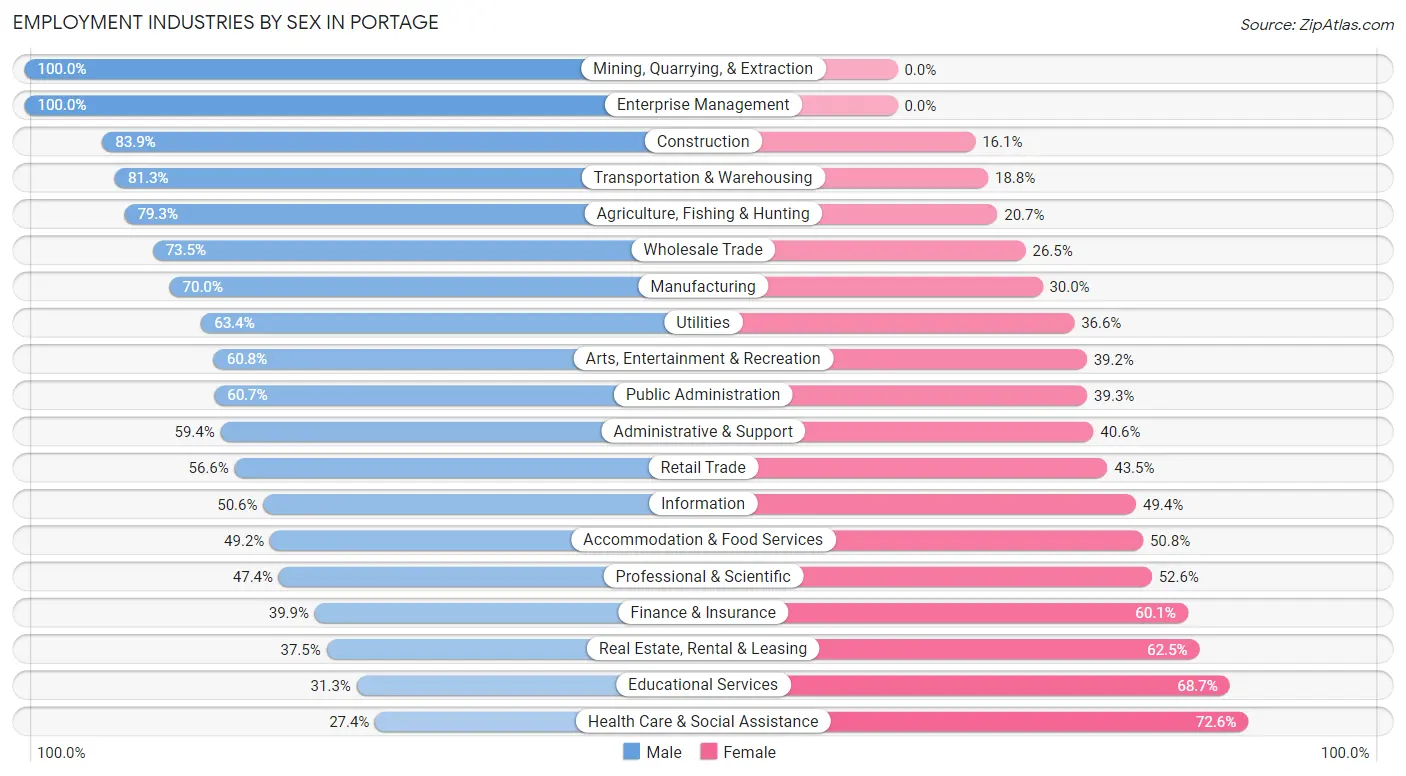
| Industry | Male | Female |
| Agriculture, Fishing & Hunting | 188 (79.3%) | 49 (20.7%) |
| Mining, Quarrying, & Extraction | 25 (100.0%) | 0 (0.0%) |
| Construction | 703 (83.9%) | 135 (16.1%) |
| Manufacturing | 3,569 (70.0%) | 1,531 (30.0%) |
| Wholesale Trade | 374 (73.5%) | 135 (26.5%) |
| Retail Trade | 1,658 (56.6%) | 1,274 (43.4%) |
| Transportation & Warehousing | 416 (81.2%) | 96 (18.8%) |
| Utilities | 130 (63.4%) | 75 (36.6%) |
| Information | 168 (50.6%) | 164 (49.4%) |
| Finance & Insurance | 621 (39.9%) | 934 (60.1%) |
| Real Estate, Rental & Leasing | 186 (37.5%) | 310 (62.5%) |
| Professional & Scientific | 773 (47.4%) | 859 (52.6%) |
| Enterprise Management | 12 (100.0%) | 0 (0.0%) |
| Administrative & Support | 428 (59.4%) | 292 (40.6%) |
| Educational Services | 817 (31.3%) | 1,796 (68.7%) |
| Health Care & Social Assistance | 981 (27.4%) | 2,596 (72.6%) |
| Arts, Entertainment & Recreation | 222 (60.8%) | 143 (39.2%) |
| Accommodation & Food Services | 891 (49.2%) | 921 (50.8%) |
| Public Administration | 467 (60.7%) | 302 (39.3%) |
| Total | 13,260 (52.3%) | 12,115 (47.7%) |
Education in Portage
School Enrollment in Portage
The most common levels of schooling among the 11,648 students in Portage are middle school (2,690 | 23.1%), college / undergraduate (2,379 | 20.4%), and high school (2,276 | 19.5%).
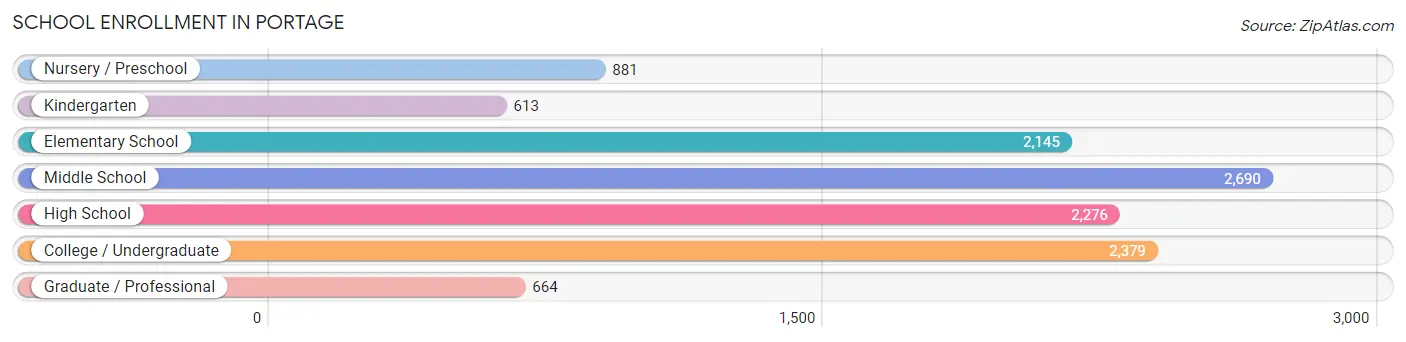
| School Level | # Students | % Students |
| Nursery / Preschool | 881 | 7.6% |
| Kindergarten | 613 | 5.3% |
| Elementary School | 2,145 | 18.4% |
| Middle School | 2,690 | 23.1% |
| High School | 2,276 | 19.5% |
| College / Undergraduate | 2,379 | 20.4% |
| Graduate / Professional | 664 | 5.7% |
| Total | 11,648 | 100.0% |
School Enrollment by Age by Funding Source in Portage
Out of a total of 11,648 students who are enrolled in schools in Portage, 1,607 (13.8%) attend a private institution, while the remaining 10,041 (86.2%) are enrolled in public schools. The age group of 3 to 4 year olds has the highest likelihood of being enrolled in private schools, with 374 (57.8% in the age bracket) enrolled. Conversely, the age group of 18 to 19 year olds has the lowest likelihood of being enrolled in a private school, with 538 (97.5% in the age bracket) attending a public institution.
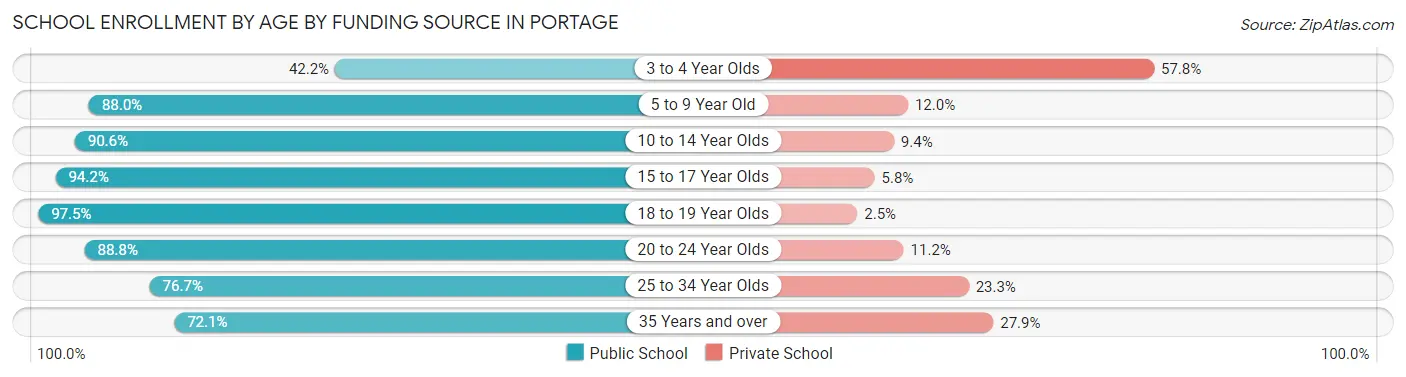
| Age Bracket | Public School | Private School |
| 3 to 4 Year Olds | 273 (42.2%) | 374 (57.8%) |
| 5 to 9 Year Old | 2,337 (88.0%) | 318 (12.0%) |
| 10 to 14 Year Olds | 2,867 (90.6%) | 296 (9.4%) |
| 15 to 17 Year Olds | 1,717 (94.2%) | 105 (5.8%) |
| 18 to 19 Year Olds | 538 (97.5%) | 14 (2.5%) |
| 20 to 24 Year Olds | 1,257 (88.8%) | 158 (11.2%) |
| 25 to 34 Year Olds | 728 (76.7%) | 221 (23.3%) |
| 35 Years and over | 321 (72.1%) | 124 (27.9%) |
| Total | 10,041 (86.2%) | 1,607 (13.8%) |
Educational Attainment by Field of Study in Portage
Business (3,062 | 17.8%), education (2,675 | 15.6%), science & technology (2,035 | 11.8%), bio, nature & agricultural (1,401 | 8.2%), and engineering (1,390 | 8.1%) are the most common fields of study among 17,178 individuals in Portage who have obtained a bachelor's degree or higher.
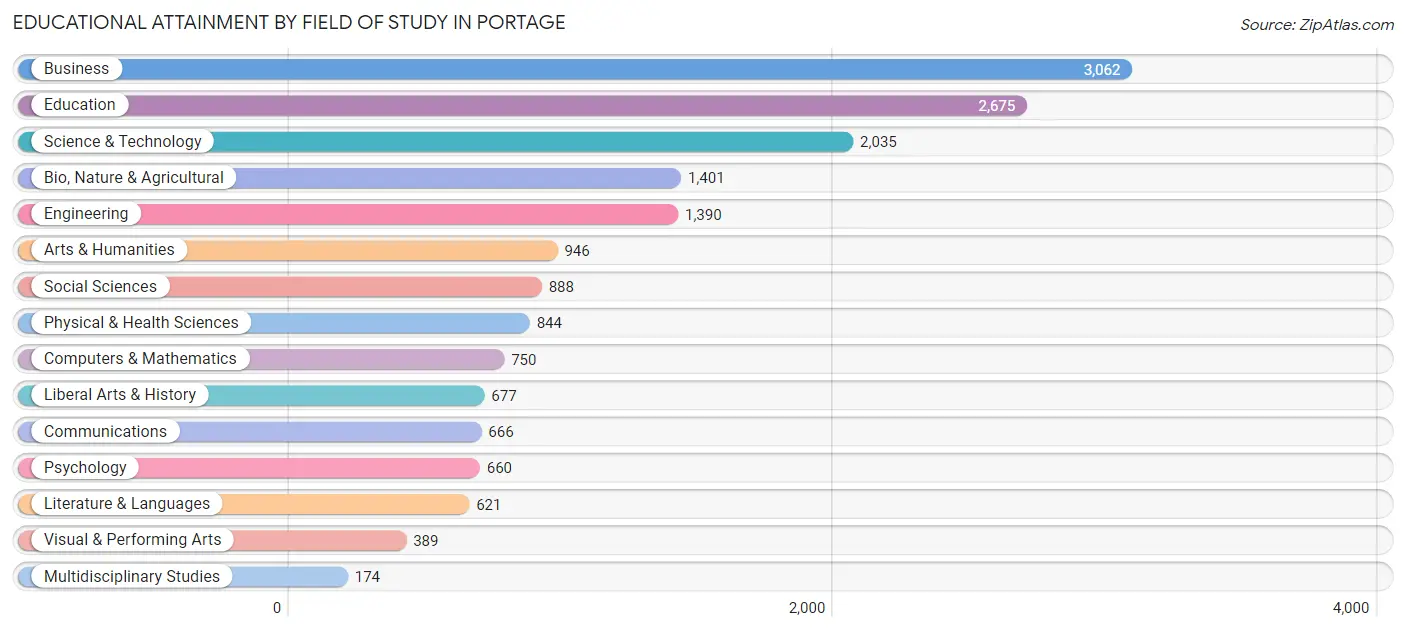
| Field of Study | # Graduates | % Graduates |
| Computers & Mathematics | 750 | 4.4% |
| Bio, Nature & Agricultural | 1,401 | 8.2% |
| Physical & Health Sciences | 844 | 4.9% |
| Psychology | 660 | 3.8% |
| Social Sciences | 888 | 5.2% |
| Engineering | 1,390 | 8.1% |
| Multidisciplinary Studies | 174 | 1.0% |
| Science & Technology | 2,035 | 11.8% |
| Business | 3,062 | 17.8% |
| Education | 2,675 | 15.6% |
| Literature & Languages | 621 | 3.6% |
| Liberal Arts & History | 677 | 3.9% |
| Visual & Performing Arts | 389 | 2.3% |
| Communications | 666 | 3.9% |
| Arts & Humanities | 946 | 5.5% |
| Total | 17,178 | 100.0% |
Transportation & Commute in Portage
Vehicle Availability by Sex in Portage
The most prevalent vehicle ownership categories in Portage are males with 2 vehicles (6,584, accounting for 50.0%) and females with 2 vehicles (5,565, making up 55.1%).
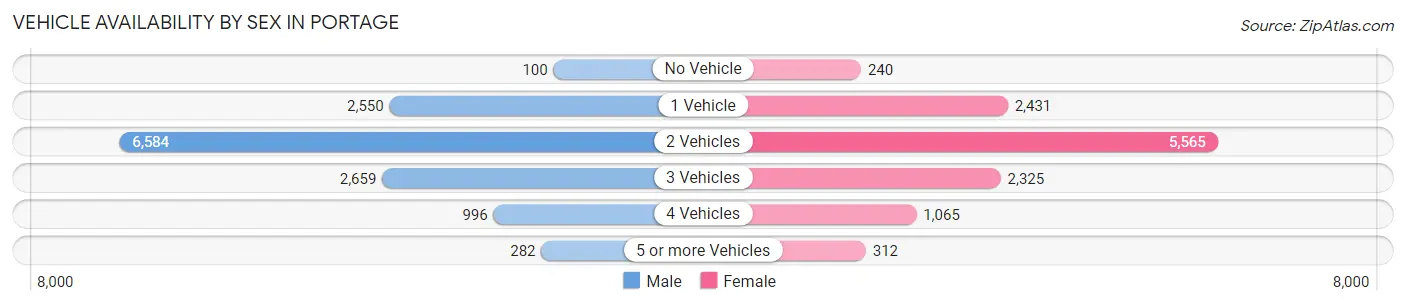
| Vehicles Available | Male | Female |
| No Vehicle | 100 (0.8%) | 240 (2.0%) |
| 1 Vehicle | 2,550 (19.4%) | 2,431 (20.4%) |
| 2 Vehicles | 6,584 (50.0%) | 5,565 (46.6%) |
| 3 Vehicles | 2,659 (20.2%) | 2,325 (19.5%) |
| 4 Vehicles | 996 (7.6%) | 1,065 (8.9%) |
| 5 or more Vehicles | 282 (2.1%) | 312 (2.6%) |
| Total | 13,171 (100.0%) | 11,938 (100.0%) |
Commute Time in Portage
The most frequently occuring commute durations in Portage are 15 to 19 minutes (4,844 commuters, 21.3%), 10 to 14 minutes (4,841 commuters, 21.3%), and 20 to 24 minutes (3,220 commuters, 14.2%).
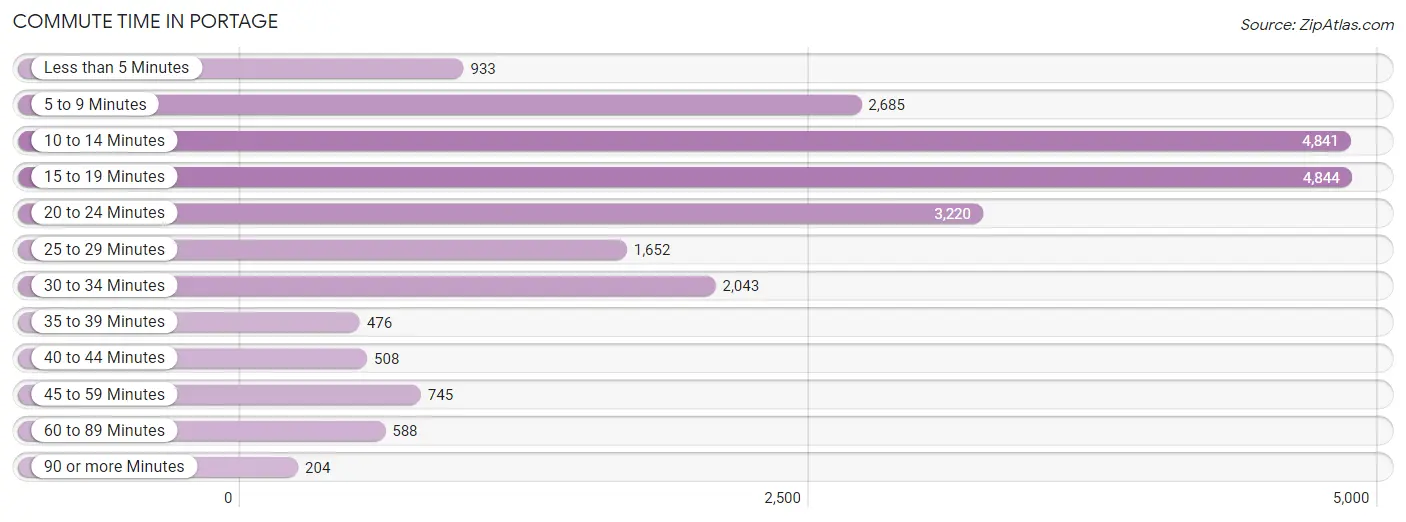
| Commute Time | # Commuters | % Commuters |
| Less than 5 Minutes | 933 | 4.1% |
| 5 to 9 Minutes | 2,685 | 11.8% |
| 10 to 14 Minutes | 4,841 | 21.3% |
| 15 to 19 Minutes | 4,844 | 21.3% |
| 20 to 24 Minutes | 3,220 | 14.2% |
| 25 to 29 Minutes | 1,652 | 7.3% |
| 30 to 34 Minutes | 2,043 | 9.0% |
| 35 to 39 Minutes | 476 | 2.1% |
| 40 to 44 Minutes | 508 | 2.2% |
| 45 to 59 Minutes | 745 | 3.3% |
| 60 to 89 Minutes | 588 | 2.6% |
| 90 or more Minutes | 204 | 0.9% |
Commute Time by Sex in Portage
The most common commute times in Portage are 10 to 14 minutes (2,563 commuters, 21.3%) for males and 15 to 19 minutes (2,422 commuters, 22.6%) for females.
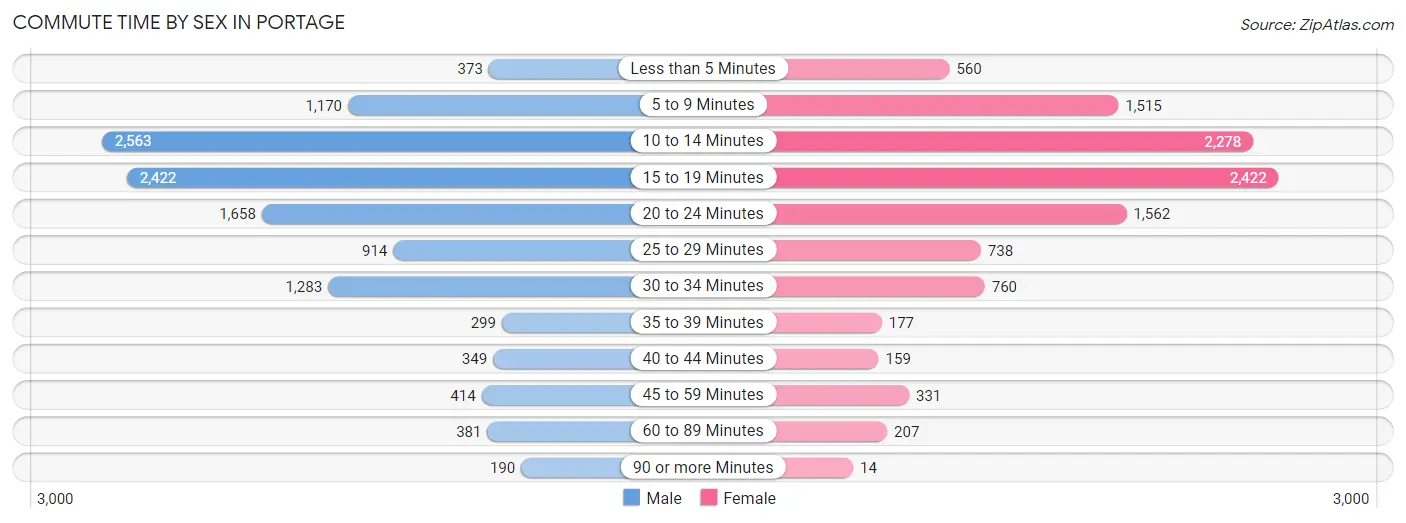
| Commute Time | Male | Female |
| Less than 5 Minutes | 373 (3.1%) | 560 (5.2%) |
| 5 to 9 Minutes | 1,170 (9.7%) | 1,515 (14.1%) |
| 10 to 14 Minutes | 2,563 (21.3%) | 2,278 (21.2%) |
| 15 to 19 Minutes | 2,422 (20.2%) | 2,422 (22.6%) |
| 20 to 24 Minutes | 1,658 (13.8%) | 1,562 (14.6%) |
| 25 to 29 Minutes | 914 (7.6%) | 738 (6.9%) |
| 30 to 34 Minutes | 1,283 (10.7%) | 760 (7.1%) |
| 35 to 39 Minutes | 299 (2.5%) | 177 (1.7%) |
| 40 to 44 Minutes | 349 (2.9%) | 159 (1.5%) |
| 45 to 59 Minutes | 414 (3.5%) | 331 (3.1%) |
| 60 to 89 Minutes | 381 (3.2%) | 207 (1.9%) |
| 90 or more Minutes | 190 (1.6%) | 14 (0.1%) |
Time of Departure to Work by Sex in Portage
The most frequent times of departure to work in Portage are 7:30 AM to 7:59 AM (1,813, 15.1%) for males and 7:30 AM to 7:59 AM (2,216, 20.7%) for females.
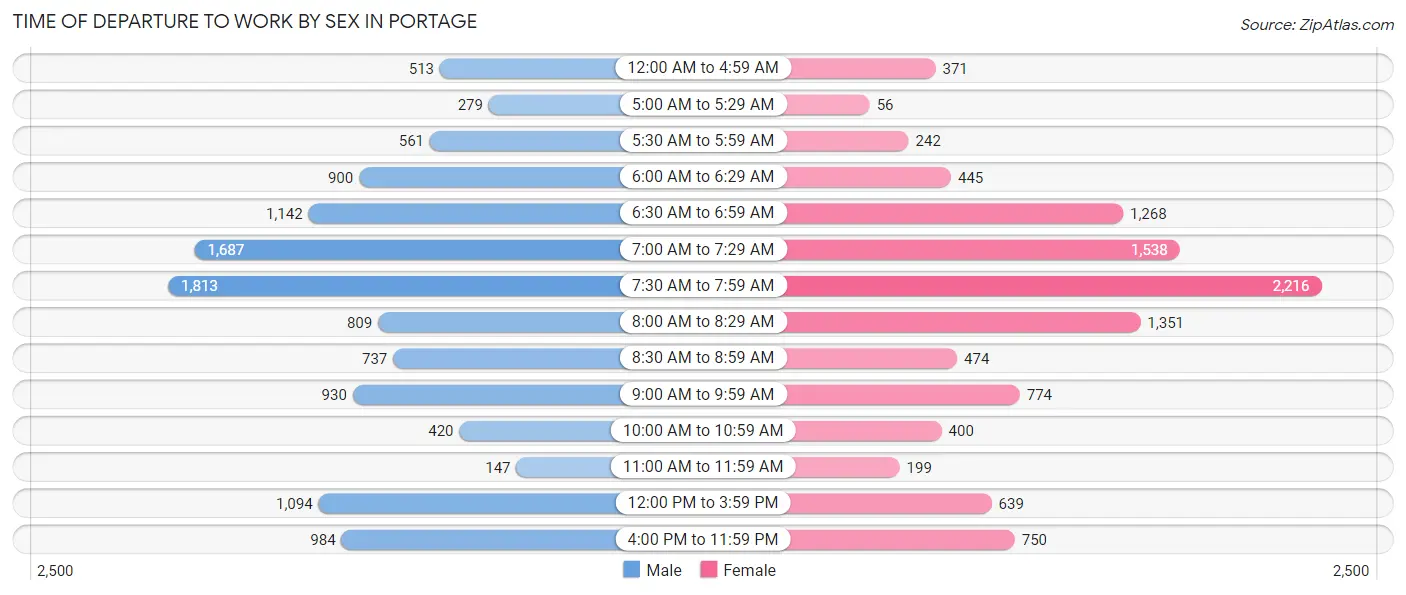
| Time of Departure | Male | Female |
| 12:00 AM to 4:59 AM | 513 (4.3%) | 371 (3.5%) |
| 5:00 AM to 5:29 AM | 279 (2.3%) | 56 (0.5%) |
| 5:30 AM to 5:59 AM | 561 (4.7%) | 242 (2.3%) |
| 6:00 AM to 6:29 AM | 900 (7.5%) | 445 (4.2%) |
| 6:30 AM to 6:59 AM | 1,142 (9.5%) | 1,268 (11.8%) |
| 7:00 AM to 7:29 AM | 1,687 (14.0%) | 1,538 (14.3%) |
| 7:30 AM to 7:59 AM | 1,813 (15.1%) | 2,216 (20.7%) |
| 8:00 AM to 8:29 AM | 809 (6.7%) | 1,351 (12.6%) |
| 8:30 AM to 8:59 AM | 737 (6.1%) | 474 (4.4%) |
| 9:00 AM to 9:59 AM | 930 (7.7%) | 774 (7.2%) |
| 10:00 AM to 10:59 AM | 420 (3.5%) | 400 (3.7%) |
| 11:00 AM to 11:59 AM | 147 (1.2%) | 199 (1.9%) |
| 12:00 PM to 3:59 PM | 1,094 (9.1%) | 639 (6.0%) |
| 4:00 PM to 11:59 PM | 984 (8.2%) | 750 (7.0%) |
| Total | 12,016 (100.0%) | 10,723 (100.0%) |
Housing Occupancy in Portage
Occupancy by Ownership in Portage
Of the total 20,370 dwellings in Portage, owner-occupied units account for 13,436 (66.0%), while renter-occupied units make up 6,934 (34.0%).
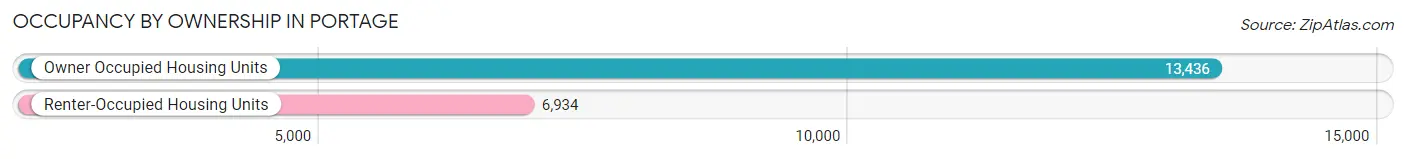
| Occupancy | # Housing Units | % Housing Units |
| Owner Occupied Housing Units | 13,436 | 66.0% |
| Renter-Occupied Housing Units | 6,934 | 34.0% |
| Total Occupied Housing Units | 20,370 | 100.0% |
Occupancy by Household Size in Portage
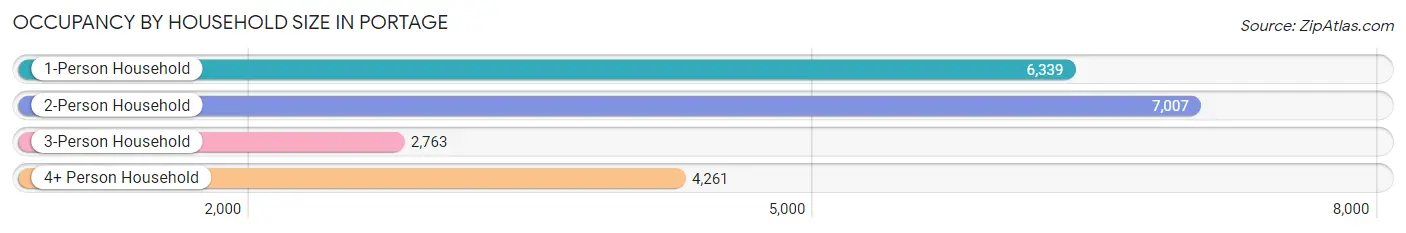
| Household Size | # Housing Units | % Housing Units |
| 1-Person Household | 6,339 | 31.1% |
| 2-Person Household | 7,007 | 34.4% |
| 3-Person Household | 2,763 | 13.6% |
| 4+ Person Household | 4,261 | 20.9% |
| Total Housing Units | 20,370 | 100.0% |
Occupancy by Ownership by Household Size in Portage
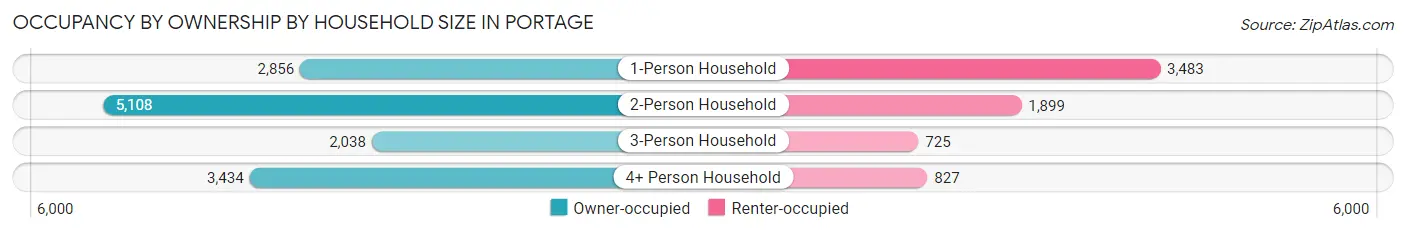
| Household Size | Owner-occupied | Renter-occupied |
| 1-Person Household | 2,856 (45.1%) | 3,483 (54.9%) |
| 2-Person Household | 5,108 (72.9%) | 1,899 (27.1%) |
| 3-Person Household | 2,038 (73.8%) | 725 (26.2%) |
| 4+ Person Household | 3,434 (80.6%) | 827 (19.4%) |
| Total Housing Units | 13,436 (66.0%) | 6,934 (34.0%) |
Occupancy by Educational Attainment in Portage

| Household Size | Owner-occupied | Renter-occupied |
| Less than High School | 218 (30.1%) | 505 (69.9%) |
| High School Diploma | 1,996 (54.5%) | 1,667 (45.5%) |
| College/Associate Degree | 4,048 (65.3%) | 2,149 (34.7%) |
| Bachelor's Degree or higher | 7,174 (73.3%) | 2,613 (26.7%) |
Occupancy by Age of Householder in Portage
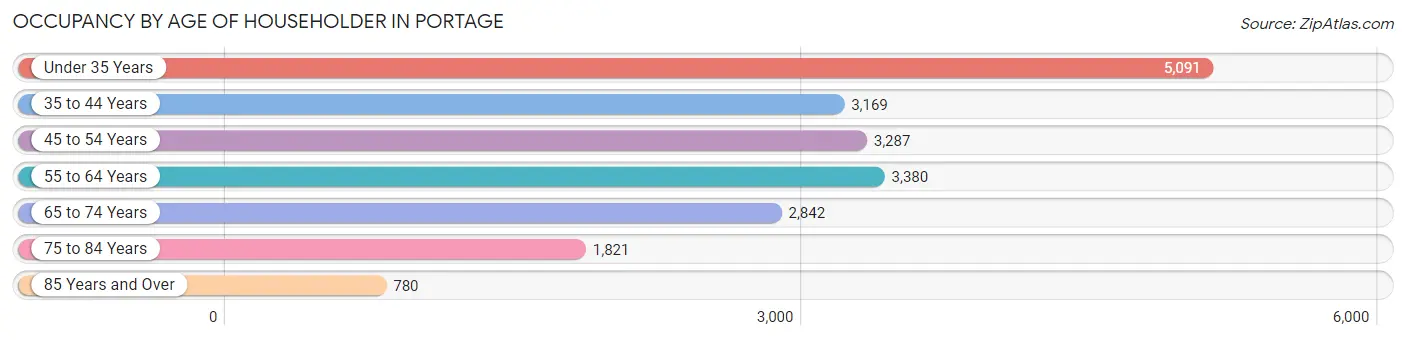
| Age Bracket | # Households | % Households |
| Under 35 Years | 5,091 | 25.0% |
| 35 to 44 Years | 3,169 | 15.6% |
| 45 to 54 Years | 3,287 | 16.1% |
| 55 to 64 Years | 3,380 | 16.6% |
| 65 to 74 Years | 2,842 | 14.0% |
| 75 to 84 Years | 1,821 | 8.9% |
| 85 Years and Over | 780 | 3.8% |
| Total | 20,370 | 100.0% |
Housing Finances in Portage
Median Income by Occupancy in Portage
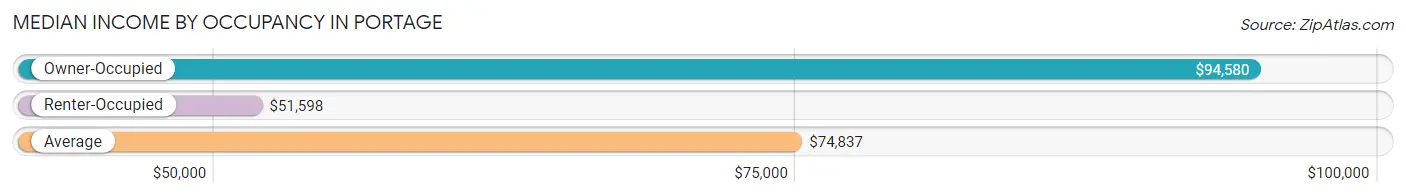
| Occupancy Type | # Households | Median Income |
| Owner-Occupied | 13,436 (66.0%) | $94,580 |
| Renter-Occupied | 6,934 (34.0%) | $51,598 |
| Average | 20,370 (100.0%) | $74,837 |
Occupancy by Householder Income Bracket in Portage
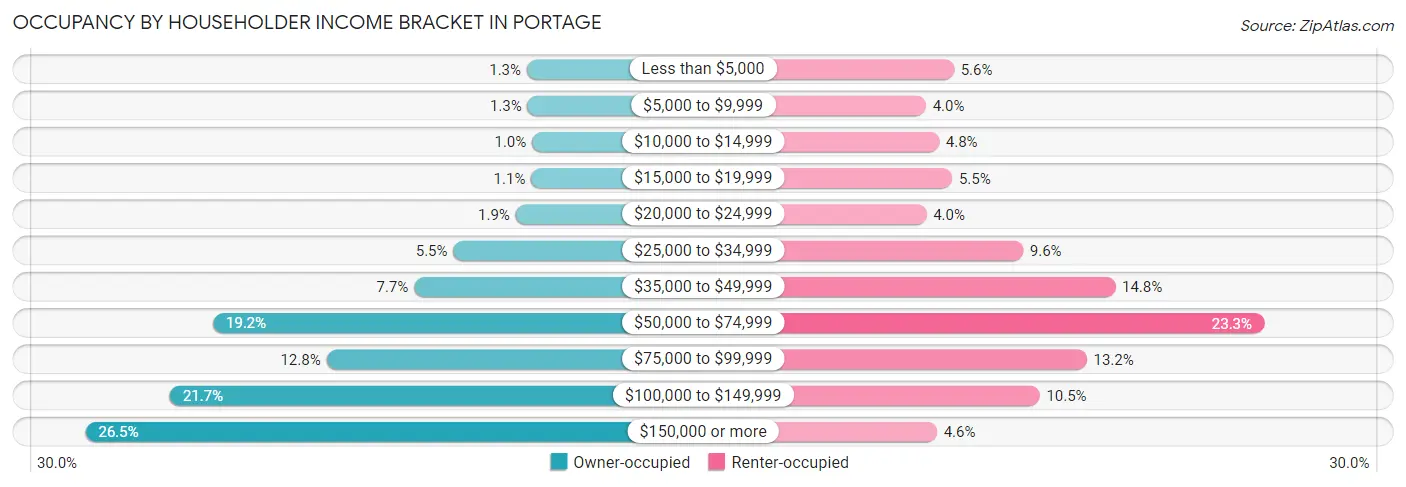
| Income Bracket | Owner-occupied | Renter-occupied |
| Less than $5,000 | 175 (1.3%) | 389 (5.6%) |
| $5,000 to $9,999 | 169 (1.3%) | 278 (4.0%) |
| $10,000 to $14,999 | 134 (1.0%) | 330 (4.8%) |
| $15,000 to $19,999 | 141 (1.1%) | 382 (5.5%) |
| $20,000 to $24,999 | 260 (1.9%) | 280 (4.0%) |
| $25,000 to $34,999 | 739 (5.5%) | 663 (9.6%) |
| $35,000 to $49,999 | 1,040 (7.7%) | 1,028 (14.8%) |
| $50,000 to $74,999 | 2,585 (19.2%) | 1,618 (23.3%) |
| $75,000 to $99,999 | 1,713 (12.8%) | 915 (13.2%) |
| $100,000 to $149,999 | 2,915 (21.7%) | 729 (10.5%) |
| $150,000 or more | 3,565 (26.5%) | 322 (4.6%) |
| Total | 13,436 (100.0%) | 6,934 (100.0%) |
Monthly Housing Cost Tiers in Portage
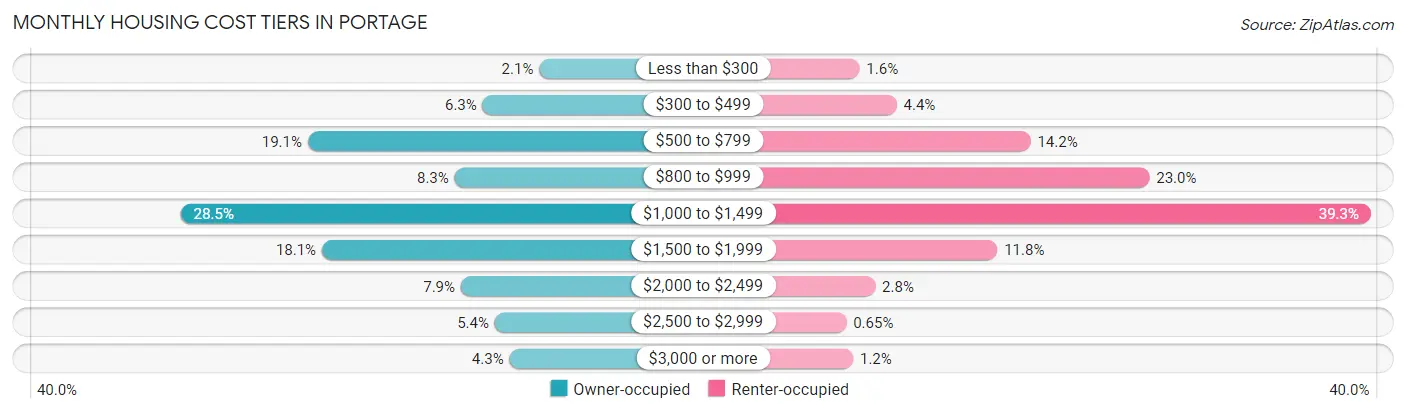
| Monthly Cost | Owner-occupied | Renter-occupied |
| Less than $300 | 282 (2.1%) | 112 (1.6%) |
| $300 to $499 | 843 (6.3%) | 302 (4.4%) |
| $500 to $799 | 2,572 (19.1%) | 986 (14.2%) |
| $800 to $999 | 1,119 (8.3%) | 1,593 (23.0%) |
| $1,000 to $1,499 | 3,831 (28.5%) | 2,724 (39.3%) |
| $1,500 to $1,999 | 2,432 (18.1%) | 816 (11.8%) |
| $2,000 to $2,499 | 1,058 (7.9%) | 193 (2.8%) |
| $2,500 to $2,999 | 722 (5.4%) | 45 (0.6%) |
| $3,000 or more | 577 (4.3%) | 80 (1.1%) |
| Total | 13,436 (100.0%) | 6,934 (100.0%) |
Physical Housing Characteristics in Portage
Housing Structures in Portage
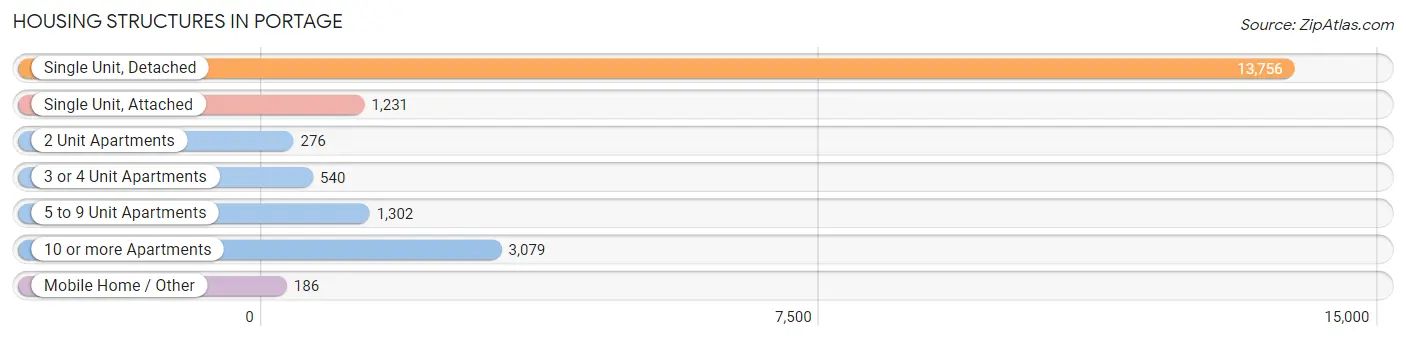
| Structure Type | # Housing Units | % Housing Units |
| Single Unit, Detached | 13,756 | 67.5% |
| Single Unit, Attached | 1,231 | 6.0% |
| 2 Unit Apartments | 276 | 1.3% |
| 3 or 4 Unit Apartments | 540 | 2.6% |
| 5 to 9 Unit Apartments | 1,302 | 6.4% |
| 10 or more Apartments | 3,079 | 15.1% |
| Mobile Home / Other | 186 | 0.9% |
| Total | 20,370 | 100.0% |
Housing Structures by Occupancy in Portage
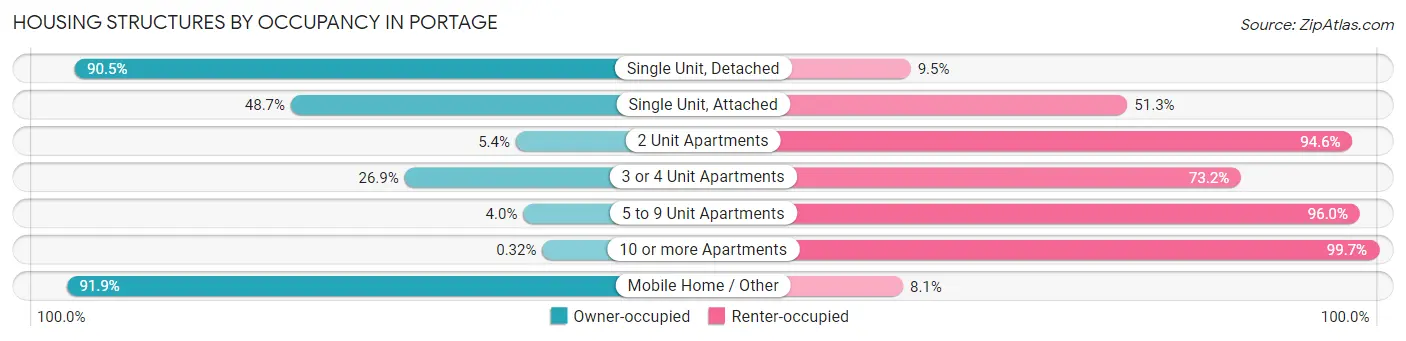
| Structure Type | Owner-occupied | Renter-occupied |
| Single Unit, Detached | 12,443 (90.5%) | 1,313 (9.5%) |
| Single Unit, Attached | 600 (48.7%) | 631 (51.3%) |
| 2 Unit Apartments | 15 (5.4%) | 261 (94.6%) |
| 3 or 4 Unit Apartments | 145 (26.9%) | 395 (73.2%) |
| 5 to 9 Unit Apartments | 52 (4.0%) | 1,250 (96.0%) |
| 10 or more Apartments | 10 (0.3%) | 3,069 (99.7%) |
| Mobile Home / Other | 171 (91.9%) | 15 (8.1%) |
| Total | 13,436 (66.0%) | 6,934 (34.0%) |
Housing Structures by Number of Rooms in Portage
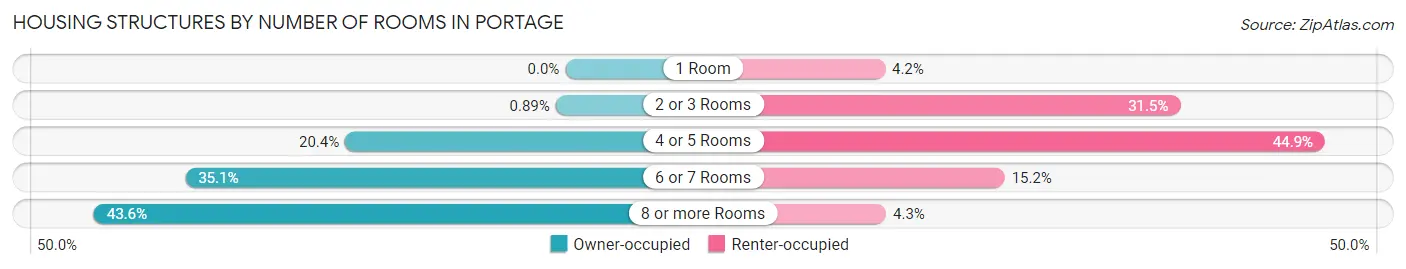
| Number of Rooms | Owner-occupied | Renter-occupied |
| 1 Room | 0 (0.0%) | 289 (4.2%) |
| 2 or 3 Rooms | 120 (0.9%) | 2,182 (31.5%) |
| 4 or 5 Rooms | 2,736 (20.4%) | 3,110 (44.9%) |
| 6 or 7 Rooms | 4,722 (35.1%) | 1,057 (15.2%) |
| 8 or more Rooms | 5,858 (43.6%) | 296 (4.3%) |
| Total | 13,436 (100.0%) | 6,934 (100.0%) |
Housing Structure by Heating Type in Portage
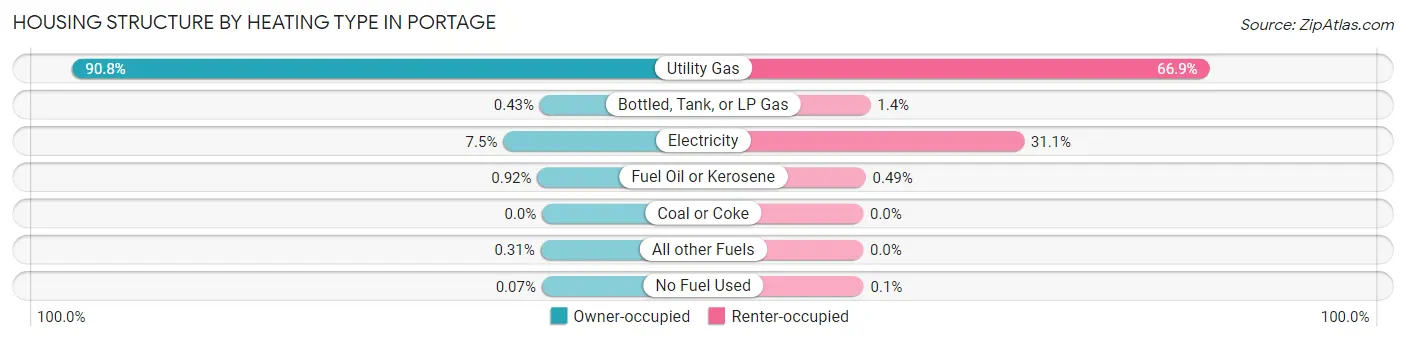
| Heating Type | Owner-occupied | Renter-occupied |
| Utility Gas | 12,195 (90.8%) | 4,640 (66.9%) |
| Bottled, Tank, or LP Gas | 58 (0.4%) | 98 (1.4%) |
| Electricity | 1,009 (7.5%) | 2,155 (31.1%) |
| Fuel Oil or Kerosene | 123 (0.9%) | 34 (0.5%) |
| Coal or Coke | 0 (0.0%) | 0 (0.0%) |
| All other Fuels | 41 (0.3%) | 0 (0.0%) |
| No Fuel Used | 10 (0.1%) | 7 (0.1%) |
| Total | 13,436 (100.0%) | 6,934 (100.0%) |
Household Vehicle Usage in Portage
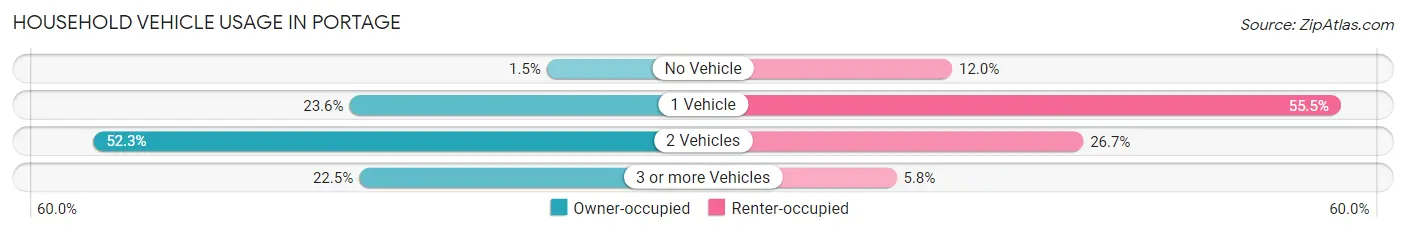
| Vehicles per Household | Owner-occupied | Renter-occupied |
| No Vehicle | 204 (1.5%) | 832 (12.0%) |
| 1 Vehicle | 3,175 (23.6%) | 3,851 (55.5%) |
| 2 Vehicles | 7,028 (52.3%) | 1,851 (26.7%) |
| 3 or more Vehicles | 3,029 (22.5%) | 400 (5.8%) |
| Total | 13,436 (100.0%) | 6,934 (100.0%) |
Real Estate & Mortgages in Portage
Real Estate and Mortgage Overview in Portage
| Characteristic | Without Mortgage | With Mortgage |
| Housing Units | 4,704 | 8,732 |
| Median Property Value | $221,000 | $223,700 |
| Median Household Income | $74,645 | $2,551 |
| Monthly Housing Costs | $667 | $563 |
| Real Estate Taxes | $3,804 | $166 |
Property Value by Mortgage Status in Portage
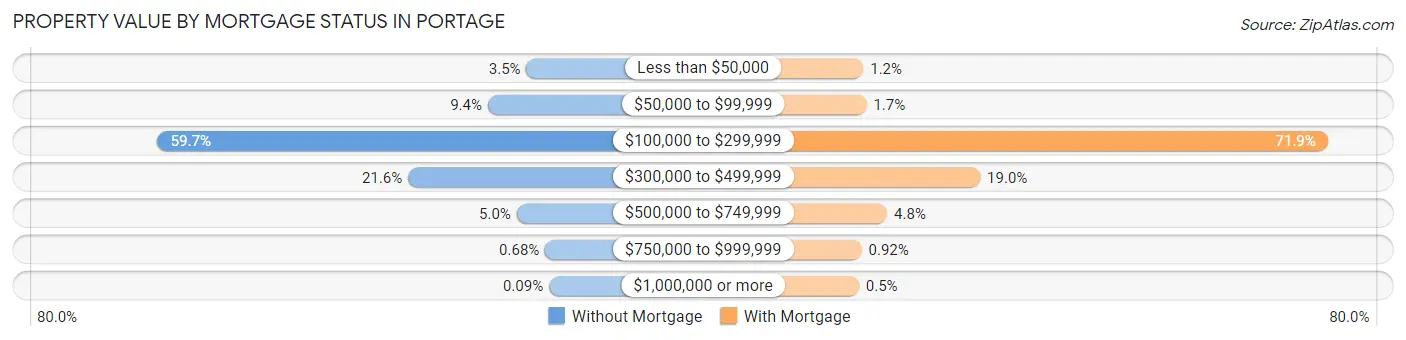
| Property Value | Without Mortgage | With Mortgage |
| Less than $50,000 | 166 (3.5%) | 103 (1.2%) |
| $50,000 to $99,999 | 443 (9.4%) | 145 (1.7%) |
| $100,000 to $299,999 | 2,809 (59.7%) | 6,281 (71.9%) |
| $300,000 to $499,999 | 1,014 (21.6%) | 1,658 (19.0%) |
| $500,000 to $749,999 | 236 (5.0%) | 421 (4.8%) |
| $750,000 to $999,999 | 32 (0.7%) | 80 (0.9%) |
| $1,000,000 or more | 4 (0.1%) | 44 (0.5%) |
| Total | 4,704 (100.0%) | 8,732 (100.0%) |
Household Income by Mortgage Status in Portage
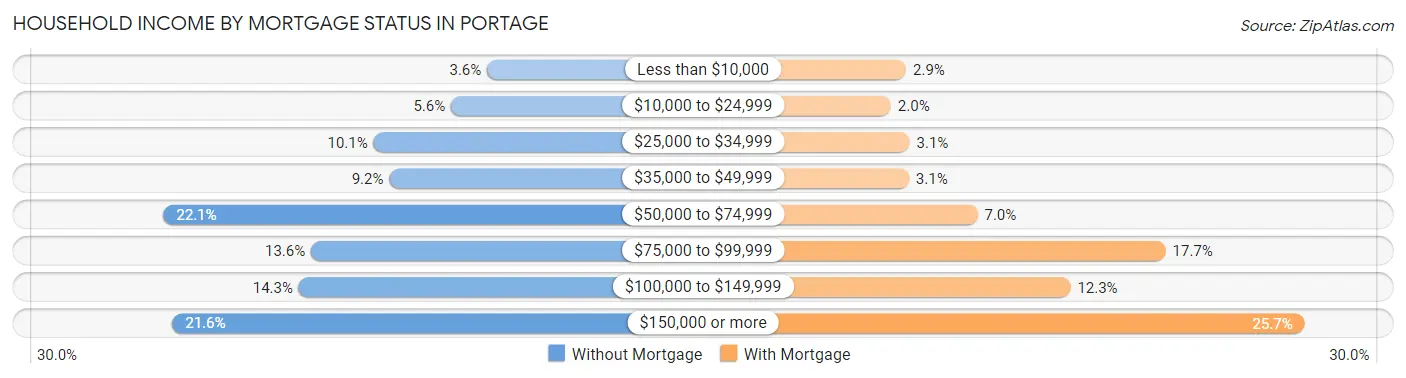
| Household Income | Without Mortgage | With Mortgage |
| Less than $10,000 | 168 (3.6%) | 252 (2.9%) |
| $10,000 to $24,999 | 265 (5.6%) | 176 (2.0%) |
| $25,000 to $34,999 | 473 (10.1%) | 270 (3.1%) |
| $35,000 to $49,999 | 431 (9.2%) | 266 (3.0%) |
| $50,000 to $74,999 | 1,038 (22.1%) | 609 (7.0%) |
| $75,000 to $99,999 | 641 (13.6%) | 1,547 (17.7%) |
| $100,000 to $149,999 | 674 (14.3%) | 1,072 (12.3%) |
| $150,000 or more | 1,014 (21.6%) | 2,241 (25.7%) |
| Total | 4,704 (100.0%) | 8,732 (100.0%) |
Property Value to Household Income Ratio in Portage
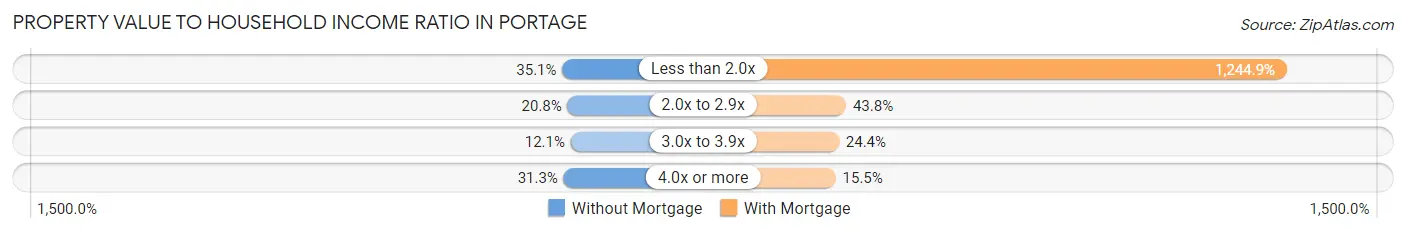
| Value-to-Income Ratio | Without Mortgage | With Mortgage |
| Less than 2.0x | 1,650 (35.1%) | 108,703 (1,244.9%) |
| 2.0x to 2.9x | 978 (20.8%) | 3,826 (43.8%) |
| 3.0x to 3.9x | 569 (12.1%) | 2,129 (24.4%) |
| 4.0x or more | 1,474 (31.3%) | 1,354 (15.5%) |
| Total | 4,704 (100.0%) | 8,732 (100.0%) |
Real Estate Taxes by Mortgage Status in Portage
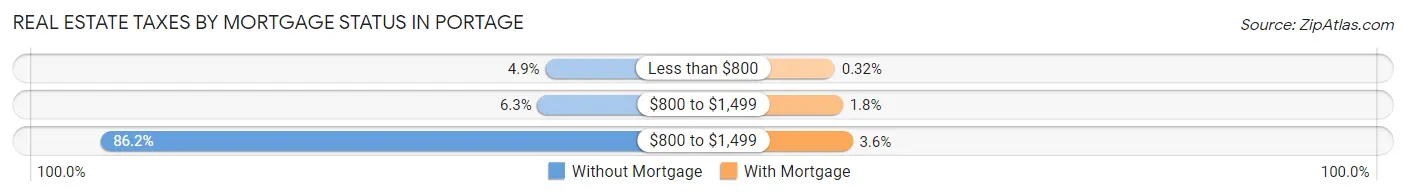
| Property Taxes | Without Mortgage | With Mortgage |
| Less than $800 | 229 (4.9%) | 28 (0.3%) |
| $800 to $1,499 | 297 (6.3%) | 154 (1.8%) |
| $800 to $1,499 | 4,054 (86.2%) | 310 (3.5%) |
| Total | 4,704 (100.0%) | 8,732 (100.0%) |
Health & Disability in Portage
Health Insurance Coverage by Age in Portage
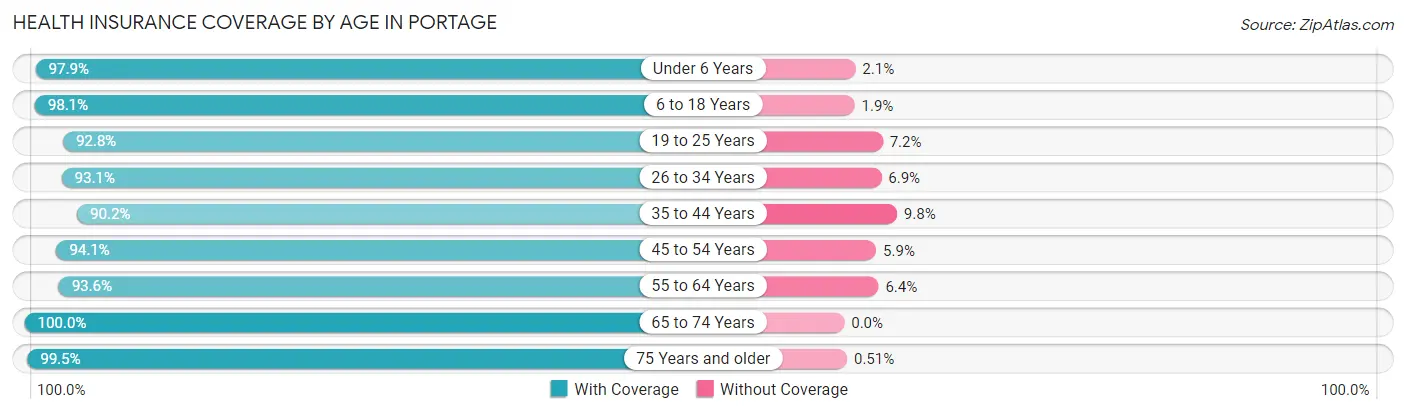
| Age Bracket | With Coverage | Without Coverage |
| Under 6 Years | 3,543 (97.9%) | 75 (2.1%) |
| 6 to 18 Years | 7,574 (98.1%) | 148 (1.9%) |
| 19 to 25 Years | 5,664 (92.8%) | 437 (7.2%) |
| 26 to 34 Years | 5,553 (93.1%) | 412 (6.9%) |
| 35 to 44 Years | 5,193 (90.2%) | 565 (9.8%) |
| 45 to 54 Years | 5,196 (94.1%) | 328 (5.9%) |
| 55 to 64 Years | 5,557 (93.6%) | 378 (6.4%) |
| 65 to 74 Years | 4,590 (100.0%) | 0 (0.0%) |
| 75 Years and older | 3,486 (99.5%) | 18 (0.5%) |
| Total | 46,356 (95.2%) | 2,361 (4.9%) |
Health Insurance Coverage by Citizenship Status in Portage
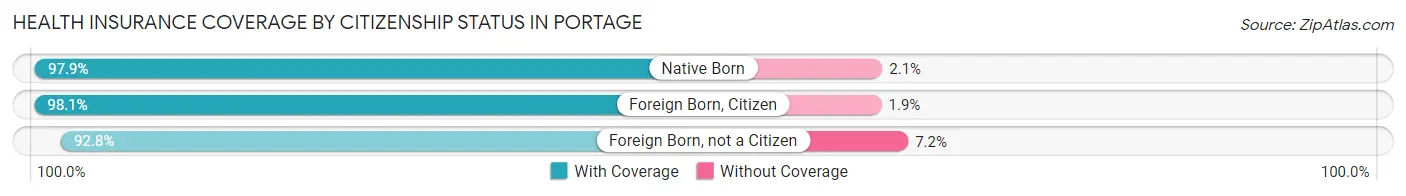
| Citizenship Status | With Coverage | Without Coverage |
| Native Born | 3,543 (97.9%) | 75 (2.1%) |
| Foreign Born, Citizen | 7,574 (98.1%) | 148 (1.9%) |
| Foreign Born, not a Citizen | 5,664 (92.8%) | 437 (7.2%) |
Health Insurance Coverage by Household Income in Portage
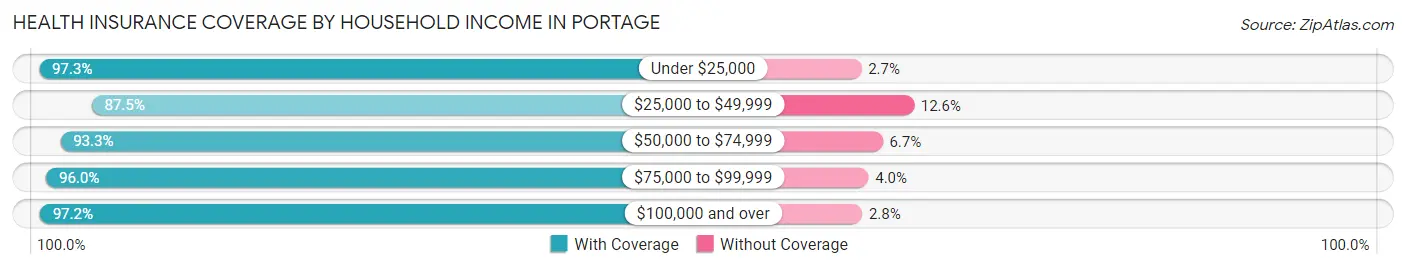
| Household Income | With Coverage | Without Coverage |
| Under $25,000 | 3,754 (97.3%) | 104 (2.7%) |
| $25,000 to $49,999 | 5,089 (87.5%) | 730 (12.6%) |
| $50,000 to $74,999 | 8,318 (93.3%) | 595 (6.7%) |
| $75,000 to $99,999 | 6,310 (96.0%) | 265 (4.0%) |
| $100,000 and over | 22,834 (97.2%) | 667 (2.8%) |
Public vs Private Health Insurance Coverage by Age in Portage
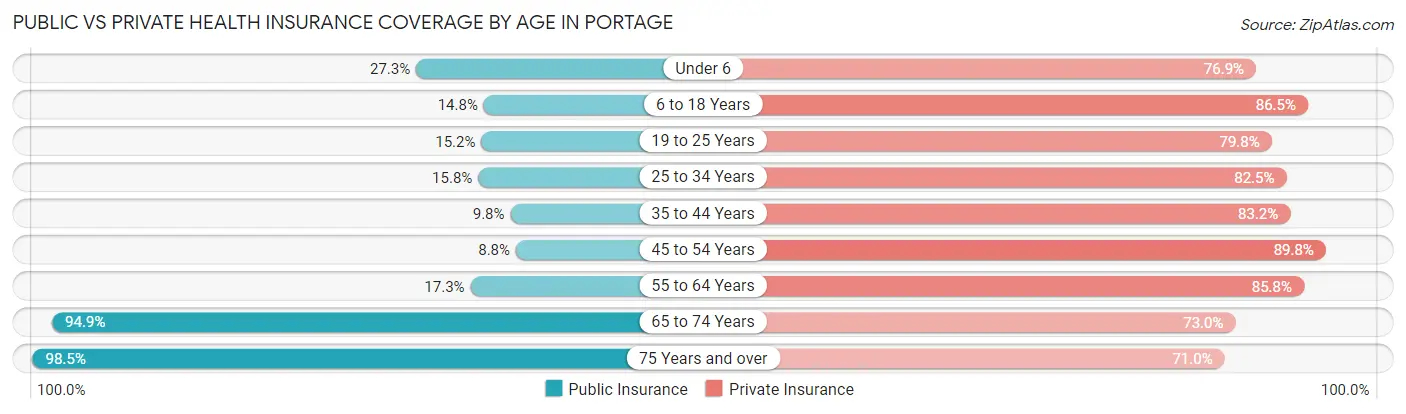
| Age Bracket | Public Insurance | Private Insurance |
| Under 6 | 989 (27.3%) | 2,781 (76.9%) |
| 6 to 18 Years | 1,141 (14.8%) | 6,679 (86.5%) |
| 19 to 25 Years | 929 (15.2%) | 4,866 (79.8%) |
| 25 to 34 Years | 943 (15.8%) | 4,921 (82.5%) |
| 35 to 44 Years | 566 (9.8%) | 4,791 (83.2%) |
| 45 to 54 Years | 487 (8.8%) | 4,961 (89.8%) |
| 55 to 64 Years | 1,024 (17.2%) | 5,089 (85.8%) |
| 65 to 74 Years | 4,356 (94.9%) | 3,352 (73.0%) |
| 75 Years and over | 3,452 (98.5%) | 2,489 (71.0%) |
| Total | 13,887 (28.5%) | 39,929 (82.0%) |
Disability Status by Sex by Age in Portage
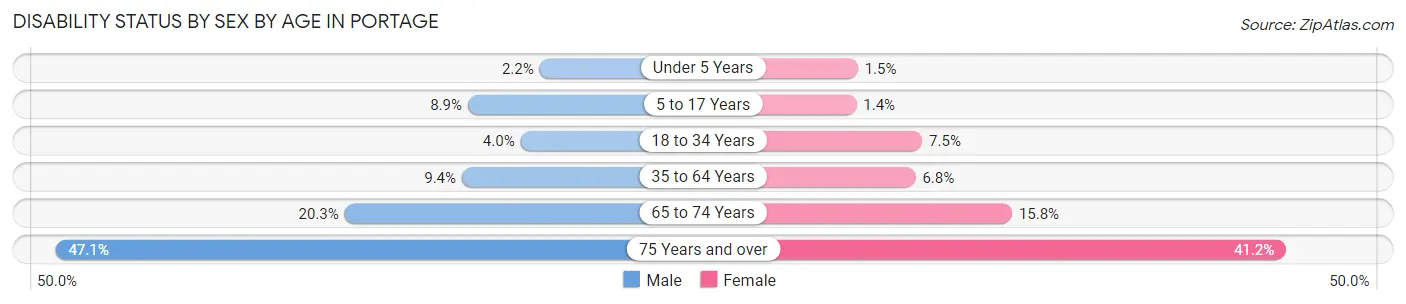
| Age Bracket | Male | Female |
| Under 5 Years | 34 (2.2%) | 21 (1.5%) |
| 5 to 17 Years | 355 (8.9%) | 53 (1.3%) |
| 18 to 34 Years | 250 (4.0%) | 465 (7.5%) |
| 35 to 64 Years | 805 (9.4%) | 593 (6.8%) |
| 65 to 74 Years | 410 (20.3%) | 406 (15.8%) |
| 75 Years and over | 656 (47.1%) | 871 (41.2%) |
Disability Class by Sex by Age in Portage
Disability Class: Hearing Difficulty
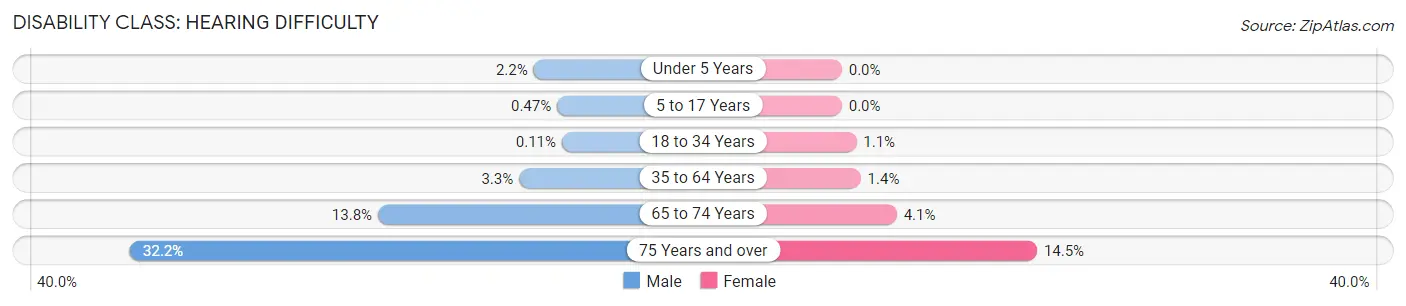
| Age Bracket | Male | Female |
| Under 5 Years | 34 (2.2%) | 0 (0.0%) |
| 5 to 17 Years | 19 (0.5%) | 0 (0.0%) |
| 18 to 34 Years | 7 (0.1%) | 67 (1.1%) |
| 35 to 64 Years | 281 (3.3%) | 121 (1.4%) |
| 65 to 74 Years | 278 (13.8%) | 105 (4.1%) |
| 75 Years and over | 448 (32.2%) | 306 (14.5%) |
Disability Class: Vision Difficulty
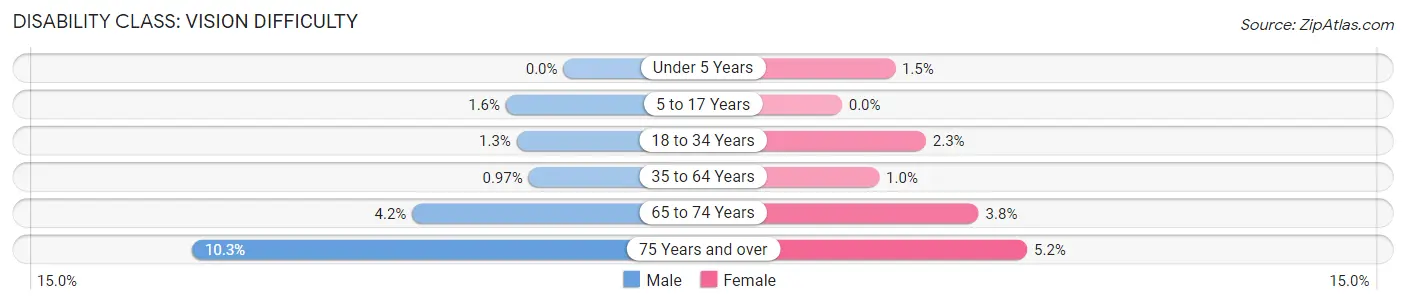
| Age Bracket | Male | Female |
| Under 5 Years | 0 (0.0%) | 21 (1.5%) |
| 5 to 17 Years | 64 (1.6%) | 0 (0.0%) |
| 18 to 34 Years | 82 (1.3%) | 146 (2.3%) |
| 35 to 64 Years | 83 (1.0%) | 90 (1.0%) |
| 65 to 74 Years | 85 (4.2%) | 98 (3.8%) |
| 75 Years and over | 144 (10.3%) | 109 (5.2%) |
Disability Class: Cognitive Difficulty
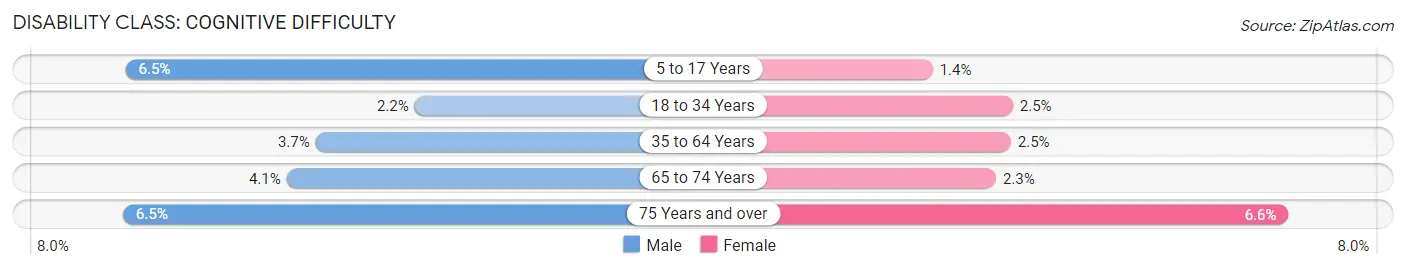
| Age Bracket | Male | Female |
| 5 to 17 Years | 260 (6.5%) | 53 (1.3%) |
| 18 to 34 Years | 139 (2.2%) | 158 (2.5%) |
| 35 to 64 Years | 314 (3.7%) | 218 (2.5%) |
| 65 to 74 Years | 83 (4.1%) | 59 (2.3%) |
| 75 Years and over | 91 (6.5%) | 140 (6.6%) |
Disability Class: Ambulatory Difficulty
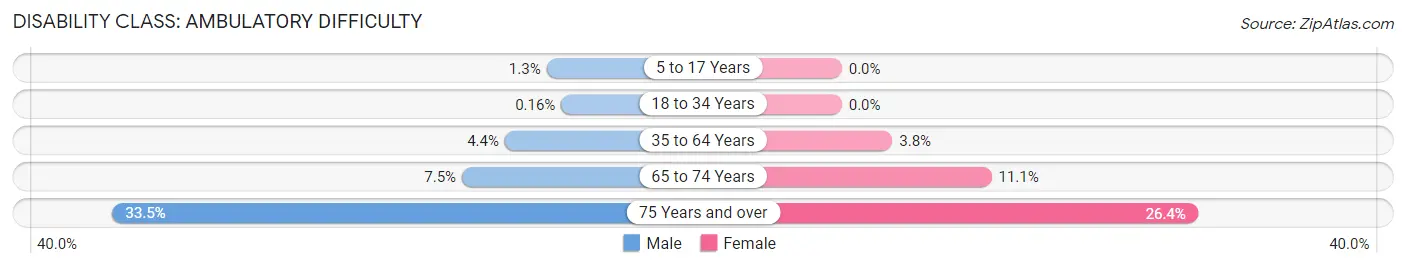
| Age Bracket | Male | Female |
| 5 to 17 Years | 50 (1.3%) | 0 (0.0%) |
| 18 to 34 Years | 10 (0.2%) | 0 (0.0%) |
| 35 to 64 Years | 372 (4.3%) | 325 (3.7%) |
| 65 to 74 Years | 152 (7.5%) | 286 (11.1%) |
| 75 Years and over | 466 (33.5%) | 558 (26.4%) |
Disability Class: Self-Care Difficulty
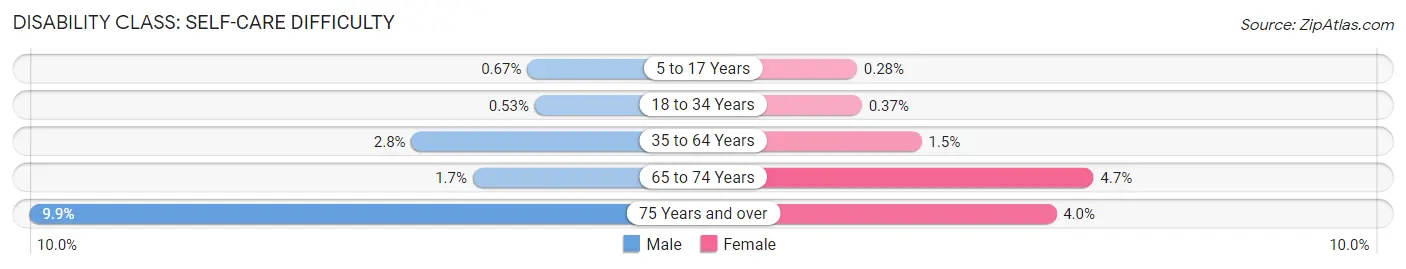
| Age Bracket | Male | Female |
| 5 to 17 Years | 27 (0.7%) | 11 (0.3%) |
| 18 to 34 Years | 33 (0.5%) | 23 (0.4%) |
| 35 to 64 Years | 241 (2.8%) | 128 (1.5%) |
| 65 to 74 Years | 34 (1.7%) | 120 (4.7%) |
| 75 Years and over | 138 (9.9%) | 84 (4.0%) |
Technology Access in Portage
Computing Device Access in Portage
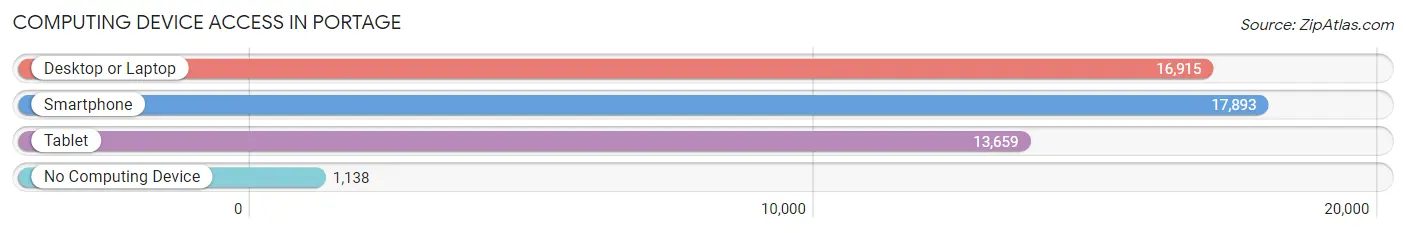
| Device Type | # Households | % Households |
| Desktop or Laptop | 16,915 | 83.0% |
| Smartphone | 17,893 | 87.8% |
| Tablet | 13,659 | 67.0% |
| No Computing Device | 1,138 | 5.6% |
| Total | 20,370 | 100.0% |
Internet Access in Portage
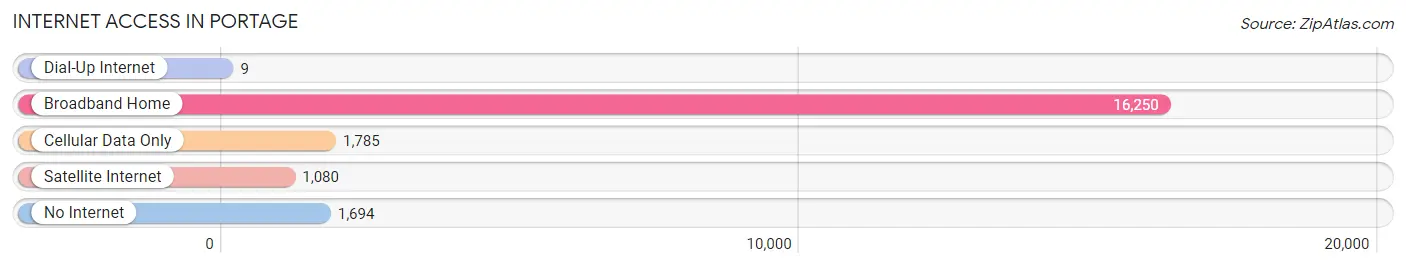
| Internet Type | # Households | % Households |
| Dial-Up Internet | 9 | 0.0% |
| Broadband Home | 16,250 | 79.8% |
| Cellular Data Only | 1,785 | 8.8% |
| Satellite Internet | 1,080 | 5.3% |
| No Internet | 1,694 | 8.3% |
| Total | 20,370 | 100.0% |
Portage Summary
Portage, Michigan is a city located in Kalamazoo County in the southwestern part of the state. It is situated along the Kalamazoo River and is part of the Kalamazoo-Portage Metropolitan Statistical Area. The city has a population of approximately 46,000 people and is the second largest city in the county.
History
The area that is now Portage was first settled in the early 1800s by settlers from New York and New England. The first permanent settlement was established in 1831 by a group of settlers led by William Johnston. The settlement was originally known as Johnston’s Landing, but was later renamed Portage after the nearby rapids on the Kalamazoo River.
The city was officially incorporated in 1867 and was initially a small farming community. In the late 19th century, the city began to grow rapidly due to the construction of the Michigan Central Railroad. This allowed for the transportation of goods and people to and from the city.
In the early 20th century, the city continued to grow and develop. The city was home to several factories and businesses, including the Portage Paper Company, which was the largest employer in the city. The city also became a popular tourist destination due to its proximity to Lake Michigan.
Geography
Portage is located in southwestern Michigan, approximately 20 miles south of Kalamazoo. The city is situated along the Kalamazoo River and is bordered by the cities of Kalamazoo, Parchment, and Oshtemo. The city covers an area of approximately 16 square miles and has a population density of 2,845 people per square mile.
The city is located in a temperate climate zone and experiences four distinct seasons. Summers are warm and humid, while winters are cold and snowy. The average annual temperature is around 50 degrees Fahrenheit.
Economy
The economy of Portage is largely based on manufacturing and retail. The city is home to several large manufacturing companies, including the Portage Paper Company, which is the largest employer in the city. Other major employers include Stryker Corporation, Pfizer, and the Kalamazoo County government.
The city also has a thriving retail sector, with several large shopping centers and malls. The city is also home to several restaurants, bars, and entertainment venues.
Demographics
As of the 2010 census, the population of Portage was 46,292. The racial makeup of the city was 87.3% White, 6.2% African American, 0.7% Native American, 1.7% Asian, 0.1% Pacific Islander, and 2.9% from other races. Hispanic or Latino of any race were 5.2% of the population.
The median household income in Portage was $50,945, and the median family income was $62,917. The per capita income was $25,945. About 8.3% of the population was below the poverty line.
Portage is a diverse city with a rich history and a vibrant economy. The city is home to a variety of businesses and industries, and is a popular tourist destination due to its proximity to Lake Michigan. The city has a population of approximately 46,000 people and is the second largest city in Kalamazoo County.
Common Questions
What is Per Capita Income in Portage?
Per Capita income in Portage is $42,122.
What is the Median Family Income in Portage?
Median Family Income in Portage is $102,922.
What is the Median Household income in Portage?
Median Household Income in Portage is $74,837.
What is Income or Wage Gap in Portage?
Income or Wage Gap in Portage is 32.8%.
Women in Portage earn 67.2 cents for every dollar earned by a man.
What is Inequality or Gini Index in Portage?
Inequality or Gini Index in Portage is 0.43.
What is the Total Population of Portage?
Total Population of Portage is 48,936.
What is the Total Male Population of Portage?
Total Male Population of Portage is 23,889.
What is the Total Female Population of Portage?
Total Female Population of Portage is 25,047.
What is the Ratio of Males per 100 Females in Portage?
There are 95.38 Males per 100 Females in Portage.
What is the Ratio of Females per 100 Males in Portage?
There are 104.85 Females per 100 Males in Portage.
What is the Median Population Age in Portage?
Median Population Age in Portage is 36.7 Years.
What is the Average Family Size in Portage
Average Family Size in Portage is 3.1 People.
What is the Average Household Size in Portage
Average Household Size in Portage is 2.4 People.
How Large is the Labor Force in Portage?
There are 27,066 People in the Labor Forcein in Portage.
What is the Percentage of People in the Labor Force in Portage?
69.0% of People are in the Labor Force in Portage.
What is the Unemployment Rate in Portage?
Unemployment Rate in Portage is 6.1%.