Whitehall, MI Map & Demographics
Whitehall Map
Whitehall Overview
$31,176
PER CAPITA INCOME
$78,665
AVG FAMILY INCOME
$62,750
AVG HOUSEHOLD INCOME
9.0%
WAGE / INCOME GAP [ % ]
91.0¢/ $1
WAGE / INCOME GAP [ $ ]
0.43
INEQUALITY / GINI INDEX
2,935
TOTAL POPULATION
1,442
MALE POPULATION
1,493
FEMALE POPULATION
96.58
MALES / 100 FEMALES
103.54
FEMALES / 100 MALES
36.9
MEDIAN AGE
3.1
AVG FAMILY SIZE
2.6
AVG HOUSEHOLD SIZE
1,242
LABOR FORCE [ PEOPLE ]
57.6%
PERCENT IN LABOR FORCE
2.1%
UNEMPLOYMENT RATE
Whitehall Zip Codes
Whitehall Area Codes
Income in Whitehall
Income Overview in Whitehall
Per Capita Income in Whitehall is $31,176, while median incomes of families and households are $78,665 and $62,750 respectively.
| Characteristic | Number | Measure |
| Per Capita Income | 2,935 | $31,176 |
| Median Family Income | 711 | $78,665 |
| Mean Family Income | 711 | $91,619 |
| Median Household Income | 1,066 | $62,750 |
| Mean Household Income | 1,066 | $80,539 |
| Income Deficit | 711 | $0 |
| Wage / Income Gap (%) | 2,935 | 9.00% |
| Wage / Income Gap ($) | 2,935 | 91.00¢ per $1 |
| Gini / Inequality Index | 2,935 | 0.43 |
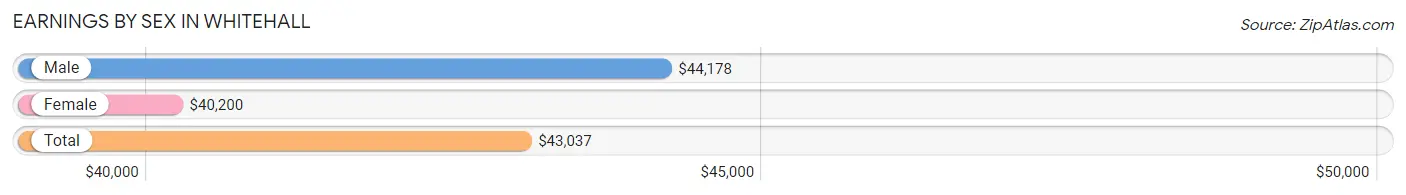
Earnings by Sex in Whitehall
Average Earnings in Whitehall are $43,037, $44,178 for men and $40,200 for women, a difference of 9.0%.
| Sex | Number | Average Earnings |
| Male | 736 (53.6%) | $44,178 |
| Female | 636 (46.4%) | $40,200 |
| Total | 1,372 (100.0%) | $43,037 |
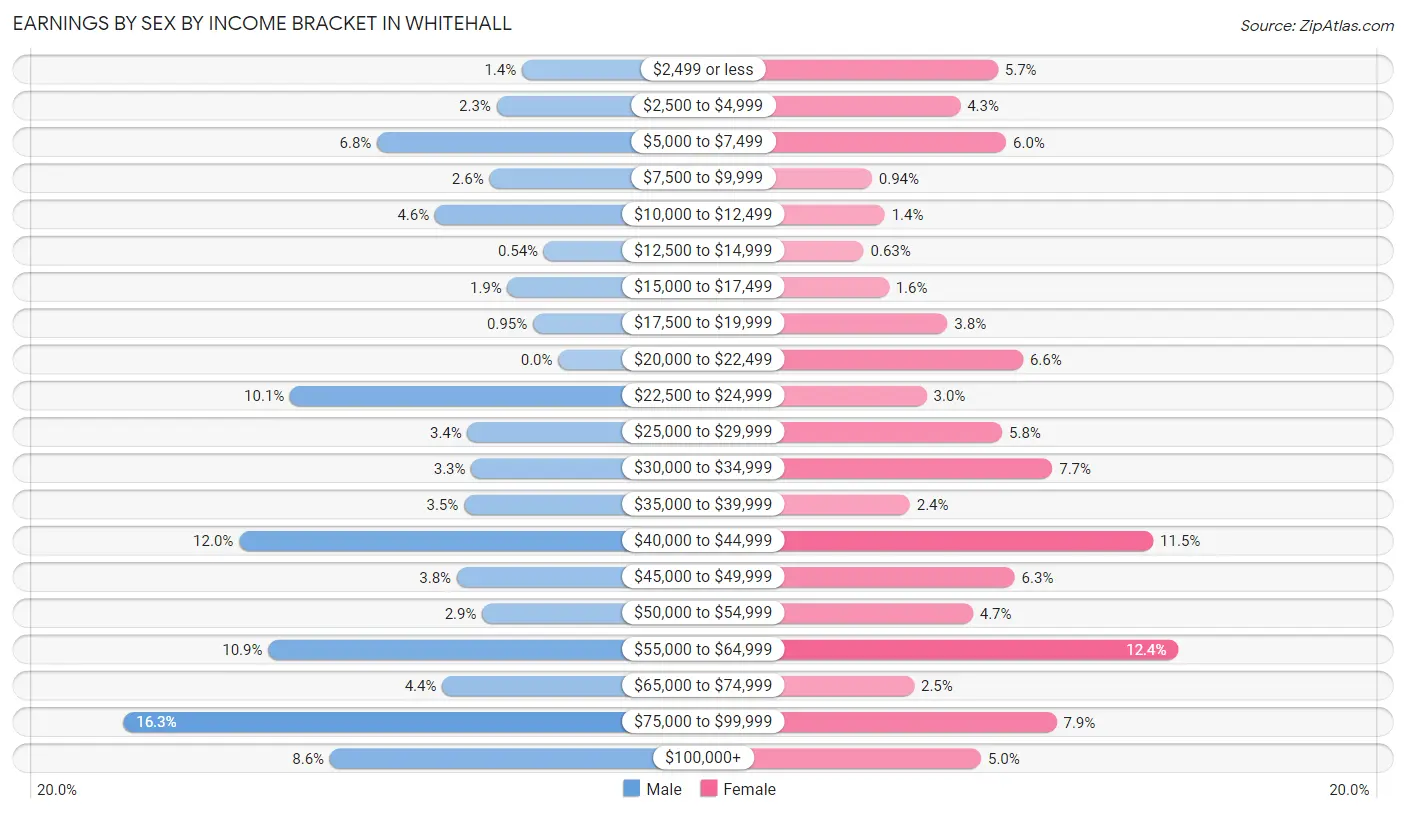
Earnings by Sex by Income Bracket in Whitehall
The most common earnings brackets in Whitehall are $75,000 to $99,999 for men (120 | 16.3%) and $55,000 to $64,999 for women (79 | 12.4%).
| Income | Male | Female |
| $2,499 or less | 10 (1.4%) | 36 (5.7%) |
| $2,500 to $4,999 | 17 (2.3%) | 27 (4.3%) |
| $5,000 to $7,499 | 50 (6.8%) | 38 (6.0%) |
| $7,500 to $9,999 | 19 (2.6%) | 6 (0.9%) |
| $10,000 to $12,499 | 34 (4.6%) | 9 (1.4%) |
| $12,500 to $14,999 | 4 (0.5%) | 4 (0.6%) |
| $15,000 to $17,499 | 14 (1.9%) | 10 (1.6%) |
| $17,500 to $19,999 | 7 (0.9%) | 24 (3.8%) |
| $20,000 to $22,499 | 0 (0.0%) | 42 (6.6%) |
| $22,500 to $24,999 | 74 (10.1%) | 19 (3.0%) |
| $25,000 to $29,999 | 25 (3.4%) | 37 (5.8%) |
| $30,000 to $34,999 | 24 (3.3%) | 49 (7.7%) |
| $35,000 to $39,999 | 26 (3.5%) | 15 (2.4%) |
| $40,000 to $44,999 | 88 (12.0%) | 73 (11.5%) |
| $45,000 to $49,999 | 28 (3.8%) | 40 (6.3%) |
| $50,000 to $54,999 | 21 (2.9%) | 30 (4.7%) |
| $55,000 to $64,999 | 80 (10.9%) | 79 (12.4%) |
| $65,000 to $74,999 | 32 (4.3%) | 16 (2.5%) |
| $75,000 to $99,999 | 120 (16.3%) | 50 (7.9%) |
| $100,000+ | 63 (8.6%) | 32 (5.0%) |
| Total | 736 (100.0%) | 636 (100.0%) |
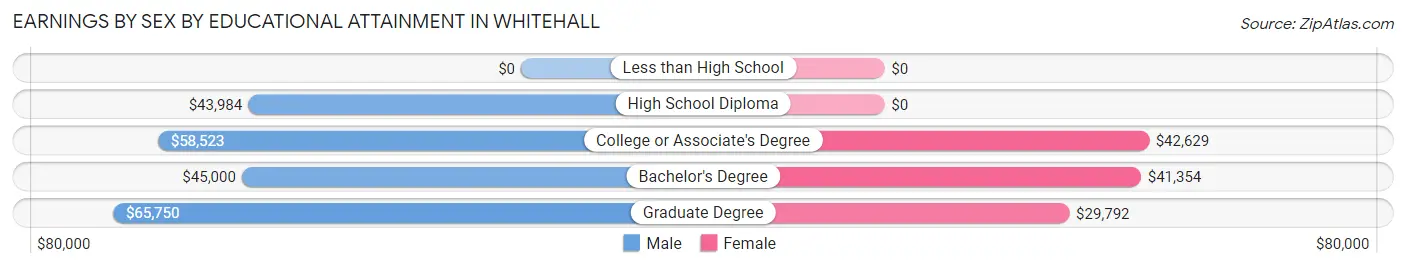
Earnings by Sex by Educational Attainment in Whitehall
Average earnings in Whitehall are $56,029 for men and $41,250 for women, a difference of 26.4%. Men with an educational attainment of graduate degree enjoy the highest average annual earnings of $65,750, while those with high school diploma education earn the least with $43,984. Women with an educational attainment of college or associate's degree earn the most with the average annual earnings of $42,629, while those with graduate degree education have the smallest earnings of $29,792.
| Educational Attainment | Male Income | Female Income |
| Less than High School | - | - |
| High School Diploma | $43,984 | $0 |
| College or Associate's Degree | $58,523 | $42,629 |
| Bachelor's Degree | $45,000 | $41,354 |
| Graduate Degree | $65,750 | $29,792 |
| Total | $56,029 | $41,250 |
Family Income in Whitehall
Family Income Brackets in Whitehall
According to the Whitehall family income data, there are 147 families falling into the $75,000 to $99,999 income range, which is the most common income bracket and makes up 20.7% of all families. Conversely, the $25,000 to $34,999 income bracket is the least frequent group with only 4 families (0.6%) belonging to this category.
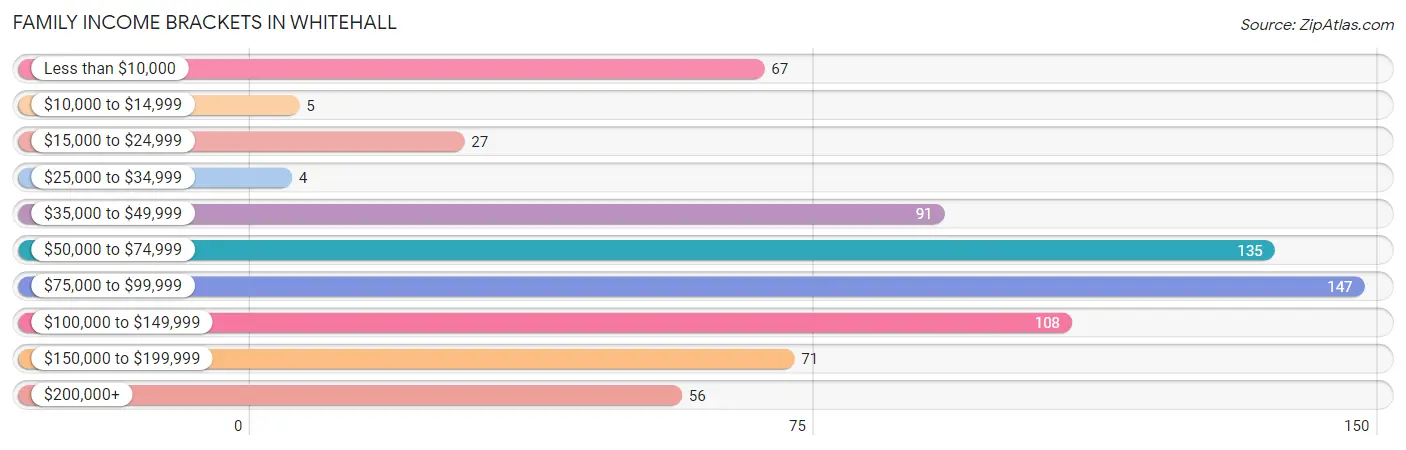
| Income Bracket | # Families | % Families |
| Less than $10,000 | 67 | 9.4% |
| $10,000 to $14,999 | 5 | 0.7% |
| $15,000 to $24,999 | 27 | 3.8% |
| $25,000 to $34,999 | 4 | 0.6% |
| $35,000 to $49,999 | 91 | 12.8% |
| $50,000 to $74,999 | 135 | 19.0% |
| $75,000 to $99,999 | 147 | 20.7% |
| $100,000 to $149,999 | 108 | 15.2% |
| $150,000 to $199,999 | 71 | 10.0% |
| $200,000+ | 56 | 7.9% |
Family Income by Famaliy Size in Whitehall
5-person families (74 | 10.4%) account for the highest median family income in Whitehall with $155,128 per family, while 2-person families (353 | 49.6%) have the highest median income of $34,137 per family member.
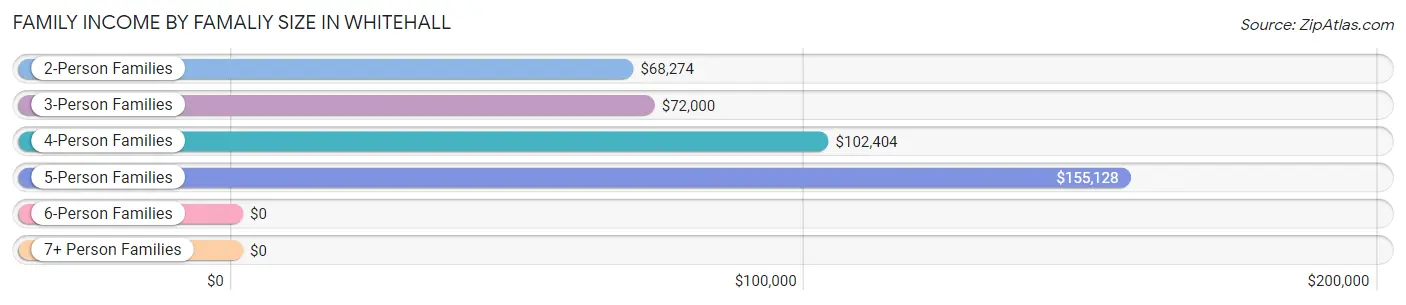
| Income Bracket | # Families | Median Income |
| 2-Person Families | 353 (49.6%) | $68,274 |
| 3-Person Families | 178 (25.0%) | $72,000 |
| 4-Person Families | 85 (11.9%) | $102,404 |
| 5-Person Families | 74 (10.4%) | $155,128 |
| 6-Person Families | 17 (2.4%) | $0 |
| 7+ Person Families | 4 (0.6%) | $0 |
| Total | 711 (100.0%) | $78,665 |
Family Income by Number of Earners in Whitehall
The median family income in Whitehall is $78,665, with families comprising 3+ earners (58) having the highest median family income of $114,500, while families with no earners (174) have the lowest median family income of $46,667, accounting for 8.2% and 24.5% of families, respectively.
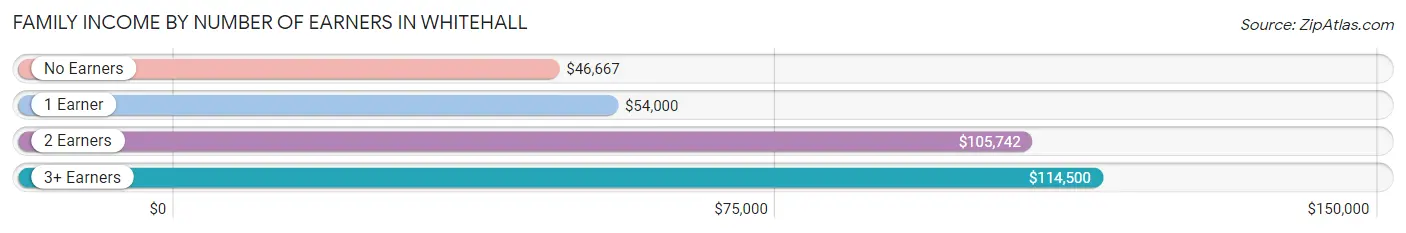
| Number of Earners | # Families | Median Income |
| No Earners | 174 (24.5%) | $46,667 |
| 1 Earner | 200 (28.1%) | $54,000 |
| 2 Earners | 279 (39.2%) | $105,742 |
| 3+ Earners | 58 (8.2%) | $114,500 |
| Total | 711 (100.0%) | $78,665 |
Household Income in Whitehall
Household Income Brackets in Whitehall
With 163 households falling in the category, the $75,000 to $99,999 income range is the most frequent in Whitehall, accounting for 15.3% of all households. In contrast, only 47 households (4.4%) fall into the less than $10,000 income bracket, making it the least populous group.
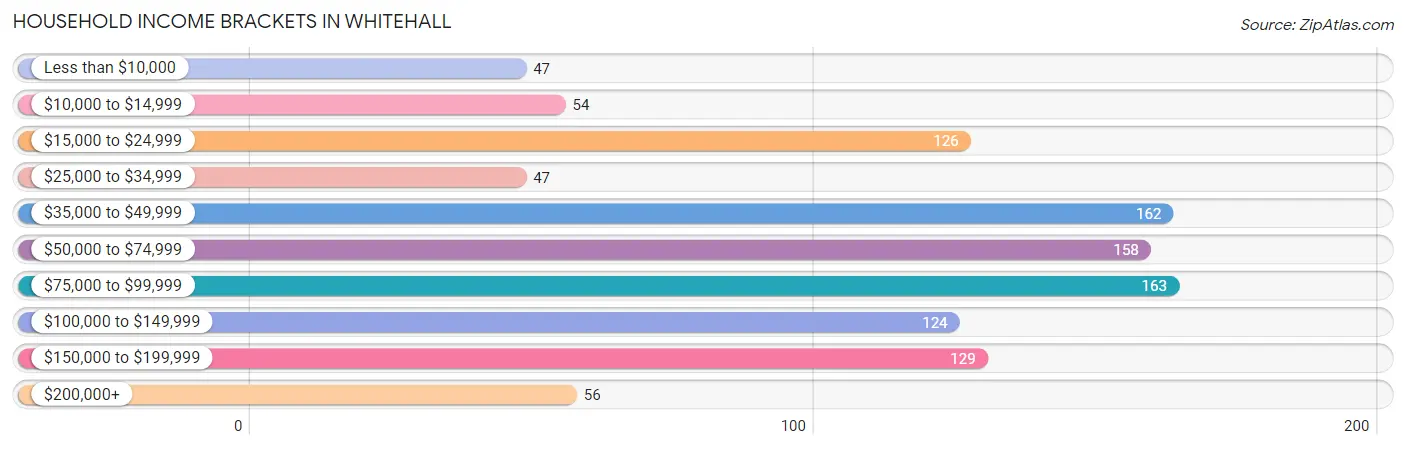
| Income Bracket | # Households | % Households |
| Less than $10,000 | 47 | 4.4% |
| $10,000 to $14,999 | 54 | 5.1% |
| $15,000 to $24,999 | 126 | 11.8% |
| $25,000 to $34,999 | 47 | 4.4% |
| $35,000 to $49,999 | 162 | 15.2% |
| $50,000 to $74,999 | 158 | 14.8% |
| $75,000 to $99,999 | 163 | 15.3% |
| $100,000 to $149,999 | 124 | 11.6% |
| $150,000 to $199,999 | 129 | 12.1% |
| $200,000+ | 56 | 5.3% |
Household Income by Householder Age in Whitehall
The median household income in Whitehall is $62,750, with the highest median household income of $81,944 found in the 45 to 64 years age bracket for the primary householder. A total of 262 households (24.6%) fall into this category. Meanwhile, the 15 to 24 years age bracket for the primary householder has the lowest median household income of $0, with 22 households (2.1%) in this group.
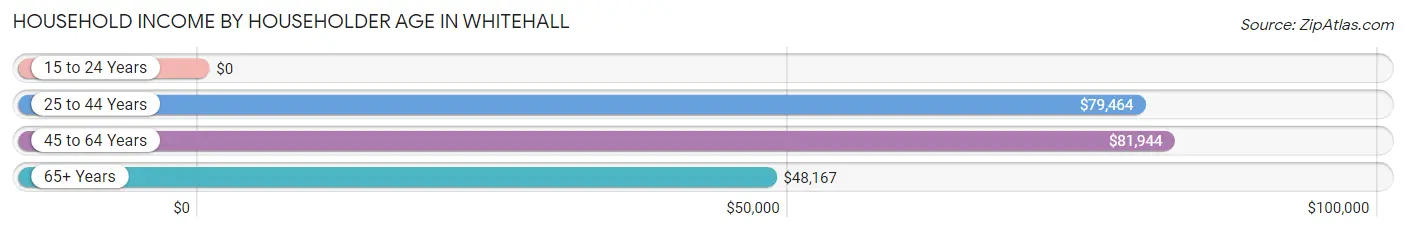
| Income Bracket | # Households | Median Income |
| 15 to 24 Years | 22 (2.1%) | $0 |
| 25 to 44 Years | 420 (39.4%) | $79,464 |
| 45 to 64 Years | 262 (24.6%) | $81,944 |
| 65+ Years | 362 (34.0%) | $48,167 |
| Total | 1,066 (100.0%) | $62,750 |
Poverty in Whitehall
Income Below Poverty by Sex and Age in Whitehall
With 18.5% poverty level for males and 12.2% for females among the residents of Whitehall, 6 to 11 year old males and 25 to 34 year old females are the most vulnerable to poverty, with 138 males (57.5%) and 69 females (27.7%) in their respective age groups living below the poverty level.
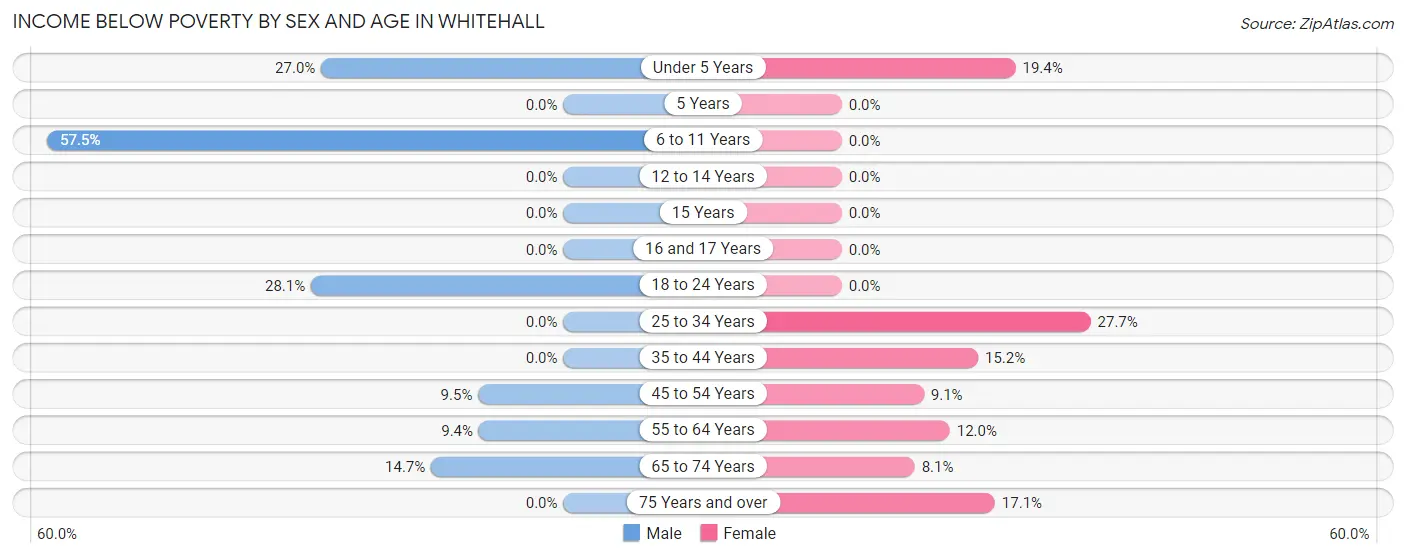
| Age Bracket | Male | Female |
| Under 5 Years | 41 (27.0%) | 12 (19.4%) |
| 5 Years | 0 (0.0%) | 0 (0.0%) |
| 6 to 11 Years | 138 (57.5%) | 0 (0.0%) |
| 12 to 14 Years | 0 (0.0%) | 0 (0.0%) |
| 15 Years | 0 (0.0%) | 0 (0.0%) |
| 16 and 17 Years | 0 (0.0%) | 0 (0.0%) |
| 18 to 24 Years | 43 (28.1%) | 0 (0.0%) |
| 25 to 34 Years | 0 (0.0%) | 69 (27.7%) |
| 35 to 44 Years | 0 (0.0%) | 22 (15.2%) |
| 45 to 54 Years | 11 (9.5%) | 16 (9.1%) |
| 55 to 64 Years | 8 (9.4%) | 19 (12.0%) |
| 65 to 74 Years | 19 (14.7%) | 13 (8.1%) |
| 75 Years and over | 0 (0.0%) | 22 (17.1%) |
| Total | 260 (18.5%) | 173 (12.2%) |
Income Above Poverty by Sex and Age in Whitehall
According to the poverty statistics in Whitehall, males aged 12 to 14 years and females aged 6 to 11 years are the age groups that are most secure financially, with 100.0% of males and 100.0% of females in these age groups living above the poverty line.
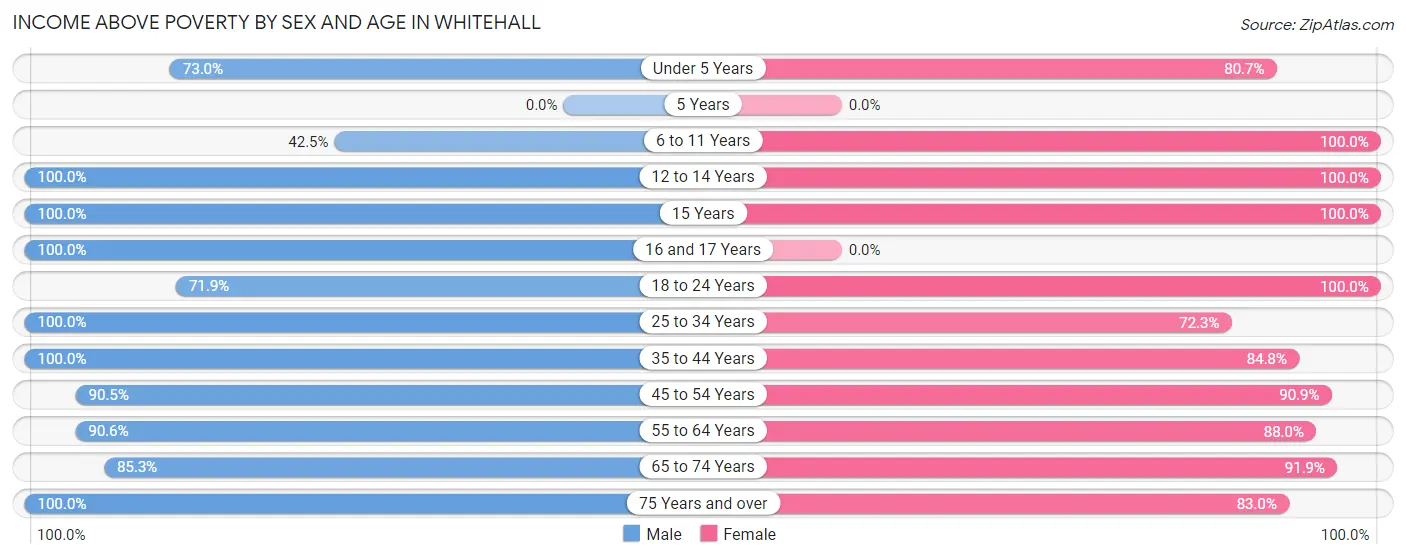
| Age Bracket | Male | Female |
| Under 5 Years | 111 (73.0%) | 50 (80.6%) |
| 5 Years | 0 (0.0%) | 0 (0.0%) |
| 6 to 11 Years | 102 (42.5%) | 165 (100.0%) |
| 12 to 14 Years | 12 (100.0%) | 144 (100.0%) |
| 15 Years | 2 (100.0%) | 1 (100.0%) |
| 16 and 17 Years | 14 (100.0%) | 0 (0.0%) |
| 18 to 24 Years | 110 (71.9%) | 34 (100.0%) |
| 25 to 34 Years | 150 (100.0%) | 180 (72.3%) |
| 35 to 44 Years | 213 (100.0%) | 123 (84.8%) |
| 45 to 54 Years | 105 (90.5%) | 159 (90.9%) |
| 55 to 64 Years | 77 (90.6%) | 139 (88.0%) |
| 65 to 74 Years | 110 (85.3%) | 147 (91.9%) |
| 75 Years and over | 142 (100.0%) | 107 (83.0%) |
| Total | 1,148 (81.5%) | 1,249 (87.8%) |
Income Below Poverty Among Married-Couple Families in Whitehall
The poverty statistics for married-couple families in Whitehall show that 0.9% or 5 of the total 549 families live below the poverty line. Families with 1 or 2 children have the highest poverty rate of 4.2%, comprising of 5 families. On the other hand, families with no children have the lowest poverty rate of 0.0%, which includes 0 families.
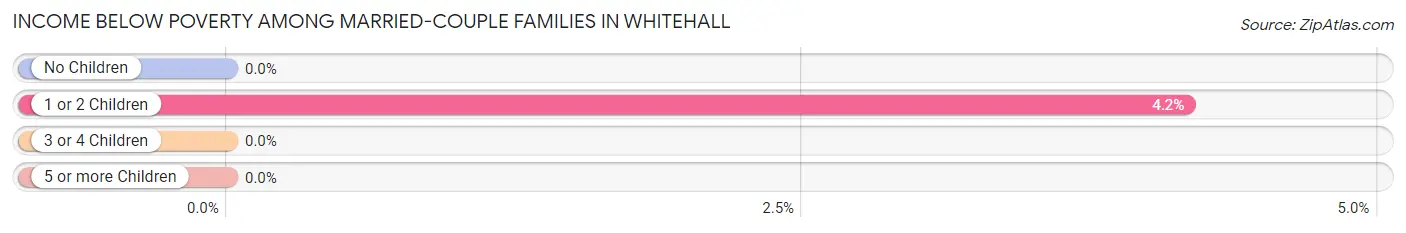
| Children | Above Poverty | Below Poverty |
| No Children | 343 (100.0%) | 0 (0.0%) |
| 1 or 2 Children | 115 (95.8%) | 5 (4.2%) |
| 3 or 4 Children | 82 (100.0%) | 0 (0.0%) |
| 5 or more Children | 4 (100.0%) | 0 (0.0%) |
| Total | 544 (99.1%) | 5 (0.9%) |
Income Below Poverty Among Single-Parent Households in Whitehall
According to the poverty data in Whitehall, 28.0% or 7 single-father households and 52.5% or 72 single-mother households are living below the poverty line. Among single-father households, those with 3 or 4 children have the highest poverty rate, with 7 households (100.0%) experiencing poverty. Likewise, among single-mother households, those with 1 or 2 children have the highest poverty rate, with 72 households (80.9%) falling below the poverty line.
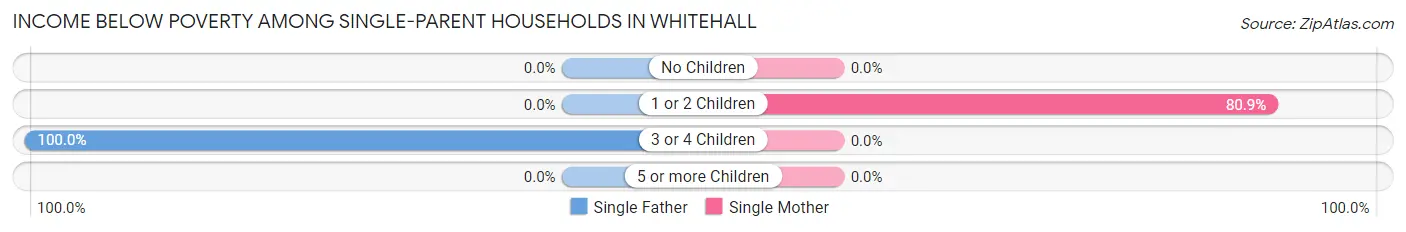
| Children | Single Father | Single Mother |
| No Children | 0 (0.0%) | 0 (0.0%) |
| 1 or 2 Children | 0 (0.0%) | 72 (80.9%) |
| 3 or 4 Children | 7 (100.0%) | 0 (0.0%) |
| 5 or more Children | 0 (0.0%) | 0 (0.0%) |
| Total | 7 (28.0%) | 72 (52.5%) |
Income Below Poverty Among Married-Couple vs Single-Parent Households in Whitehall
The poverty data for Whitehall shows that 5 of the married-couple family households (0.9%) and 79 of the single-parent households (48.8%) are living below the poverty level. Within the married-couple family households, those with 1 or 2 children have the highest poverty rate, with 5 households (4.2%) falling below the poverty line. Among the single-parent households, those with 3 or 4 children have the highest poverty rate, with 7 household (100.0%) living below poverty.
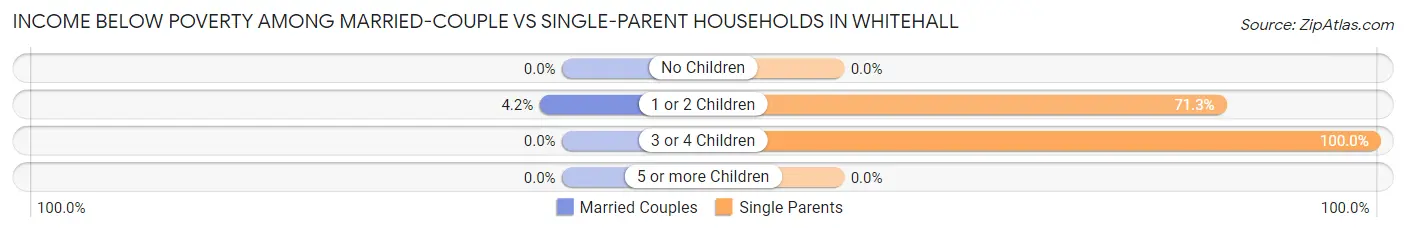
| Children | Married-Couple Families | Single-Parent Households |
| No Children | 0 (0.0%) | 0 (0.0%) |
| 1 or 2 Children | 5 (4.2%) | 72 (71.3%) |
| 3 or 4 Children | 0 (0.0%) | 7 (100.0%) |
| 5 or more Children | 0 (0.0%) | 0 (0.0%) |
| Total | 5 (0.9%) | 79 (48.8%) |
Race in Whitehall
The most populous races in Whitehall are White / Caucasian (2,425 | 82.6%), Two or more Races (449 | 15.3%), and Hispanic or Latino (395 | 13.5%).
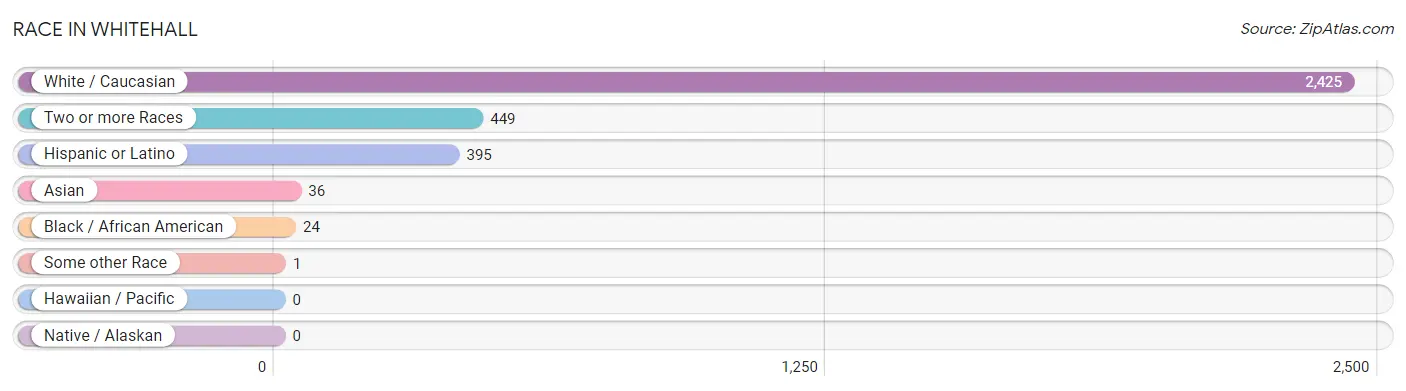
| Race | # Population | % Population |
| Asian | 36 | 1.2% |
| Black / African American | 24 | 0.8% |
| Hawaiian / Pacific | 0 | 0.0% |
| Hispanic or Latino | 395 | 13.5% |
| Native / Alaskan | 0 | 0.0% |
| White / Caucasian | 2,425 | 82.6% |
| Two or more Races | 449 | 15.3% |
| Some other Race | 1 | 0.0% |
| Total | 2,935 | 100.0% |
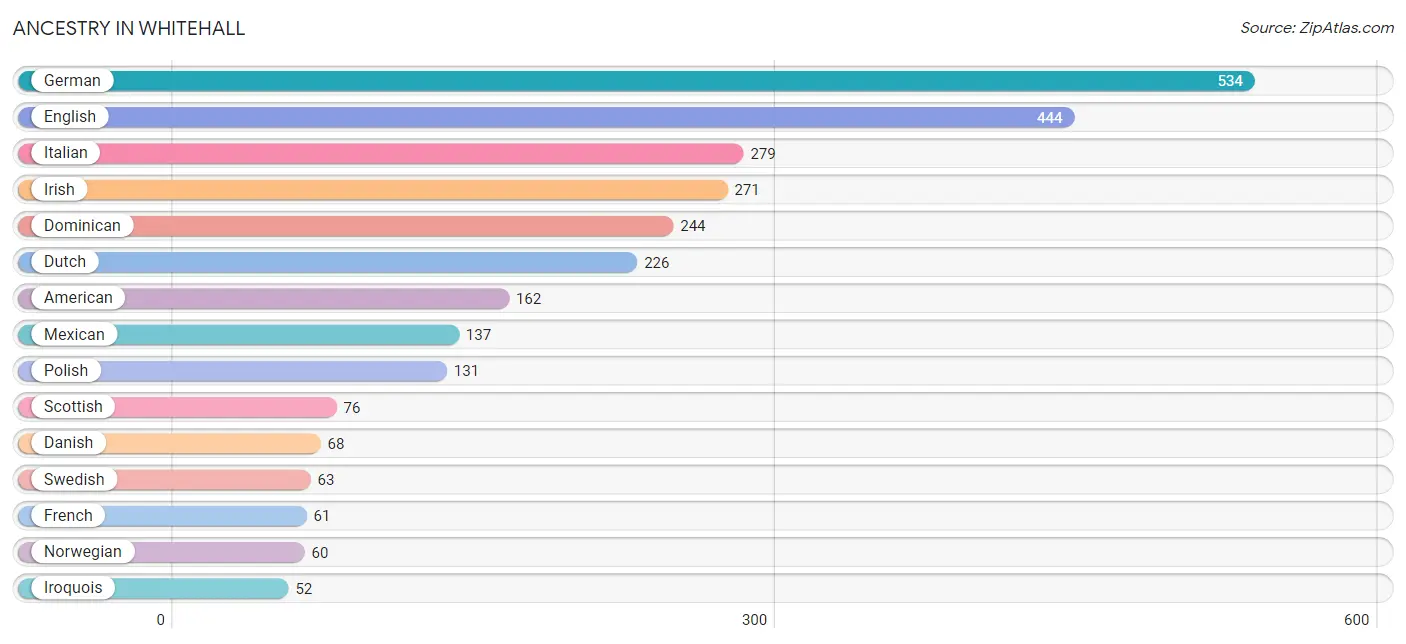
Ancestry in Whitehall
The most populous ancestries reported in Whitehall are German (534 | 18.2%), English (444 | 15.1%), Italian (279 | 9.5%), Irish (271 | 9.2%), and Dominican (244 | 8.3%), together accounting for 60.4% of all Whitehall residents.
| Ancestry | # Population | % Population |
| American | 162 | 5.5% |
| Arab | 2 | 0.1% |
| Belgian | 24 | 0.8% |
| British | 26 | 0.9% |
| Burmese | 4 | 0.1% |
| Celtic | 16 | 0.5% |
| Chilean | 1 | 0.0% |
| Czech | 39 | 1.3% |
| Czechoslovakian | 5 | 0.2% |
| Danish | 68 | 2.3% |
| Dominican | 244 | 8.3% |
| Dutch | 226 | 7.7% |
| English | 444 | 15.1% |
| European | 6 | 0.2% |
| Finnish | 32 | 1.1% |
| French | 61 | 2.1% |
| German | 534 | 18.2% |
| Greek | 11 | 0.4% |
| Indian (Asian) | 7 | 0.2% |
| Irish | 271 | 9.2% |
| Iroquois | 52 | 1.8% |
| Italian | 279 | 9.5% |
| Lebanese | 2 | 0.1% |
| Mexican | 137 | 4.7% |
| Mexican American Indian | 7 | 0.2% |
| Norwegian | 60 | 2.0% |
| Polish | 131 | 4.5% |
| Puerto Rican | 13 | 0.4% |
| Scandinavian | 35 | 1.2% |
| Scotch-Irish | 7 | 0.2% |
| Scottish | 76 | 2.6% |
| Slovak | 10 | 0.3% |
| South American | 1 | 0.0% |
| Swedish | 63 | 2.1% |
| Swiss | 9 | 0.3% |
| Thai | 33 | 1.1% |
| Welsh | 17 | 0.6% | View All 37 Rows |
Immigrants in Whitehall
The most numerous immigrant groups reported in Whitehall came from Asia (33 | 1.1%), India (33 | 1.1%), South Central Asia (33 | 1.1%), Europe (23 | 0.8%), and Western Europe (23 | 0.8%), together accounting for 4.9% of all Whitehall residents.
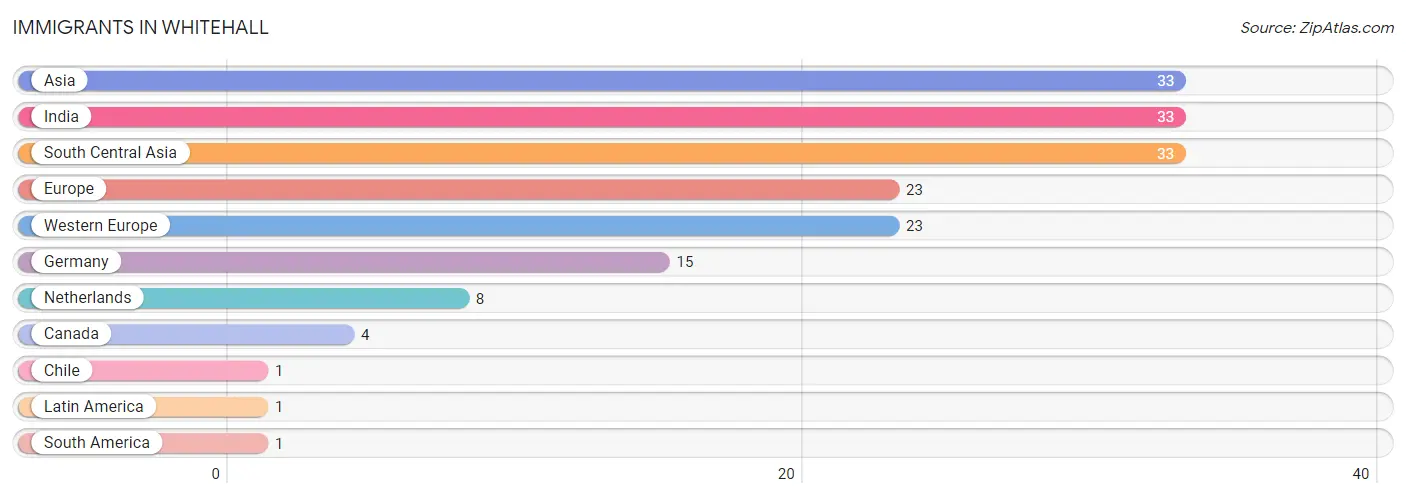
| Immigration Origin | # Population | % Population |
| Asia | 33 | 1.1% |
| Canada | 4 | 0.1% |
| Chile | 1 | 0.0% |
| Europe | 23 | 0.8% |
| Germany | 15 | 0.5% |
| India | 33 | 1.1% |
| Latin America | 1 | 0.0% |
| Netherlands | 8 | 0.3% |
| South America | 1 | 0.0% |
| South Central Asia | 33 | 1.1% |
| Western Europe | 23 | 0.8% | View All 11 Rows |
Sex and Age in Whitehall
Sex and Age in Whitehall
The most populous age groups in Whitehall are 5 to 9 Years (157 | 10.9%) for men and 30 to 34 Years (163 | 10.9%) for women.
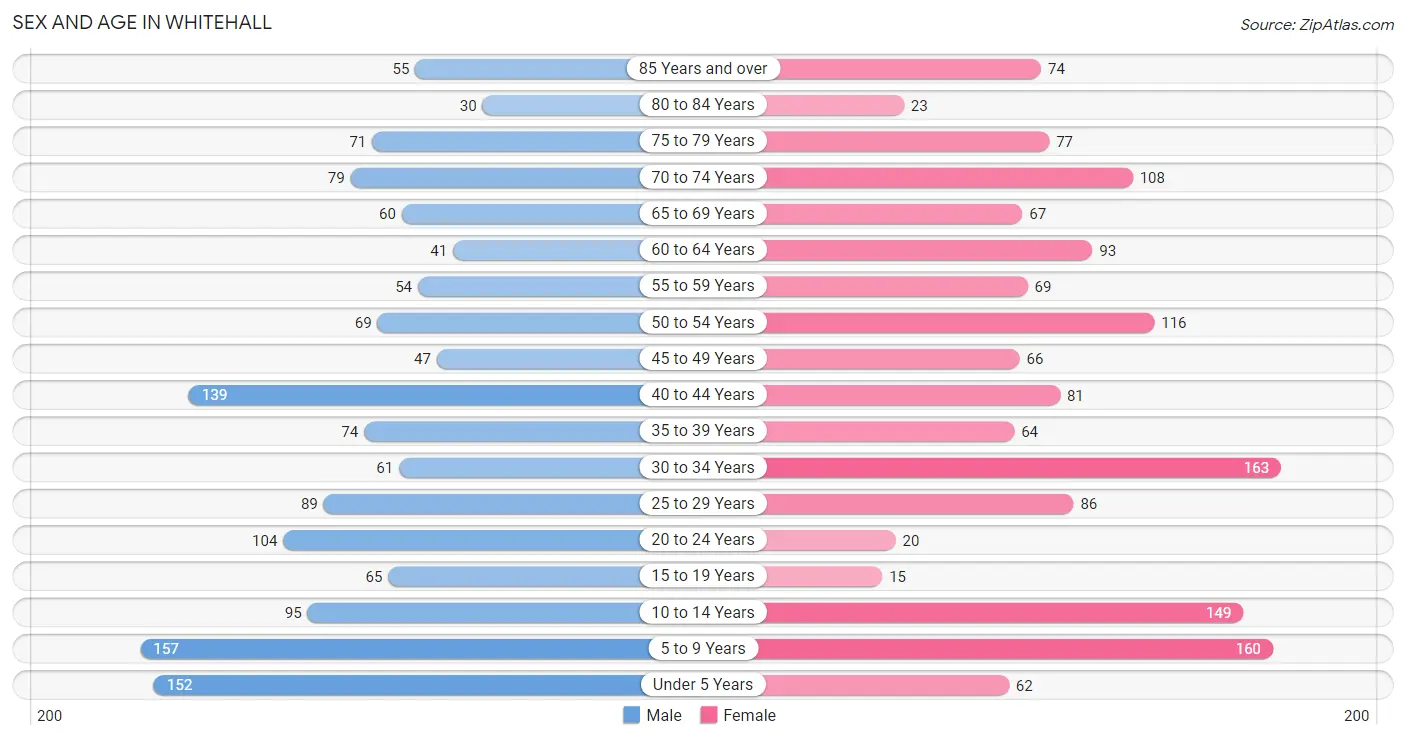
| Age Bracket | Male | Female |
| Under 5 Years | 152 (10.5%) | 62 (4.2%) |
| 5 to 9 Years | 157 (10.9%) | 160 (10.7%) |
| 10 to 14 Years | 95 (6.6%) | 149 (10.0%) |
| 15 to 19 Years | 65 (4.5%) | 15 (1.0%) |
| 20 to 24 Years | 104 (7.2%) | 20 (1.3%) |
| 25 to 29 Years | 89 (6.2%) | 86 (5.8%) |
| 30 to 34 Years | 61 (4.2%) | 163 (10.9%) |
| 35 to 39 Years | 74 (5.1%) | 64 (4.3%) |
| 40 to 44 Years | 139 (9.6%) | 81 (5.4%) |
| 45 to 49 Years | 47 (3.3%) | 66 (4.4%) |
| 50 to 54 Years | 69 (4.8%) | 116 (7.8%) |
| 55 to 59 Years | 54 (3.7%) | 69 (4.6%) |
| 60 to 64 Years | 41 (2.8%) | 93 (6.2%) |
| 65 to 69 Years | 60 (4.2%) | 67 (4.5%) |
| 70 to 74 Years | 79 (5.5%) | 108 (7.2%) |
| 75 to 79 Years | 71 (4.9%) | 77 (5.2%) |
| 80 to 84 Years | 30 (2.1%) | 23 (1.5%) |
| 85 Years and over | 55 (3.8%) | 74 (5.0%) |
| Total | 1,442 (100.0%) | 1,493 (100.0%) |
Families and Households in Whitehall
Median Family Size in Whitehall
The median family size in Whitehall is 3.10 persons per family, with married-couple families (549 | 77.2%) accounting for the largest median family size of 3.15 persons per family. On the other hand, single male/father families (25 | 3.5%) represent the smallest median family size with 2.48 persons per family.
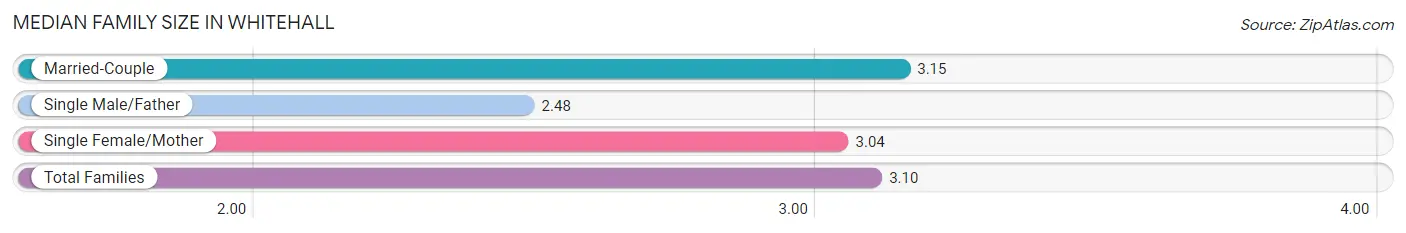
| Family Type | # Families | Family Size |
| Married-Couple | 549 (77.2%) | 3.15 |
| Single Male/Father | 25 (3.5%) | 2.48 |
| Single Female/Mother | 137 (19.3%) | 3.04 |
| Total Families | 711 (100.0%) | 3.10 |
Median Household Size in Whitehall
The median household size in Whitehall is 2.62 persons per household, with single female/mother households (137 | 12.9%) accounting for the largest median household size of 3.58 persons per household. non-family households (355 | 33.3%) represent the smallest median household size with 1.43 persons per household.
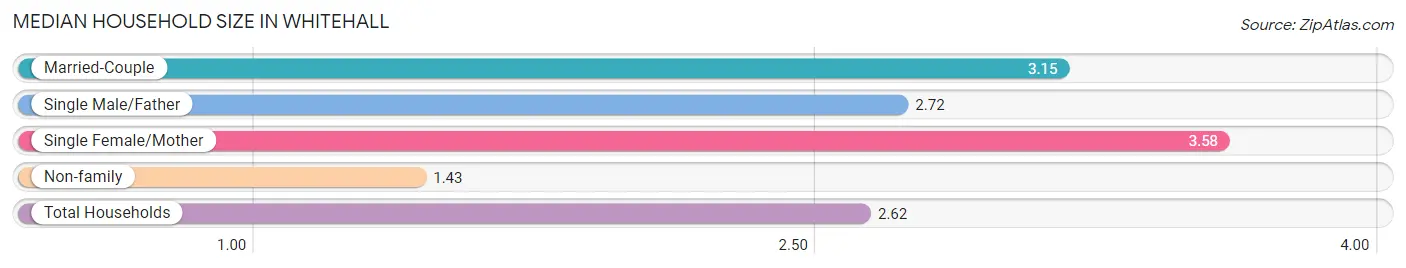
| Household Type | # Households | Household Size |
| Married-Couple | 549 (51.5%) | 3.15 |
| Single Male/Father | 25 (2.4%) | 2.72 |
| Single Female/Mother | 137 (12.9%) | 3.58 |
| Non-family | 355 (33.3%) | 1.43 |
| Total Households | 1,066 (100.0%) | 2.62 |
Household Size by Marriage Status in Whitehall
Out of a total of 1,066 households in Whitehall, 711 (66.7%) are family households, while 355 (33.3%) are nonfamily households. The most numerous type of family households are 2-person households, comprising 347, and the most common type of nonfamily households are 1-person households, comprising 258.
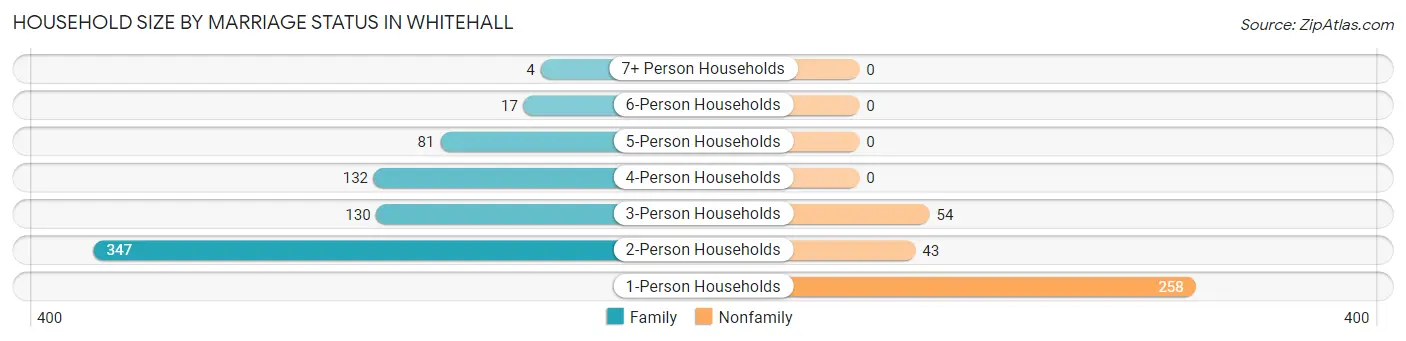
| Household Size | Family Households | Nonfamily Households |
| 1-Person Households | - | 258 (24.2%) |
| 2-Person Households | 347 (32.6%) | 43 (4.0%) |
| 3-Person Households | 130 (12.2%) | 54 (5.1%) |
| 4-Person Households | 132 (12.4%) | 0 (0.0%) |
| 5-Person Households | 81 (7.6%) | 0 (0.0%) |
| 6-Person Households | 17 (1.6%) | 0 (0.0%) |
| 7+ Person Households | 4 (0.4%) | 0 (0.0%) |
| Total | 711 (66.7%) | 355 (33.3%) |
Female Fertility in Whitehall
Fertility by Age in Whitehall
| Age Bracket | Women with Births | Births / 1,000 Women |
| 15 to 19 years | 0 (0.0%) | 0.0 |
| 20 to 34 years | 0 (0.0%) | 0.0 |
| 35 to 50 years | 0 (0.0%) | 0.0 |
| Total | 0 (0.0%) | 0.0 |
Fertility by Age by Marriage Status in Whitehall
| Age Bracket | Married | Unmarried |
| 15 to 19 years | 0 (0.0%) | 0 (0.0%) |
| 20 to 34 years | 0 (0.0%) | 0 (0.0%) |
| 35 to 50 years | 0 (0.0%) | 0 (0.0%) |
| Total | 0 (0.0%) | 0 (0.0%) |
Fertility by Education in Whitehall
| Educational Attainment | Women with Births | Births / 1,000 Women |
| Less than High School | 0 (0.0%) | 0.0 |
| High School Diploma | 0 (0.0%) | 0.0 |
| College or Associate's Degree | 0 (0.0%) | 0.0 |
| Bachelor's Degree | 0 (0.0%) | 0.0 |
| Graduate Degree | 0 (0.0%) | 0.0 |
| Total | 0 (0.0%) | 0.0 |
Fertility by Education by Marriage Status in Whitehall
| Educational Attainment | Married | Unmarried |
| Less than High School | 0 (0.0%) | 0 (0.0%) |
| High School Diploma | 0 (0.0%) | 0 (0.0%) |
| College or Associate's Degree | 0 (0.0%) | 0 (0.0%) |
| Bachelor's Degree | 0 (0.0%) | 0 (0.0%) |
| Graduate Degree | 0 (0.0%) | 0 (0.0%) |
| Total | 0 (0.0%) | 0 (0.0%) |
Employment Characteristics in Whitehall
Employment by Class of Employer in Whitehall
Among the 1,187 employed individuals in Whitehall, private company employees (752 | 63.3%), local government employees (149 | 12.6%), and not-for-profit organizations (113 | 9.5%) make up the most common classes of employment.
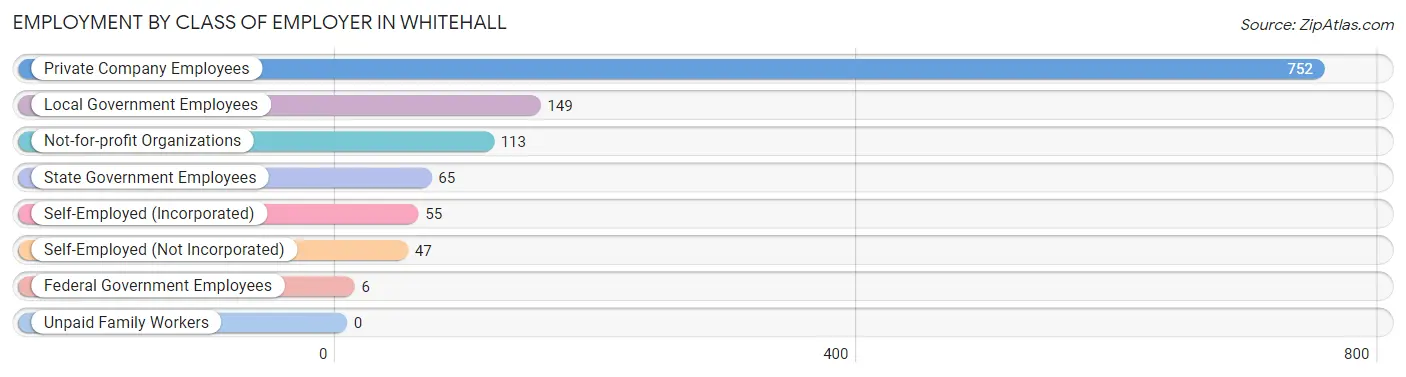
| Employer Class | # Employees | % Employees |
| Private Company Employees | 752 | 63.3% |
| Self-Employed (Incorporated) | 55 | 4.6% |
| Self-Employed (Not Incorporated) | 47 | 4.0% |
| Not-for-profit Organizations | 113 | 9.5% |
| Local Government Employees | 149 | 12.6% |
| State Government Employees | 65 | 5.5% |
| Federal Government Employees | 6 | 0.5% |
| Unpaid Family Workers | 0 | 0.0% |
| Total | 1,187 | 100.0% |
Employment Status by Age in Whitehall
According to the labor force statistics for Whitehall, out of the total population over 16 years of age (2,157), 57.6% or 1,242 individuals are in the labor force, with 2.1% or 26 of them unemployed. The age group with the highest labor force participation rate is 20 to 24 years, with 94.4% or 117 individuals in the labor force. Within the labor force, the 16 to 19 years age range has the highest percentage of unemployed individuals, with 13.0% or 9 of them being unemployed.
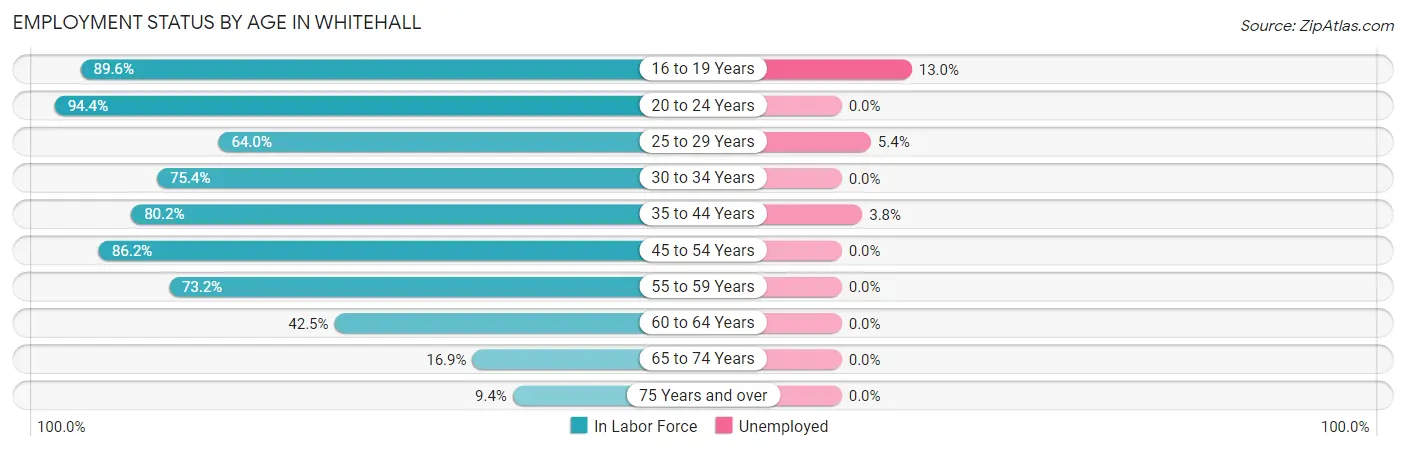
| Age Bracket | In Labor Force | Unemployed |
| 16 to 19 Years | 69 (89.6%) | 9 (13.0%) |
| 20 to 24 Years | 117 (94.4%) | 0 (0.0%) |
| 25 to 29 Years | 112 (64.0%) | 6 (5.4%) |
| 30 to 34 Years | 169 (75.4%) | 0 (0.0%) |
| 35 to 44 Years | 287 (80.2%) | 11 (3.8%) |
| 45 to 54 Years | 257 (86.2%) | 0 (0.0%) |
| 55 to 59 Years | 90 (73.2%) | 0 (0.0%) |
| 60 to 64 Years | 57 (42.5%) | 0 (0.0%) |
| 65 to 74 Years | 53 (16.9%) | 0 (0.0%) |
| 75 Years and over | 31 (9.4%) | 0 (0.0%) |
| Total | 1,242 (57.6%) | 26 (2.1%) |
Employment Status by Educational Attainment in Whitehall
According to labor force statistics for Whitehall, 74.1% of individuals (972) out of the total population between 25 and 64 years of age (1,312) are in the labor force, with 1.7% or 17 of them being unemployed. The group with the highest labor force participation rate are those with the educational attainment of bachelor's degree or higher, with 87.4% or 346 individuals in the labor force. Within the labor force, individuals with less than high school education have the highest percentage of unemployment, with 35.3% or 6 of them being unemployed.
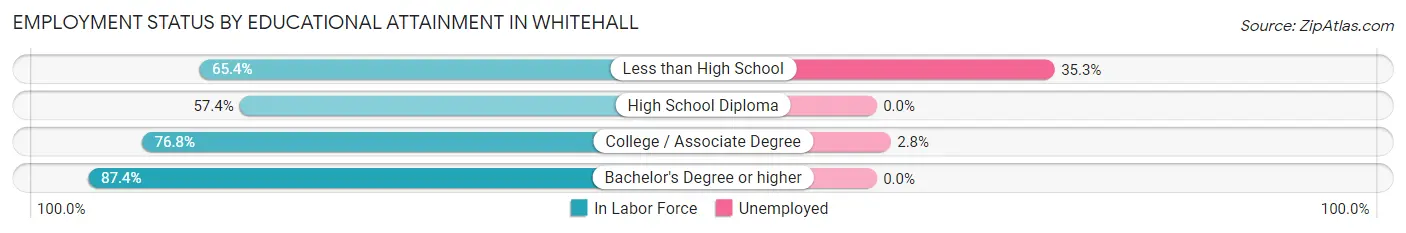
| Educational Attainment | In Labor Force | Unemployed |
| Less than High School | 17 (65.4%) | 9 (35.3%) |
| High School Diploma | 221 (57.4%) | 0 (0.0%) |
| College / Associate Degree | 388 (76.8%) | 14 (2.8%) |
| Bachelor's Degree or higher | 346 (87.4%) | 0 (0.0%) |
| Total | 972 (74.1%) | 22 (1.7%) |
Employment Occupations by Sex in Whitehall
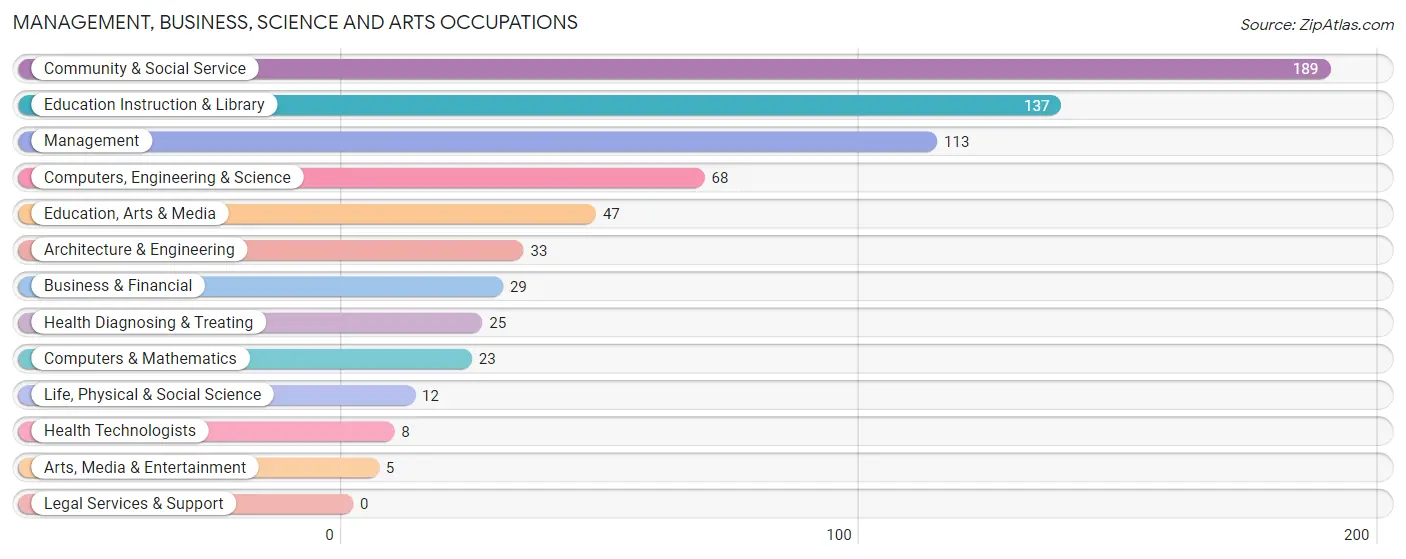
Management, Business, Science and Arts Occupations
The most common Management, Business, Science and Arts occupations in Whitehall are Community & Social Service (189 | 15.5%), Education Instruction & Library (137 | 11.3%), Management (113 | 9.3%), Computers, Engineering & Science (68 | 5.6%), and Education, Arts & Media (47 | 3.9%).
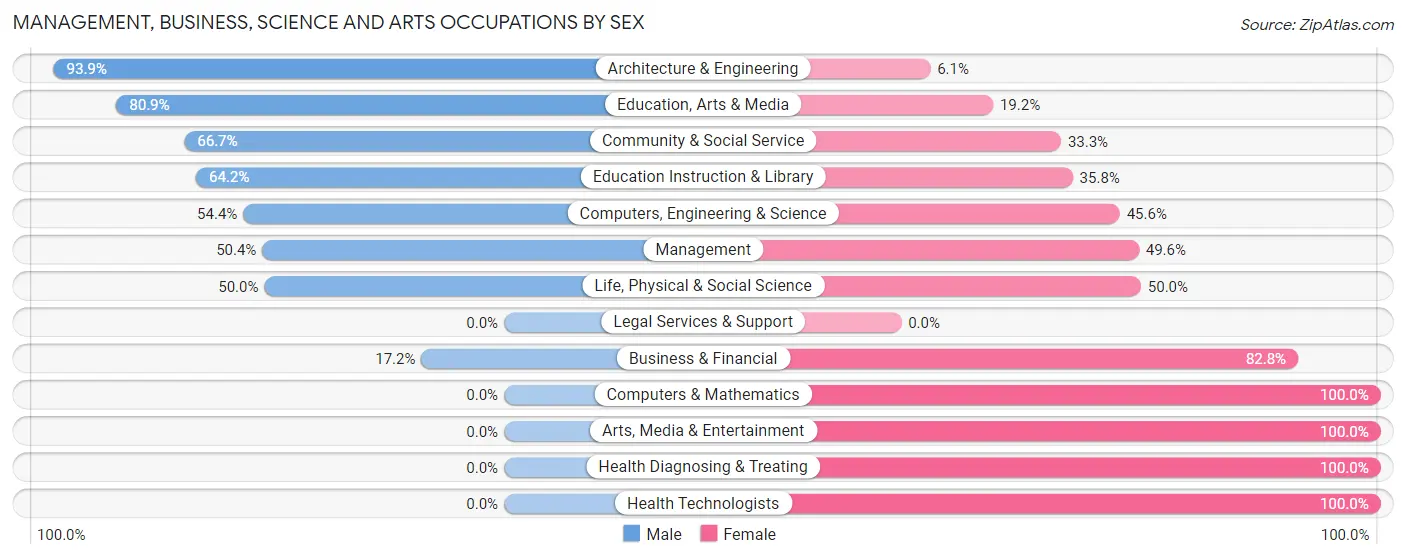
Management, Business, Science and Arts Occupations by Sex
Within the Management, Business, Science and Arts occupations in Whitehall, the most male-oriented occupations are Architecture & Engineering (93.9%), Education, Arts & Media (80.8%), and Community & Social Service (66.7%), while the most female-oriented occupations are Computers & Mathematics (100.0%), Arts, Media & Entertainment (100.0%), and Health Diagnosing & Treating (100.0%).
| Occupation | Male | Female |
| Management | 57 (50.4%) | 56 (49.6%) |
| Business & Financial | 5 (17.2%) | 24 (82.8%) |
| Computers, Engineering & Science | 37 (54.4%) | 31 (45.6%) |
| Computers & Mathematics | 0 (0.0%) | 23 (100.0%) |
| Architecture & Engineering | 31 (93.9%) | 2 (6.1%) |
| Life, Physical & Social Science | 6 (50.0%) | 6 (50.0%) |
| Community & Social Service | 126 (66.7%) | 63 (33.3%) |
| Education, Arts & Media | 38 (80.8%) | 9 (19.2%) |
| Legal Services & Support | 0 (0.0%) | 0 (0.0%) |
| Education Instruction & Library | 88 (64.2%) | 49 (35.8%) |
| Arts, Media & Entertainment | 0 (0.0%) | 5 (100.0%) |
| Health Diagnosing & Treating | 0 (0.0%) | 25 (100.0%) |
| Health Technologists | 0 (0.0%) | 8 (100.0%) |
| Total (Category) | 225 (53.1%) | 199 (46.9%) |
| Total (Overall) | 676 (55.6%) | 540 (44.4%) |
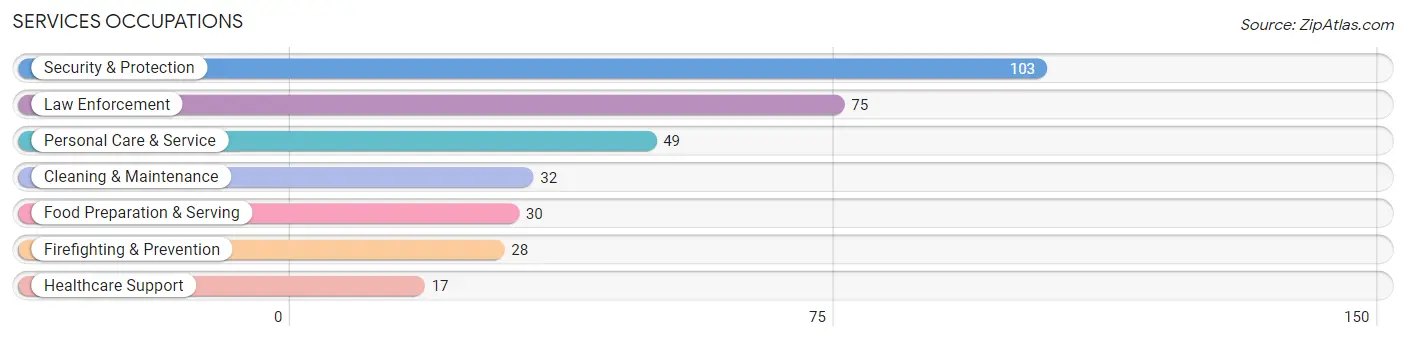
Services Occupations
The most common Services occupations in Whitehall are Security & Protection (103 | 8.5%), Law Enforcement (75 | 6.2%), Personal Care & Service (49 | 4.0%), Cleaning & Maintenance (32 | 2.6%), and Food Preparation & Serving (30 | 2.5%).
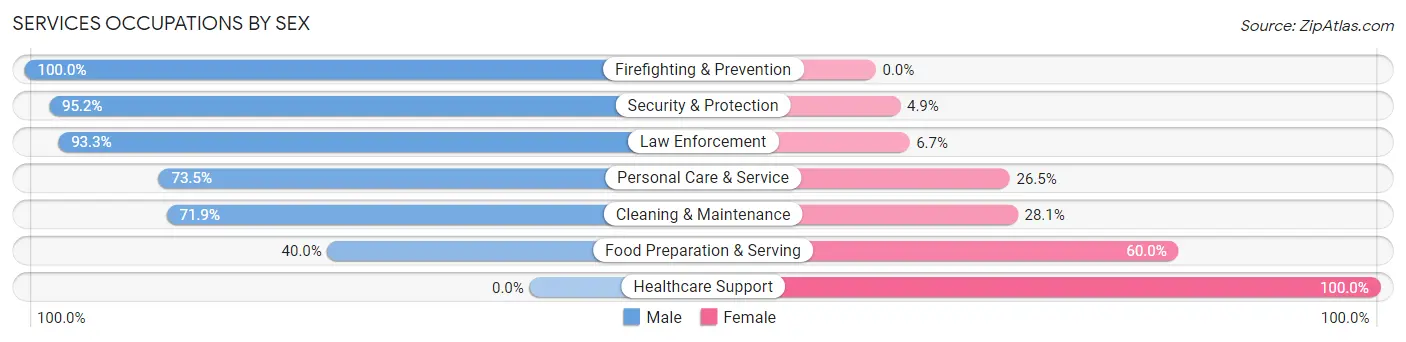
Services Occupations by Sex
Within the Services occupations in Whitehall, the most male-oriented occupations are Firefighting & Prevention (100.0%), Security & Protection (95.2%), and Law Enforcement (93.3%), while the most female-oriented occupations are Healthcare Support (100.0%), Food Preparation & Serving (60.0%), and Cleaning & Maintenance (28.1%).
| Occupation | Male | Female |
| Healthcare Support | 0 (0.0%) | 17 (100.0%) |
| Security & Protection | 98 (95.2%) | 5 (4.9%) |
| Firefighting & Prevention | 28 (100.0%) | 0 (0.0%) |
| Law Enforcement | 70 (93.3%) | 5 (6.7%) |
| Food Preparation & Serving | 12 (40.0%) | 18 (60.0%) |
| Cleaning & Maintenance | 23 (71.9%) | 9 (28.1%) |
| Personal Care & Service | 36 (73.5%) | 13 (26.5%) |
| Total (Category) | 169 (73.2%) | 62 (26.8%) |
| Total (Overall) | 676 (55.6%) | 540 (44.4%) |
Sales and Office Occupations
The most common Sales and Office occupations in Whitehall are Office & Administration (168 | 13.8%), and Sales & Related (65 | 5.3%).
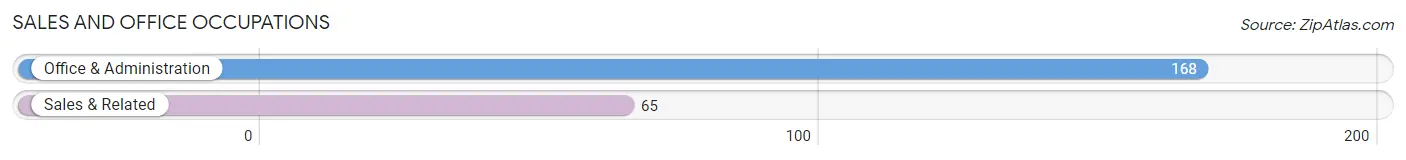
Sales and Office Occupations by Sex
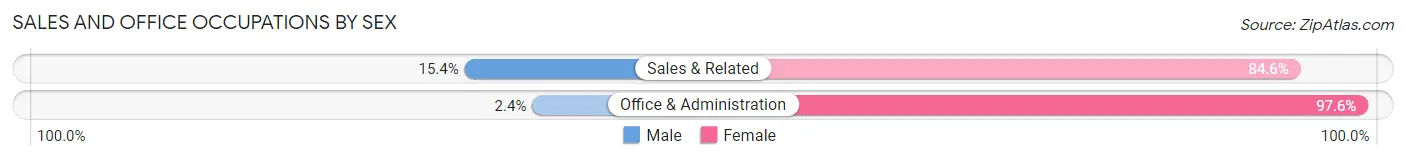
| Occupation | Male | Female |
| Sales & Related | 10 (15.4%) | 55 (84.6%) |
| Office & Administration | 4 (2.4%) | 164 (97.6%) |
| Total (Category) | 14 (6.0%) | 219 (94.0%) |
| Total (Overall) | 676 (55.6%) | 540 (44.4%) |
Natural Resources, Construction and Maintenance Occupations
The most common Natural Resources, Construction and Maintenance occupations in Whitehall are Installation, Maintenance & Repair (30 | 2.5%), and Construction & Extraction (21 | 1.7%).
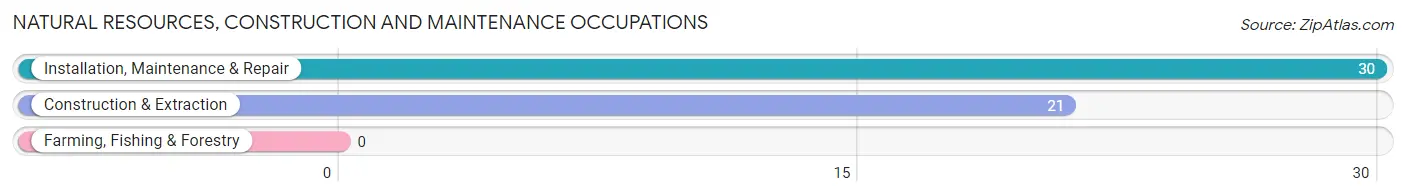
Natural Resources, Construction and Maintenance Occupations by Sex
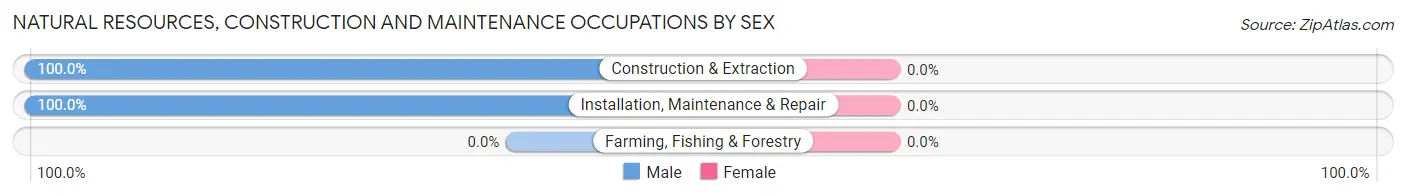
| Occupation | Male | Female |
| Farming, Fishing & Forestry | 0 (0.0%) | 0 (0.0%) |
| Construction & Extraction | 21 (100.0%) | 0 (0.0%) |
| Installation, Maintenance & Repair | 30 (100.0%) | 0 (0.0%) |
| Total (Category) | 51 (100.0%) | 0 (0.0%) |
| Total (Overall) | 676 (55.6%) | 540 (44.4%) |
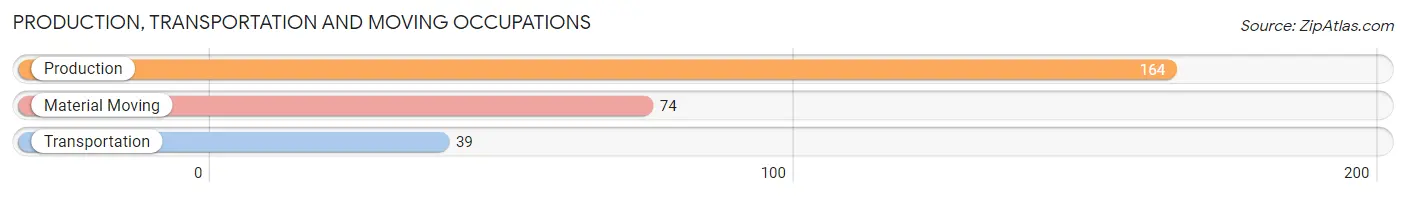
Production, Transportation and Moving Occupations
The most common Production, Transportation and Moving occupations in Whitehall are Production (164 | 13.5%), Material Moving (74 | 6.1%), and Transportation (39 | 3.2%).
Production, Transportation and Moving Occupations by Sex
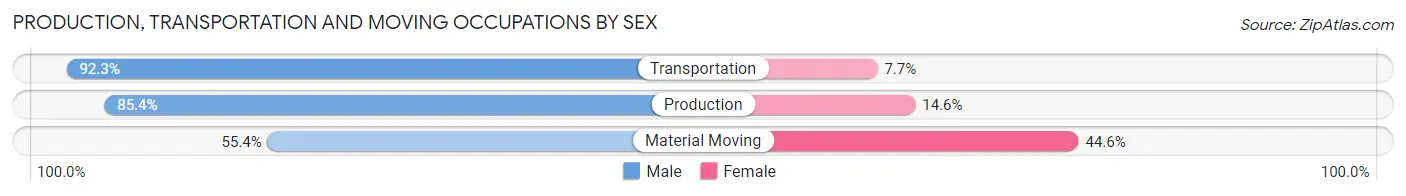
| Occupation | Male | Female |
| Production | 140 (85.4%) | 24 (14.6%) |
| Transportation | 36 (92.3%) | 3 (7.7%) |
| Material Moving | 41 (55.4%) | 33 (44.6%) |
| Total (Category) | 217 (78.3%) | 60 (21.7%) |
| Total (Overall) | 676 (55.6%) | 540 (44.4%) |
Employment Industries by Sex in Whitehall
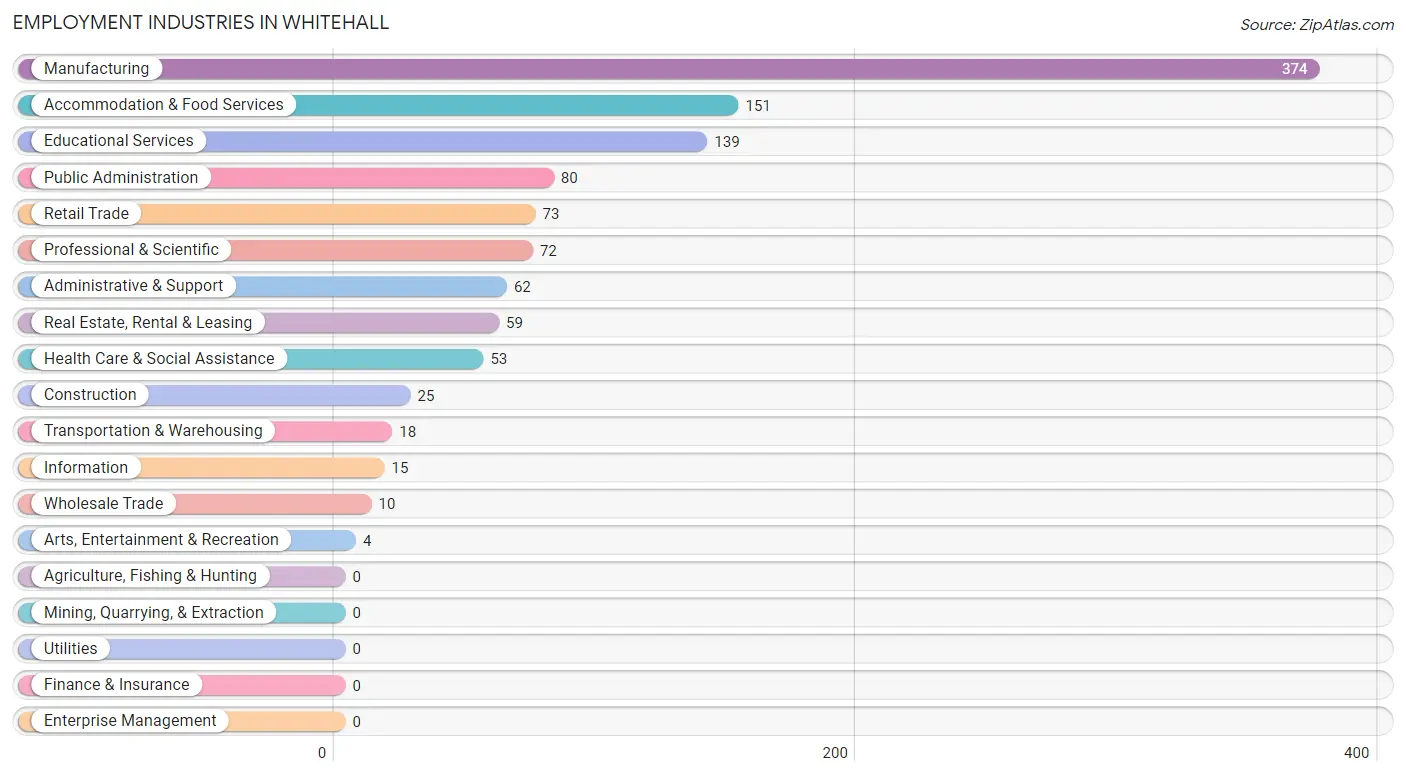
Employment Industries in Whitehall
The major employment industries in Whitehall include Manufacturing (374 | 30.8%), Accommodation & Food Services (151 | 12.4%), Educational Services (139 | 11.4%), Public Administration (80 | 6.6%), and Retail Trade (73 | 6.0%).
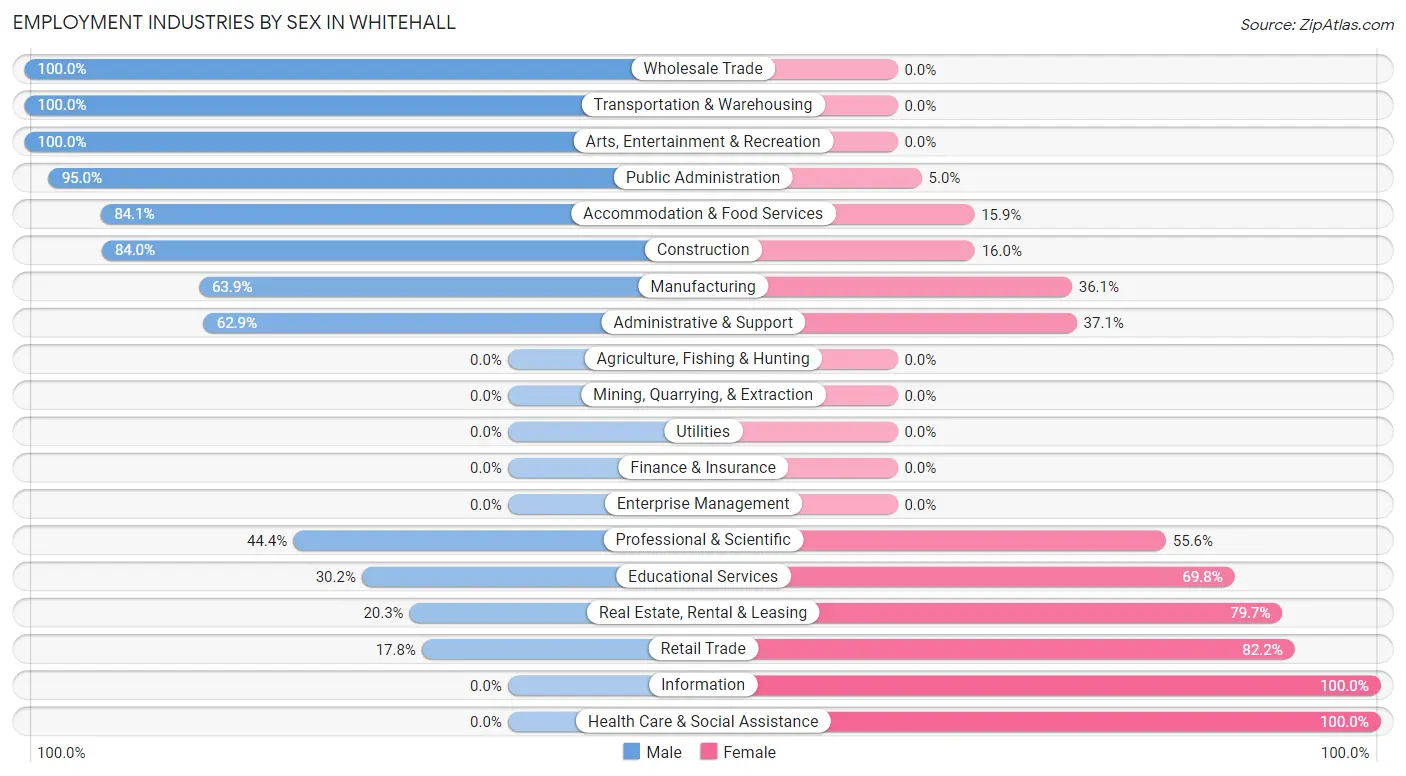
Employment Industries by Sex in Whitehall
The Whitehall industries that see more men than women are Wholesale Trade (100.0%), Transportation & Warehousing (100.0%), and Arts, Entertainment & Recreation (100.0%), whereas the industries that tend to have a higher number of women are Information (100.0%), Health Care & Social Assistance (100.0%), and Retail Trade (82.2%).
| Industry | Male | Female |
| Agriculture, Fishing & Hunting | 0 (0.0%) | 0 (0.0%) |
| Mining, Quarrying, & Extraction | 0 (0.0%) | 0 (0.0%) |
| Construction | 21 (84.0%) | 4 (16.0%) |
| Manufacturing | 239 (63.9%) | 135 (36.1%) |
| Wholesale Trade | 10 (100.0%) | 0 (0.0%) |
| Retail Trade | 13 (17.8%) | 60 (82.2%) |
| Transportation & Warehousing | 18 (100.0%) | 0 (0.0%) |
| Utilities | 0 (0.0%) | 0 (0.0%) |
| Information | 0 (0.0%) | 15 (100.0%) |
| Finance & Insurance | 0 (0.0%) | 0 (0.0%) |
| Real Estate, Rental & Leasing | 12 (20.3%) | 47 (79.7%) |
| Professional & Scientific | 32 (44.4%) | 40 (55.6%) |
| Enterprise Management | 0 (0.0%) | 0 (0.0%) |
| Administrative & Support | 39 (62.9%) | 23 (37.1%) |
| Educational Services | 42 (30.2%) | 97 (69.8%) |
| Health Care & Social Assistance | 0 (0.0%) | 53 (100.0%) |
| Arts, Entertainment & Recreation | 4 (100.0%) | 0 (0.0%) |
| Accommodation & Food Services | 127 (84.1%) | 24 (15.9%) |
| Public Administration | 76 (95.0%) | 4 (5.0%) |
| Total | 676 (55.6%) | 540 (44.4%) |
Education in Whitehall
School Enrollment in Whitehall
The most common levels of schooling among the 816 students in Whitehall are elementary school (304 | 37.2%), middle school (205 | 25.1%), and college / undergraduate (115 | 14.1%).
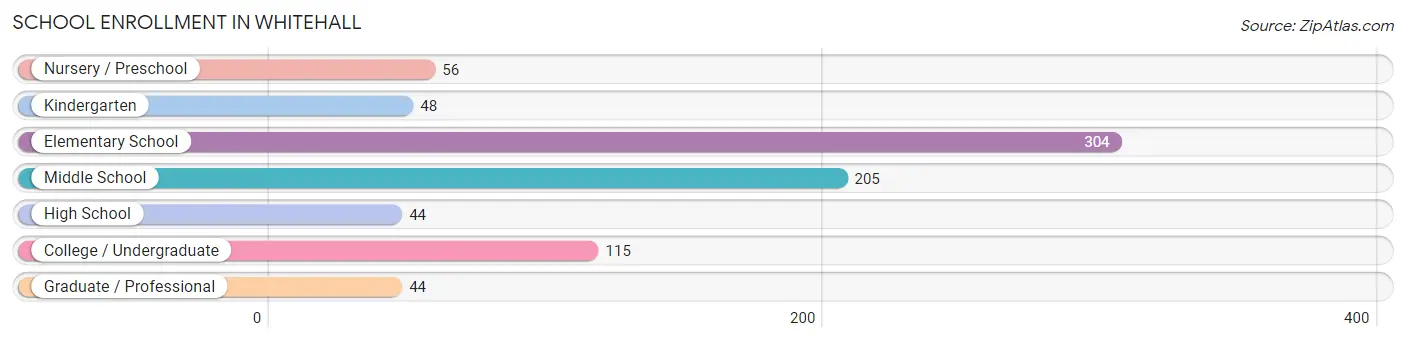
| School Level | # Students | % Students |
| Nursery / Preschool | 56 | 6.9% |
| Kindergarten | 48 | 5.9% |
| Elementary School | 304 | 37.2% |
| Middle School | 205 | 25.1% |
| High School | 44 | 5.4% |
| College / Undergraduate | 115 | 14.1% |
| Graduate / Professional | 44 | 5.4% |
| Total | 816 | 100.0% |
School Enrollment by Age by Funding Source in Whitehall
Out of a total of 816 students who are enrolled in schools in Whitehall, 61 (7.5%) attend a private institution, while the remaining 755 (92.5%) are enrolled in public schools. The age group of 10 to 14 year olds has the highest likelihood of being enrolled in private schools, with 39 (16.0% in the age bracket) enrolled. Conversely, the age group of 3 to 4 year olds has the lowest likelihood of being enrolled in a private school, with 73 (100.0% in the age bracket) attending a public institution.
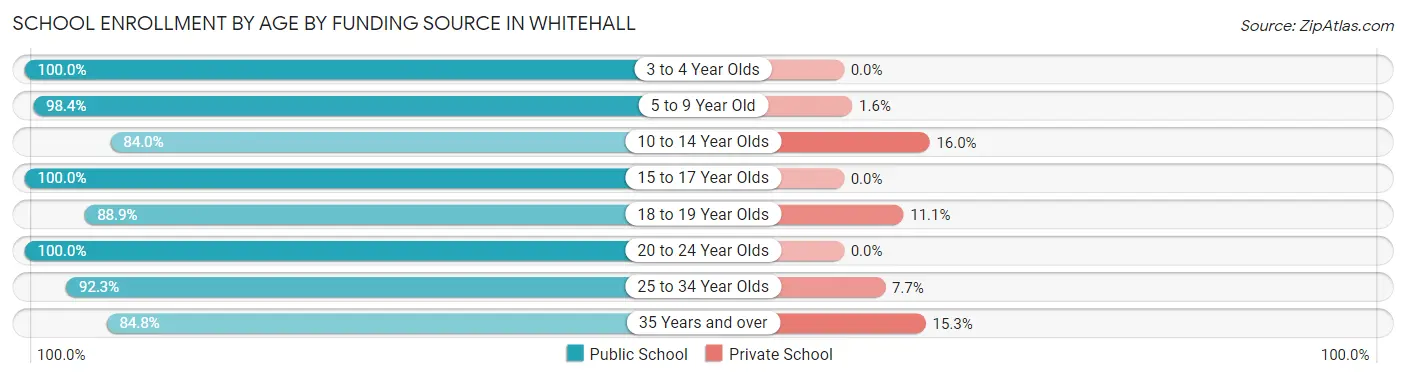
| Age Bracket | Public School | Private School |
| 3 to 4 Year Olds | 73 (100.0%) | 0 (0.0%) |
| 5 to 9 Year Old | 312 (98.4%) | 5 (1.6%) |
| 10 to 14 Year Olds | 205 (84.0%) | 39 (16.0%) |
| 15 to 17 Year Olds | 17 (100.0%) | 0 (0.0%) |
| 18 to 19 Year Olds | 24 (88.9%) | 3 (11.1%) |
| 20 to 24 Year Olds | 14 (100.0%) | 0 (0.0%) |
| 25 to 34 Year Olds | 60 (92.3%) | 5 (7.7%) |
| 35 Years and over | 50 (84.8%) | 9 (15.2%) |
| Total | 755 (92.5%) | 61 (7.5%) |
Educational Attainment by Field of Study in Whitehall
Education (153 | 25.1%), arts & humanities (107 | 17.5%), business (95 | 15.6%), computers & mathematics (79 | 13.0%), and science & technology (44 | 7.2%) are the most common fields of study among 610 individuals in Whitehall who have obtained a bachelor's degree or higher.
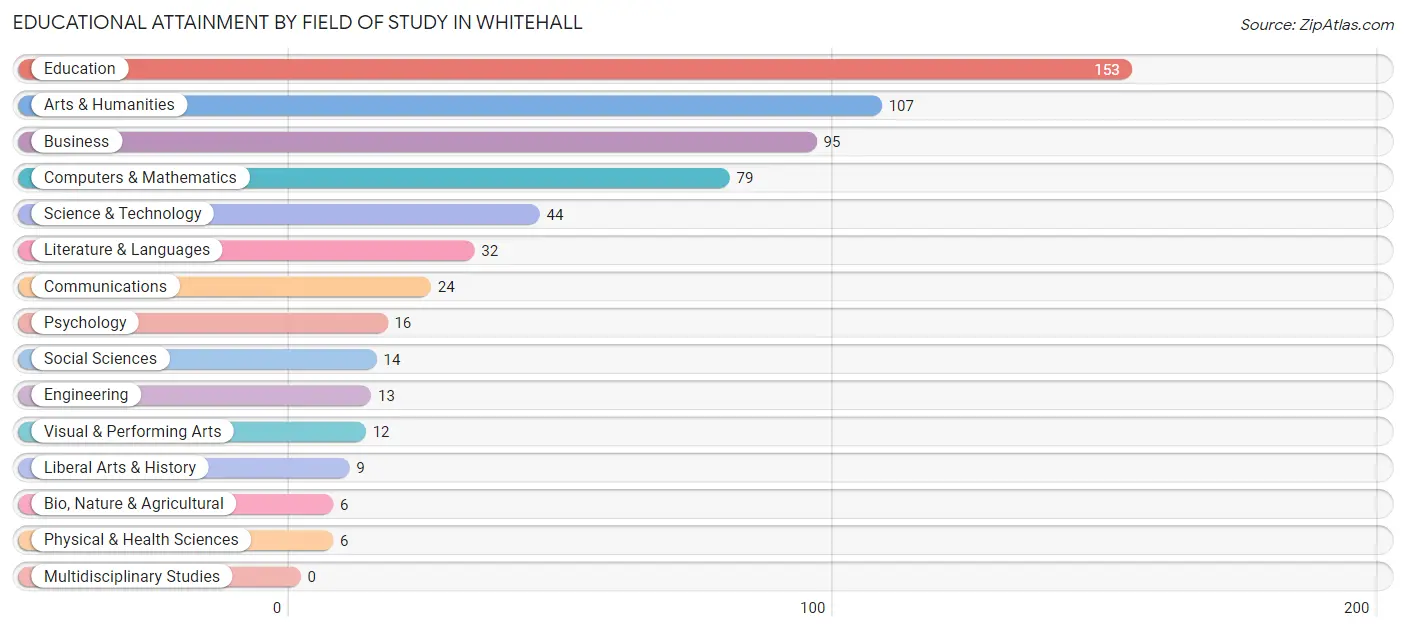
| Field of Study | # Graduates | % Graduates |
| Computers & Mathematics | 79 | 13.0% |
| Bio, Nature & Agricultural | 6 | 1.0% |
| Physical & Health Sciences | 6 | 1.0% |
| Psychology | 16 | 2.6% |
| Social Sciences | 14 | 2.3% |
| Engineering | 13 | 2.1% |
| Multidisciplinary Studies | 0 | 0.0% |
| Science & Technology | 44 | 7.2% |
| Business | 95 | 15.6% |
| Education | 153 | 25.1% |
| Literature & Languages | 32 | 5.2% |
| Liberal Arts & History | 9 | 1.5% |
| Visual & Performing Arts | 12 | 2.0% |
| Communications | 24 | 3.9% |
| Arts & Humanities | 107 | 17.5% |
| Total | 610 | 100.0% |
Transportation & Commute in Whitehall
Vehicle Availability by Sex in Whitehall
The most prevalent vehicle ownership categories in Whitehall are males with 3 vehicles (229, accounting for 33.9%) and females with 3 vehicles (96, making up 44.8%).
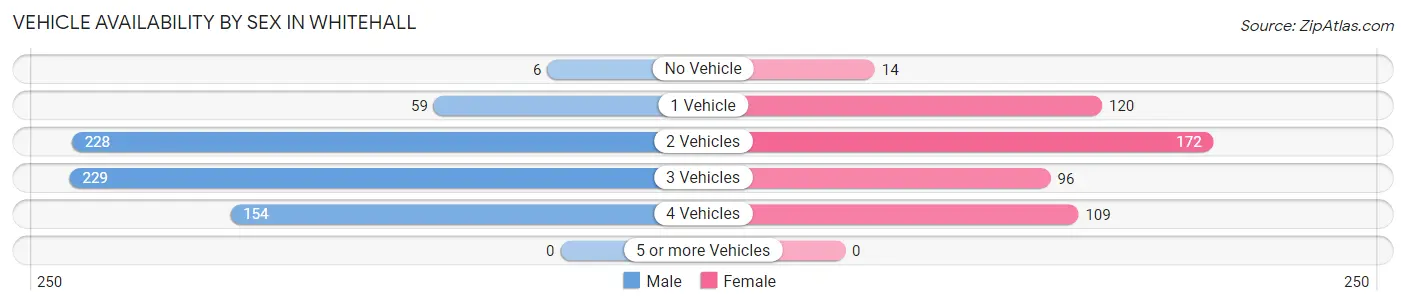
| Vehicles Available | Male | Female |
| No Vehicle | 6 (0.9%) | 14 (2.7%) |
| 1 Vehicle | 59 (8.7%) | 120 (23.5%) |
| 2 Vehicles | 228 (33.7%) | 172 (33.7%) |
| 3 Vehicles | 229 (33.9%) | 96 (18.8%) |
| 4 Vehicles | 154 (22.8%) | 109 (21.3%) |
| 5 or more Vehicles | 0 (0.0%) | 0 (0.0%) |
| Total | 676 (100.0%) | 511 (100.0%) |
Commute Time in Whitehall
The most frequently occuring commute durations in Whitehall are 5 to 9 minutes (267 commuters, 23.3%), less than 5 minutes (242 commuters, 21.1%), and 20 to 24 minutes (227 commuters, 19.8%).
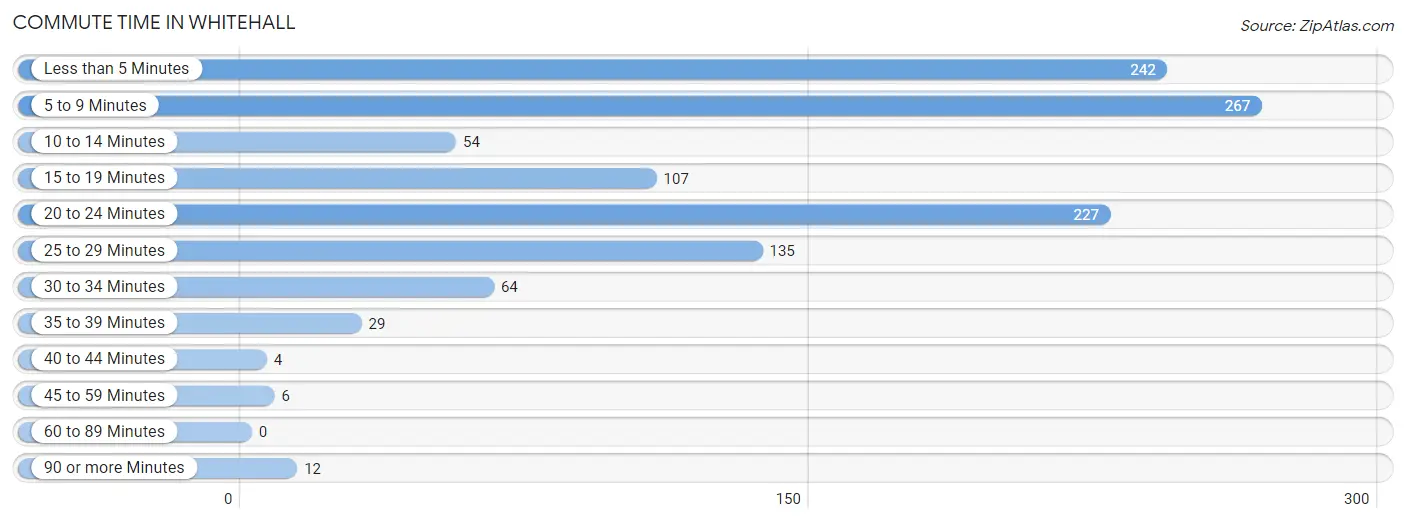
| Commute Time | # Commuters | % Commuters |
| Less than 5 Minutes | 242 | 21.1% |
| 5 to 9 Minutes | 267 | 23.3% |
| 10 to 14 Minutes | 54 | 4.7% |
| 15 to 19 Minutes | 107 | 9.3% |
| 20 to 24 Minutes | 227 | 19.8% |
| 25 to 29 Minutes | 135 | 11.8% |
| 30 to 34 Minutes | 64 | 5.6% |
| 35 to 39 Minutes | 29 | 2.5% |
| 40 to 44 Minutes | 4 | 0.4% |
| 45 to 59 Minutes | 6 | 0.5% |
| 60 to 89 Minutes | 0 | 0.0% |
| 90 or more Minutes | 12 | 1.1% |
Commute Time by Sex in Whitehall
The most common commute times in Whitehall are 5 to 9 minutes (163 commuters, 25.2%) for males and less than 5 minutes (121 commuters, 24.2%) for females.
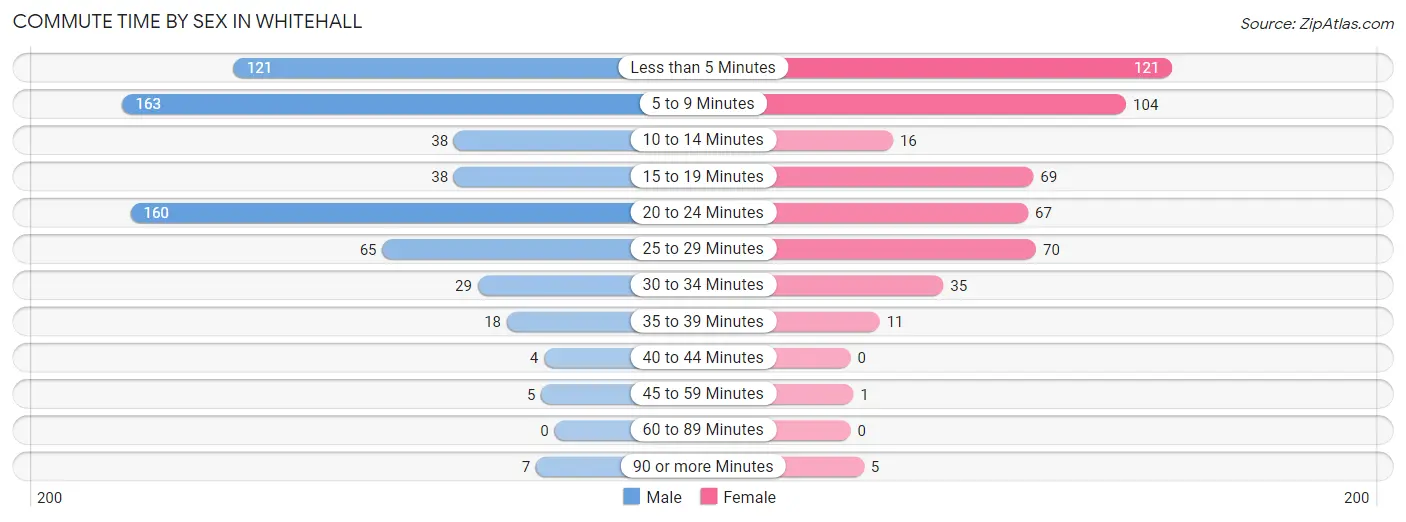
| Commute Time | Male | Female |
| Less than 5 Minutes | 121 (18.7%) | 121 (24.2%) |
| 5 to 9 Minutes | 163 (25.2%) | 104 (20.8%) |
| 10 to 14 Minutes | 38 (5.9%) | 16 (3.2%) |
| 15 to 19 Minutes | 38 (5.9%) | 69 (13.8%) |
| 20 to 24 Minutes | 160 (24.7%) | 67 (13.4%) |
| 25 to 29 Minutes | 65 (10.0%) | 70 (14.0%) |
| 30 to 34 Minutes | 29 (4.5%) | 35 (7.0%) |
| 35 to 39 Minutes | 18 (2.8%) | 11 (2.2%) |
| 40 to 44 Minutes | 4 (0.6%) | 0 (0.0%) |
| 45 to 59 Minutes | 5 (0.8%) | 1 (0.2%) |
| 60 to 89 Minutes | 0 (0.0%) | 0 (0.0%) |
| 90 or more Minutes | 7 (1.1%) | 5 (1.0%) |
Time of Departure to Work by Sex in Whitehall
The most frequent times of departure to work in Whitehall are 6:00 AM to 6:29 AM (126, 19.4%) for males and 6:30 AM to 6:59 AM (105, 21.0%) for females.
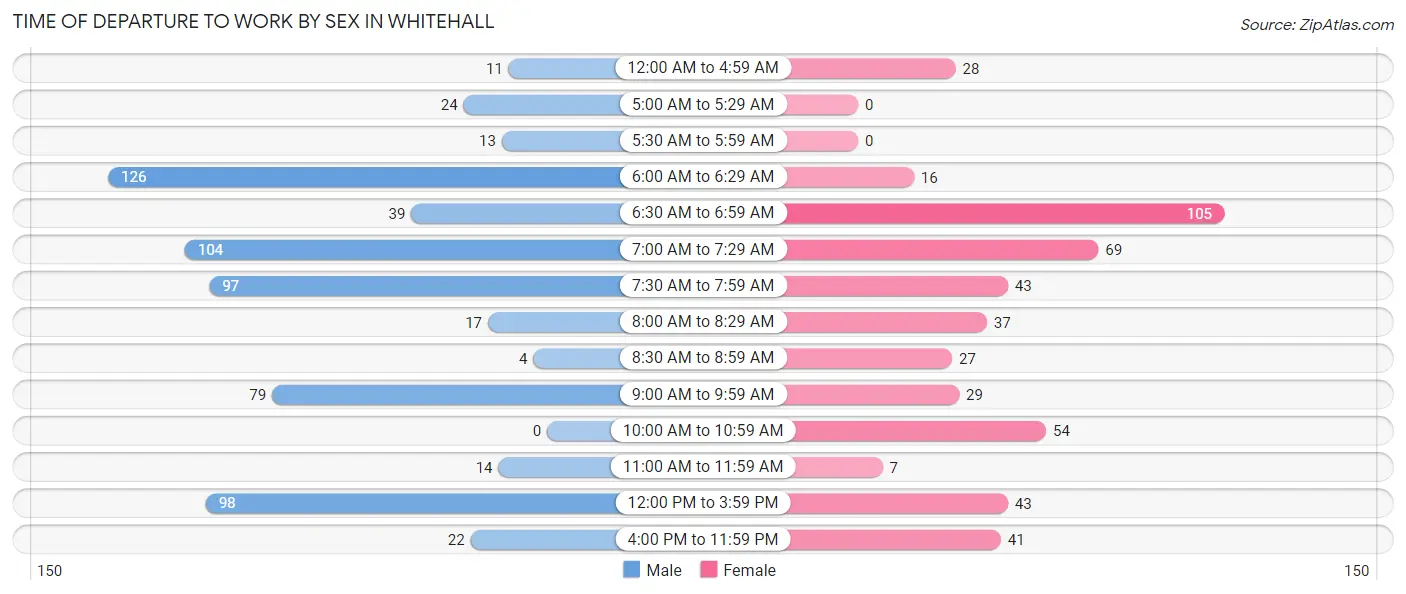
| Time of Departure | Male | Female |
| 12:00 AM to 4:59 AM | 11 (1.7%) | 28 (5.6%) |
| 5:00 AM to 5:29 AM | 24 (3.7%) | 0 (0.0%) |
| 5:30 AM to 5:59 AM | 13 (2.0%) | 0 (0.0%) |
| 6:00 AM to 6:29 AM | 126 (19.4%) | 16 (3.2%) |
| 6:30 AM to 6:59 AM | 39 (6.0%) | 105 (21.0%) |
| 7:00 AM to 7:29 AM | 104 (16.1%) | 69 (13.8%) |
| 7:30 AM to 7:59 AM | 97 (15.0%) | 43 (8.6%) |
| 8:00 AM to 8:29 AM | 17 (2.6%) | 37 (7.4%) |
| 8:30 AM to 8:59 AM | 4 (0.6%) | 27 (5.4%) |
| 9:00 AM to 9:59 AM | 79 (12.2%) | 29 (5.8%) |
| 10:00 AM to 10:59 AM | 0 (0.0%) | 54 (10.8%) |
| 11:00 AM to 11:59 AM | 14 (2.2%) | 7 (1.4%) |
| 12:00 PM to 3:59 PM | 98 (15.1%) | 43 (8.6%) |
| 4:00 PM to 11:59 PM | 22 (3.4%) | 41 (8.2%) |
| Total | 648 (100.0%) | 499 (100.0%) |
Housing Occupancy in Whitehall
Occupancy by Ownership in Whitehall
Of the total 1,066 dwellings in Whitehall, owner-occupied units account for 708 (66.4%), while renter-occupied units make up 358 (33.6%).
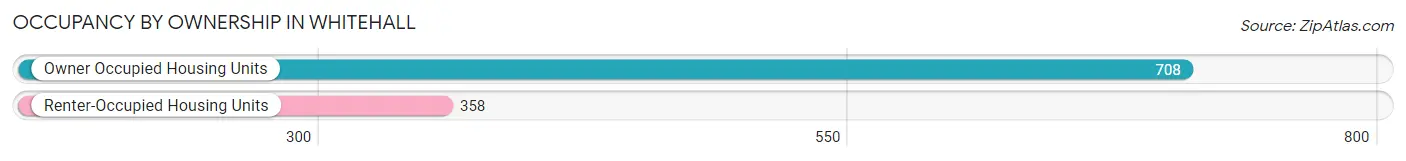
| Occupancy | # Housing Units | % Housing Units |
| Owner Occupied Housing Units | 708 | 66.4% |
| Renter-Occupied Housing Units | 358 | 33.6% |
| Total Occupied Housing Units | 1,066 | 100.0% |
Occupancy by Household Size in Whitehall
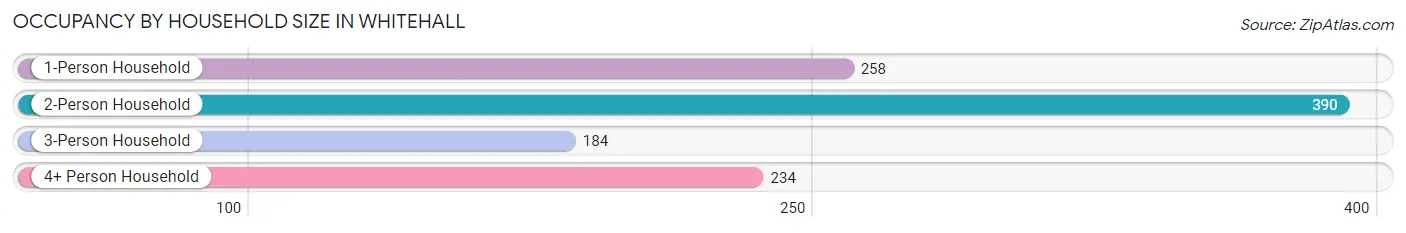
| Household Size | # Housing Units | % Housing Units |
| 1-Person Household | 258 | 24.2% |
| 2-Person Household | 390 | 36.6% |
| 3-Person Household | 184 | 17.3% |
| 4+ Person Household | 234 | 22.0% |
| Total Housing Units | 1,066 | 100.0% |
Occupancy by Ownership by Household Size in Whitehall
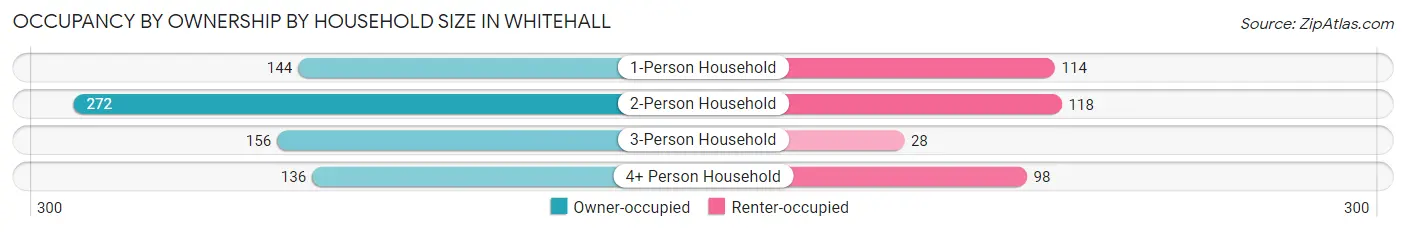
| Household Size | Owner-occupied | Renter-occupied |
| 1-Person Household | 144 (55.8%) | 114 (44.2%) |
| 2-Person Household | 272 (69.7%) | 118 (30.3%) |
| 3-Person Household | 156 (84.8%) | 28 (15.2%) |
| 4+ Person Household | 136 (58.1%) | 98 (41.9%) |
| Total Housing Units | 708 (66.4%) | 358 (33.6%) |
Occupancy by Educational Attainment in Whitehall
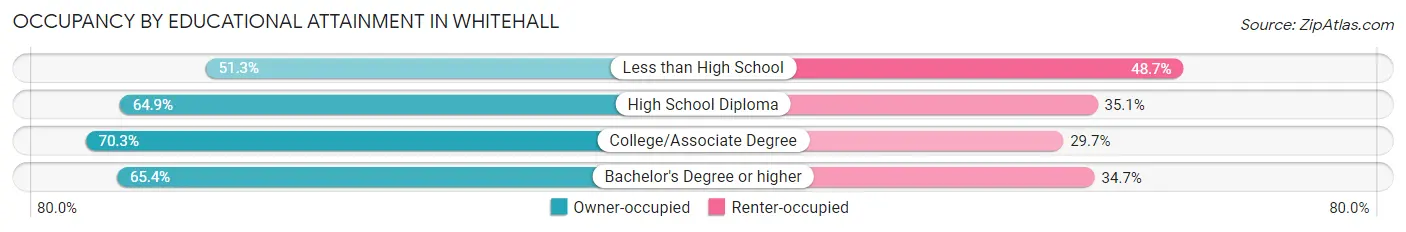
| Household Size | Owner-occupied | Renter-occupied |
| Less than High School | 20 (51.3%) | 19 (48.7%) |
| High School Diploma | 183 (64.9%) | 99 (35.1%) |
| College/Associate Degree | 256 (70.3%) | 108 (29.7%) |
| Bachelor's Degree or higher | 249 (65.3%) | 132 (34.6%) |
Occupancy by Age of Householder in Whitehall
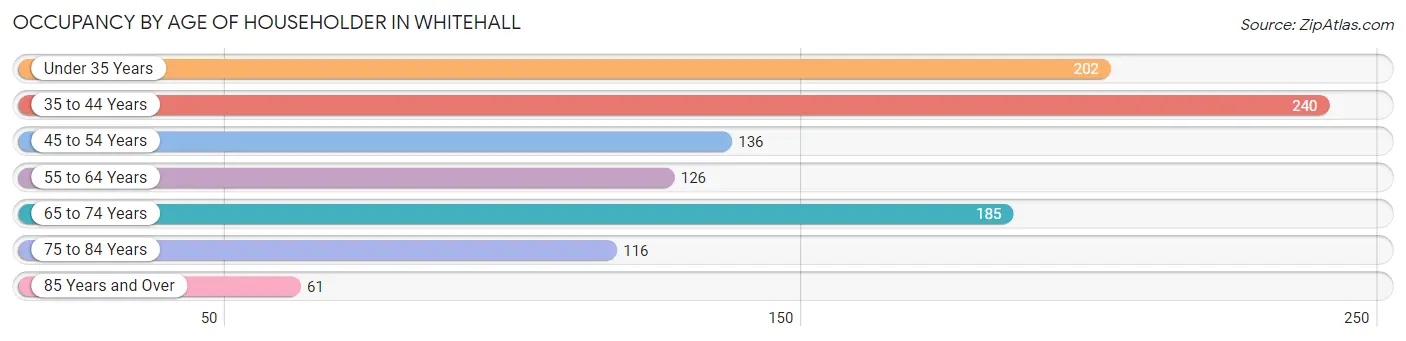
| Age Bracket | # Households | % Households |
| Under 35 Years | 202 | 19.0% |
| 35 to 44 Years | 240 | 22.5% |
| 45 to 54 Years | 136 | 12.8% |
| 55 to 64 Years | 126 | 11.8% |
| 65 to 74 Years | 185 | 17.3% |
| 75 to 84 Years | 116 | 10.9% |
| 85 Years and Over | 61 | 5.7% |
| Total | 1,066 | 100.0% |
Housing Finances in Whitehall
Median Income by Occupancy in Whitehall
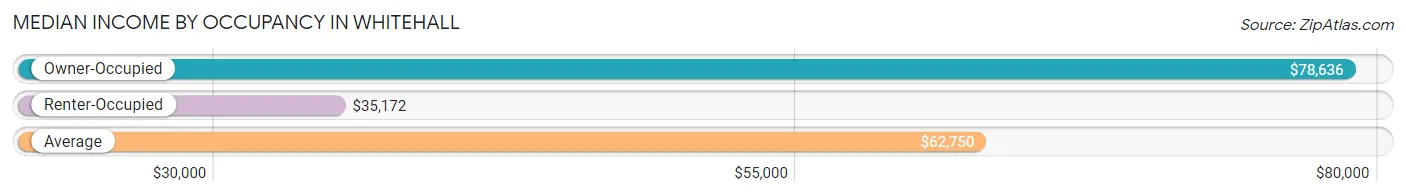
| Occupancy Type | # Households | Median Income |
| Owner-Occupied | 708 (66.4%) | $78,636 |
| Renter-Occupied | 358 (33.6%) | $35,172 |
| Average | 1,066 (100.0%) | $62,750 |
Occupancy by Householder Income Bracket in Whitehall
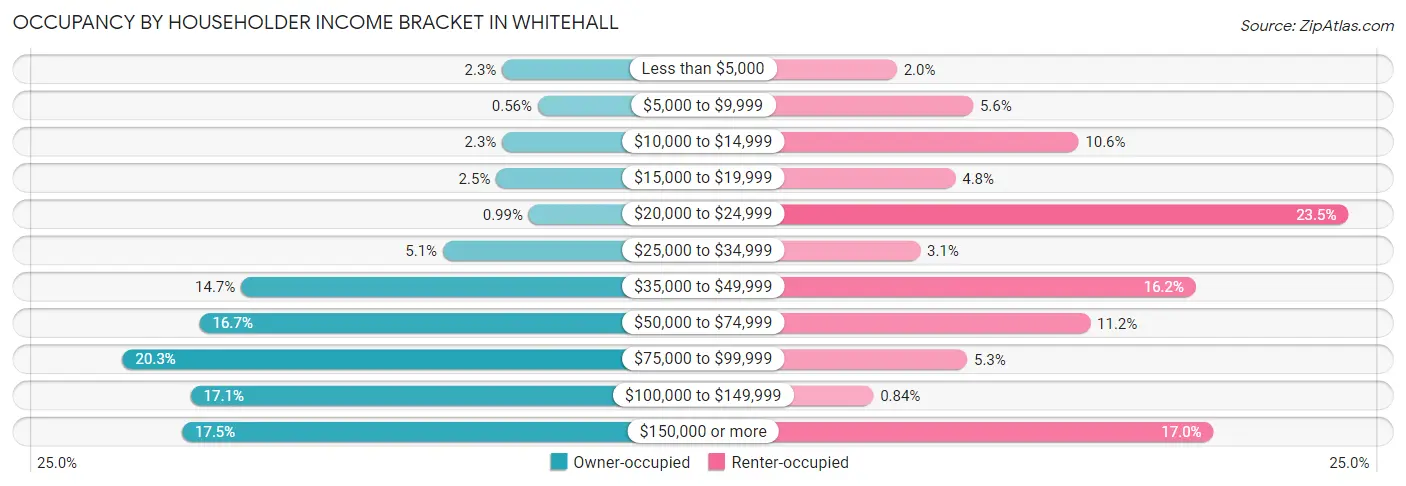
| Income Bracket | Owner-occupied | Renter-occupied |
| Less than $5,000 | 16 (2.3%) | 7 (2.0%) |
| $5,000 to $9,999 | 4 (0.6%) | 20 (5.6%) |
| $10,000 to $14,999 | 16 (2.3%) | 38 (10.6%) |
| $15,000 to $19,999 | 18 (2.5%) | 17 (4.8%) |
| $20,000 to $24,999 | 7 (1.0%) | 84 (23.5%) |
| $25,000 to $34,999 | 36 (5.1%) | 11 (3.1%) |
| $35,000 to $49,999 | 104 (14.7%) | 58 (16.2%) |
| $50,000 to $74,999 | 118 (16.7%) | 40 (11.2%) |
| $75,000 to $99,999 | 144 (20.3%) | 19 (5.3%) |
| $100,000 to $149,999 | 121 (17.1%) | 3 (0.8%) |
| $150,000 or more | 124 (17.5%) | 61 (17.0%) |
| Total | 708 (100.0%) | 358 (100.0%) |
Monthly Housing Cost Tiers in Whitehall
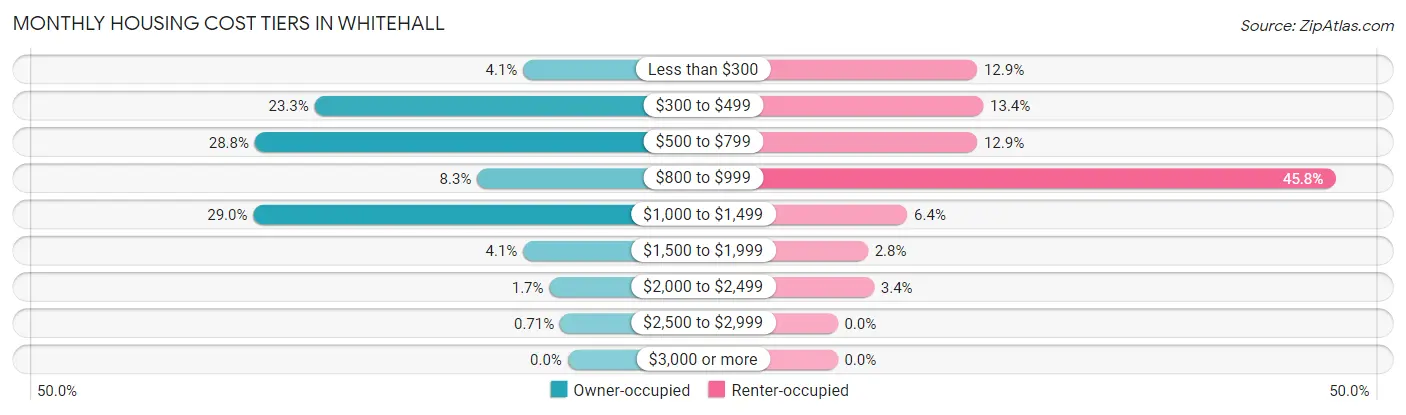
| Monthly Cost | Owner-occupied | Renter-occupied |
| Less than $300 | 29 (4.1%) | 46 (12.9%) |
| $300 to $499 | 165 (23.3%) | 48 (13.4%) |
| $500 to $799 | 204 (28.8%) | 46 (12.9%) |
| $800 to $999 | 59 (8.3%) | 164 (45.8%) |
| $1,000 to $1,499 | 205 (28.9%) | 23 (6.4%) |
| $1,500 to $1,999 | 29 (4.1%) | 10 (2.8%) |
| $2,000 to $2,499 | 12 (1.7%) | 12 (3.4%) |
| $2,500 to $2,999 | 5 (0.7%) | 0 (0.0%) |
| $3,000 or more | 0 (0.0%) | 0 (0.0%) |
| Total | 708 (100.0%) | 358 (100.0%) |
Physical Housing Characteristics in Whitehall
Housing Structures in Whitehall
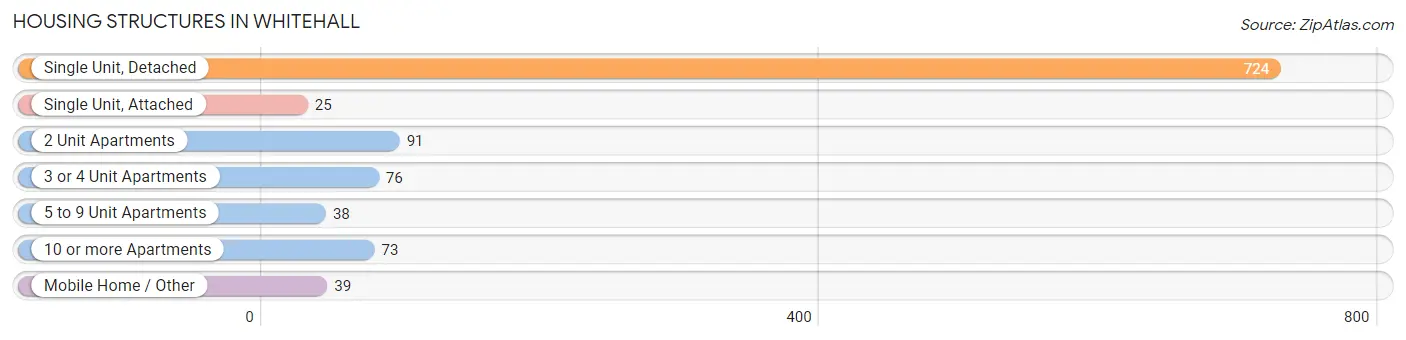
| Structure Type | # Housing Units | % Housing Units |
| Single Unit, Detached | 724 | 67.9% |
| Single Unit, Attached | 25 | 2.4% |
| 2 Unit Apartments | 91 | 8.5% |
| 3 or 4 Unit Apartments | 76 | 7.1% |
| 5 to 9 Unit Apartments | 38 | 3.6% |
| 10 or more Apartments | 73 | 6.9% |
| Mobile Home / Other | 39 | 3.7% |
| Total | 1,066 | 100.0% |
Housing Structures by Occupancy in Whitehall
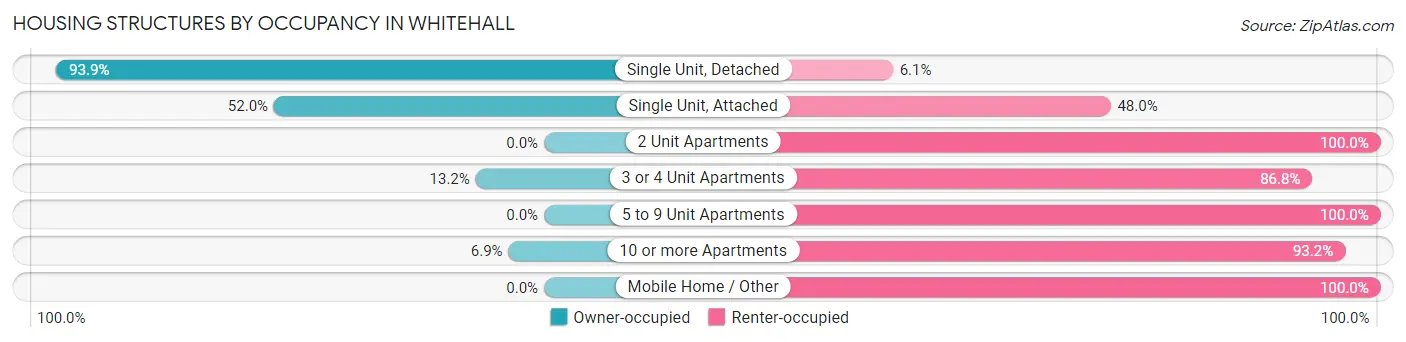
| Structure Type | Owner-occupied | Renter-occupied |
| Single Unit, Detached | 680 (93.9%) | 44 (6.1%) |
| Single Unit, Attached | 13 (52.0%) | 12 (48.0%) |
| 2 Unit Apartments | 0 (0.0%) | 91 (100.0%) |
| 3 or 4 Unit Apartments | 10 (13.2%) | 66 (86.8%) |
| 5 to 9 Unit Apartments | 0 (0.0%) | 38 (100.0%) |
| 10 or more Apartments | 5 (6.9%) | 68 (93.1%) |
| Mobile Home / Other | 0 (0.0%) | 39 (100.0%) |
| Total | 708 (66.4%) | 358 (33.6%) |
Housing Structures by Number of Rooms in Whitehall
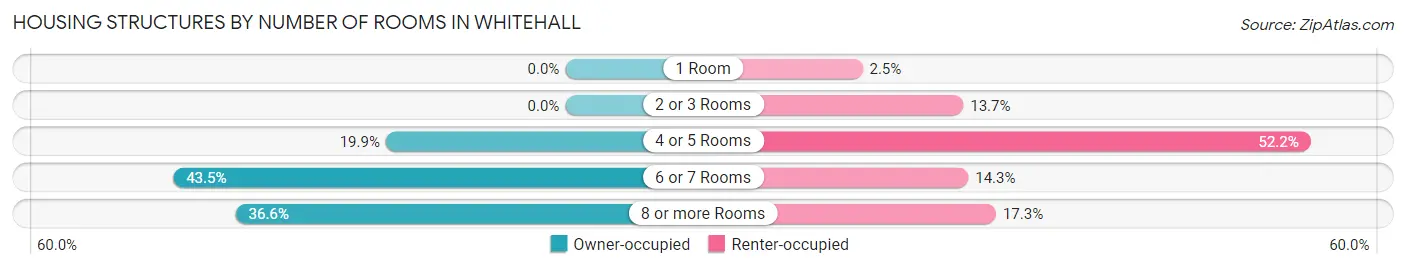
| Number of Rooms | Owner-occupied | Renter-occupied |
| 1 Room | 0 (0.0%) | 9 (2.5%) |
| 2 or 3 Rooms | 0 (0.0%) | 49 (13.7%) |
| 4 or 5 Rooms | 141 (19.9%) | 187 (52.2%) |
| 6 or 7 Rooms | 308 (43.5%) | 51 (14.2%) |
| 8 or more Rooms | 259 (36.6%) | 62 (17.3%) |
| Total | 708 (100.0%) | 358 (100.0%) |
Housing Structure by Heating Type in Whitehall
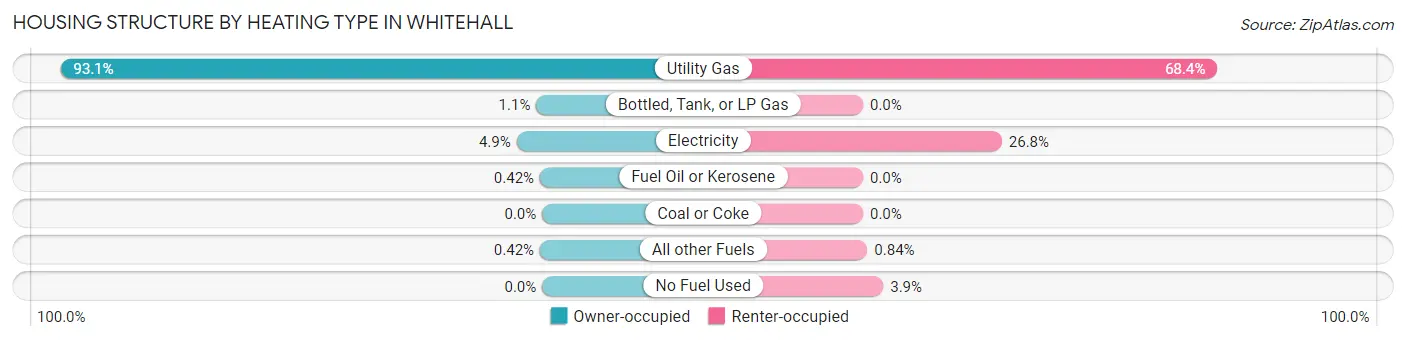
| Heating Type | Owner-occupied | Renter-occupied |
| Utility Gas | 659 (93.1%) | 245 (68.4%) |
| Bottled, Tank, or LP Gas | 8 (1.1%) | 0 (0.0%) |
| Electricity | 35 (4.9%) | 96 (26.8%) |
| Fuel Oil or Kerosene | 3 (0.4%) | 0 (0.0%) |
| Coal or Coke | 0 (0.0%) | 0 (0.0%) |
| All other Fuels | 3 (0.4%) | 3 (0.8%) |
| No Fuel Used | 0 (0.0%) | 14 (3.9%) |
| Total | 708 (100.0%) | 358 (100.0%) |
Household Vehicle Usage in Whitehall

| Vehicles per Household | Owner-occupied | Renter-occupied |
| No Vehicle | 4 (0.6%) | 47 (13.1%) |
| 1 Vehicle | 224 (31.6%) | 112 (31.3%) |
| 2 Vehicles | 281 (39.7%) | 94 (26.3%) |
| 3 or more Vehicles | 199 (28.1%) | 105 (29.3%) |
| Total | 708 (100.0%) | 358 (100.0%) |
Real Estate & Mortgages in Whitehall
Real Estate and Mortgage Overview in Whitehall
| Characteristic | Without Mortgage | With Mortgage |
| Housing Units | 382 | 326 |
| Median Property Value | $211,800 | $188,000 |
| Median Household Income | $67,600 | $34 |
| Monthly Housing Costs | $497 | $0 |
| Real Estate Taxes | $2,756 | $8 |
Property Value by Mortgage Status in Whitehall
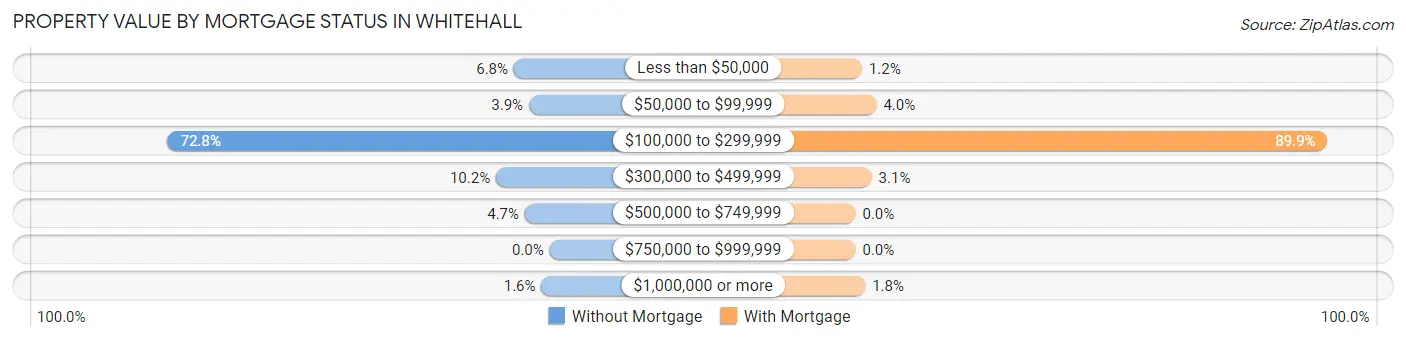
| Property Value | Without Mortgage | With Mortgage |
| Less than $50,000 | 26 (6.8%) | 4 (1.2%) |
| $50,000 to $99,999 | 15 (3.9%) | 13 (4.0%) |
| $100,000 to $299,999 | 278 (72.8%) | 293 (89.9%) |
| $300,000 to $499,999 | 39 (10.2%) | 10 (3.1%) |
| $500,000 to $749,999 | 18 (4.7%) | 0 (0.0%) |
| $750,000 to $999,999 | 0 (0.0%) | 0 (0.0%) |
| $1,000,000 or more | 6 (1.6%) | 6 (1.8%) |
| Total | 382 (100.0%) | 326 (100.0%) |
Household Income by Mortgage Status in Whitehall
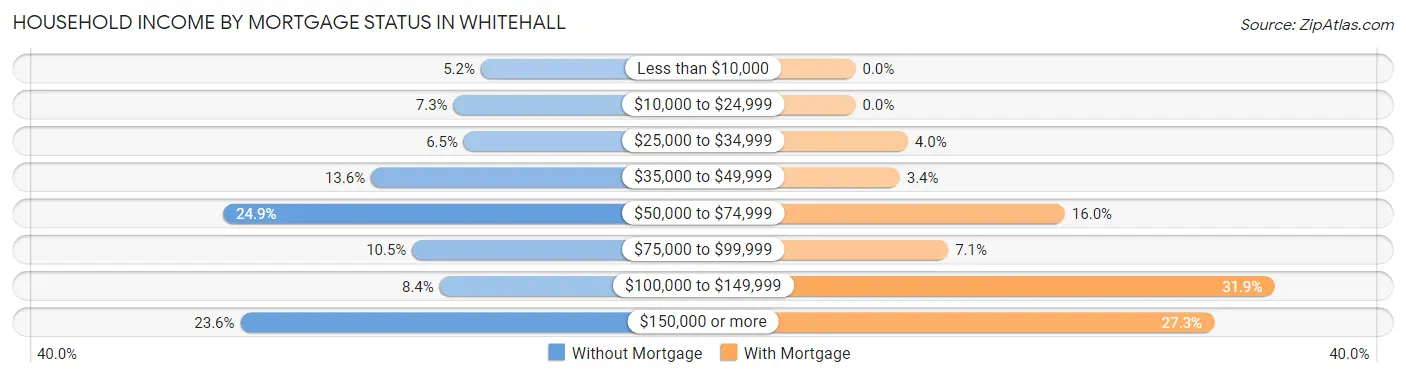
| Household Income | Without Mortgage | With Mortgage |
| Less than $10,000 | 20 (5.2%) | 0 (0.0%) |
| $10,000 to $24,999 | 28 (7.3%) | 0 (0.0%) |
| $25,000 to $34,999 | 25 (6.5%) | 13 (4.0%) |
| $35,000 to $49,999 | 52 (13.6%) | 11 (3.4%) |
| $50,000 to $74,999 | 95 (24.9%) | 52 (16.0%) |
| $75,000 to $99,999 | 40 (10.5%) | 23 (7.1%) |
| $100,000 to $149,999 | 32 (8.4%) | 104 (31.9%) |
| $150,000 or more | 90 (23.6%) | 89 (27.3%) |
| Total | 382 (100.0%) | 326 (100.0%) |
Property Value to Household Income Ratio in Whitehall
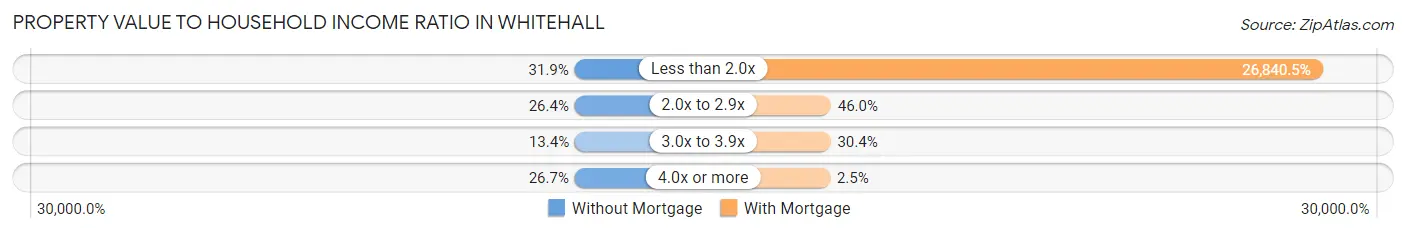
| Value-to-Income Ratio | Without Mortgage | With Mortgage |
| Less than 2.0x | 122 (31.9%) | 87,500 (26,840.5%) |
| 2.0x to 2.9x | 101 (26.4%) | 150 (46.0%) |
| 3.0x to 3.9x | 51 (13.4%) | 99 (30.4%) |
| 4.0x or more | 102 (26.7%) | 8 (2.5%) |
| Total | 382 (100.0%) | 326 (100.0%) |
Real Estate Taxes by Mortgage Status in Whitehall
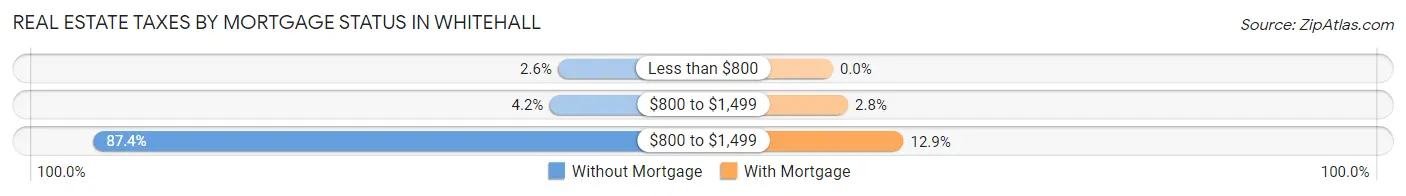
| Property Taxes | Without Mortgage | With Mortgage |
| Less than $800 | 10 (2.6%) | 0 (0.0%) |
| $800 to $1,499 | 16 (4.2%) | 9 (2.8%) |
| $800 to $1,499 | 334 (87.4%) | 42 (12.9%) |
| Total | 382 (100.0%) | 326 (100.0%) |
Health & Disability in Whitehall
Health Insurance Coverage by Age in Whitehall
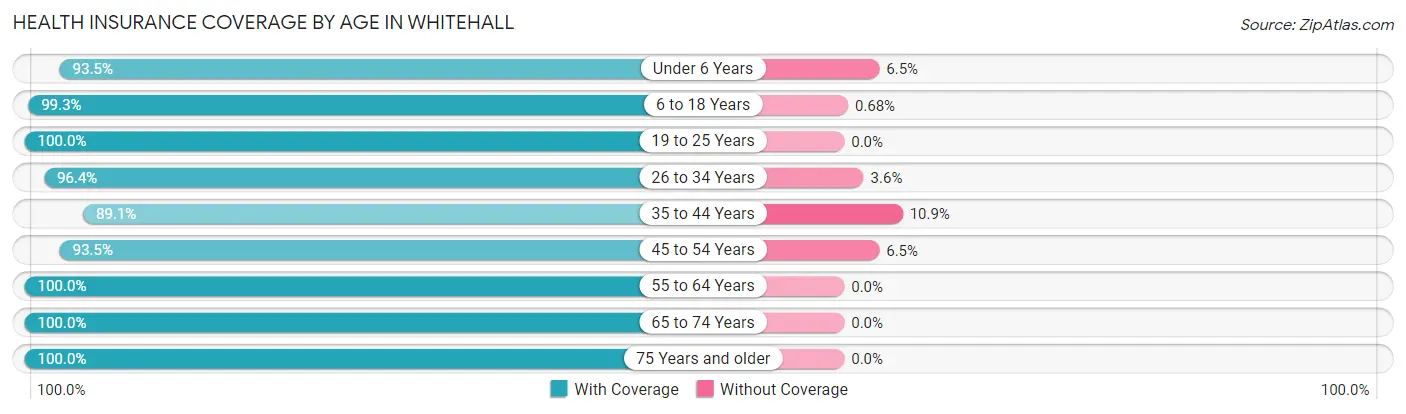
| Age Bracket | With Coverage | Without Coverage |
| Under 6 Years | 200 (93.5%) | 14 (6.5%) |
| 6 to 18 Years | 586 (99.3%) | 4 (0.7%) |
| 19 to 25 Years | 186 (100.0%) | 0 (0.0%) |
| 26 to 34 Years | 374 (96.4%) | 14 (3.6%) |
| 35 to 44 Years | 319 (89.1%) | 39 (10.9%) |
| 45 to 54 Years | 272 (93.5%) | 19 (6.5%) |
| 55 to 64 Years | 243 (100.0%) | 0 (0.0%) |
| 65 to 74 Years | 289 (100.0%) | 0 (0.0%) |
| 75 Years and older | 271 (100.0%) | 0 (0.0%) |
| Total | 2,740 (96.8%) | 90 (3.2%) |
Health Insurance Coverage by Citizenship Status in Whitehall
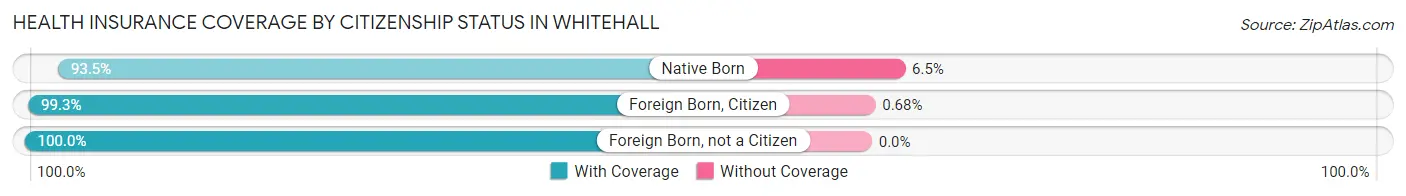
| Citizenship Status | With Coverage | Without Coverage |
| Native Born | 200 (93.5%) | 14 (6.5%) |
| Foreign Born, Citizen | 586 (99.3%) | 4 (0.7%) |
| Foreign Born, not a Citizen | 186 (100.0%) | 0 (0.0%) |
Health Insurance Coverage by Household Income in Whitehall
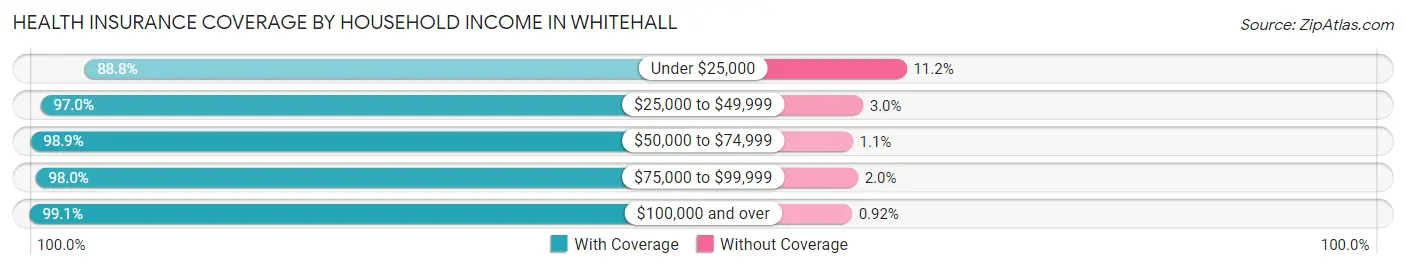
| Household Income | With Coverage | Without Coverage |
| Under $25,000 | 437 (88.8%) | 55 (11.2%) |
| $25,000 to $49,999 | 388 (97.0%) | 12 (3.0%) |
| $50,000 to $74,999 | 366 (98.9%) | 4 (1.1%) |
| $75,000 to $99,999 | 432 (98.0%) | 9 (2.0%) |
| $100,000 and over | 1,079 (99.1%) | 10 (0.9%) |
Public vs Private Health Insurance Coverage by Age in Whitehall
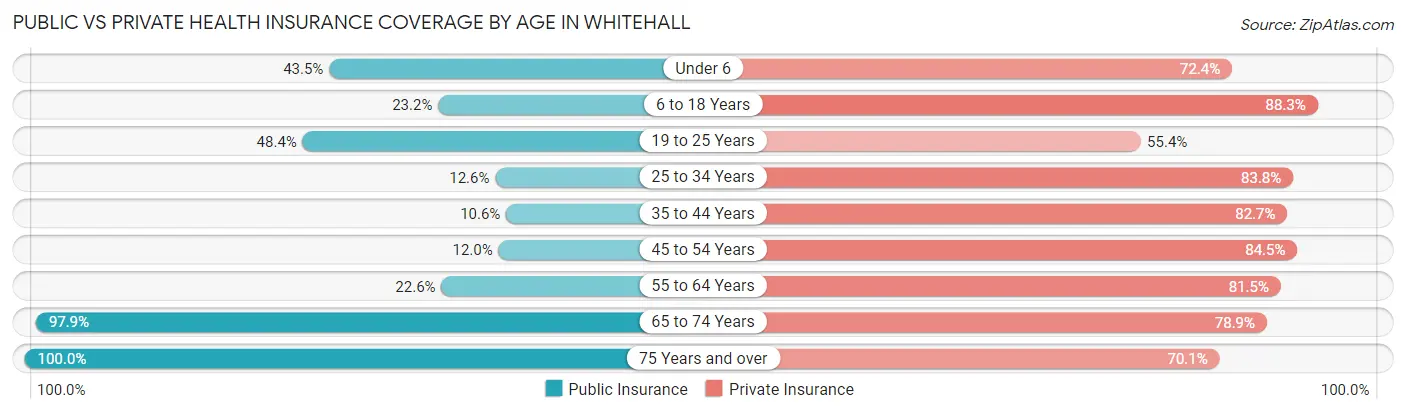
| Age Bracket | Public Insurance | Private Insurance |
| Under 6 | 93 (43.5%) | 155 (72.4%) |
| 6 to 18 Years | 137 (23.2%) | 521 (88.3%) |
| 19 to 25 Years | 90 (48.4%) | 103 (55.4%) |
| 25 to 34 Years | 49 (12.6%) | 325 (83.8%) |
| 35 to 44 Years | 38 (10.6%) | 296 (82.7%) |
| 45 to 54 Years | 35 (12.0%) | 246 (84.5%) |
| 55 to 64 Years | 55 (22.6%) | 198 (81.5%) |
| 65 to 74 Years | 283 (97.9%) | 228 (78.9%) |
| 75 Years and over | 271 (100.0%) | 190 (70.1%) |
| Total | 1,051 (37.1%) | 2,262 (79.9%) |
Disability Status by Sex by Age in Whitehall
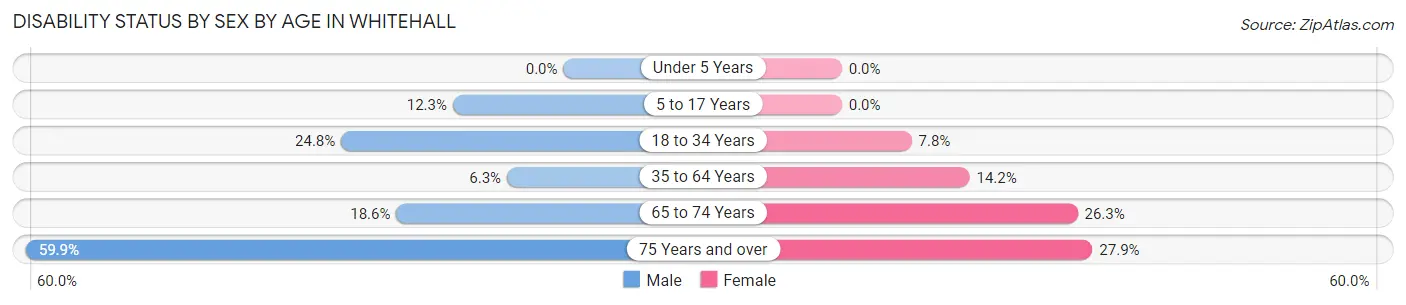
| Age Bracket | Male | Female |
| Under 5 Years | 0 (0.0%) | 0 (0.0%) |
| 5 to 17 Years | 33 (12.3%) | 0 (0.0%) |
| 18 to 34 Years | 75 (24.7%) | 22 (7.8%) |
| 35 to 64 Years | 26 (6.3%) | 68 (14.2%) |
| 65 to 74 Years | 24 (18.6%) | 42 (26.3%) |
| 75 Years and over | 85 (59.9%) | 36 (27.9%) |
Disability Class by Sex by Age in Whitehall
Disability Class: Hearing Difficulty
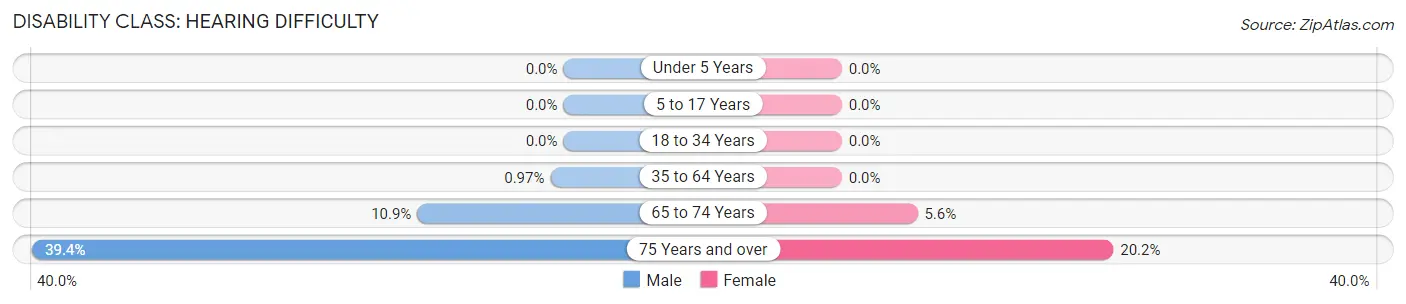
| Age Bracket | Male | Female |
| Under 5 Years | 0 (0.0%) | 0 (0.0%) |
| 5 to 17 Years | 0 (0.0%) | 0 (0.0%) |
| 18 to 34 Years | 0 (0.0%) | 0 (0.0%) |
| 35 to 64 Years | 4 (1.0%) | 0 (0.0%) |
| 65 to 74 Years | 14 (10.8%) | 9 (5.6%) |
| 75 Years and over | 56 (39.4%) | 26 (20.2%) |
Disability Class: Vision Difficulty
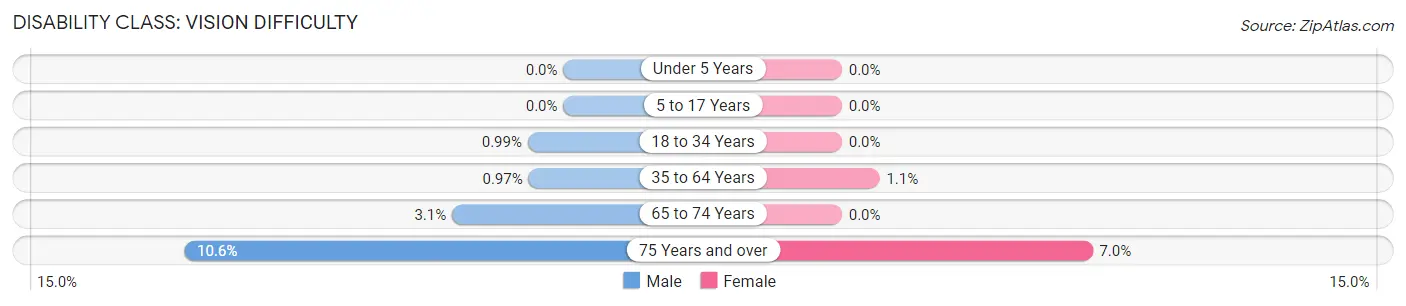
| Age Bracket | Male | Female |
| Under 5 Years | 0 (0.0%) | 0 (0.0%) |
| 5 to 17 Years | 0 (0.0%) | 0 (0.0%) |
| 18 to 34 Years | 3 (1.0%) | 0 (0.0%) |
| 35 to 64 Years | 4 (1.0%) | 5 (1.1%) |
| 65 to 74 Years | 4 (3.1%) | 0 (0.0%) |
| 75 Years and over | 15 (10.6%) | 9 (7.0%) |
Disability Class: Cognitive Difficulty
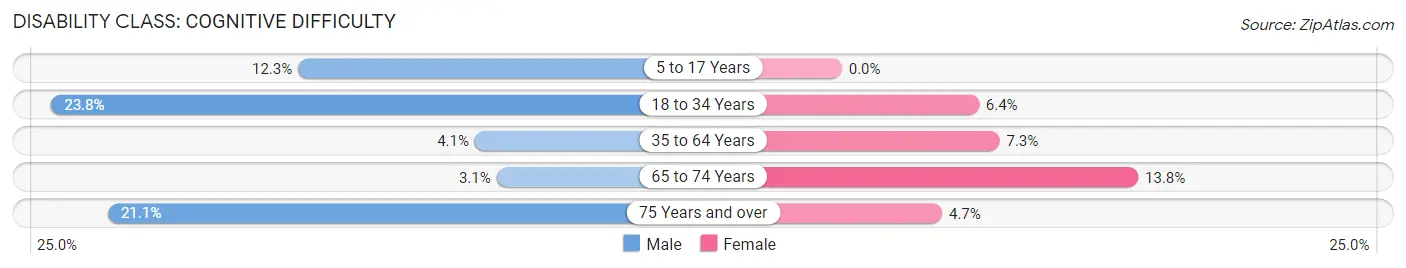
| Age Bracket | Male | Female |
| 5 to 17 Years | 33 (12.3%) | 0 (0.0%) |
| 18 to 34 Years | 72 (23.8%) | 18 (6.4%) |
| 35 to 64 Years | 17 (4.1%) | 35 (7.3%) |
| 65 to 74 Years | 4 (3.1%) | 22 (13.8%) |
| 75 Years and over | 30 (21.1%) | 6 (4.6%) |
Disability Class: Ambulatory Difficulty
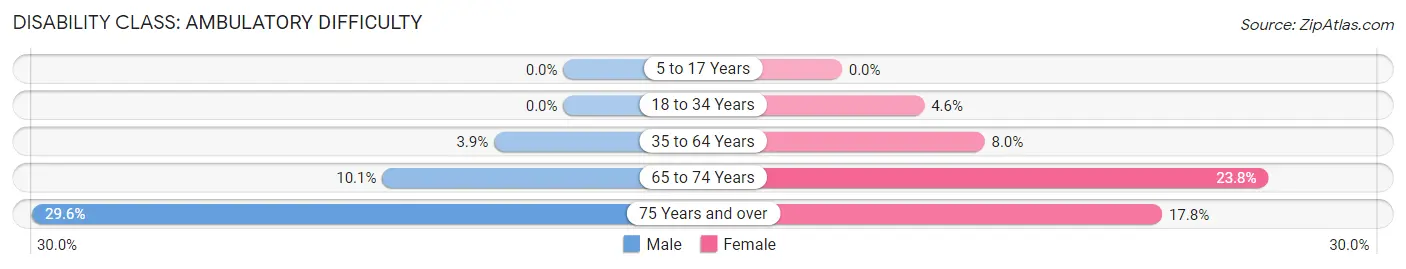
| Age Bracket | Male | Female |
| 5 to 17 Years | 0 (0.0%) | 0 (0.0%) |
| 18 to 34 Years | 0 (0.0%) | 13 (4.6%) |
| 35 to 64 Years | 16 (3.9%) | 38 (8.0%) |
| 65 to 74 Years | 13 (10.1%) | 38 (23.7%) |
| 75 Years and over | 42 (29.6%) | 23 (17.8%) |
Disability Class: Self-Care Difficulty
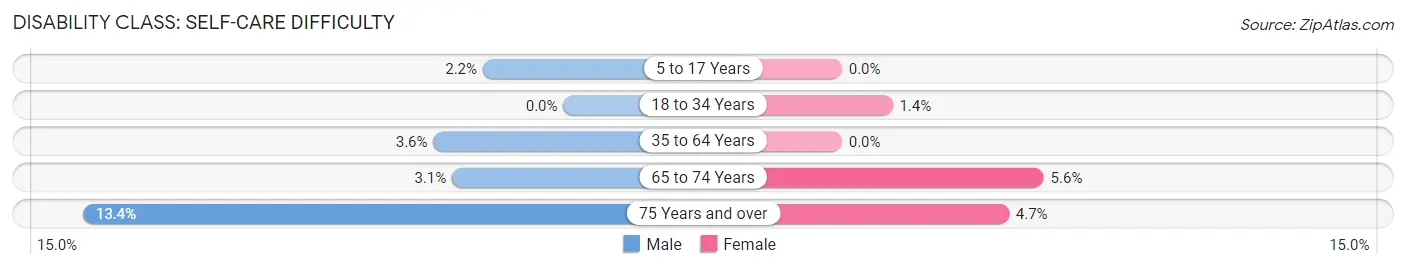
| Age Bracket | Male | Female |
| 5 to 17 Years | 6 (2.2%) | 0 (0.0%) |
| 18 to 34 Years | 0 (0.0%) | 4 (1.4%) |
| 35 to 64 Years | 15 (3.6%) | 0 (0.0%) |
| 65 to 74 Years | 4 (3.1%) | 9 (5.6%) |
| 75 Years and over | 19 (13.4%) | 6 (4.6%) |
Technology Access in Whitehall
Computing Device Access in Whitehall
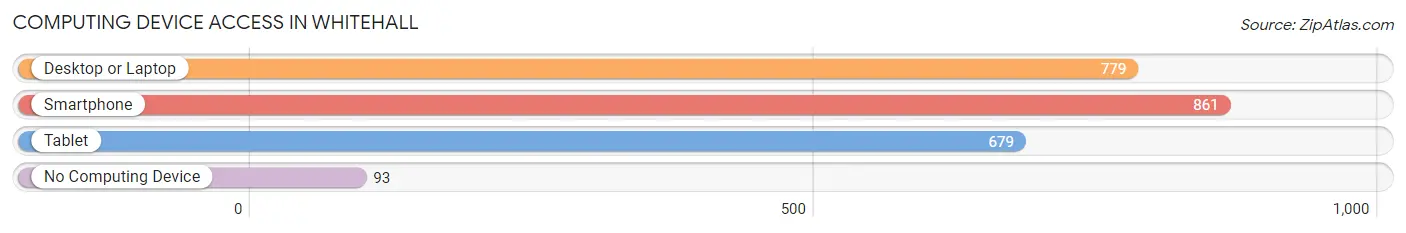
| Device Type | # Households | % Households |
| Desktop or Laptop | 779 | 73.1% |
| Smartphone | 861 | 80.8% |
| Tablet | 679 | 63.7% |
| No Computing Device | 93 | 8.7% |
| Total | 1,066 | 100.0% |
Internet Access in Whitehall
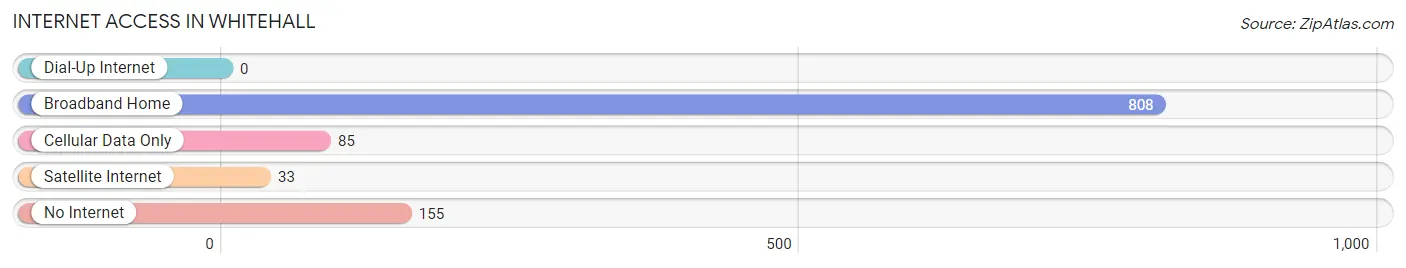
| Internet Type | # Households | % Households |
| Dial-Up Internet | 0 | 0.0% |
| Broadband Home | 808 | 75.8% |
| Cellular Data Only | 85 | 8.0% |
| Satellite Internet | 33 | 3.1% |
| No Internet | 155 | 14.5% |
| Total | 1,066 | 100.0% |
Whitehall Summary
History
Whitehall is a city located in Muskegon County, Michigan. It is situated on the shores of White Lake, a popular recreational area. The city was founded in 1867 by William White, a lumberman from New York. White purchased the land from the government and began to develop the area. He built a sawmill and a dock, and the town was named after him.
Whitehall quickly became a popular destination for tourists and vacationers. The city was known for its beautiful beaches, fishing, and boating. In the late 1800s, the city was home to several resorts, including the Whitehall Hotel, which was built in 1891.
The city continued to grow throughout the early 1900s. In the 1920s, the Whitehall Yacht Club was established, and the city became a popular destination for sailing and other water sports. The city also became a popular spot for summer homes and cottages.
In the 1950s, Whitehall began to experience a decline in population. The city was hit hard by the Great Depression and World War II. Many of the resorts and businesses closed, and the population dropped from over 2,000 in the 1930s to just over 1,000 in the 1950s.
In the 1960s, the city began to experience a resurgence. The city was revitalized with the construction of a new marina and the development of a new industrial park. The city also began to attract new businesses and industries, including a paper mill and a plastics factory.
Today, Whitehall is a thriving city with a population of over 3,000. The city is home to several businesses, including a marina, a golf course, and a variety of restaurants and shops. The city is also home to several parks and recreational areas, including the White Lake State Park.
Geography
Whitehall is located in Muskegon County, Michigan. The city is situated on the shores of White Lake, a popular recreational area. The city is bordered by the cities of Montague to the north, Muskegon to the east, and North Muskegon to the south.
The city has a total area of 4.2 square miles, all of which is land. The city is located at an elevation of 645 feet above sea level. The climate in Whitehall is classified as humid continental, with warm summers and cold winters.
Economy
Whitehall’s economy is largely based on tourism and recreation. The city is home to several businesses, including a marina, a golf course, and a variety of restaurants and shops. The city is also home to several parks and recreational areas, including the White Lake State Park.
The city is also home to several industries, including a paper mill and a plastics factory. The city is also home to several manufacturing companies, including a boat manufacturer and a furniture manufacturer.
Demographics
As of the 2010 census, Whitehall had a population of 3,068. The racial makeup of the city was 94.3% White, 1.2% African American, 0.7% Native American, 0.7% Asian, 0.1% Pacific Islander, 1.2% from other races, and 1.9% from two or more races. Hispanic or Latino of any race were 3.2% of the population.
The median household income in Whitehall was $41,944, and the median family income was $50,917. The per capita income for the city was $20,945. About 11.2% of families and 14.2% of the population were below the poverty line, including 19.2% of those under age 18 and 8.2% of those age 65 or over.
Common Questions
What is Per Capita Income in Whitehall?
Per Capita income in Whitehall is $31,176.
What is the Median Family Income in Whitehall?
Median Family Income in Whitehall is $78,665.
What is the Median Household income in Whitehall?
Median Household Income in Whitehall is $62,750.
What is Income or Wage Gap in Whitehall?
Income or Wage Gap in Whitehall is 9.0%.
Women in Whitehall earn 91.0 cents for every dollar earned by a man.
What is Inequality or Gini Index in Whitehall?
Inequality or Gini Index in Whitehall is 0.43.
What is the Total Population of Whitehall?
Total Population of Whitehall is 2,935.
What is the Total Male Population of Whitehall?
Total Male Population of Whitehall is 1,442.
What is the Total Female Population of Whitehall?
Total Female Population of Whitehall is 1,493.
What is the Ratio of Males per 100 Females in Whitehall?
There are 96.58 Males per 100 Females in Whitehall.
What is the Ratio of Females per 100 Males in Whitehall?
There are 103.54 Females per 100 Males in Whitehall.
What is the Median Population Age in Whitehall?
Median Population Age in Whitehall is 36.9 Years.
What is the Average Family Size in Whitehall
Average Family Size in Whitehall is 3.1 People.
What is the Average Household Size in Whitehall
Average Household Size in Whitehall is 2.6 People.
How Large is the Labor Force in Whitehall?
There are 1,242 People in the Labor Forcein in Whitehall.
What is the Percentage of People in the Labor Force in Whitehall?
57.6% of People are in the Labor Force in Whitehall.
What is the Unemployment Rate in Whitehall?
Unemployment Rate in Whitehall is 2.1%.