Muskegon, MI Map & Demographics
Muskegon Map
Muskegon Overview
$22,262
PER CAPITA INCOME
$51,665
AVG FAMILY INCOME
$40,900
AVG HOUSEHOLD INCOME
27.9%
WAGE / INCOME GAP [ % ]
72.1¢/ $1
WAGE / INCOME GAP [ $ ]
$10,687
FAMILY INCOME DEFICIT
0.46
INEQUALITY / GINI INDEX
38,286
TOTAL POPULATION
19,671
MALE POPULATION
18,615
FEMALE POPULATION
105.67
MALES / 100 FEMALES
94.63
FEMALES / 100 MALES
36.1
MEDIAN AGE
3.2
AVG FAMILY SIZE
2.3
AVG HOUSEHOLD SIZE
15,984
LABOR FORCE [ PEOPLE ]
52.0%
PERCENT IN LABOR FORCE
10.4%
UNEMPLOYMENT RATE
Muskegon Area Codes
Income in Muskegon
Income Overview in Muskegon
Per Capita Income in Muskegon is $22,262, while median incomes of families and households are $51,665 and $40,900 respectively.
| Characteristic | Number | Measure |
| Per Capita Income | 38,286 | $22,262 |
| Median Family Income | 7,437 | $51,665 |
| Mean Family Income | 7,437 | $69,196 |
| Median Household Income | 14,288 | $40,900 |
| Mean Household Income | 14,288 | $55,927 |
| Income Deficit | 7,437 | $10,687 |
| Wage / Income Gap (%) | 38,286 | 27.94% |
| Wage / Income Gap ($) | 38,286 | 72.06¢ per $1 |
| Gini / Inequality Index | 38,286 | 0.46 |
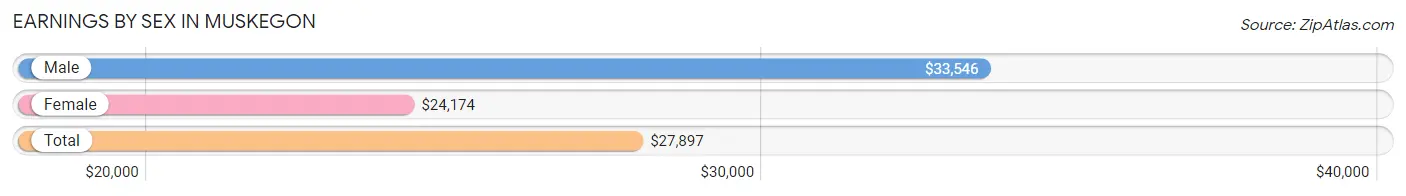
Earnings by Sex in Muskegon
Average Earnings in Muskegon are $27,897, $33,546 for men and $24,174 for women, a difference of 27.9%.
| Sex | Number | Average Earnings |
| Male | 8,028 (47.0%) | $33,546 |
| Female | 9,048 (53.0%) | $24,174 |
| Total | 17,076 (100.0%) | $27,897 |
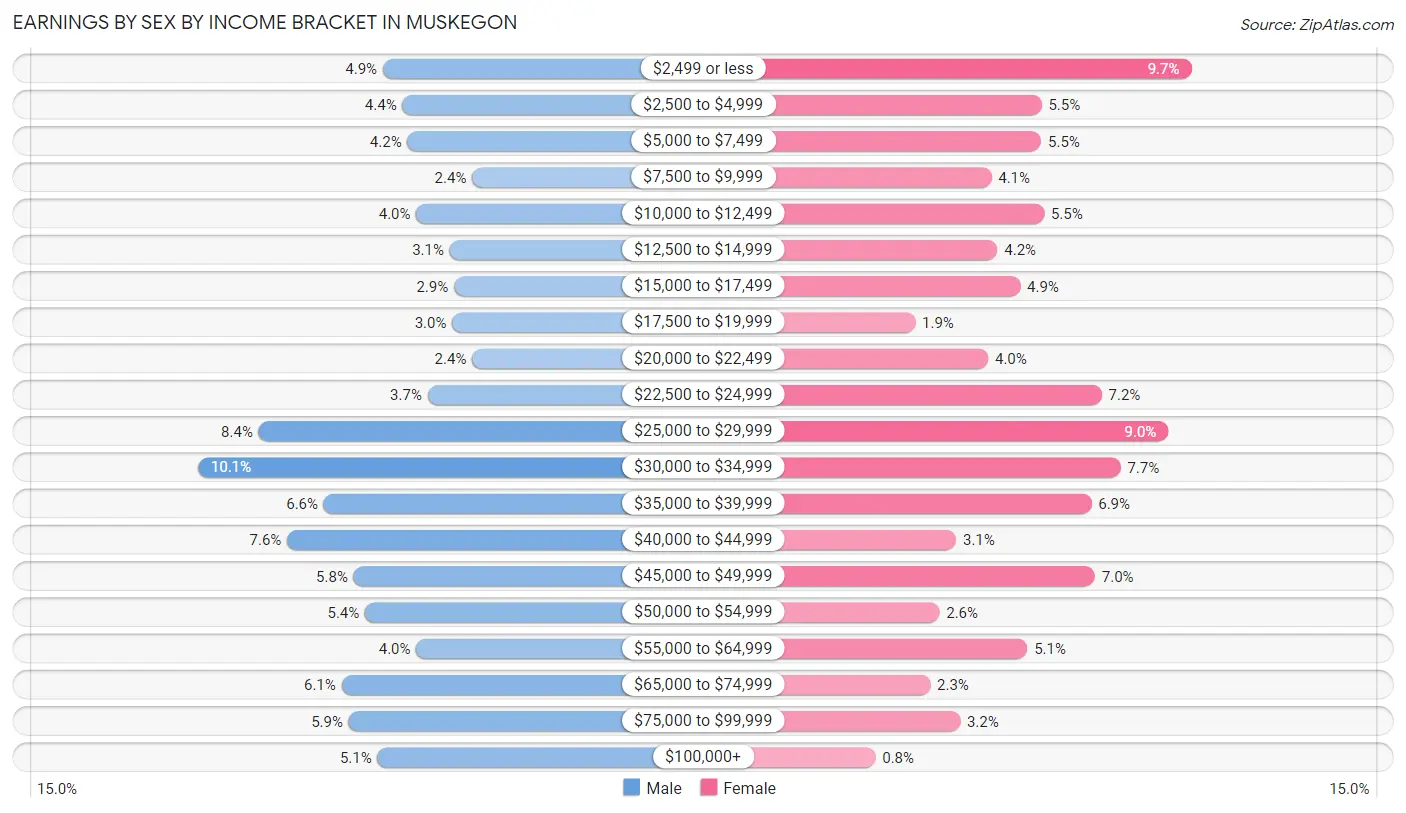
Earnings by Sex by Income Bracket in Muskegon
The most common earnings brackets in Muskegon are $30,000 to $34,999 for men (813 | 10.1%) and $2,499 or less for women (876 | 9.7%).
| Income | Male | Female |
| $2,499 or less | 396 (4.9%) | 876 (9.7%) |
| $2,500 to $4,999 | 352 (4.4%) | 495 (5.5%) |
| $5,000 to $7,499 | 340 (4.2%) | 494 (5.5%) |
| $7,500 to $9,999 | 194 (2.4%) | 367 (4.1%) |
| $10,000 to $12,499 | 320 (4.0%) | 501 (5.5%) |
| $12,500 to $14,999 | 245 (3.0%) | 383 (4.2%) |
| $15,000 to $17,499 | 235 (2.9%) | 441 (4.9%) |
| $17,500 to $19,999 | 239 (3.0%) | 174 (1.9%) |
| $20,000 to $22,499 | 194 (2.4%) | 359 (4.0%) |
| $22,500 to $24,999 | 295 (3.7%) | 648 (7.2%) |
| $25,000 to $29,999 | 676 (8.4%) | 817 (9.0%) |
| $30,000 to $34,999 | 813 (10.1%) | 696 (7.7%) |
| $35,000 to $39,999 | 529 (6.6%) | 622 (6.9%) |
| $40,000 to $44,999 | 612 (7.6%) | 278 (3.1%) |
| $45,000 to $49,999 | 462 (5.8%) | 631 (7.0%) |
| $50,000 to $54,999 | 436 (5.4%) | 235 (2.6%) |
| $55,000 to $64,999 | 320 (4.0%) | 459 (5.1%) |
| $65,000 to $74,999 | 489 (6.1%) | 212 (2.3%) |
| $75,000 to $99,999 | 473 (5.9%) | 288 (3.2%) |
| $100,000+ | 408 (5.1%) | 72 (0.8%) |
| Total | 8,028 (100.0%) | 9,048 (100.0%) |
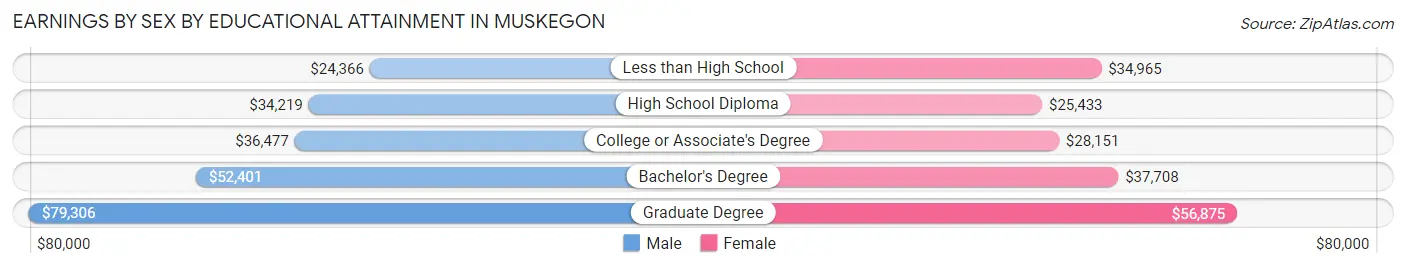
Earnings by Sex by Educational Attainment in Muskegon
Average earnings in Muskegon are $36,799 for men and $29,041 for women, a difference of 21.1%. Men with an educational attainment of graduate degree enjoy the highest average annual earnings of $79,306, while those with less than high school education earn the least with $24,366. Women with an educational attainment of graduate degree earn the most with the average annual earnings of $56,875, while those with high school diploma education have the smallest earnings of $25,433.
| Educational Attainment | Male Income | Female Income |
| Less than High School | $24,366 | $34,965 |
| High School Diploma | $34,219 | $25,433 |
| College or Associate's Degree | $36,477 | $28,151 |
| Bachelor's Degree | $52,401 | $37,708 |
| Graduate Degree | $79,306 | $56,875 |
| Total | $36,799 | $29,041 |
Family Income in Muskegon
Family Income Brackets in Muskegon
According to the Muskegon family income data, there are 1,510 families falling into the $50,000 to $74,999 income range, which is the most common income bracket and makes up 20.3% of all families. Conversely, the $150,000 to $199,999 income bracket is the least frequent group with only 156 families (2.1%) belonging to this category.
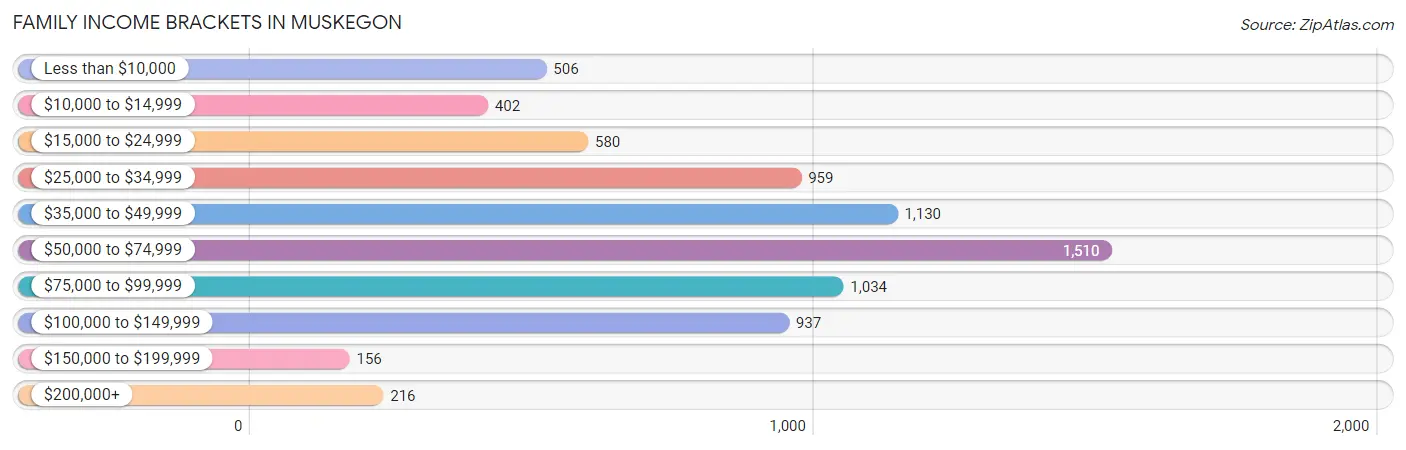
| Income Bracket | # Families | % Families |
| Less than $10,000 | 506 | 6.8% |
| $10,000 to $14,999 | 402 | 5.4% |
| $15,000 to $24,999 | 580 | 7.8% |
| $25,000 to $34,999 | 959 | 12.9% |
| $35,000 to $49,999 | 1,130 | 15.2% |
| $50,000 to $74,999 | 1,510 | 20.3% |
| $75,000 to $99,999 | 1,034 | 13.9% |
| $100,000 to $149,999 | 937 | 12.6% |
| $150,000 to $199,999 | 156 | 2.1% |
| $200,000+ | 216 | 2.9% |
Family Income by Famaliy Size in Muskegon
7+ person families (118 | 1.6%) account for the highest median family income in Muskegon with $105,000 per family, while 2-person families (3,634 | 48.9%) have the highest median income of $22,466 per family member.
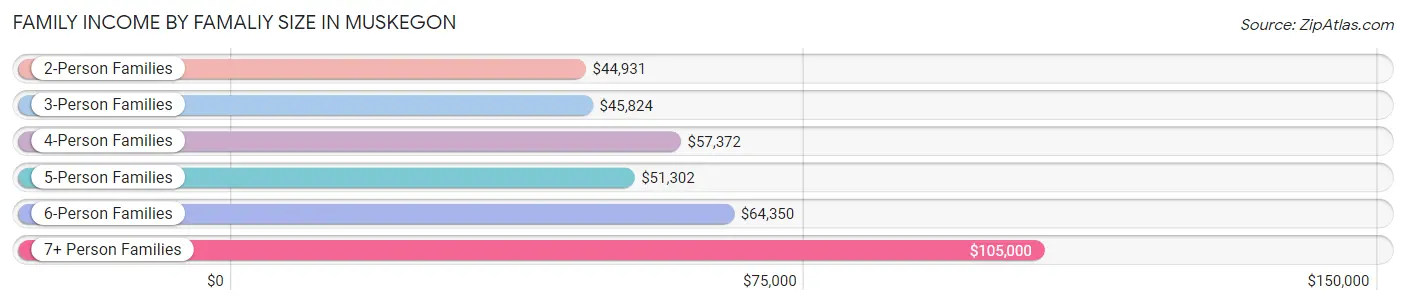
| Income Bracket | # Families | Median Income |
| 2-Person Families | 3,634 (48.9%) | $44,931 |
| 3-Person Families | 1,725 (23.2%) | $45,824 |
| 4-Person Families | 920 (12.4%) | $57,372 |
| 5-Person Families | 549 (7.4%) | $51,302 |
| 6-Person Families | 491 (6.6%) | $64,350 |
| 7+ Person Families | 118 (1.6%) | $105,000 |
| Total | 7,437 (100.0%) | $51,665 |
Family Income by Number of Earners in Muskegon
The median family income in Muskegon is $51,665, with families comprising 3+ earners (561) having the highest median family income of $97,321, while families with no earners (1,308) have the lowest median family income of $25,921, accounting for 7.5% and 17.6% of families, respectively.
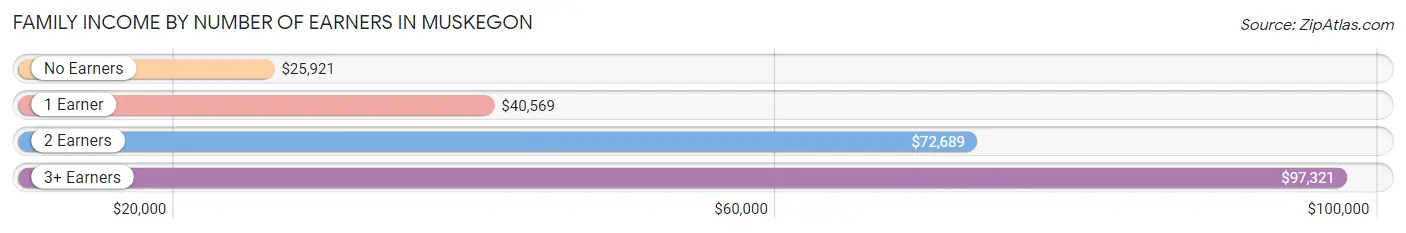
| Number of Earners | # Families | Median Income |
| No Earners | 1,308 (17.6%) | $25,921 |
| 1 Earner | 3,148 (42.3%) | $40,569 |
| 2 Earners | 2,420 (32.5%) | $72,689 |
| 3+ Earners | 561 (7.5%) | $97,321 |
| Total | 7,437 (100.0%) | $51,665 |
Household Income in Muskegon
Household Income Brackets in Muskegon
With 2,772 households falling in the category, the $50,000 to $74,999 income range is the most frequent in Muskegon, accounting for 19.4% of all households. In contrast, only 214 households (1.5%) fall into the $150,000 to $199,999 income bracket, making it the least populous group.
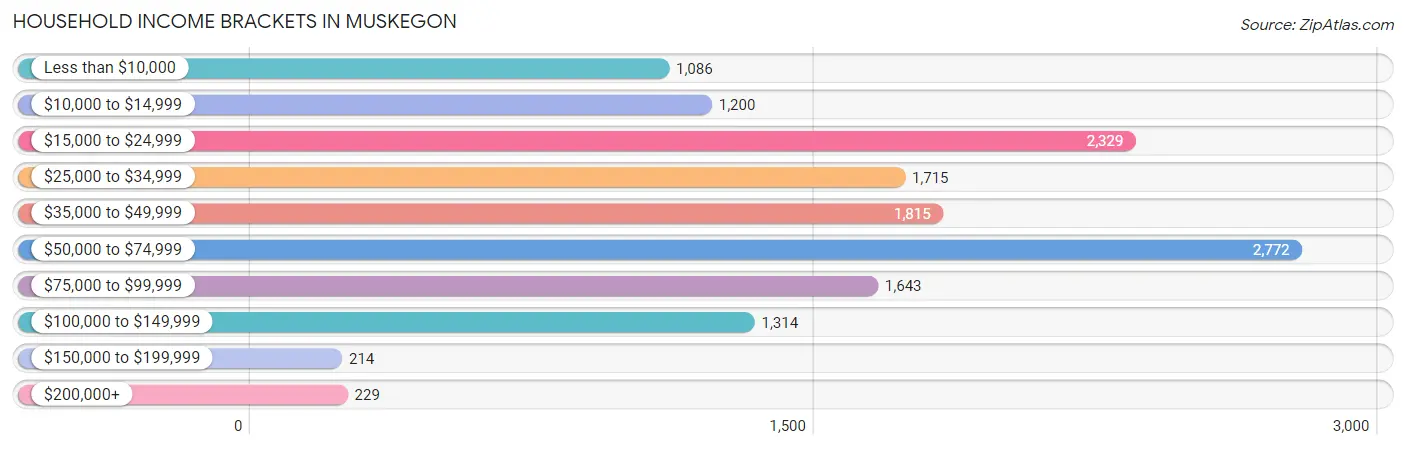
| Income Bracket | # Households | % Households |
| Less than $10,000 | 1,086 | 7.6% |
| $10,000 to $14,999 | 1,200 | 8.4% |
| $15,000 to $24,999 | 2,329 | 16.3% |
| $25,000 to $34,999 | 1,715 | 12.0% |
| $35,000 to $49,999 | 1,815 | 12.7% |
| $50,000 to $74,999 | 2,772 | 19.4% |
| $75,000 to $99,999 | 1,643 | 11.5% |
| $100,000 to $149,999 | 1,314 | 9.2% |
| $150,000 to $199,999 | 214 | 1.5% |
| $200,000+ | 229 | 1.6% |
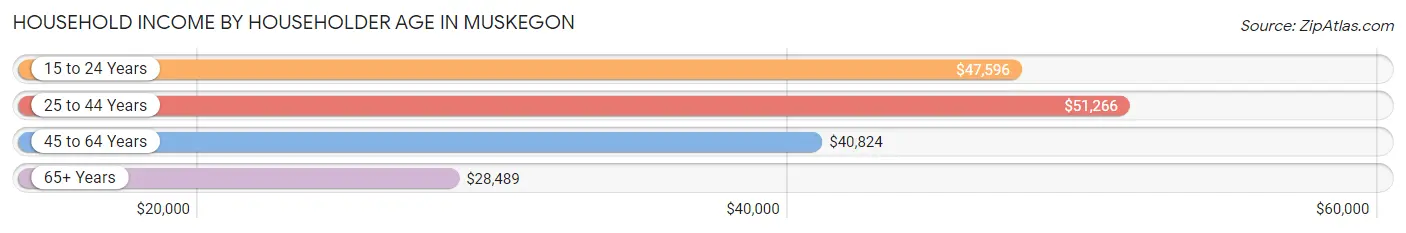
Household Income by Householder Age in Muskegon
The median household income in Muskegon is $40,900, with the highest median household income of $51,266 found in the 25 to 44 years age bracket for the primary householder. A total of 4,560 households (31.9%) fall into this category. Meanwhile, the 65+ years age bracket for the primary householder has the lowest median household income of $28,489, with 3,837 households (26.9%) in this group.
| Income Bracket | # Households | Median Income |
| 15 to 24 Years | 1,072 (7.5%) | $47,596 |
| 25 to 44 Years | 4,560 (31.9%) | $51,266 |
| 45 to 64 Years | 4,819 (33.7%) | $40,824 |
| 65+ Years | 3,837 (26.9%) | $28,489 |
| Total | 14,288 (100.0%) | $40,900 |
Poverty in Muskegon
Income Below Poverty by Sex and Age in Muskegon
With 22.5% poverty level for males and 23.2% for females among the residents of Muskegon, 15 year old males and under 5 year old females are the most vulnerable to poverty, with 110 males (43.5%) and 567 females (45.1%) in their respective age groups living below the poverty level.
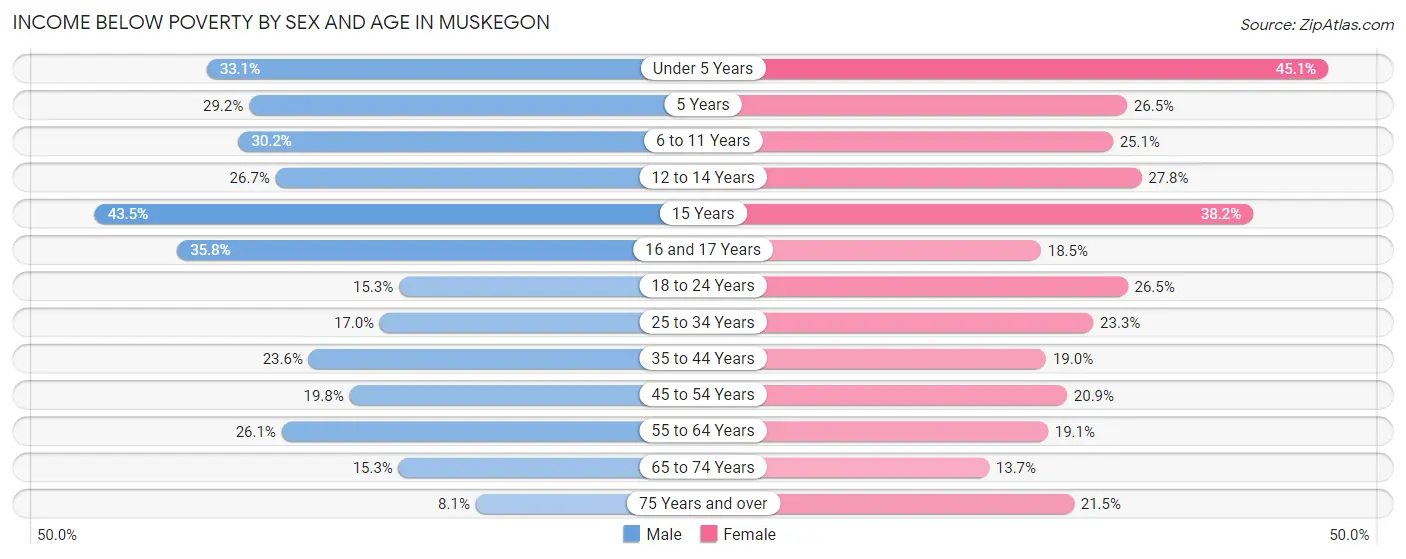
| Age Bracket | Male | Female |
| Under 5 Years | 410 (33.1%) | 567 (45.1%) |
| 5 Years | 63 (29.2%) | 86 (26.5%) |
| 6 to 11 Years | 313 (30.1%) | 358 (25.1%) |
| 12 to 14 Years | 247 (26.7%) | 124 (27.8%) |
| 15 Years | 110 (43.5%) | 116 (38.2%) |
| 16 and 17 Years | 115 (35.8%) | 82 (18.5%) |
| 18 to 24 Years | 204 (15.2%) | 437 (26.5%) |
| 25 to 34 Years | 428 (17.0%) | 607 (23.3%) |
| 35 to 44 Years | 487 (23.6%) | 403 (19.0%) |
| 45 to 54 Years | 326 (19.8%) | 384 (20.9%) |
| 55 to 64 Years | 552 (26.1%) | 416 (19.1%) |
| 65 to 74 Years | 194 (15.3%) | 247 (13.7%) |
| 75 Years and over | 54 (8.1%) | 275 (21.5%) |
| Total | 3,503 (22.5%) | 4,102 (23.2%) |
Income Above Poverty by Sex and Age in Muskegon
According to the poverty statistics in Muskegon, males aged 75 years and over and females aged 65 to 74 years are the age groups that are most secure financially, with 91.9% of males and 86.4% of females in these age groups living above the poverty line.
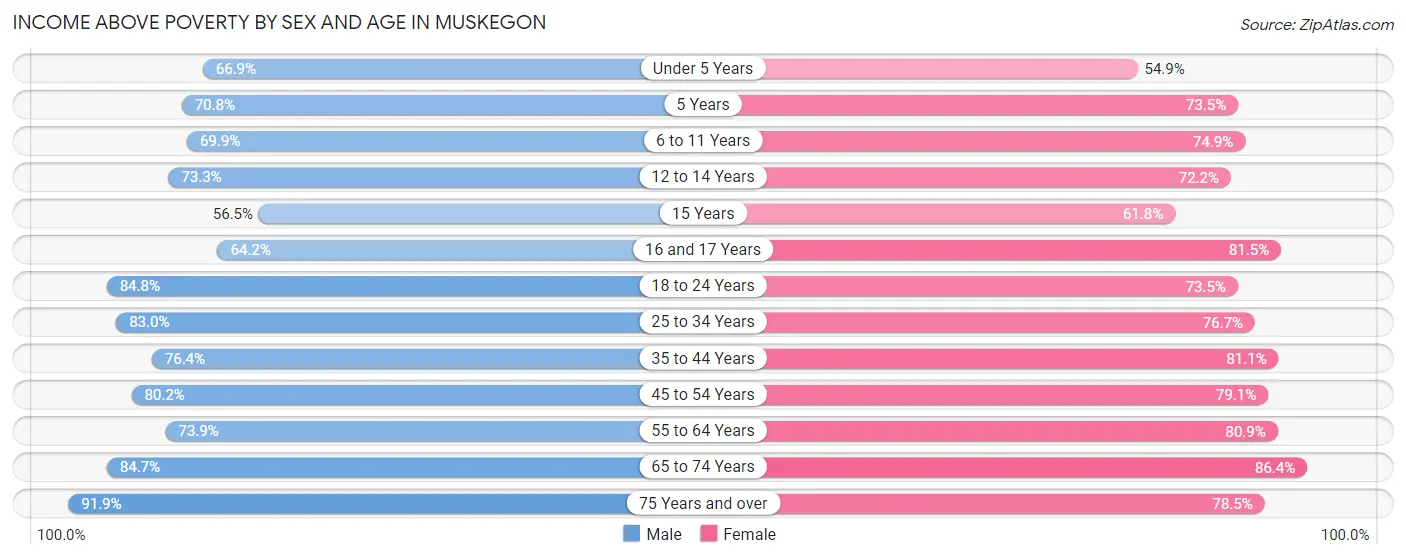
| Age Bracket | Male | Female |
| Under 5 Years | 829 (66.9%) | 690 (54.9%) |
| 5 Years | 153 (70.8%) | 239 (73.5%) |
| 6 to 11 Years | 725 (69.9%) | 1,066 (74.9%) |
| 12 to 14 Years | 678 (73.3%) | 322 (72.2%) |
| 15 Years | 143 (56.5%) | 188 (61.8%) |
| 16 and 17 Years | 206 (64.2%) | 362 (81.5%) |
| 18 to 24 Years | 1,134 (84.8%) | 1,211 (73.5%) |
| 25 to 34 Years | 2,087 (83.0%) | 1,995 (76.7%) |
| 35 to 44 Years | 1,574 (76.4%) | 1,724 (81.0%) |
| 45 to 54 Years | 1,317 (80.2%) | 1,454 (79.1%) |
| 55 to 64 Years | 1,560 (73.9%) | 1,760 (80.9%) |
| 65 to 74 Years | 1,076 (84.7%) | 1,563 (86.4%) |
| 75 Years and over | 610 (91.9%) | 1,002 (78.5%) |
| Total | 12,092 (77.5%) | 13,576 (76.8%) |
Income Below Poverty Among Married-Couple Families in Muskegon
The poverty statistics for married-couple families in Muskegon show that 11.3% or 420 of the total 3,720 families live below the poverty line. Families with 5 or more children have the highest poverty rate of 35.9%, comprising of 23 families. On the other hand, families with no children have the lowest poverty rate of 8.2%, which includes 180 families.
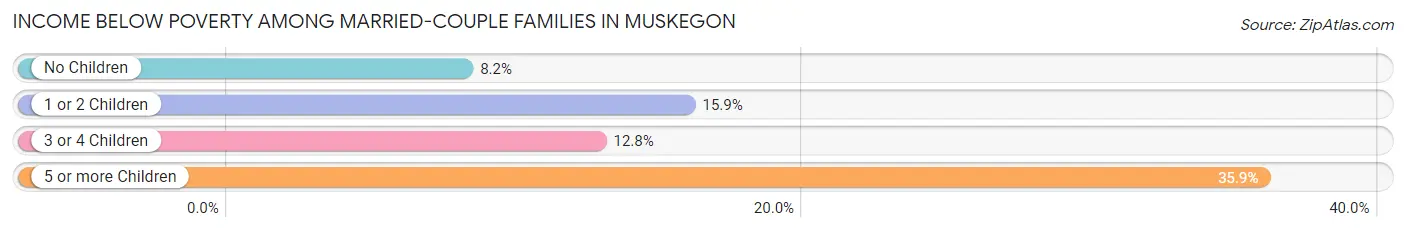
| Children | Above Poverty | Below Poverty |
| No Children | 2,018 (91.8%) | 180 (8.2%) |
| 1 or 2 Children | 813 (84.1%) | 154 (15.9%) |
| 3 or 4 Children | 428 (87.2%) | 63 (12.8%) |
| 5 or more Children | 41 (64.1%) | 23 (35.9%) |
| Total | 3,300 (88.7%) | 420 (11.3%) |
Income Below Poverty Among Single-Parent Households in Muskegon
According to the poverty data in Muskegon, 6.6% or 51 single-father households and 33.0% or 970 single-mother households are living below the poverty line. Among single-father households, those with no children have the highest poverty rate, with 39 households (10.6%) experiencing poverty. Likewise, among single-mother households, those with 5 or more children have the highest poverty rate, with 38 households (100.0%) falling below the poverty line.
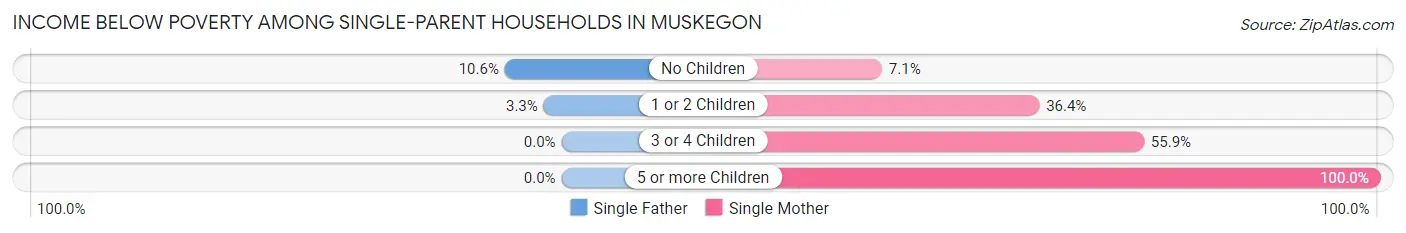
| Children | Single Father | Single Mother |
| No Children | 39 (10.6%) | 49 (7.1%) |
| 1 or 2 Children | 12 (3.3%) | 661 (36.4%) |
| 3 or 4 Children | 0 (0.0%) | 222 (55.9%) |
| 5 or more Children | 0 (0.0%) | 38 (100.0%) |
| Total | 51 (6.6%) | 970 (33.0%) |
Income Below Poverty Among Married-Couple vs Single-Parent Households in Muskegon
The poverty data for Muskegon shows that 420 of the married-couple family households (11.3%) and 1,021 of the single-parent households (27.5%) are living below the poverty level. Within the married-couple family households, those with 5 or more children have the highest poverty rate, with 23 households (35.9%) falling below the poverty line. Among the single-parent households, those with 5 or more children have the highest poverty rate, with 38 household (100.0%) living below poverty.
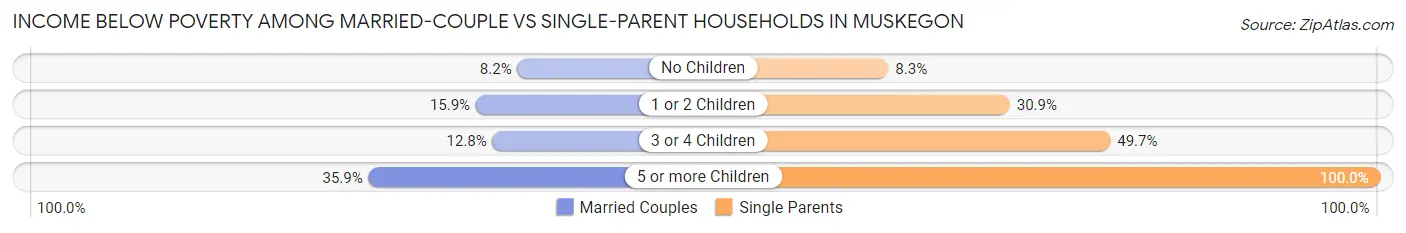
| Children | Married-Couple Families | Single-Parent Households |
| No Children | 180 (8.2%) | 88 (8.3%) |
| 1 or 2 Children | 154 (15.9%) | 673 (30.9%) |
| 3 or 4 Children | 63 (12.8%) | 222 (49.7%) |
| 5 or more Children | 23 (35.9%) | 38 (100.0%) |
| Total | 420 (11.3%) | 1,021 (27.5%) |
Race in Muskegon
The most populous races in Muskegon are White / Caucasian (21,796 | 56.9%), Black / African American (11,842 | 30.9%), and Two or more Races (3,729 | 9.7%).
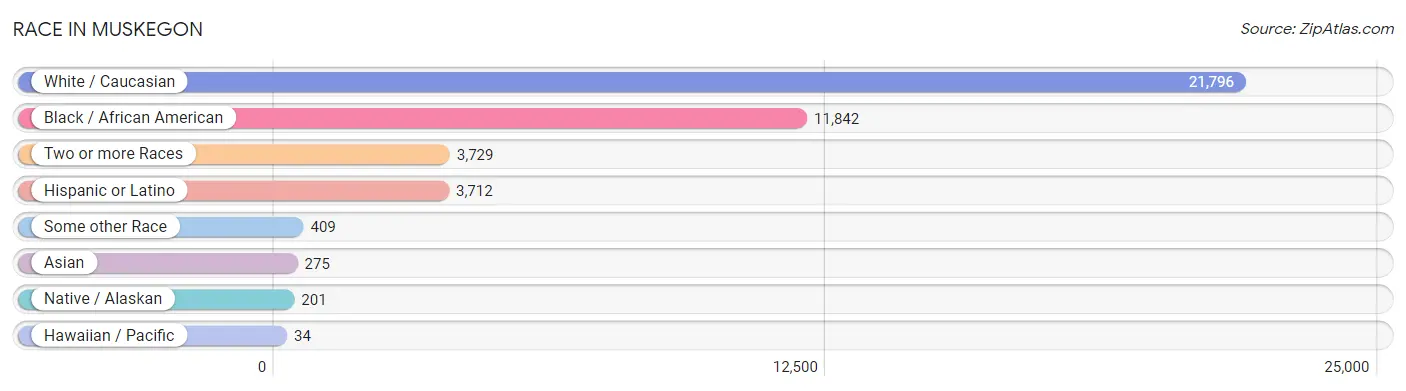
| Race | # Population | % Population |
| Asian | 275 | 0.7% |
| Black / African American | 11,842 | 30.9% |
| Hawaiian / Pacific | 34 | 0.1% |
| Hispanic or Latino | 3,712 | 9.7% |
| Native / Alaskan | 201 | 0.5% |
| White / Caucasian | 21,796 | 56.9% |
| Two or more Races | 3,729 | 9.7% |
| Some other Race | 409 | 1.1% |
| Total | 38,286 | 100.0% |
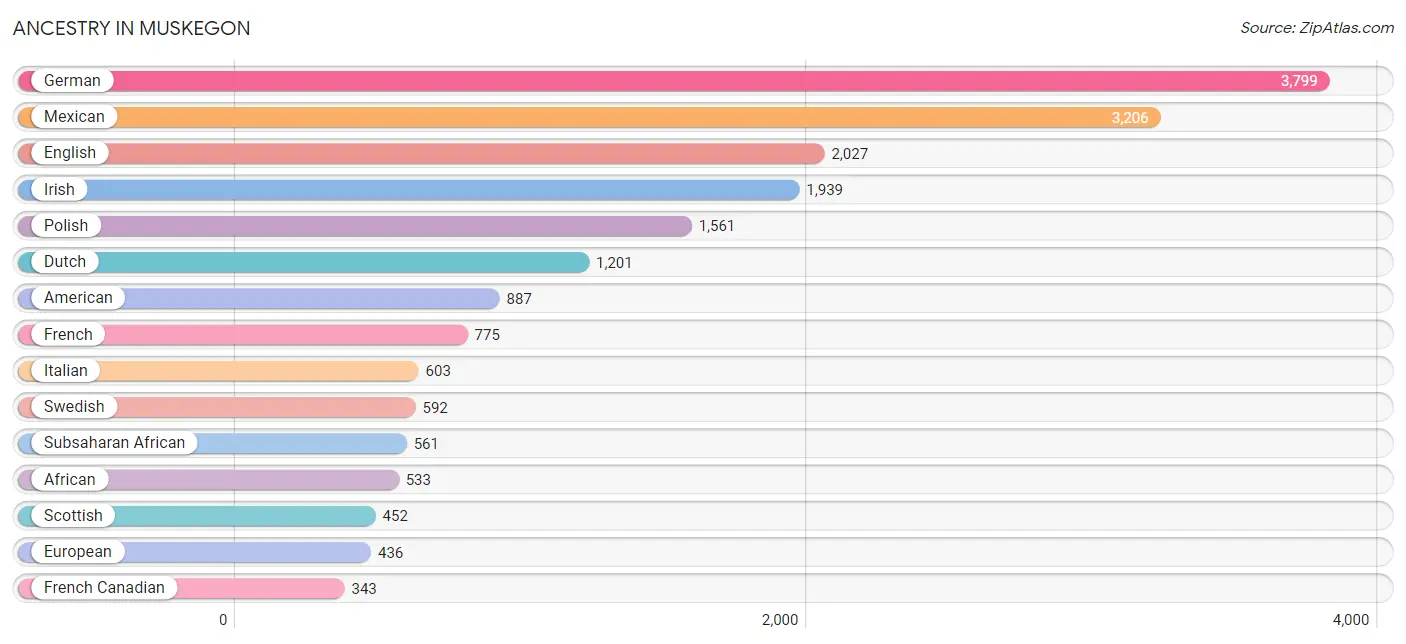
Ancestry in Muskegon
The most populous ancestries reported in Muskegon are German (3,799 | 9.9%), Mexican (3,206 | 8.4%), English (2,027 | 5.3%), Irish (1,939 | 5.1%), and Polish (1,561 | 4.1%), together accounting for 32.7% of all Muskegon residents.
| Ancestry | # Population | % Population |
| African | 533 | 1.4% |
| American | 887 | 2.3% |
| Apache | 12 | 0.0% |
| Arab | 68 | 0.2% |
| Australian | 16 | 0.0% |
| Austrian | 67 | 0.2% |
| Bangladeshi | 4 | 0.0% |
| Basque | 10 | 0.0% |
| Belgian | 36 | 0.1% |
| Bhutanese | 11 | 0.0% |
| Blackfeet | 57 | 0.2% |
| British | 32 | 0.1% |
| Bulgarian | 72 | 0.2% |
| Burmese | 39 | 0.1% |
| Canadian | 5 | 0.0% |
| Celtic | 8 | 0.0% |
| Central American | 235 | 0.6% |
| Cherokee | 50 | 0.1% |
| Chippewa | 93 | 0.2% |
| Colombian | 11 | 0.0% |
| Costa Rican | 54 | 0.1% |
| Cuban | 41 | 0.1% |
| Czech | 243 | 0.6% |
| Czechoslovakian | 58 | 0.2% |
| Danish | 189 | 0.5% |
| Dutch | 1,201 | 3.1% |
| Eastern European | 67 | 0.2% |
| English | 2,027 | 5.3% |
| European | 436 | 1.1% |
| Finnish | 74 | 0.2% |
| French | 775 | 2.0% |
| French Canadian | 343 | 0.9% |
| German | 3,799 | 9.9% |
| Greek | 42 | 0.1% |
| Guamanian / Chamorro | 10 | 0.0% |
| Guatemalan | 46 | 0.1% |
| Honduran | 12 | 0.0% |
| Hungarian | 109 | 0.3% |
| Indian (Asian) | 90 | 0.2% |
| Iranian | 9 | 0.0% |
| Iraqi | 53 | 0.1% |
| Irish | 1,939 | 5.1% |
| Iroquois | 23 | 0.1% |
| Italian | 603 | 1.6% |
| Jamaican | 104 | 0.3% |
| Japanese | 10 | 0.0% |
| Korean | 91 | 0.2% |
| Latvian | 13 | 0.0% |
| Lithuanian | 19 | 0.1% |
| Lumbee | 6 | 0.0% |
| Macedonian | 6 | 0.0% |
| Malaysian | 4 | 0.0% |
| Maltese | 9 | 0.0% |
| Mexican | 3,206 | 8.4% |
| Mexican American Indian | 9 | 0.0% |
| Moroccan | 8 | 0.0% |
| Native Hawaiian | 5 | 0.0% |
| Nicaraguan | 18 | 0.1% |
| Nigerian | 28 | 0.1% |
| Norwegian | 302 | 0.8% |
| Ottawa | 119 | 0.3% |
| Pakistani | 5 | 0.0% |
| Peruvian | 17 | 0.0% |
| Polish | 1,561 | 4.1% |
| Portuguese | 6 | 0.0% |
| Potawatomi | 111 | 0.3% |
| Pueblo | 9 | 0.0% |
| Puerto Rican | 127 | 0.3% |
| Romanian | 3 | 0.0% |
| Russian | 55 | 0.1% |
| Salvadoran | 105 | 0.3% |
| Samoan | 254 | 0.7% |
| Scandinavian | 74 | 0.2% |
| Scotch-Irish | 254 | 0.7% |
| Scottish | 452 | 1.2% |
| Sioux | 5 | 0.0% |
| Slavic | 11 | 0.0% |
| Slovak | 50 | 0.1% |
| Slovene | 30 | 0.1% |
| South American | 28 | 0.1% |
| Spaniard | 10 | 0.0% |
| Sri Lankan | 5 | 0.0% |
| Subsaharan African | 561 | 1.5% |
| Swedish | 592 | 1.5% |
| Swiss | 25 | 0.1% |
| Syrian | 6 | 0.0% |
| Thai | 111 | 0.3% |
| Trinidadian and Tobagonian | 4 | 0.0% |
| Turkish | 4 | 0.0% |
| Welsh | 50 | 0.1% |
| Yugoslavian | 29 | 0.1% | View All 91 Rows |
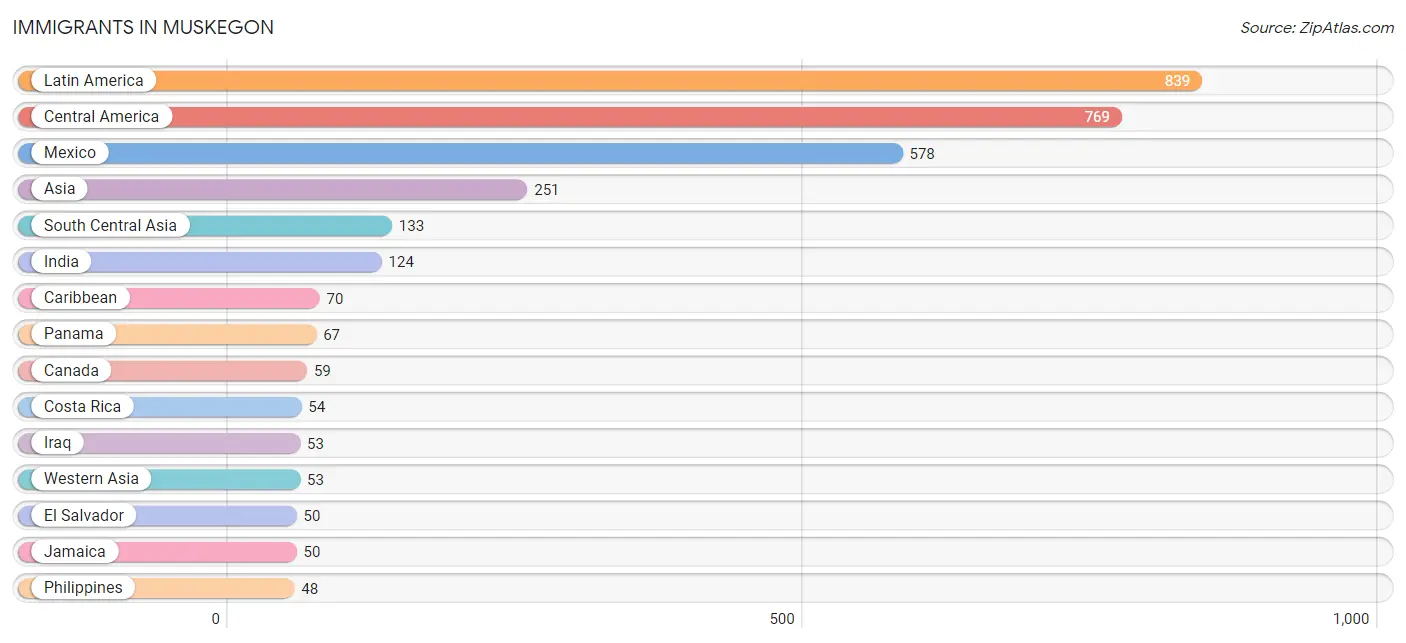
Immigrants in Muskegon
The most numerous immigrant groups reported in Muskegon came from Latin America (839 | 2.2%), Central America (769 | 2.0%), Mexico (578 | 1.5%), Asia (251 | 0.7%), and South Central Asia (133 | 0.4%), together accounting for 6.7% of all Muskegon residents.
| Immigration Origin | # Population | % Population |
| Africa | 24 | 0.1% |
| Asia | 251 | 0.7% |
| Canada | 59 | 0.2% |
| Caribbean | 70 | 0.2% |
| Central America | 769 | 2.0% |
| China | 4 | 0.0% |
| Costa Rica | 54 | 0.1% |
| Czechoslovakia | 13 | 0.0% |
| Eastern Africa | 18 | 0.1% |
| Eastern Asia | 17 | 0.0% |
| Eastern Europe | 13 | 0.0% |
| El Salvador | 50 | 0.1% |
| England | 1 | 0.0% |
| Ethiopia | 15 | 0.0% |
| Europe | 39 | 0.1% |
| Germany | 1 | 0.0% |
| Guatemala | 2 | 0.0% |
| India | 124 | 0.3% |
| Iran | 9 | 0.0% |
| Iraq | 53 | 0.1% |
| Jamaica | 50 | 0.1% |
| Japan | 5 | 0.0% |
| Korea | 8 | 0.0% |
| Latin America | 839 | 2.2% |
| Mexico | 578 | 1.5% |
| Nicaragua | 18 | 0.1% |
| Nigeria | 6 | 0.0% |
| Northern Europe | 25 | 0.1% |
| Oceania | 9 | 0.0% |
| Panama | 67 | 0.2% |
| Philippines | 48 | 0.1% |
| South Central Asia | 133 | 0.4% |
| South Eastern Asia | 48 | 0.1% |
| Sweden | 18 | 0.1% |
| Western Africa | 6 | 0.0% |
| Western Asia | 53 | 0.1% |
| Western Europe | 1 | 0.0% | View All 37 Rows |
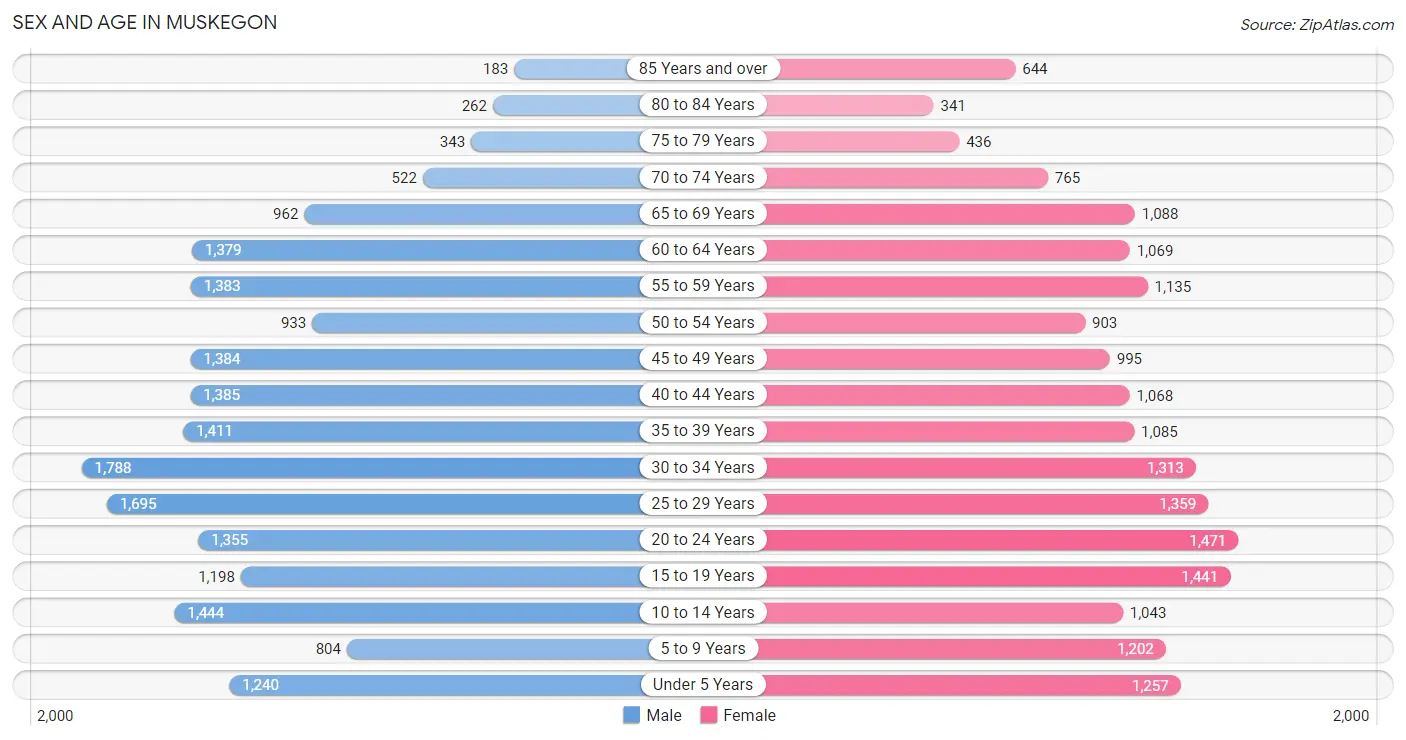
Sex and Age in Muskegon
Sex and Age in Muskegon
The most populous age groups in Muskegon are 30 to 34 Years (1,788 | 9.1%) for men and 20 to 24 Years (1,471 | 7.9%) for women.
| Age Bracket | Male | Female |
| Under 5 Years | 1,240 (6.3%) | 1,257 (6.8%) |
| 5 to 9 Years | 804 (4.1%) | 1,202 (6.5%) |
| 10 to 14 Years | 1,444 (7.3%) | 1,043 (5.6%) |
| 15 to 19 Years | 1,198 (6.1%) | 1,441 (7.7%) |
| 20 to 24 Years | 1,355 (6.9%) | 1,471 (7.9%) |
| 25 to 29 Years | 1,695 (8.6%) | 1,359 (7.3%) |
| 30 to 34 Years | 1,788 (9.1%) | 1,313 (7.0%) |
| 35 to 39 Years | 1,411 (7.2%) | 1,085 (5.8%) |
| 40 to 44 Years | 1,385 (7.0%) | 1,068 (5.7%) |
| 45 to 49 Years | 1,384 (7.0%) | 995 (5.3%) |
| 50 to 54 Years | 933 (4.7%) | 903 (4.9%) |
| 55 to 59 Years | 1,383 (7.0%) | 1,135 (6.1%) |
| 60 to 64 Years | 1,379 (7.0%) | 1,069 (5.7%) |
| 65 to 69 Years | 962 (4.9%) | 1,088 (5.8%) |
| 70 to 74 Years | 522 (2.6%) | 765 (4.1%) |
| 75 to 79 Years | 343 (1.7%) | 436 (2.3%) |
| 80 to 84 Years | 262 (1.3%) | 341 (1.8%) |
| 85 Years and over | 183 (0.9%) | 644 (3.5%) |
| Total | 19,671 (100.0%) | 18,615 (100.0%) |
Families and Households in Muskegon
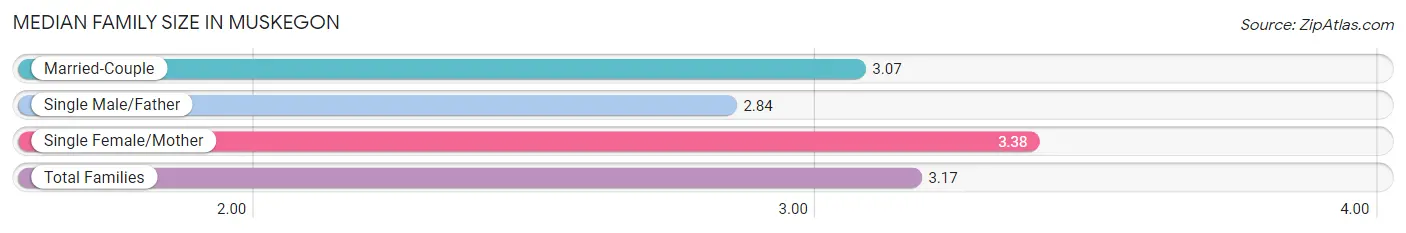
Median Family Size in Muskegon
The median family size in Muskegon is 3.17 persons per family, with single female/mother families (2,938 | 39.5%) accounting for the largest median family size of 3.38 persons per family. On the other hand, single male/father families (779 | 10.5%) represent the smallest median family size with 2.84 persons per family.
| Family Type | # Families | Family Size |
| Married-Couple | 3,720 (50.0%) | 3.07 |
| Single Male/Father | 779 (10.5%) | 2.84 |
| Single Female/Mother | 2,938 (39.5%) | 3.38 |
| Total Families | 7,437 (100.0%) | 3.17 |
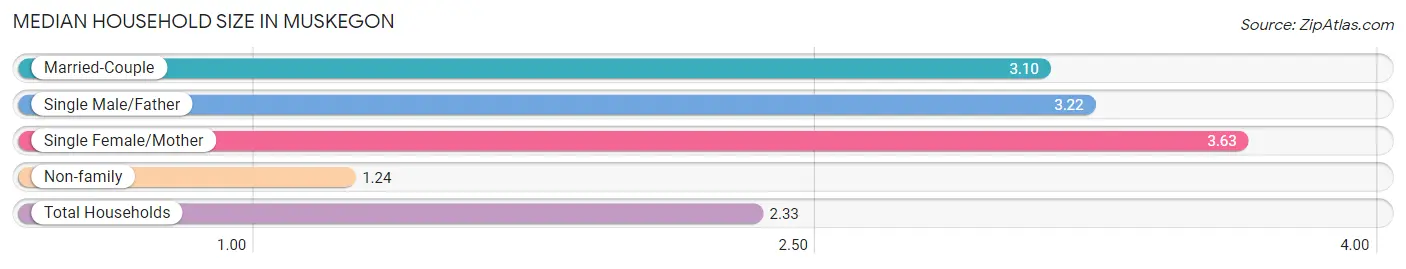
Median Household Size in Muskegon
The median household size in Muskegon is 2.33 persons per household, with single female/mother households (2,938 | 20.6%) accounting for the largest median household size of 3.63 persons per household. non-family households (6,851 | 47.9%) represent the smallest median household size with 1.24 persons per household.
| Household Type | # Households | Household Size |
| Married-Couple | 3,720 (26.0%) | 3.10 |
| Single Male/Father | 779 (5.4%) | 3.22 |
| Single Female/Mother | 2,938 (20.6%) | 3.63 |
| Non-family | 6,851 (47.9%) | 1.24 |
| Total Households | 14,288 (100.0%) | 2.33 |
Household Size by Marriage Status in Muskegon
Out of a total of 14,288 households in Muskegon, 7,437 (52.0%) are family households, while 6,851 (47.9%) are nonfamily households. The most numerous type of family households are 2-person households, comprising 3,219, and the most common type of nonfamily households are 1-person households, comprising 5,503.
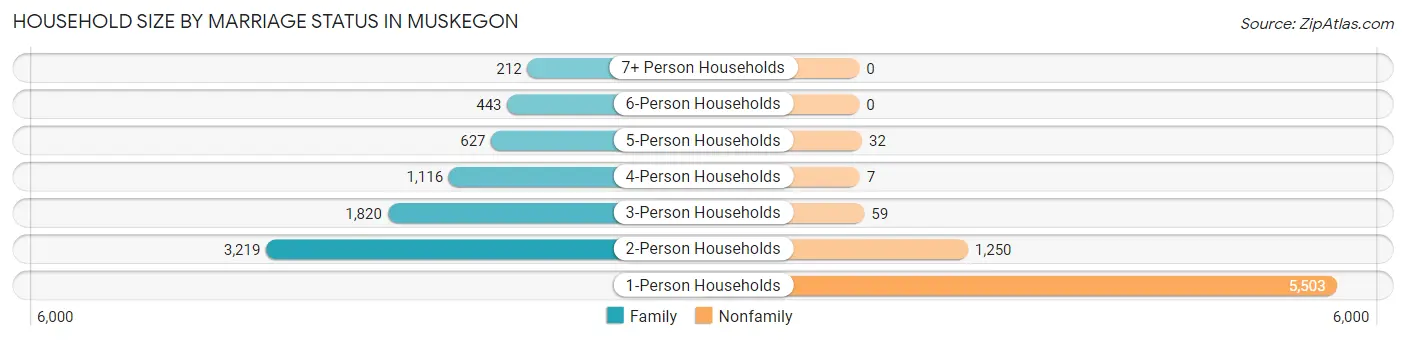
| Household Size | Family Households | Nonfamily Households |
| 1-Person Households | - | 5,503 (38.5%) |
| 2-Person Households | 3,219 (22.5%) | 1,250 (8.7%) |
| 3-Person Households | 1,820 (12.7%) | 59 (0.4%) |
| 4-Person Households | 1,116 (7.8%) | 7 (0.1%) |
| 5-Person Households | 627 (4.4%) | 32 (0.2%) |
| 6-Person Households | 443 (3.1%) | 0 (0.0%) |
| 7+ Person Households | 212 (1.5%) | 0 (0.0%) |
| Total | 7,437 (52.0%) | 6,851 (47.9%) |
Female Fertility in Muskegon
Fertility by Age in Muskegon
Average fertility rate in Muskegon is 64.0 births per 1,000 women. Women in the age bracket of 20 to 34 years have the highest fertility rate with 115.0 births per 1,000 women. Women in the age bracket of 20 to 34 years acount for 84.6% of all women with births.
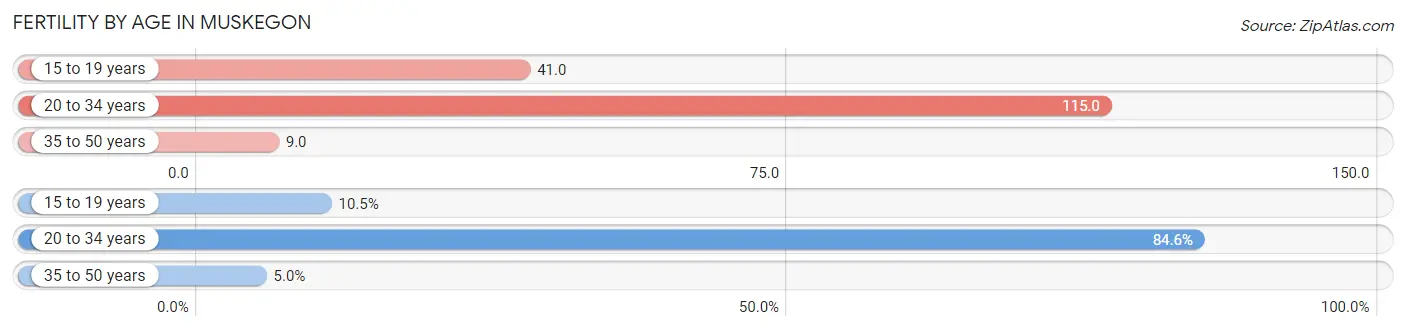
| Age Bracket | Women with Births | Births / 1,000 Women |
| 15 to 19 years | 59 (10.5%) | 41.0 |
| 20 to 34 years | 476 (84.6%) | 115.0 |
| 35 to 50 years | 28 (5.0%) | 9.0 |
| Total | 563 (100.0%) | 64.0 |
Fertility by Age by Marriage Status in Muskegon
29.8% of women with births (563) in Muskegon are married. The highest percentage of unmarried women with births falls into 15 to 19 years age bracket with 100.0% of them unmarried at the time of birth, while the lowest percentage of unmarried women with births belong to 20 to 34 years age bracket with 64.7% of them unmarried.
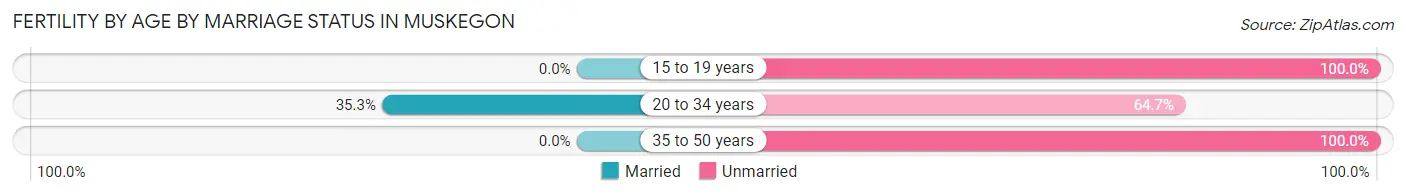
| Age Bracket | Married | Unmarried |
| 15 to 19 years | 0 (0.0%) | 59 (100.0%) |
| 20 to 34 years | 168 (35.3%) | 308 (64.7%) |
| 35 to 50 years | 0 (0.0%) | 28 (100.0%) |
| Total | 168 (29.8%) | 395 (70.2%) |
Fertility by Education in Muskegon
Average fertility rate in Muskegon is 64.0 births per 1,000 women. Women with the education attainment of bachelor's degree have the highest fertility rate of 90.0 births per 1,000 women, while women with the education attainment of high school diploma have the lowest fertility at 41.0 births per 1,000 women. Women with the education attainment of college or associate's degree represent 49.9% of all women with births.
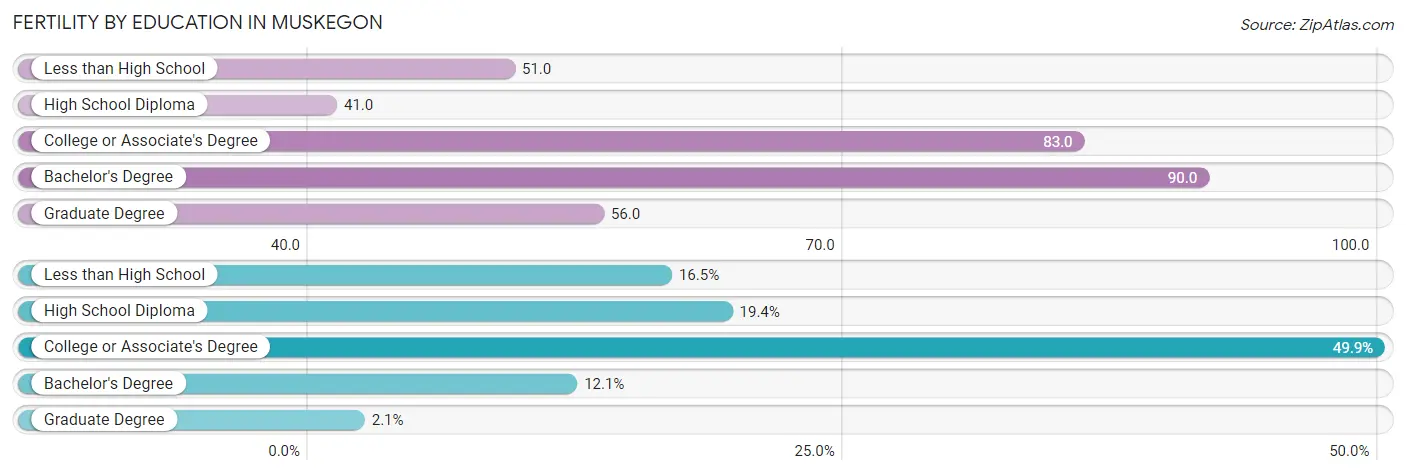
| Educational Attainment | Women with Births | Births / 1,000 Women |
| Less than High School | 93 (16.5%) | 51.0 |
| High School Diploma | 109 (19.4%) | 41.0 |
| College or Associate's Degree | 281 (49.9%) | 83.0 |
| Bachelor's Degree | 68 (12.1%) | 90.0 |
| Graduate Degree | 12 (2.1%) | 56.0 |
| Total | 563 (100.0%) | 64.0 |
Fertility by Education by Marriage Status in Muskegon
70.2% of women with births in Muskegon are unmarried. Women with the educational attainment of bachelor's degree are most likely to be married with 75.0% of them married at childbirth, while women with the educational attainment of graduate degree are least likely to be married with 100.0% of them unmarried at childbirth.
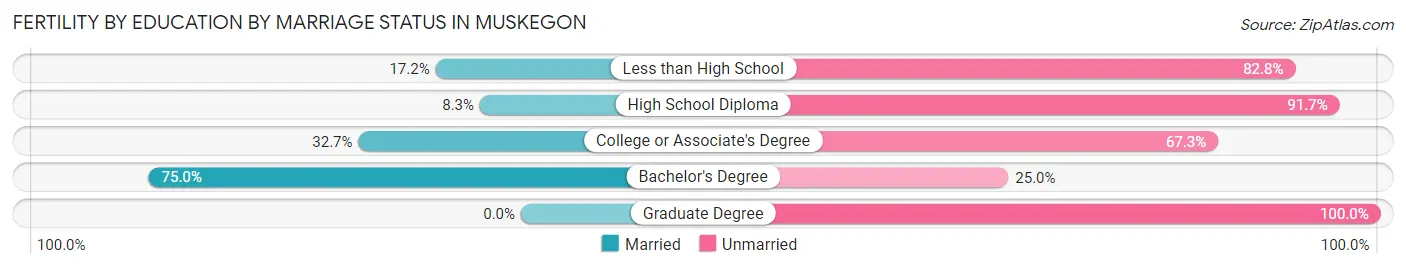
| Educational Attainment | Married | Unmarried |
| Less than High School | 16 (17.2%) | 77 (82.8%) |
| High School Diploma | 9 (8.3%) | 100 (91.7%) |
| College or Associate's Degree | 92 (32.7%) | 189 (67.3%) |
| Bachelor's Degree | 51 (75.0%) | 17 (25.0%) |
| Graduate Degree | 0 (0.0%) | 12 (100.0%) |
| Total | 168 (29.8%) | 395 (70.2%) |
Employment Characteristics in Muskegon
Employment by Class of Employer in Muskegon
Among the 13,691 employed individuals in Muskegon, private company employees (10,257 | 74.9%), not-for-profit organizations (1,213 | 8.9%), and local government employees (835 | 6.1%) make up the most common classes of employment.
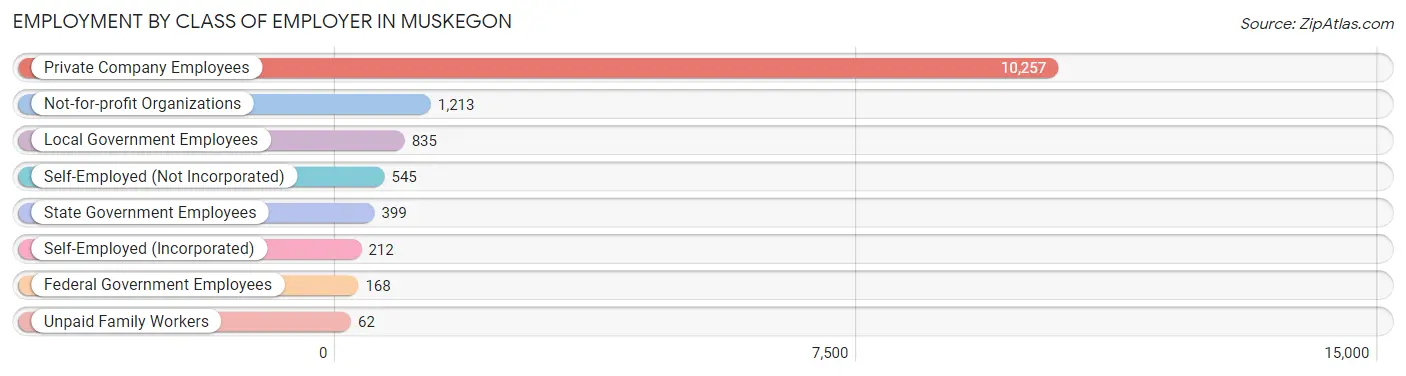
| Employer Class | # Employees | % Employees |
| Private Company Employees | 10,257 | 74.9% |
| Self-Employed (Incorporated) | 212 | 1.5% |
| Self-Employed (Not Incorporated) | 545 | 4.0% |
| Not-for-profit Organizations | 1,213 | 8.9% |
| Local Government Employees | 835 | 6.1% |
| State Government Employees | 399 | 2.9% |
| Federal Government Employees | 168 | 1.2% |
| Unpaid Family Workers | 62 | 0.4% |
| Total | 13,691 | 100.0% |
Employment Status by Age in Muskegon
According to the labor force statistics for Muskegon, out of the total population over 16 years of age (30,739), 52.0% or 15,984 individuals are in the labor force, with 10.4% or 1,662 of them unemployed. The age group with the highest labor force participation rate is 20 to 24 years, with 77.1% or 2,179 individuals in the labor force. Within the labor force, the 20 to 24 years age range has the highest percentage of unemployed individuals, with 14.7% or 320 of them being unemployed.
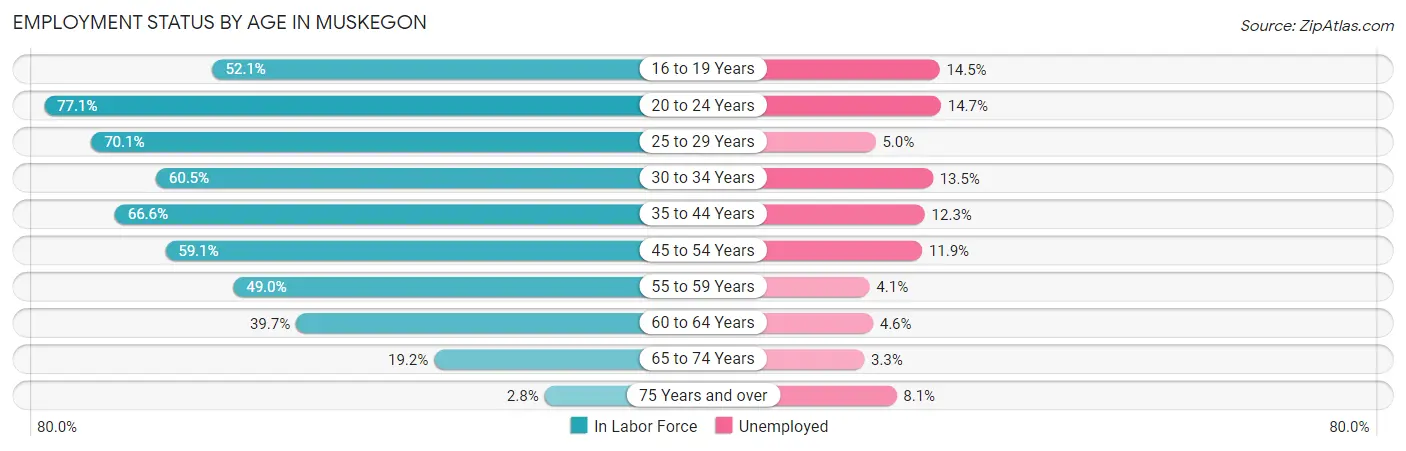
| Age Bracket | In Labor Force | Unemployed |
| 16 to 19 Years | 1,085 (52.1%) | 157 (14.5%) |
| 20 to 24 Years | 2,179 (77.1%) | 320 (14.7%) |
| 25 to 29 Years | 2,141 (70.1%) | 107 (5.0%) |
| 30 to 34 Years | 1,876 (60.5%) | 253 (13.5%) |
| 35 to 44 Years | 3,296 (66.6%) | 405 (12.3%) |
| 45 to 54 Years | 2,491 (59.1%) | 296 (11.9%) |
| 55 to 59 Years | 1,234 (49.0%) | 51 (4.1%) |
| 60 to 64 Years | 972 (39.7%) | 45 (4.6%) |
| 65 to 74 Years | 641 (19.2%) | 21 (3.3%) |
| 75 Years and over | 62 (2.8%) | 5 (8.1%) |
| Total | 15,984 (52.0%) | 1,662 (10.4%) |
Employment Status by Educational Attainment in Muskegon
According to labor force statistics for Muskegon, 59.2% of individuals (12,009) out of the total population between 25 and 64 years of age (20,285) are in the labor force, with 9.6% or 1,153 of them being unemployed. The group with the highest labor force participation rate are those with the educational attainment of bachelor's degree or higher, with 80.1% or 2,086 individuals in the labor force. Within the labor force, individuals with less than high school education have the highest percentage of unemployment, with 17.4% or 187 of them being unemployed.
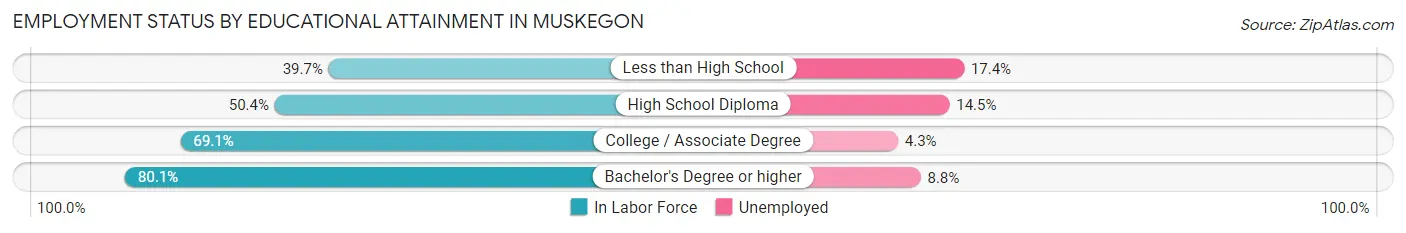
| Educational Attainment | In Labor Force | Unemployed |
| Less than High School | 1,074 (39.7%) | 471 (17.4%) |
| High School Diploma | 4,026 (50.4%) | 1,158 (14.5%) |
| College / Associate Degree | 4,829 (69.1%) | 300 (4.3%) |
| Bachelor's Degree or higher | 2,086 (80.1%) | 229 (8.8%) |
| Total | 12,009 (59.2%) | 1,947 (9.6%) |
Employment Occupations by Sex in Muskegon
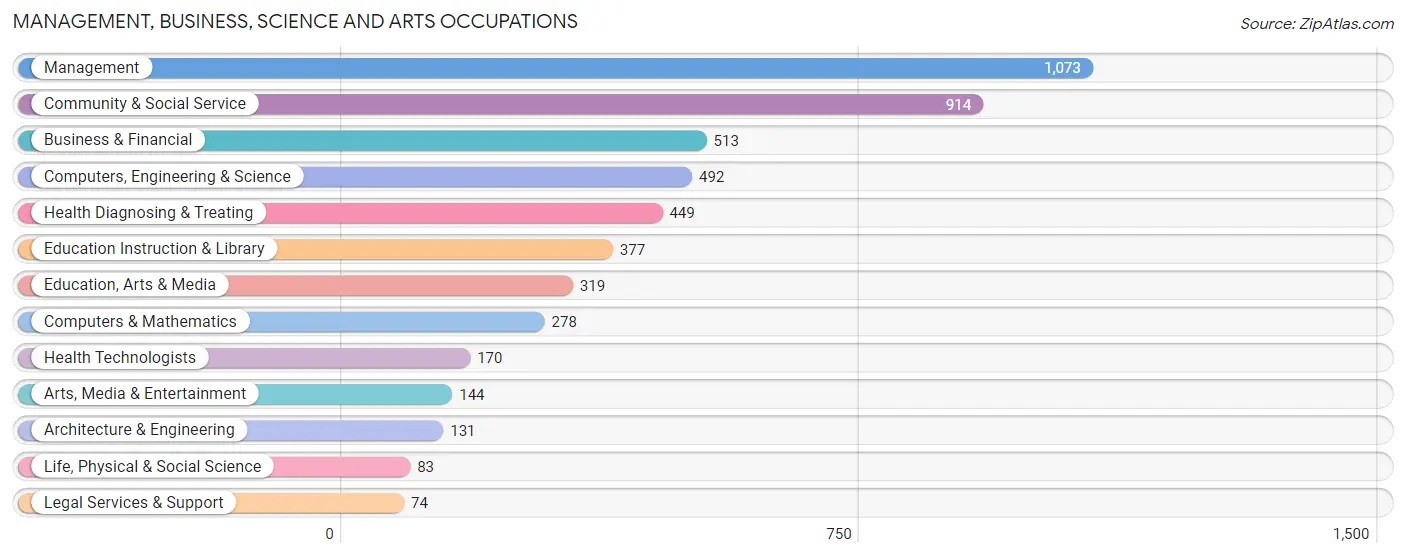
Management, Business, Science and Arts Occupations
The most common Management, Business, Science and Arts occupations in Muskegon are Management (1,073 | 7.5%), Community & Social Service (914 | 6.4%), Business & Financial (513 | 3.6%), Computers, Engineering & Science (492 | 3.4%), and Health Diagnosing & Treating (449 | 3.1%).
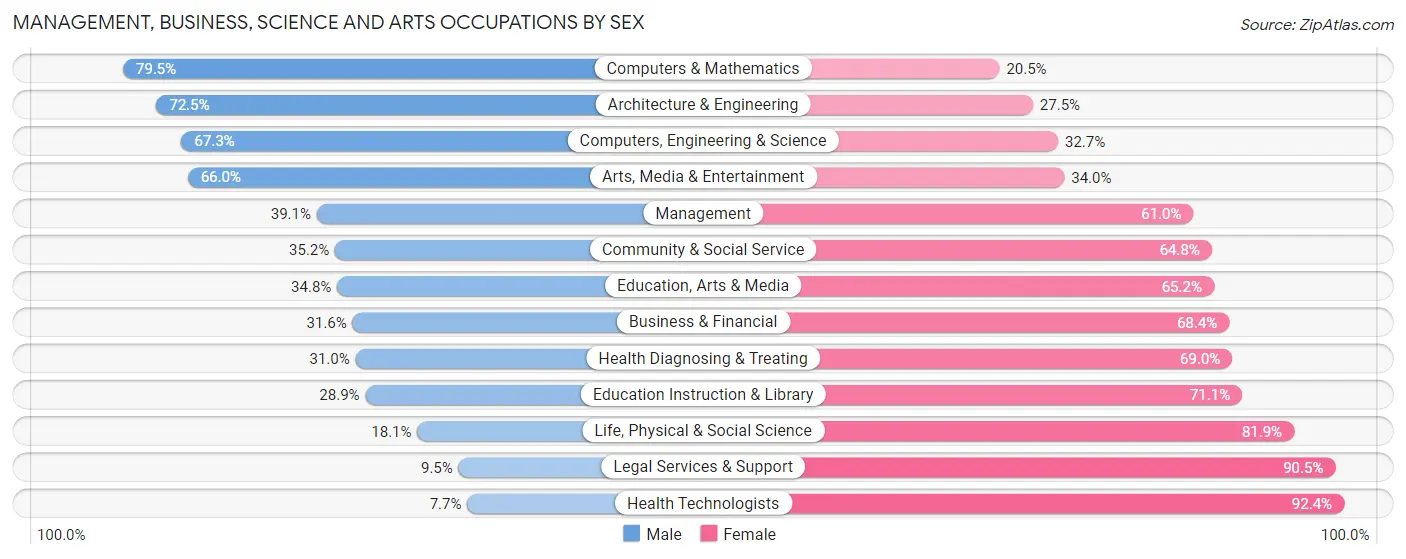
Management, Business, Science and Arts Occupations by Sex
Within the Management, Business, Science and Arts occupations in Muskegon, the most male-oriented occupations are Computers & Mathematics (79.5%), Architecture & Engineering (72.5%), and Computers, Engineering & Science (67.3%), while the most female-oriented occupations are Health Technologists (92.3%), Legal Services & Support (90.5%), and Life, Physical & Social Science (81.9%).
| Occupation | Male | Female |
| Management | 419 (39.1%) | 654 (61.0%) |
| Business & Financial | 162 (31.6%) | 351 (68.4%) |
| Computers, Engineering & Science | 331 (67.3%) | 161 (32.7%) |
| Computers & Mathematics | 221 (79.5%) | 57 (20.5%) |
| Architecture & Engineering | 95 (72.5%) | 36 (27.5%) |
| Life, Physical & Social Science | 15 (18.1%) | 68 (81.9%) |
| Community & Social Service | 322 (35.2%) | 592 (64.8%) |
| Education, Arts & Media | 111 (34.8%) | 208 (65.2%) |
| Legal Services & Support | 7 (9.5%) | 67 (90.5%) |
| Education Instruction & Library | 109 (28.9%) | 268 (71.1%) |
| Arts, Media & Entertainment | 95 (66.0%) | 49 (34.0%) |
| Health Diagnosing & Treating | 139 (31.0%) | 310 (69.0%) |
| Health Technologists | 13 (7.6%) | 157 (92.3%) |
| Total (Category) | 1,373 (39.9%) | 2,068 (60.1%) |
| Total (Overall) | 6,618 (46.2%) | 7,702 (53.8%) |
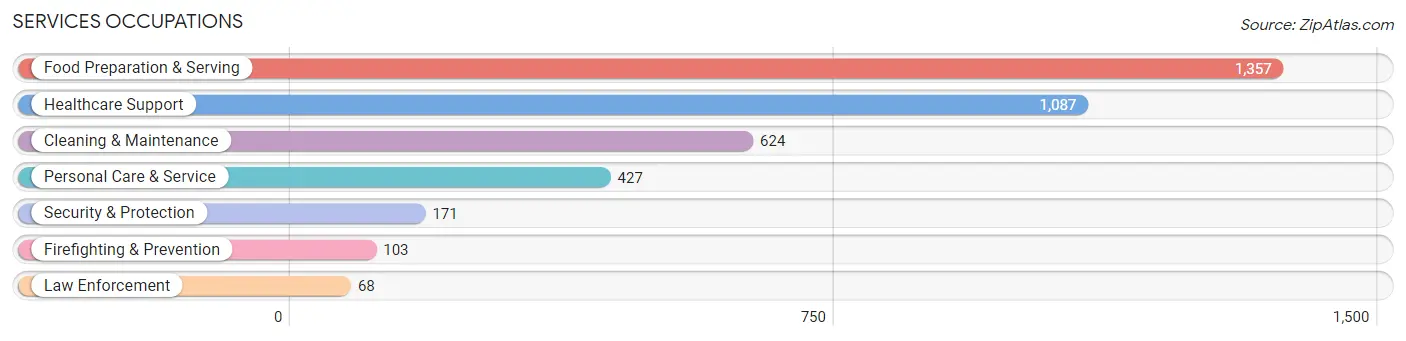
Services Occupations
The most common Services occupations in Muskegon are Food Preparation & Serving (1,357 | 9.5%), Healthcare Support (1,087 | 7.6%), Cleaning & Maintenance (624 | 4.4%), Personal Care & Service (427 | 3.0%), and Security & Protection (171 | 1.2%).
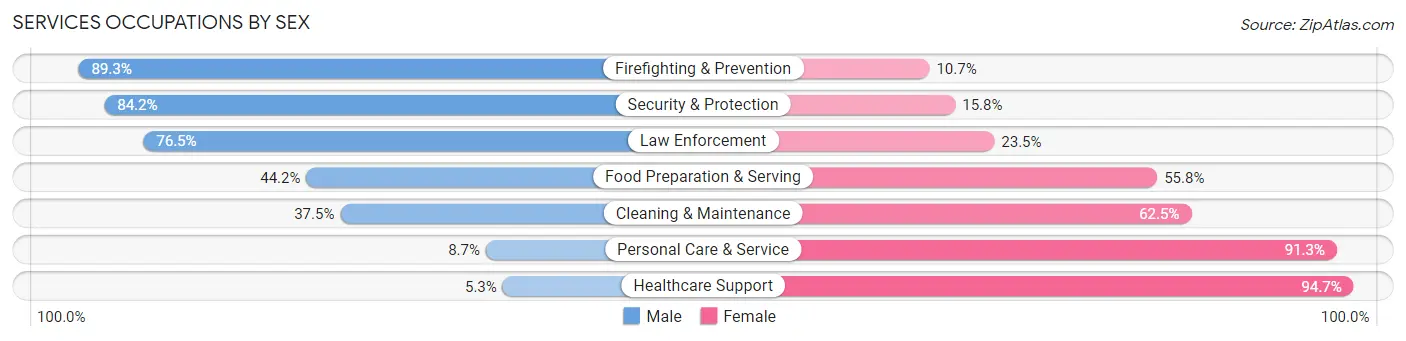
Services Occupations by Sex
Within the Services occupations in Muskegon, the most male-oriented occupations are Firefighting & Prevention (89.3%), Security & Protection (84.2%), and Law Enforcement (76.5%), while the most female-oriented occupations are Healthcare Support (94.7%), Personal Care & Service (91.3%), and Cleaning & Maintenance (62.5%).
| Occupation | Male | Female |
| Healthcare Support | 58 (5.3%) | 1,029 (94.7%) |
| Security & Protection | 144 (84.2%) | 27 (15.8%) |
| Firefighting & Prevention | 92 (89.3%) | 11 (10.7%) |
| Law Enforcement | 52 (76.5%) | 16 (23.5%) |
| Food Preparation & Serving | 600 (44.2%) | 757 (55.8%) |
| Cleaning & Maintenance | 234 (37.5%) | 390 (62.5%) |
| Personal Care & Service | 37 (8.7%) | 390 (91.3%) |
| Total (Category) | 1,073 (29.3%) | 2,593 (70.7%) |
| Total (Overall) | 6,618 (46.2%) | 7,702 (53.8%) |
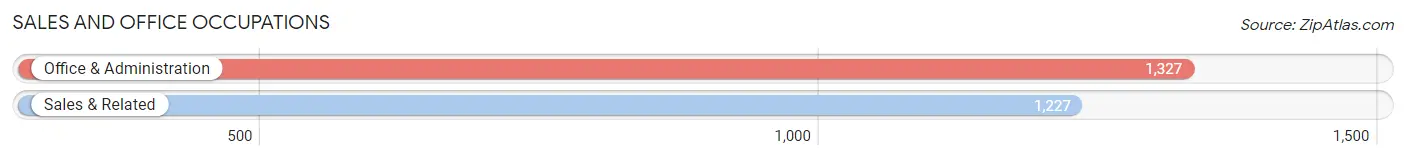
Sales and Office Occupations
The most common Sales and Office occupations in Muskegon are Office & Administration (1,327 | 9.3%), and Sales & Related (1,227 | 8.6%).
Sales and Office Occupations by Sex
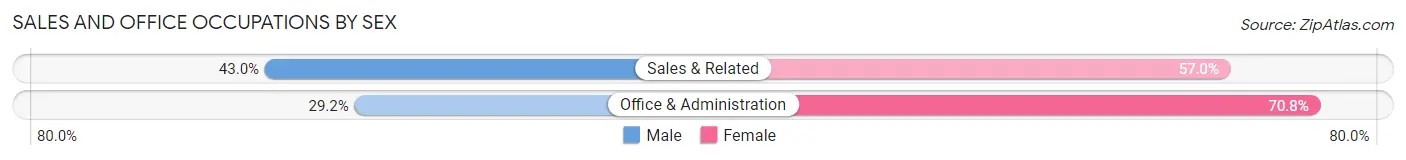
| Occupation | Male | Female |
| Sales & Related | 528 (43.0%) | 699 (57.0%) |
| Office & Administration | 388 (29.2%) | 939 (70.8%) |
| Total (Category) | 916 (35.9%) | 1,638 (64.1%) |
| Total (Overall) | 6,618 (46.2%) | 7,702 (53.8%) |
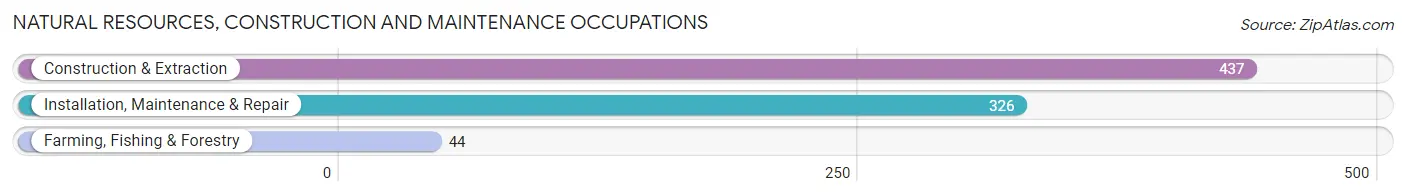
Natural Resources, Construction and Maintenance Occupations
The most common Natural Resources, Construction and Maintenance occupations in Muskegon are Construction & Extraction (437 | 3.0%), Installation, Maintenance & Repair (326 | 2.3%), and Farming, Fishing & Forestry (44 | 0.3%).
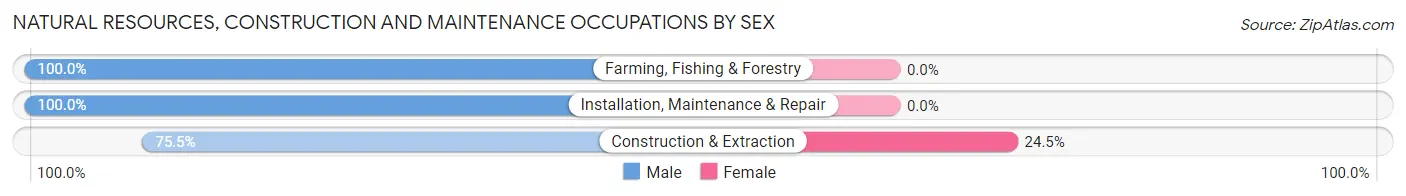
Natural Resources, Construction and Maintenance Occupations by Sex
| Occupation | Male | Female |
| Farming, Fishing & Forestry | 44 (100.0%) | 0 (0.0%) |
| Construction & Extraction | 330 (75.5%) | 107 (24.5%) |
| Installation, Maintenance & Repair | 326 (100.0%) | 0 (0.0%) |
| Total (Category) | 700 (86.7%) | 107 (13.3%) |
| Total (Overall) | 6,618 (46.2%) | 7,702 (53.8%) |
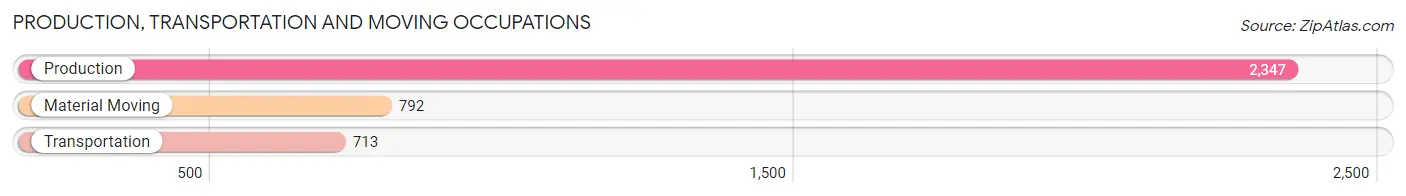
Production, Transportation and Moving Occupations
The most common Production, Transportation and Moving occupations in Muskegon are Production (2,347 | 16.4%), Material Moving (792 | 5.5%), and Transportation (713 | 5.0%).
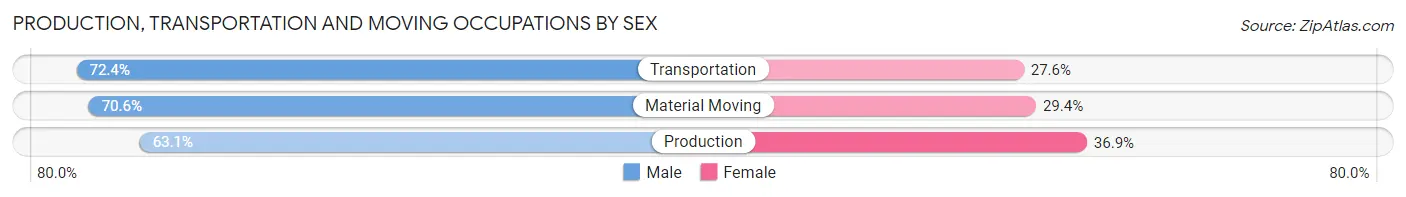
Production, Transportation and Moving Occupations by Sex
| Occupation | Male | Female |
| Production | 1,481 (63.1%) | 866 (36.9%) |
| Transportation | 516 (72.4%) | 197 (27.6%) |
| Material Moving | 559 (70.6%) | 233 (29.4%) |
| Total (Category) | 2,556 (66.4%) | 1,296 (33.6%) |
| Total (Overall) | 6,618 (46.2%) | 7,702 (53.8%) |
Employment Industries by Sex in Muskegon
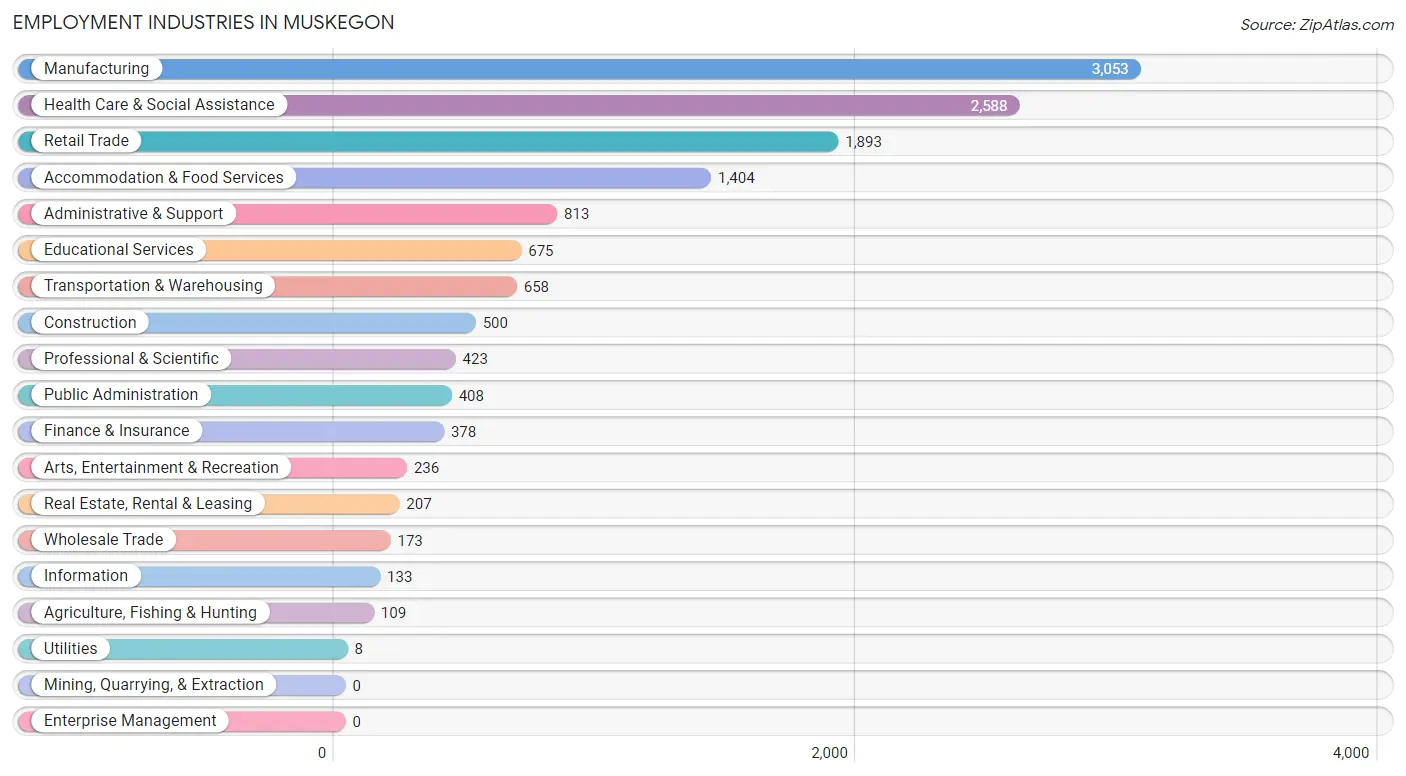
Employment Industries in Muskegon
The major employment industries in Muskegon include Manufacturing (3,053 | 21.3%), Health Care & Social Assistance (2,588 | 18.1%), Retail Trade (1,893 | 13.2%), Accommodation & Food Services (1,404 | 9.8%), and Administrative & Support (813 | 5.7%).
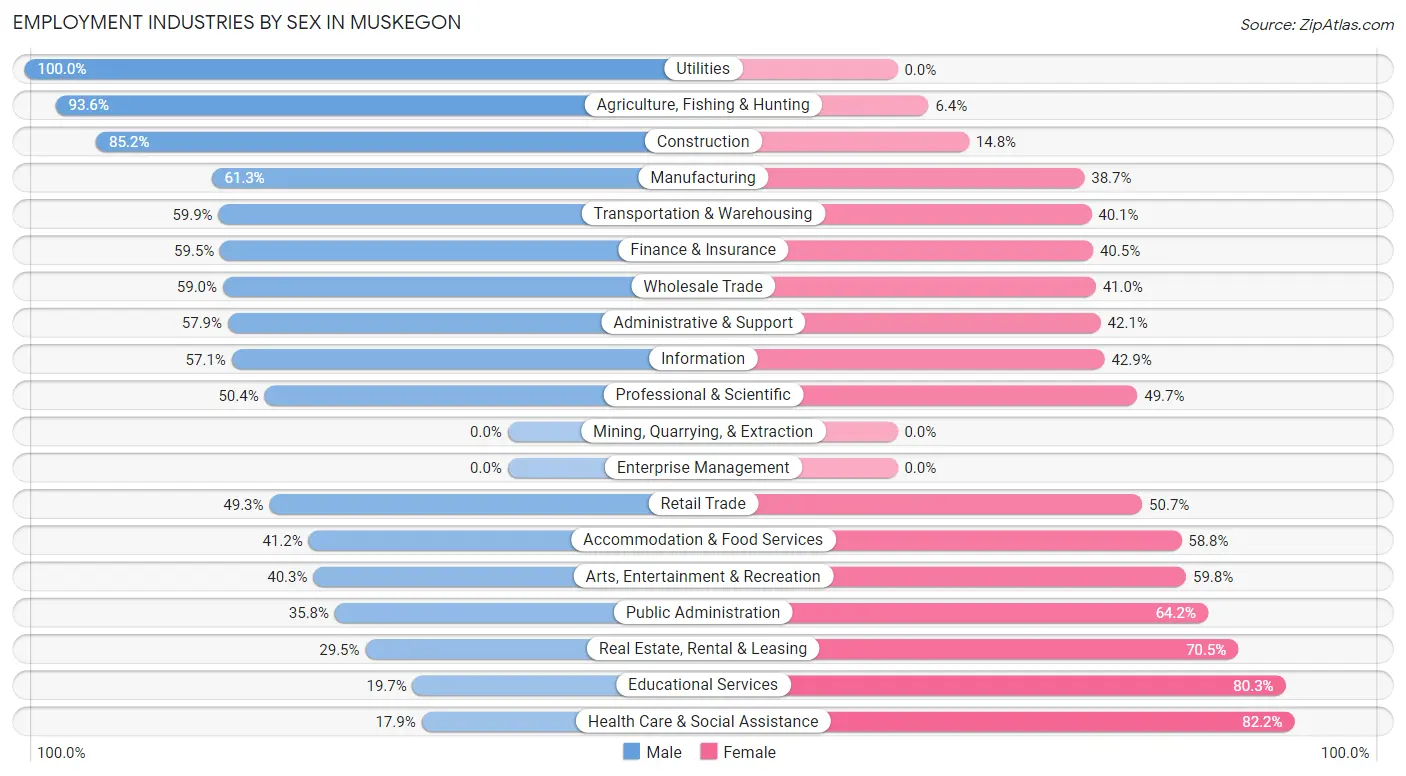
Employment Industries by Sex in Muskegon
The Muskegon industries that see more men than women are Utilities (100.0%), Agriculture, Fishing & Hunting (93.6%), and Construction (85.2%), whereas the industries that tend to have a higher number of women are Health Care & Social Assistance (82.2%), Educational Services (80.3%), and Real Estate, Rental & Leasing (70.5%).
| Industry | Male | Female |
| Agriculture, Fishing & Hunting | 102 (93.6%) | 7 (6.4%) |
| Mining, Quarrying, & Extraction | 0 (0.0%) | 0 (0.0%) |
| Construction | 426 (85.2%) | 74 (14.8%) |
| Manufacturing | 1,872 (61.3%) | 1,181 (38.7%) |
| Wholesale Trade | 102 (59.0%) | 71 (41.0%) |
| Retail Trade | 934 (49.3%) | 959 (50.7%) |
| Transportation & Warehousing | 394 (59.9%) | 264 (40.1%) |
| Utilities | 8 (100.0%) | 0 (0.0%) |
| Information | 76 (57.1%) | 57 (42.9%) |
| Finance & Insurance | 225 (59.5%) | 153 (40.5%) |
| Real Estate, Rental & Leasing | 61 (29.5%) | 146 (70.5%) |
| Professional & Scientific | 213 (50.3%) | 210 (49.6%) |
| Enterprise Management | 0 (0.0%) | 0 (0.0%) |
| Administrative & Support | 471 (57.9%) | 342 (42.1%) |
| Educational Services | 133 (19.7%) | 542 (80.3%) |
| Health Care & Social Assistance | 462 (17.8%) | 2,126 (82.2%) |
| Arts, Entertainment & Recreation | 95 (40.3%) | 141 (59.8%) |
| Accommodation & Food Services | 579 (41.2%) | 825 (58.8%) |
| Public Administration | 146 (35.8%) | 262 (64.2%) |
| Total | 6,618 (46.2%) | 7,702 (53.8%) |
Education in Muskegon
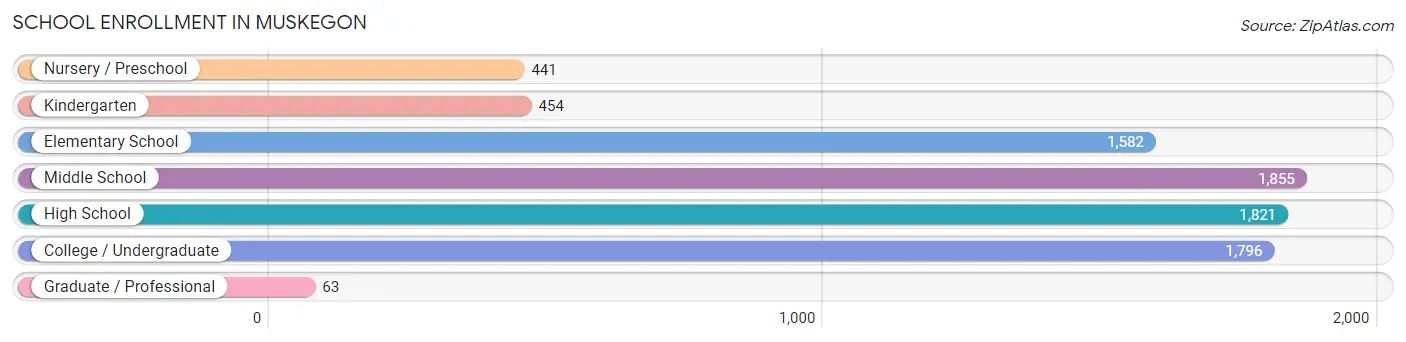
School Enrollment in Muskegon
The most common levels of schooling among the 8,012 students in Muskegon are middle school (1,855 | 23.2%), high school (1,821 | 22.7%), and college / undergraduate (1,796 | 22.4%).
| School Level | # Students | % Students |
| Nursery / Preschool | 441 | 5.5% |
| Kindergarten | 454 | 5.7% |
| Elementary School | 1,582 | 19.8% |
| Middle School | 1,855 | 23.2% |
| High School | 1,821 | 22.7% |
| College / Undergraduate | 1,796 | 22.4% |
| Graduate / Professional | 63 | 0.8% |
| Total | 8,012 | 100.0% |
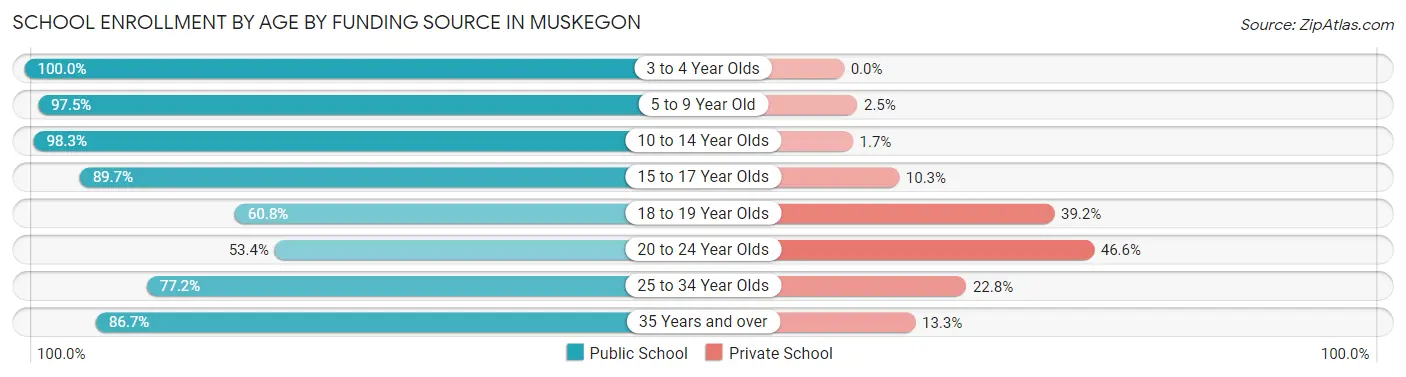
School Enrollment by Age by Funding Source in Muskegon
Out of a total of 8,012 students who are enrolled in schools in Muskegon, 985 (12.3%) attend a private institution, while the remaining 7,027 (87.7%) are enrolled in public schools. The age group of 20 to 24 year olds has the highest likelihood of being enrolled in private schools, with 321 (46.6% in the age bracket) enrolled. Conversely, the age group of 3 to 4 year olds has the lowest likelihood of being enrolled in a private school, with 313 (100.0% in the age bracket) attending a public institution.
| Age Bracket | Public School | Private School |
| 3 to 4 Year Olds | 313 (100.0%) | 0 (0.0%) |
| 5 to 9 Year Old | 1,761 (97.5%) | 45 (2.5%) |
| 10 to 14 Year Olds | 2,373 (98.3%) | 40 (1.7%) |
| 15 to 17 Year Olds | 1,205 (89.7%) | 138 (10.3%) |
| 18 to 19 Year Olds | 531 (60.8%) | 342 (39.2%) |
| 20 to 24 Year Olds | 368 (53.4%) | 321 (46.6%) |
| 25 to 34 Year Olds | 200 (77.2%) | 59 (22.8%) |
| 35 Years and over | 274 (86.7%) | 42 (13.3%) |
| Total | 7,027 (87.7%) | 985 (12.3%) |
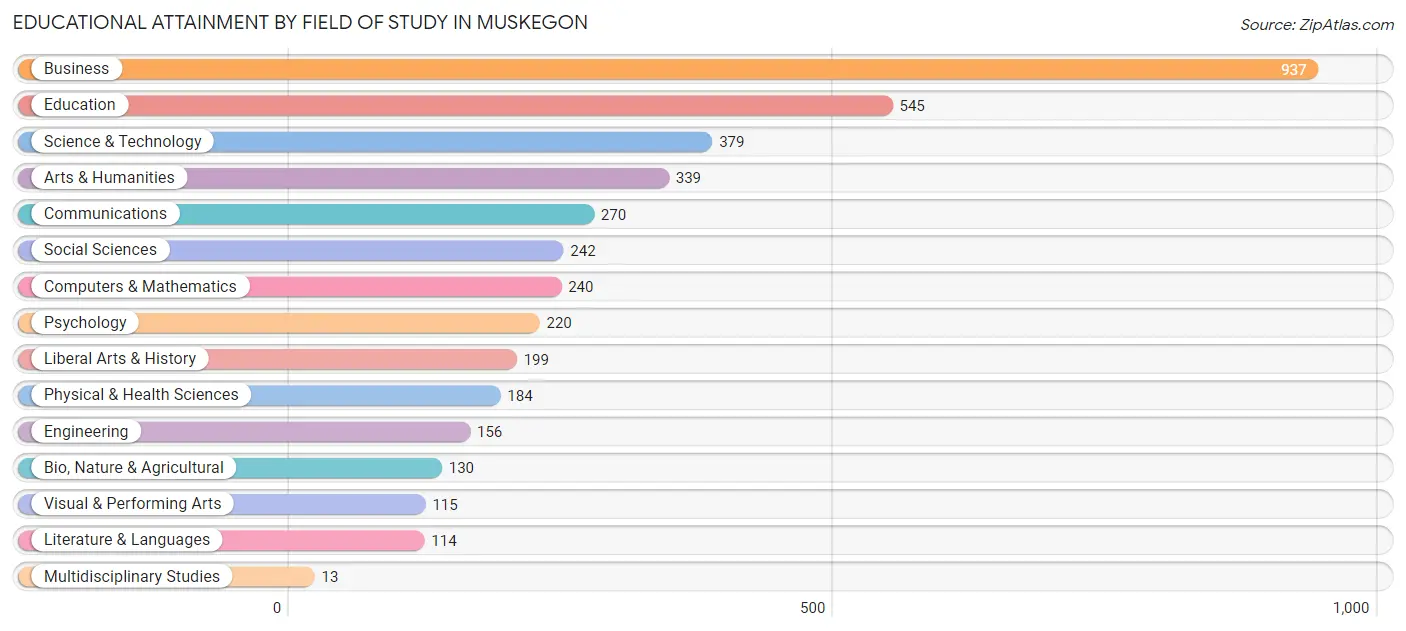
Educational Attainment by Field of Study in Muskegon
Business (937 | 23.0%), education (545 | 13.4%), science & technology (379 | 9.3%), arts & humanities (339 | 8.3%), and communications (270 | 6.6%) are the most common fields of study among 4,083 individuals in Muskegon who have obtained a bachelor's degree or higher.
| Field of Study | # Graduates | % Graduates |
| Computers & Mathematics | 240 | 5.9% |
| Bio, Nature & Agricultural | 130 | 3.2% |
| Physical & Health Sciences | 184 | 4.5% |
| Psychology | 220 | 5.4% |
| Social Sciences | 242 | 5.9% |
| Engineering | 156 | 3.8% |
| Multidisciplinary Studies | 13 | 0.3% |
| Science & Technology | 379 | 9.3% |
| Business | 937 | 23.0% |
| Education | 545 | 13.4% |
| Literature & Languages | 114 | 2.8% |
| Liberal Arts & History | 199 | 4.9% |
| Visual & Performing Arts | 115 | 2.8% |
| Communications | 270 | 6.6% |
| Arts & Humanities | 339 | 8.3% |
| Total | 4,083 | 100.0% |
Transportation & Commute in Muskegon
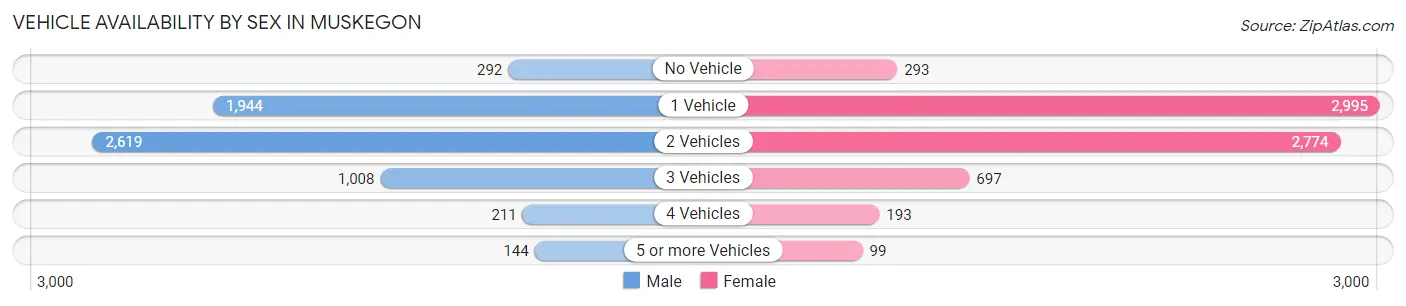
Vehicle Availability by Sex in Muskegon
The most prevalent vehicle ownership categories in Muskegon are males with 2 vehicles (2,619, accounting for 42.1%) and females with 2 vehicles (2,774, making up 37.1%).
| Vehicles Available | Male | Female |
| No Vehicle | 292 (4.7%) | 293 (4.2%) |
| 1 Vehicle | 1,944 (31.3%) | 2,995 (42.5%) |
| 2 Vehicles | 2,619 (42.1%) | 2,774 (39.3%) |
| 3 Vehicles | 1,008 (16.2%) | 697 (9.9%) |
| 4 Vehicles | 211 (3.4%) | 193 (2.7%) |
| 5 or more Vehicles | 144 (2.3%) | 99 (1.4%) |
| Total | 6,218 (100.0%) | 7,051 (100.0%) |
Commute Time in Muskegon
The most frequently occuring commute durations in Muskegon are 15 to 19 minutes (2,926 commuters, 22.3%), 10 to 14 minutes (2,056 commuters, 15.7%), and 20 to 24 minutes (1,949 commuters, 14.8%).
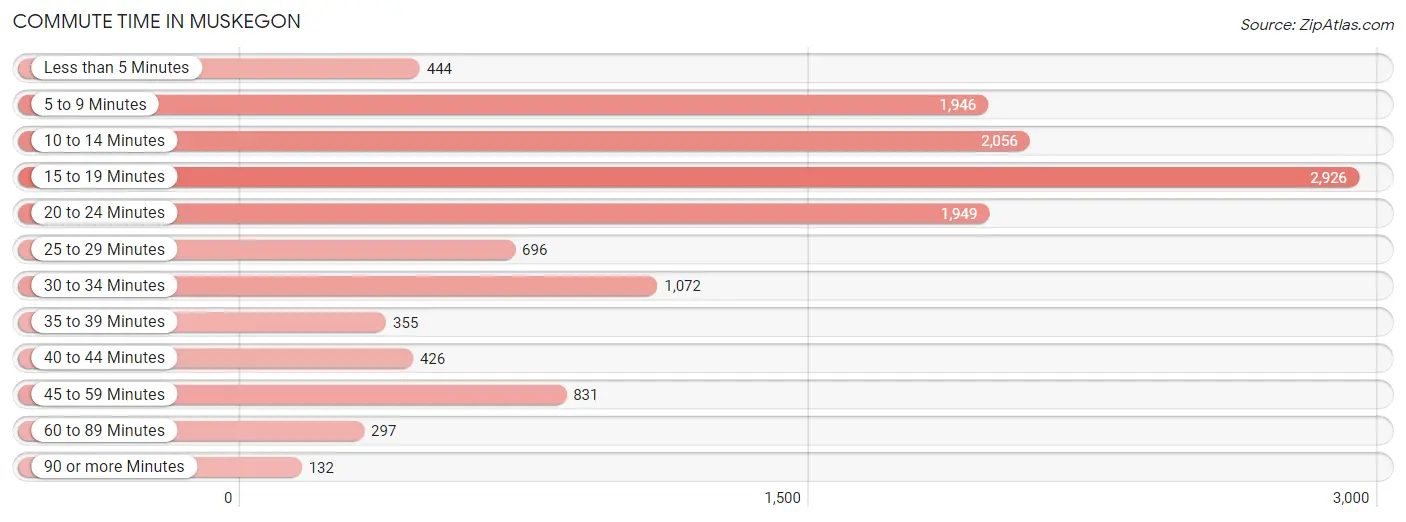
| Commute Time | # Commuters | % Commuters |
| Less than 5 Minutes | 444 | 3.4% |
| 5 to 9 Minutes | 1,946 | 14.8% |
| 10 to 14 Minutes | 2,056 | 15.7% |
| 15 to 19 Minutes | 2,926 | 22.3% |
| 20 to 24 Minutes | 1,949 | 14.8% |
| 25 to 29 Minutes | 696 | 5.3% |
| 30 to 34 Minutes | 1,072 | 8.2% |
| 35 to 39 Minutes | 355 | 2.7% |
| 40 to 44 Minutes | 426 | 3.2% |
| 45 to 59 Minutes | 831 | 6.3% |
| 60 to 89 Minutes | 297 | 2.3% |
| 90 or more Minutes | 132 | 1.0% |
Commute Time by Sex in Muskegon
The most common commute times in Muskegon are 15 to 19 minutes (1,029 commuters, 16.9%) for males and 15 to 19 minutes (1,897 commuters, 26.9%) for females.
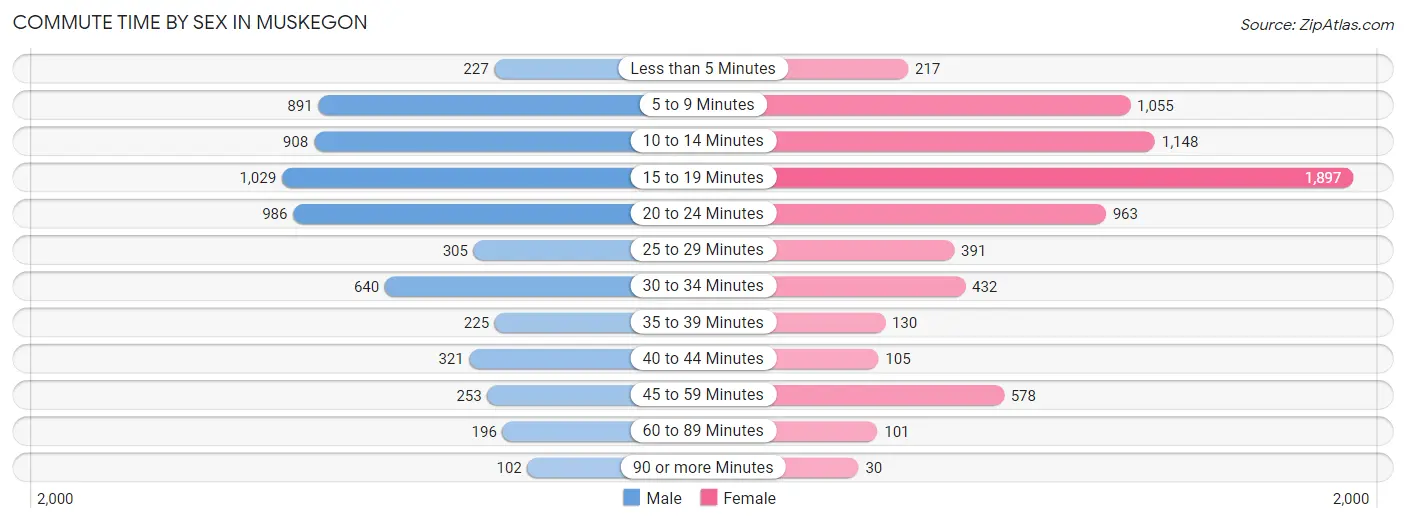
| Commute Time | Male | Female |
| Less than 5 Minutes | 227 (3.7%) | 217 (3.1%) |
| 5 to 9 Minutes | 891 (14.6%) | 1,055 (15.0%) |
| 10 to 14 Minutes | 908 (14.9%) | 1,148 (16.3%) |
| 15 to 19 Minutes | 1,029 (16.9%) | 1,897 (26.9%) |
| 20 to 24 Minutes | 986 (16.2%) | 963 (13.7%) |
| 25 to 29 Minutes | 305 (5.0%) | 391 (5.6%) |
| 30 to 34 Minutes | 640 (10.5%) | 432 (6.1%) |
| 35 to 39 Minutes | 225 (3.7%) | 130 (1.8%) |
| 40 to 44 Minutes | 321 (5.3%) | 105 (1.5%) |
| 45 to 59 Minutes | 253 (4.2%) | 578 (8.2%) |
| 60 to 89 Minutes | 196 (3.2%) | 101 (1.4%) |
| 90 or more Minutes | 102 (1.7%) | 30 (0.4%) |
Time of Departure to Work by Sex in Muskegon
The most frequent times of departure to work in Muskegon are 12:00 PM to 3:59 PM (925, 15.2%) for males and 7:30 AM to 7:59 AM (993, 14.1%) for females.
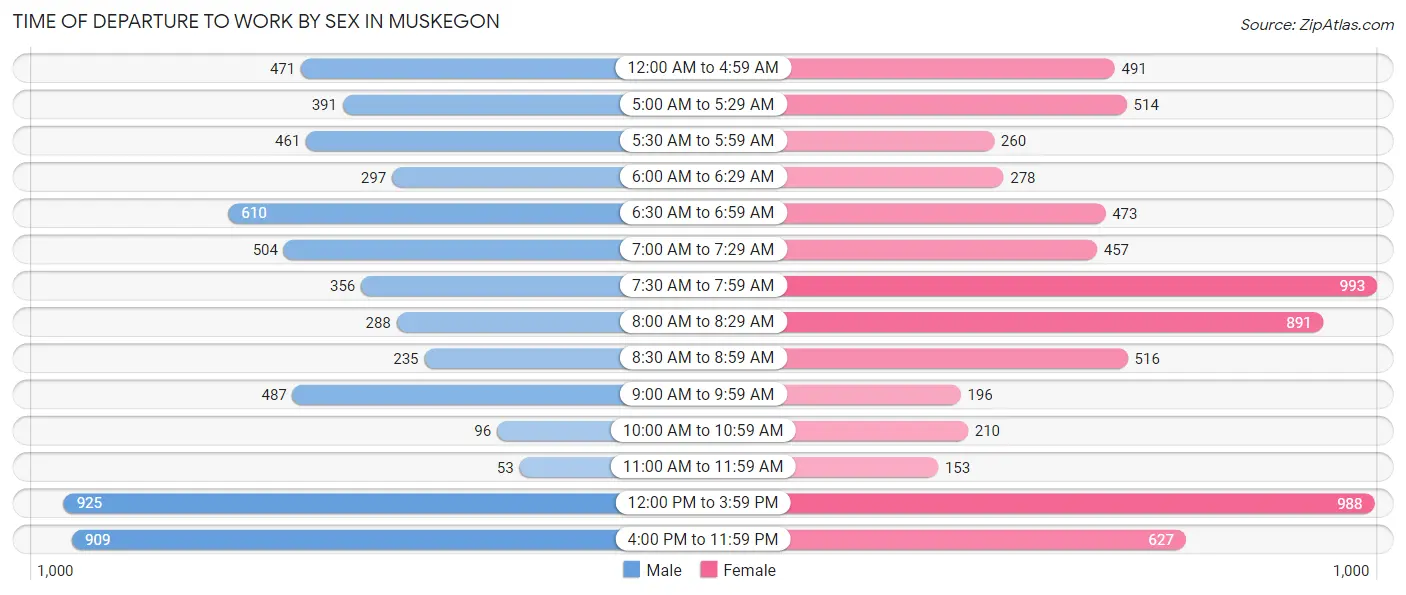
| Time of Departure | Male | Female |
| 12:00 AM to 4:59 AM | 471 (7.7%) | 491 (7.0%) |
| 5:00 AM to 5:29 AM | 391 (6.4%) | 514 (7.3%) |
| 5:30 AM to 5:59 AM | 461 (7.6%) | 260 (3.7%) |
| 6:00 AM to 6:29 AM | 297 (4.9%) | 278 (3.9%) |
| 6:30 AM to 6:59 AM | 610 (10.0%) | 473 (6.7%) |
| 7:00 AM to 7:29 AM | 504 (8.3%) | 457 (6.5%) |
| 7:30 AM to 7:59 AM | 356 (5.9%) | 993 (14.1%) |
| 8:00 AM to 8:29 AM | 288 (4.7%) | 891 (12.6%) |
| 8:30 AM to 8:59 AM | 235 (3.9%) | 516 (7.3%) |
| 9:00 AM to 9:59 AM | 487 (8.0%) | 196 (2.8%) |
| 10:00 AM to 10:59 AM | 96 (1.6%) | 210 (3.0%) |
| 11:00 AM to 11:59 AM | 53 (0.9%) | 153 (2.2%) |
| 12:00 PM to 3:59 PM | 925 (15.2%) | 988 (14.0%) |
| 4:00 PM to 11:59 PM | 909 (14.9%) | 627 (8.9%) |
| Total | 6,083 (100.0%) | 7,047 (100.0%) |
Housing Occupancy in Muskegon
Occupancy by Ownership in Muskegon
Of the total 14,288 dwellings in Muskegon, owner-occupied units account for 7,587 (53.1%), while renter-occupied units make up 6,701 (46.9%).
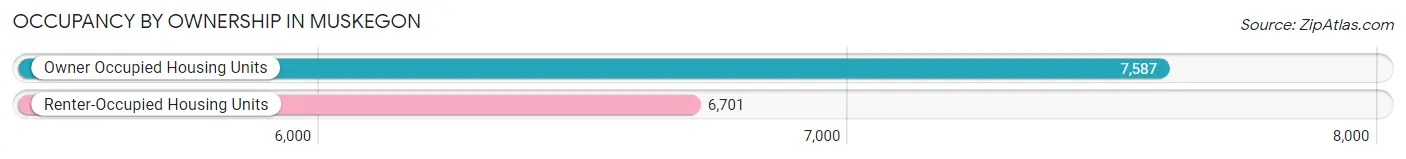
| Occupancy | # Housing Units | % Housing Units |
| Owner Occupied Housing Units | 7,587 | 53.1% |
| Renter-Occupied Housing Units | 6,701 | 46.9% |
| Total Occupied Housing Units | 14,288 | 100.0% |
Occupancy by Household Size in Muskegon
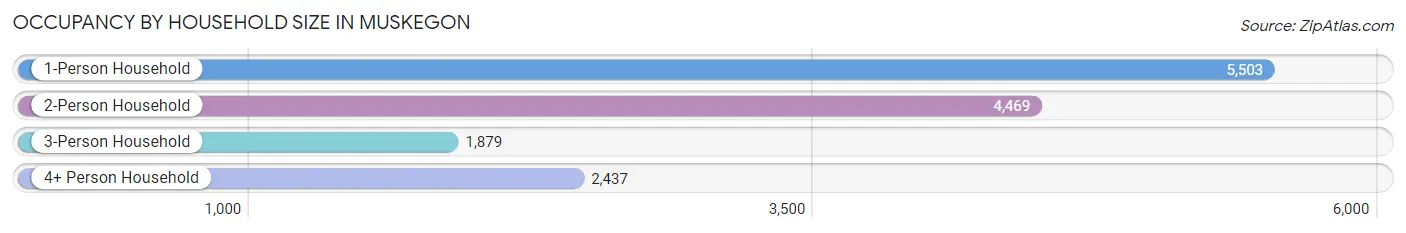
| Household Size | # Housing Units | % Housing Units |
| 1-Person Household | 5,503 | 38.5% |
| 2-Person Household | 4,469 | 31.3% |
| 3-Person Household | 1,879 | 13.2% |
| 4+ Person Household | 2,437 | 17.1% |
| Total Housing Units | 14,288 | 100.0% |
Occupancy by Ownership by Household Size in Muskegon
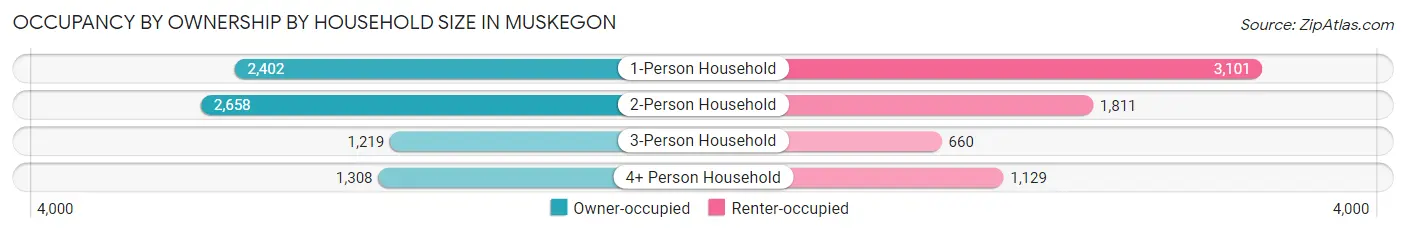
| Household Size | Owner-occupied | Renter-occupied |
| 1-Person Household | 2,402 (43.6%) | 3,101 (56.4%) |
| 2-Person Household | 2,658 (59.5%) | 1,811 (40.5%) |
| 3-Person Household | 1,219 (64.9%) | 660 (35.1%) |
| 4+ Person Household | 1,308 (53.7%) | 1,129 (46.3%) |
| Total Housing Units | 7,587 (53.1%) | 6,701 (46.9%) |
Occupancy by Educational Attainment in Muskegon
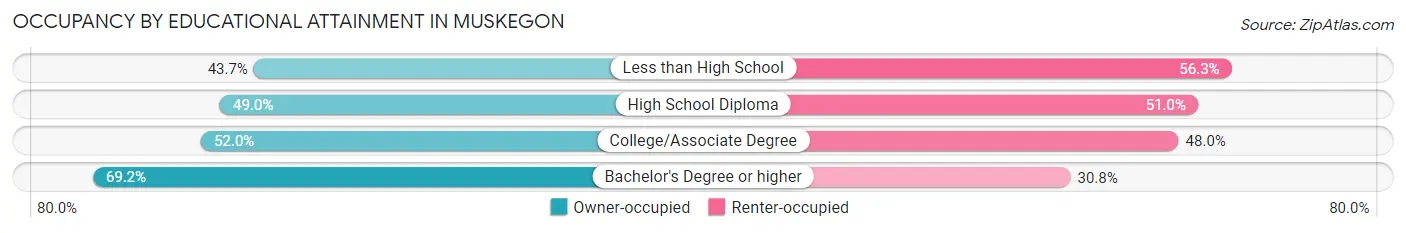
| Household Size | Owner-occupied | Renter-occupied |
| Less than High School | 537 (43.7%) | 693 (56.3%) |
| High School Diploma | 2,524 (49.0%) | 2,628 (51.0%) |
| College/Associate Degree | 2,859 (52.0%) | 2,637 (48.0%) |
| Bachelor's Degree or higher | 1,667 (69.2%) | 743 (30.8%) |
Occupancy by Age of Householder in Muskegon
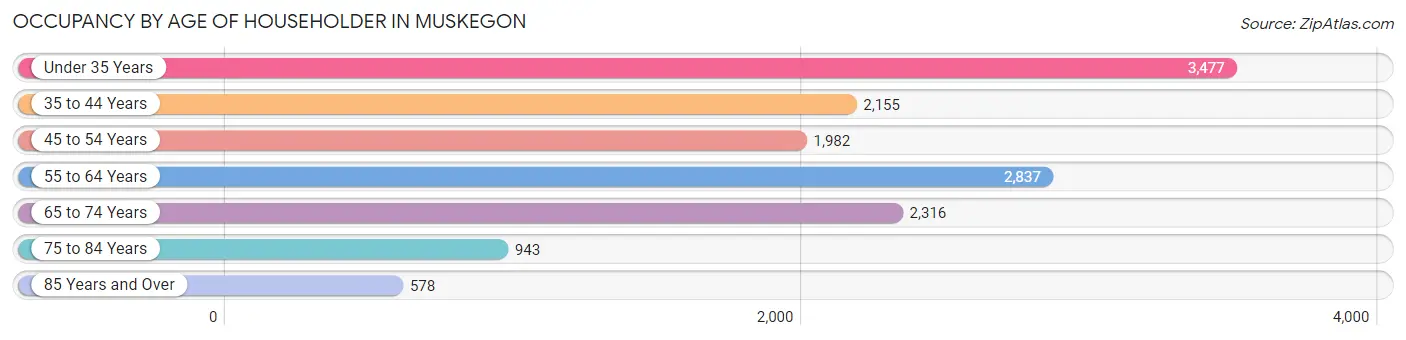
| Age Bracket | # Households | % Households |
| Under 35 Years | 3,477 | 24.3% |
| 35 to 44 Years | 2,155 | 15.1% |
| 45 to 54 Years | 1,982 | 13.9% |
| 55 to 64 Years | 2,837 | 19.9% |
| 65 to 74 Years | 2,316 | 16.2% |
| 75 to 84 Years | 943 | 6.6% |
| 85 Years and Over | 578 | 4.1% |
| Total | 14,288 | 100.0% |
Housing Finances in Muskegon
Median Income by Occupancy in Muskegon
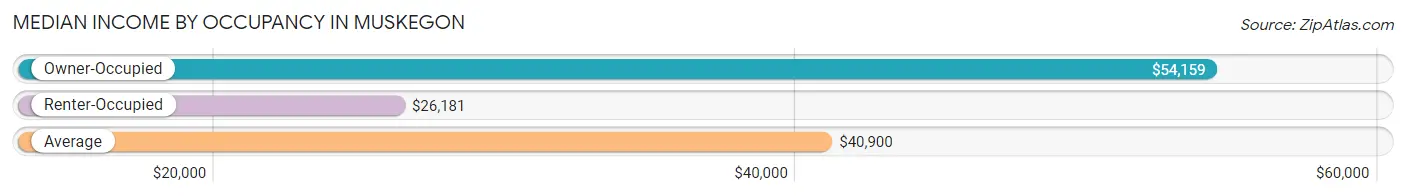
| Occupancy Type | # Households | Median Income |
| Owner-Occupied | 7,587 (53.1%) | $54,159 |
| Renter-Occupied | 6,701 (46.9%) | $26,181 |
| Average | 14,288 (100.0%) | $40,900 |
Occupancy by Householder Income Bracket in Muskegon
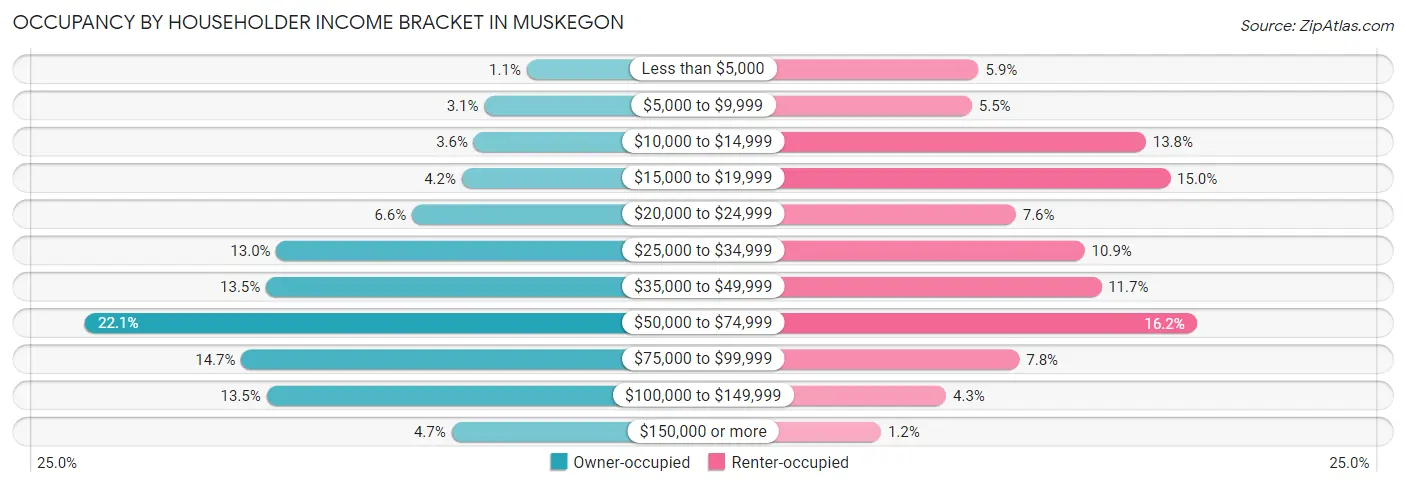
| Income Bracket | Owner-occupied | Renter-occupied |
| Less than $5,000 | 83 (1.1%) | 393 (5.9%) |
| $5,000 to $9,999 | 236 (3.1%) | 371 (5.5%) |
| $10,000 to $14,999 | 274 (3.6%) | 926 (13.8%) |
| $15,000 to $19,999 | 317 (4.2%) | 1,004 (15.0%) |
| $20,000 to $24,999 | 497 (6.6%) | 511 (7.6%) |
| $25,000 to $34,999 | 987 (13.0%) | 731 (10.9%) |
| $35,000 to $49,999 | 1,024 (13.5%) | 784 (11.7%) |
| $50,000 to $74,999 | 1,678 (22.1%) | 1,088 (16.2%) |
| $75,000 to $99,999 | 1,114 (14.7%) | 523 (7.8%) |
| $100,000 to $149,999 | 1,023 (13.5%) | 289 (4.3%) |
| $150,000 or more | 354 (4.7%) | 81 (1.2%) |
| Total | 7,587 (100.0%) | 6,701 (100.0%) |
Monthly Housing Cost Tiers in Muskegon
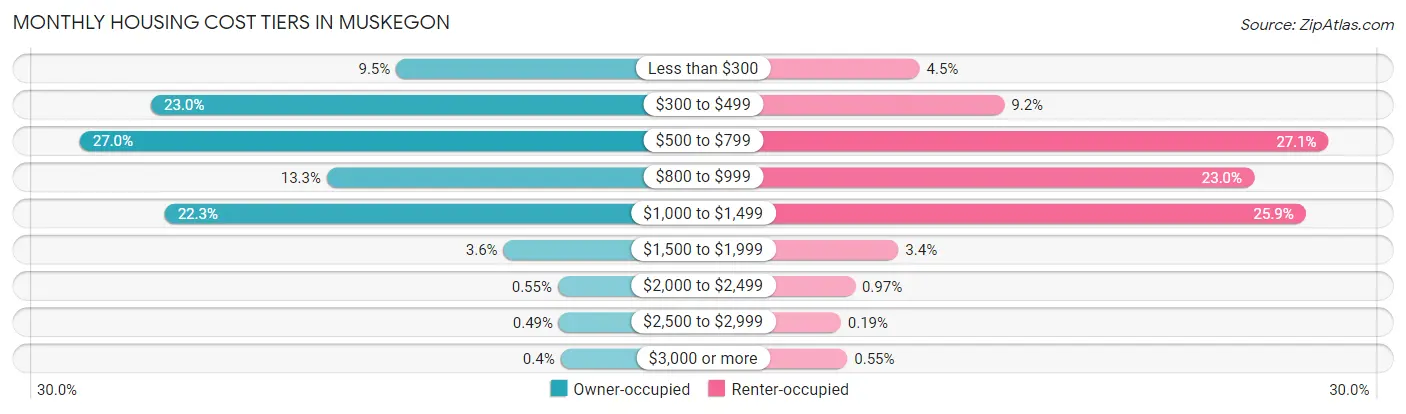
| Monthly Cost | Owner-occupied | Renter-occupied |
| Less than $300 | 719 (9.5%) | 304 (4.5%) |
| $300 to $499 | 1,746 (23.0%) | 618 (9.2%) |
| $500 to $799 | 2,045 (27.0%) | 1,817 (27.1%) |
| $800 to $999 | 1,010 (13.3%) | 1,541 (23.0%) |
| $1,000 to $1,499 | 1,689 (22.3%) | 1,733 (25.9%) |
| $1,500 to $1,999 | 269 (3.5%) | 226 (3.4%) |
| $2,000 to $2,499 | 42 (0.5%) | 65 (1.0%) |
| $2,500 to $2,999 | 37 (0.5%) | 13 (0.2%) |
| $3,000 or more | 30 (0.4%) | 37 (0.5%) |
| Total | 7,587 (100.0%) | 6,701 (100.0%) |
Physical Housing Characteristics in Muskegon
Housing Structures in Muskegon
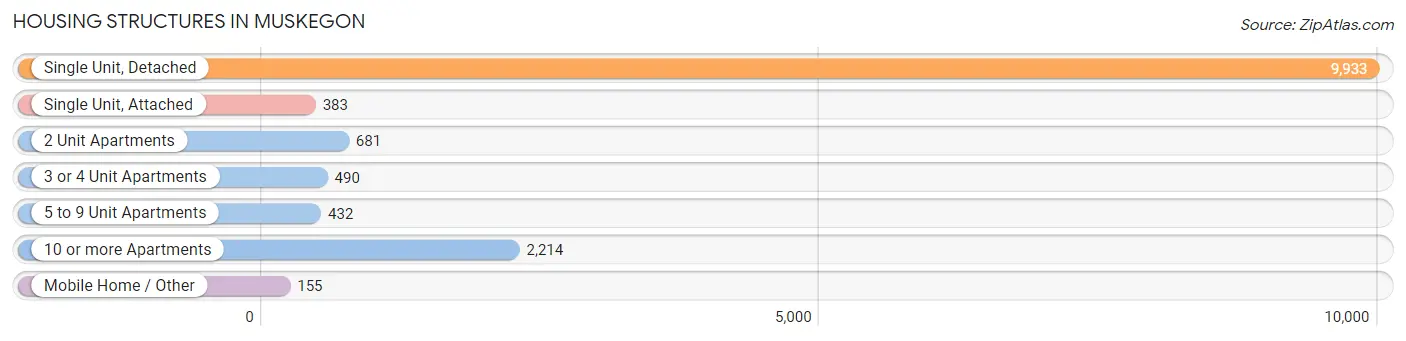
| Structure Type | # Housing Units | % Housing Units |
| Single Unit, Detached | 9,933 | 69.5% |
| Single Unit, Attached | 383 | 2.7% |
| 2 Unit Apartments | 681 | 4.8% |
| 3 or 4 Unit Apartments | 490 | 3.4% |
| 5 to 9 Unit Apartments | 432 | 3.0% |
| 10 or more Apartments | 2,214 | 15.5% |
| Mobile Home / Other | 155 | 1.1% |
| Total | 14,288 | 100.0% |
Housing Structures by Occupancy in Muskegon
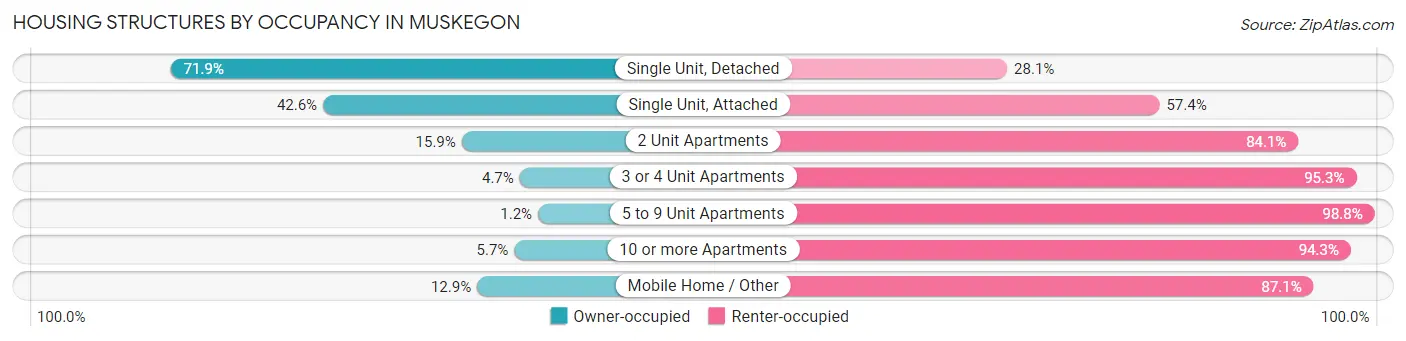
| Structure Type | Owner-occupied | Renter-occupied |
| Single Unit, Detached | 7,141 (71.9%) | 2,792 (28.1%) |
| Single Unit, Attached | 163 (42.6%) | 220 (57.4%) |
| 2 Unit Apartments | 108 (15.9%) | 573 (84.1%) |
| 3 or 4 Unit Apartments | 23 (4.7%) | 467 (95.3%) |
| 5 to 9 Unit Apartments | 5 (1.2%) | 427 (98.8%) |
| 10 or more Apartments | 127 (5.7%) | 2,087 (94.3%) |
| Mobile Home / Other | 20 (12.9%) | 135 (87.1%) |
| Total | 7,587 (53.1%) | 6,701 (46.9%) |
Housing Structures by Number of Rooms in Muskegon
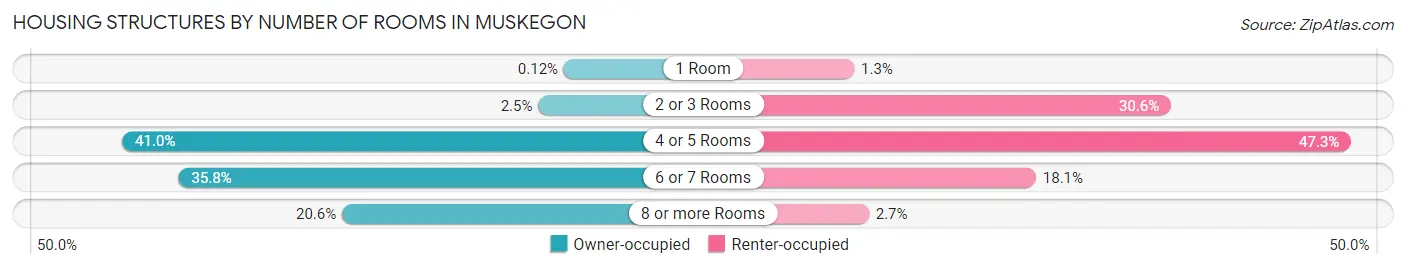
| Number of Rooms | Owner-occupied | Renter-occupied |
| 1 Room | 9 (0.1%) | 88 (1.3%) |
| 2 or 3 Rooms | 189 (2.5%) | 2,052 (30.6%) |
| 4 or 5 Rooms | 3,109 (41.0%) | 3,168 (47.3%) |
| 6 or 7 Rooms | 2,714 (35.8%) | 1,214 (18.1%) |
| 8 or more Rooms | 1,566 (20.6%) | 179 (2.7%) |
| Total | 7,587 (100.0%) | 6,701 (100.0%) |
Housing Structure by Heating Type in Muskegon
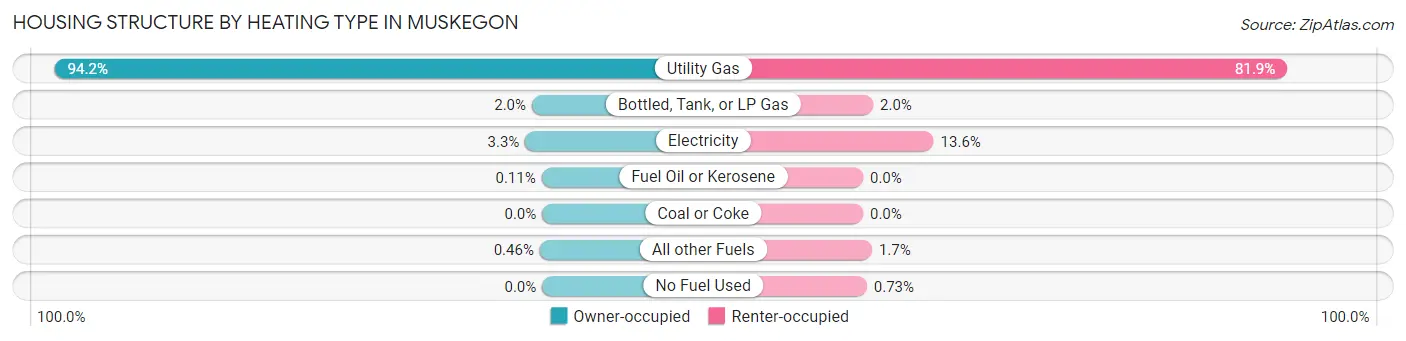
| Heating Type | Owner-occupied | Renter-occupied |
| Utility Gas | 7,146 (94.2%) | 5,491 (81.9%) |
| Bottled, Tank, or LP Gas | 150 (2.0%) | 131 (1.9%) |
| Electricity | 248 (3.3%) | 914 (13.6%) |
| Fuel Oil or Kerosene | 8 (0.1%) | 0 (0.0%) |
| Coal or Coke | 0 (0.0%) | 0 (0.0%) |
| All other Fuels | 35 (0.5%) | 116 (1.7%) |
| No Fuel Used | 0 (0.0%) | 49 (0.7%) |
| Total | 7,587 (100.0%) | 6,701 (100.0%) |
Household Vehicle Usage in Muskegon
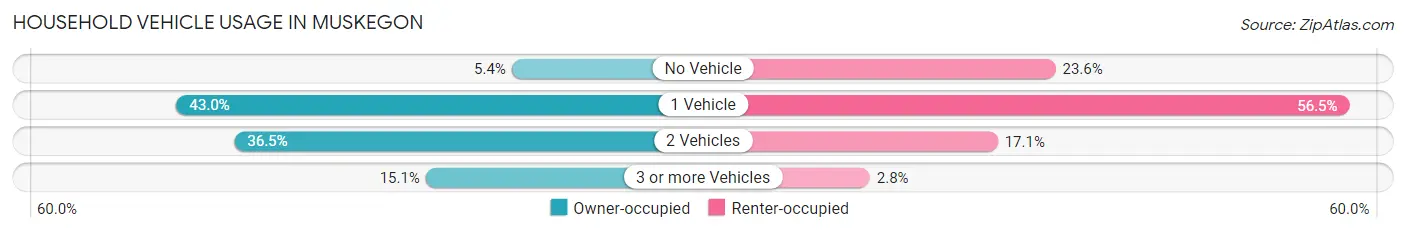
| Vehicles per Household | Owner-occupied | Renter-occupied |
| No Vehicle | 413 (5.4%) | 1,581 (23.6%) |
| 1 Vehicle | 3,262 (43.0%) | 3,786 (56.5%) |
| 2 Vehicles | 2,769 (36.5%) | 1,147 (17.1%) |
| 3 or more Vehicles | 1,143 (15.1%) | 187 (2.8%) |
| Total | 7,587 (100.0%) | 6,701 (100.0%) |
Real Estate & Mortgages in Muskegon
Real Estate and Mortgage Overview in Muskegon
| Characteristic | Without Mortgage | With Mortgage |
| Housing Units | 3,610 | 3,977 |
| Median Property Value | $79,500 | $120,400 |
| Median Household Income | $45,465 | $188 |
| Monthly Housing Costs | $418 | $30 |
| Real Estate Taxes | $1,445 | $145 |
Property Value by Mortgage Status in Muskegon
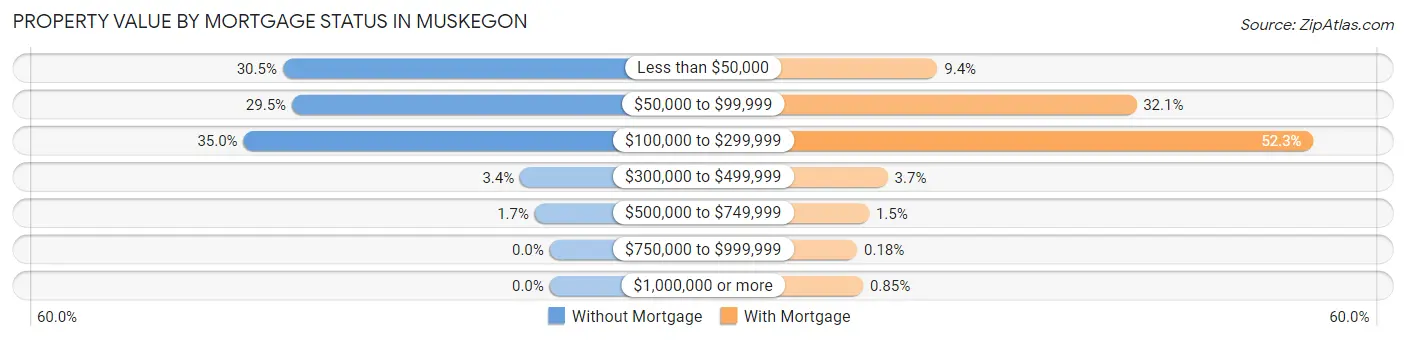
| Property Value | Without Mortgage | With Mortgage |
| Less than $50,000 | 1,101 (30.5%) | 372 (9.3%) |
| $50,000 to $99,999 | 1,063 (29.4%) | 1,276 (32.1%) |
| $100,000 to $299,999 | 1,263 (35.0%) | 2,081 (52.3%) |
| $300,000 to $499,999 | 122 (3.4%) | 146 (3.7%) |
| $500,000 to $749,999 | 61 (1.7%) | 61 (1.5%) |
| $750,000 to $999,999 | 0 (0.0%) | 7 (0.2%) |
| $1,000,000 or more | 0 (0.0%) | 34 (0.9%) |
| Total | 3,610 (100.0%) | 3,977 (100.0%) |
Household Income by Mortgage Status in Muskegon
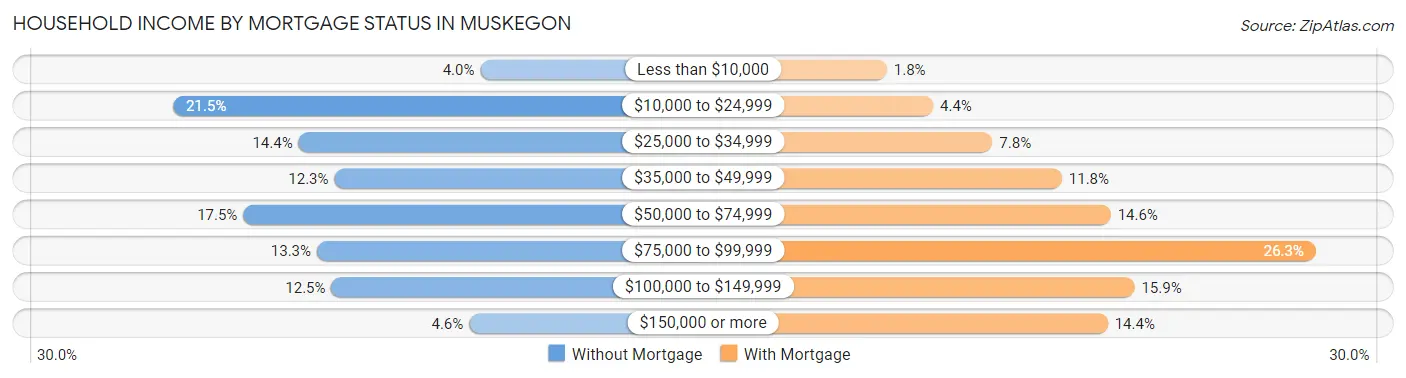
| Household Income | Without Mortgage | With Mortgage |
| Less than $10,000 | 143 (4.0%) | 71 (1.8%) |
| $10,000 to $24,999 | 777 (21.5%) | 176 (4.4%) |
| $25,000 to $34,999 | 518 (14.3%) | 311 (7.8%) |
| $35,000 to $49,999 | 444 (12.3%) | 469 (11.8%) |
| $50,000 to $74,999 | 632 (17.5%) | 580 (14.6%) |
| $75,000 to $99,999 | 480 (13.3%) | 1,046 (26.3%) |
| $100,000 to $149,999 | 450 (12.5%) | 634 (15.9%) |
| $150,000 or more | 166 (4.6%) | 573 (14.4%) |
| Total | 3,610 (100.0%) | 3,977 (100.0%) |
Property Value to Household Income Ratio in Muskegon
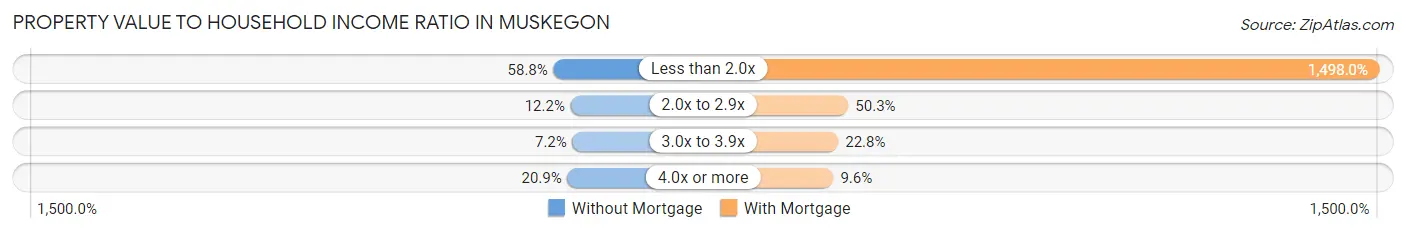
| Value-to-Income Ratio | Without Mortgage | With Mortgage |
| Less than 2.0x | 2,124 (58.8%) | 59,577 (1,498.0%) |
| 2.0x to 2.9x | 442 (12.2%) | 2,002 (50.3%) |
| 3.0x to 3.9x | 259 (7.2%) | 906 (22.8%) |
| 4.0x or more | 755 (20.9%) | 381 (9.6%) |
| Total | 3,610 (100.0%) | 3,977 (100.0%) |
Real Estate Taxes by Mortgage Status in Muskegon
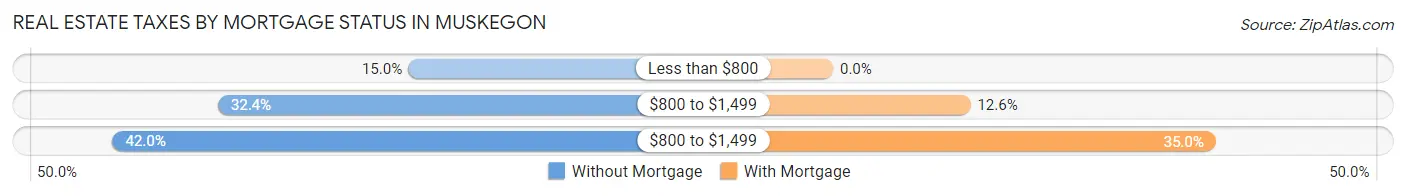
| Property Taxes | Without Mortgage | With Mortgage |
| Less than $800 | 541 (15.0%) | 0 (0.0%) |
| $800 to $1,499 | 1,168 (32.4%) | 499 (12.6%) |
| $800 to $1,499 | 1,515 (42.0%) | 1,390 (34.9%) |
| Total | 3,610 (100.0%) | 3,977 (100.0%) |
Health & Disability in Muskegon
Health Insurance Coverage by Age in Muskegon
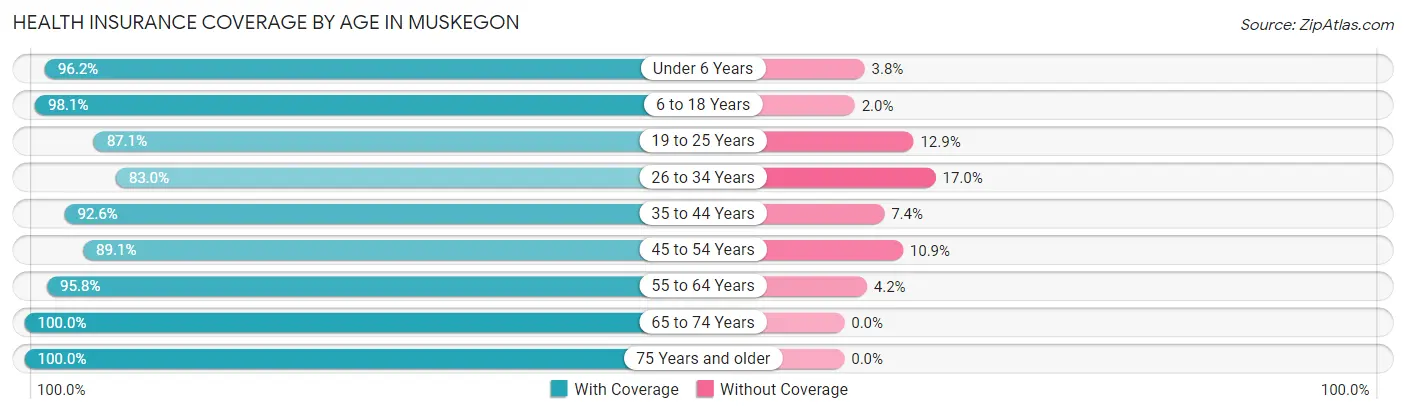
| Age Bracket | With Coverage | Without Coverage |
| Under 6 Years | 2,923 (96.2%) | 115 (3.8%) |
| 6 to 18 Years | 5,870 (98.1%) | 117 (1.9%) |
| 19 to 25 Years | 3,226 (87.1%) | 478 (12.9%) |
| 26 to 34 Years | 3,850 (83.0%) | 789 (17.0%) |
| 35 to 44 Years | 3,882 (92.6%) | 312 (7.4%) |
| 45 to 54 Years | 3,101 (89.1%) | 380 (10.9%) |
| 55 to 64 Years | 4,108 (95.8%) | 180 (4.2%) |
| 65 to 74 Years | 3,080 (100.0%) | 0 (0.0%) |
| 75 Years and older | 1,941 (100.0%) | 0 (0.0%) |
| Total | 31,981 (93.1%) | 2,371 (6.9%) |
Health Insurance Coverage by Citizenship Status in Muskegon
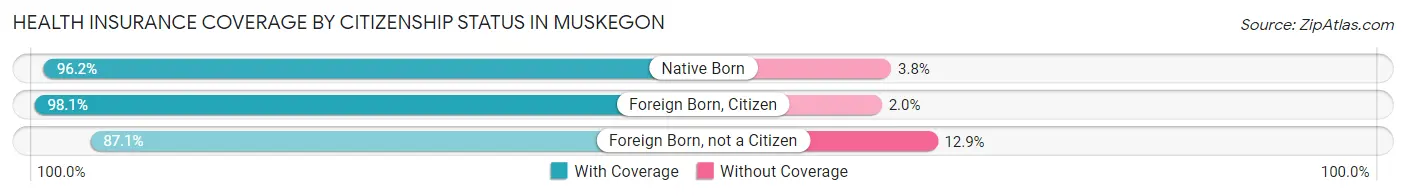
| Citizenship Status | With Coverage | Without Coverage |
| Native Born | 2,923 (96.2%) | 115 (3.8%) |
| Foreign Born, Citizen | 5,870 (98.1%) | 117 (1.9%) |
| Foreign Born, not a Citizen | 3,226 (87.1%) | 478 (12.9%) |
Health Insurance Coverage by Household Income in Muskegon
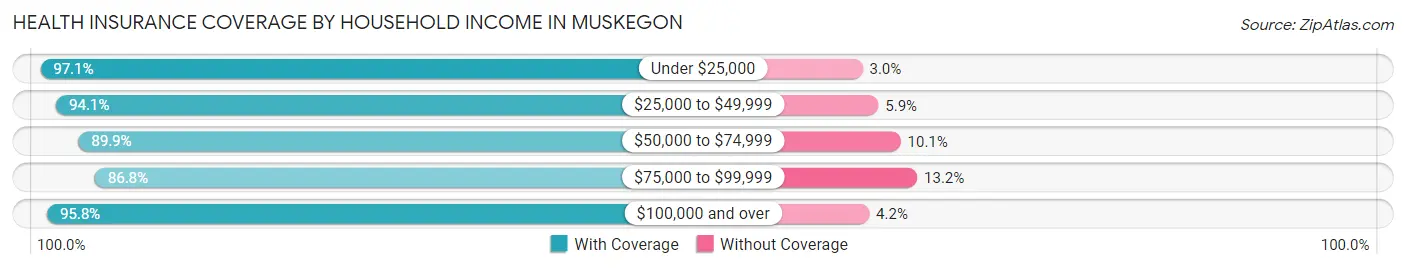
| Household Income | With Coverage | Without Coverage |
| Under $25,000 | 7,371 (97.1%) | 224 (2.9%) |
| $25,000 to $49,999 | 6,814 (94.1%) | 428 (5.9%) |
| $50,000 to $74,999 | 7,095 (89.9%) | 795 (10.1%) |
| $75,000 to $99,999 | 3,897 (86.8%) | 591 (13.2%) |
| $100,000 and over | 5,765 (95.8%) | 252 (4.2%) |
Public vs Private Health Insurance Coverage by Age in Muskegon
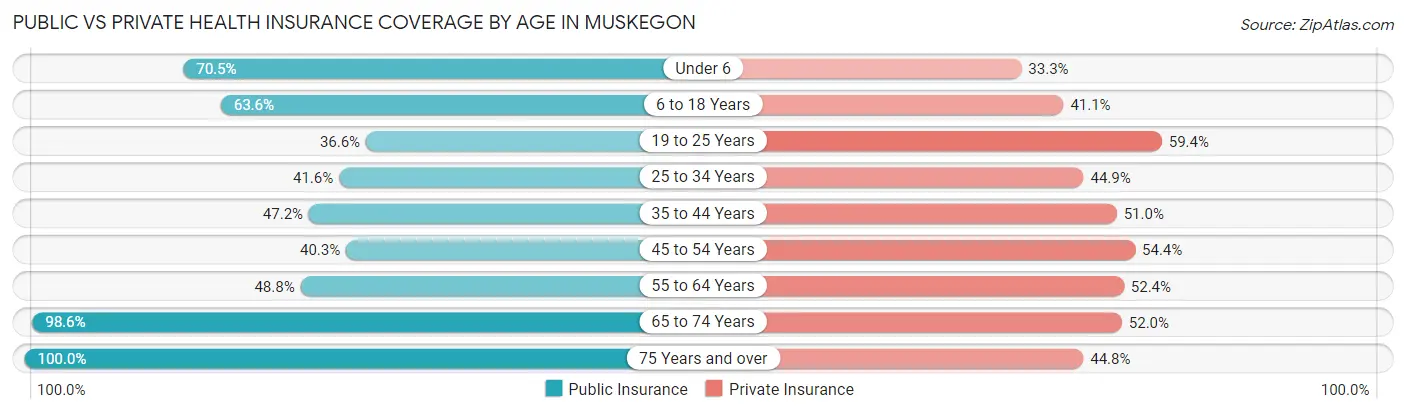
| Age Bracket | Public Insurance | Private Insurance |
| Under 6 | 2,143 (70.5%) | 1,013 (33.3%) |
| 6 to 18 Years | 3,806 (63.6%) | 2,463 (41.1%) |
| 19 to 25 Years | 1,357 (36.6%) | 2,200 (59.4%) |
| 25 to 34 Years | 1,931 (41.6%) | 2,082 (44.9%) |
| 35 to 44 Years | 1,981 (47.2%) | 2,140 (51.0%) |
| 45 to 54 Years | 1,404 (40.3%) | 1,895 (54.4%) |
| 55 to 64 Years | 2,092 (48.8%) | 2,245 (52.4%) |
| 65 to 74 Years | 3,036 (98.6%) | 1,601 (52.0%) |
| 75 Years and over | 1,941 (100.0%) | 870 (44.8%) |
| Total | 19,691 (57.3%) | 16,509 (48.1%) |
Disability Status by Sex by Age in Muskegon
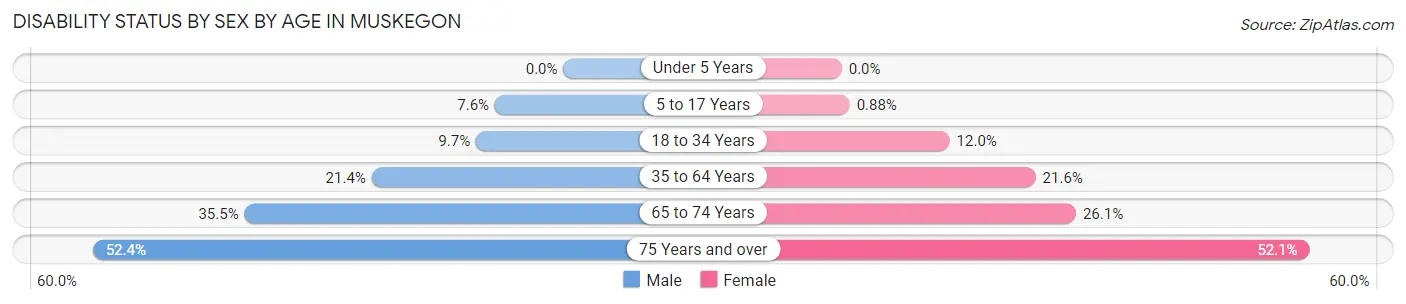
| Age Bracket | Male | Female |
| Under 5 Years | 0 (0.0%) | 0 (0.0%) |
| 5 to 17 Years | 215 (7.6%) | 27 (0.9%) |
| 18 to 34 Years | 415 (9.7%) | 568 (12.0%) |
| 35 to 64 Years | 1,242 (21.3%) | 1,327 (21.6%) |
| 65 to 74 Years | 451 (35.5%) | 472 (26.1%) |
| 75 Years and over | 348 (52.4%) | 665 (52.1%) |
Disability Class by Sex by Age in Muskegon
Disability Class: Hearing Difficulty
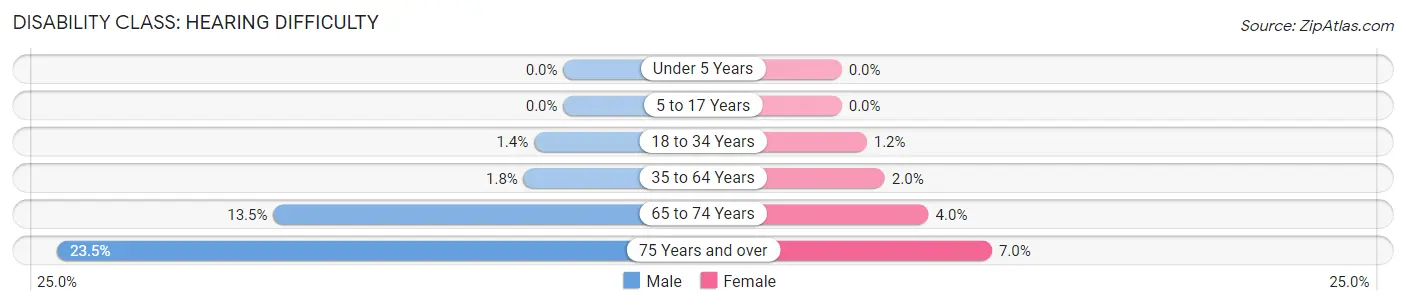
| Age Bracket | Male | Female |
| Under 5 Years | 0 (0.0%) | 0 (0.0%) |
| 5 to 17 Years | 0 (0.0%) | 0 (0.0%) |
| 18 to 34 Years | 58 (1.4%) | 55 (1.2%) |
| 35 to 64 Years | 107 (1.8%) | 123 (2.0%) |
| 65 to 74 Years | 171 (13.5%) | 73 (4.0%) |
| 75 Years and over | 156 (23.5%) | 89 (7.0%) |
Disability Class: Vision Difficulty
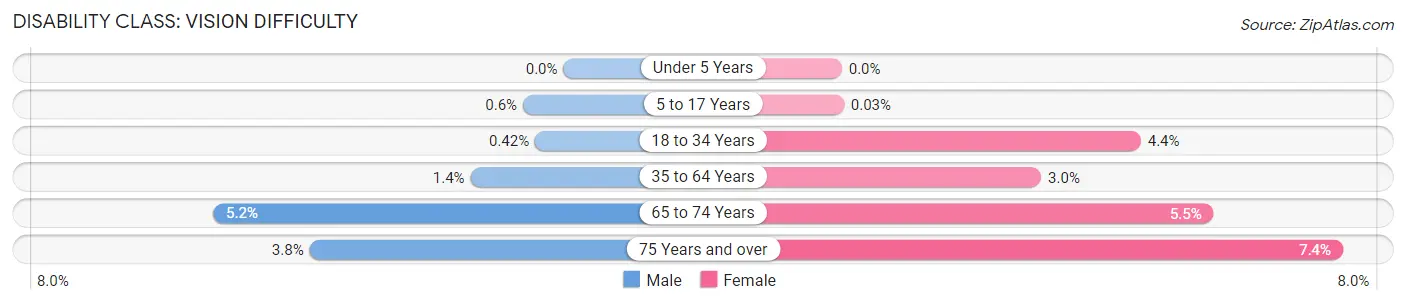
| Age Bracket | Male | Female |
| Under 5 Years | 0 (0.0%) | 0 (0.0%) |
| 5 to 17 Years | 17 (0.6%) | 1 (0.0%) |
| 18 to 34 Years | 18 (0.4%) | 210 (4.4%) |
| 35 to 64 Years | 80 (1.4%) | 182 (3.0%) |
| 65 to 74 Years | 66 (5.2%) | 100 (5.5%) |
| 75 Years and over | 25 (3.8%) | 95 (7.4%) |
Disability Class: Cognitive Difficulty
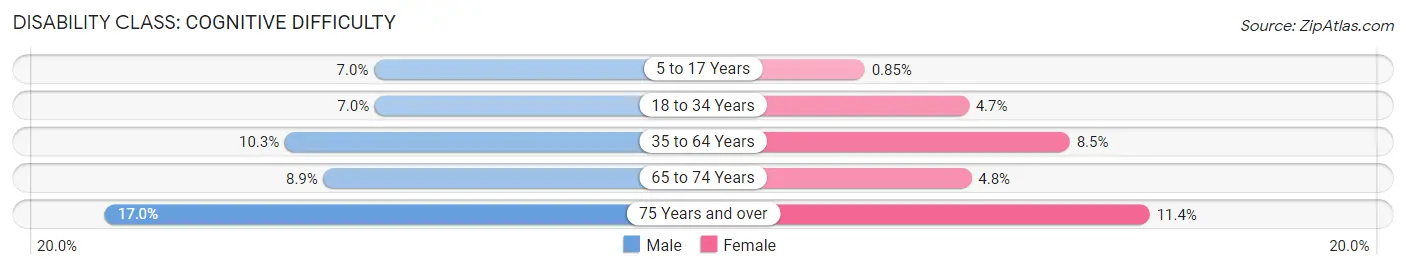
| Age Bracket | Male | Female |
| 5 to 17 Years | 198 (7.0%) | 26 (0.9%) |
| 18 to 34 Years | 298 (7.0%) | 223 (4.7%) |
| 35 to 64 Years | 601 (10.3%) | 520 (8.5%) |
| 65 to 74 Years | 113 (8.9%) | 87 (4.8%) |
| 75 Years and over | 113 (17.0%) | 146 (11.4%) |
Disability Class: Ambulatory Difficulty
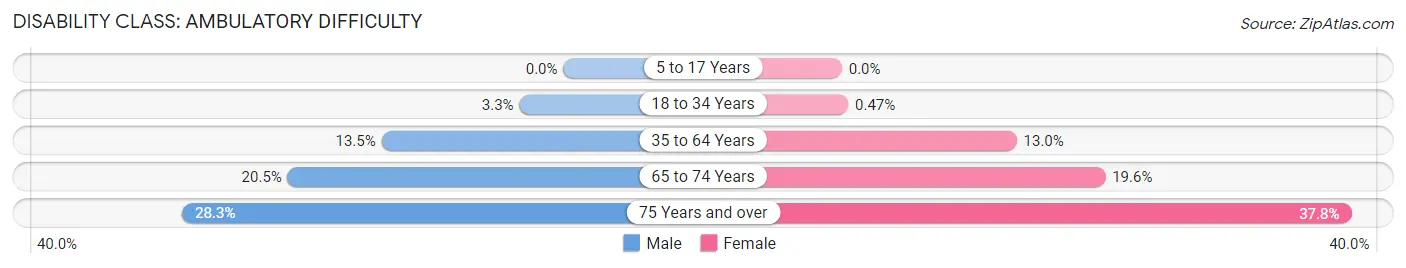
| Age Bracket | Male | Female |
| 5 to 17 Years | 0 (0.0%) | 0 (0.0%) |
| 18 to 34 Years | 139 (3.3%) | 22 (0.5%) |
| 35 to 64 Years | 785 (13.5%) | 798 (13.0%) |
| 65 to 74 Years | 260 (20.5%) | 354 (19.6%) |
| 75 Years and over | 188 (28.3%) | 483 (37.8%) |
Disability Class: Self-Care Difficulty
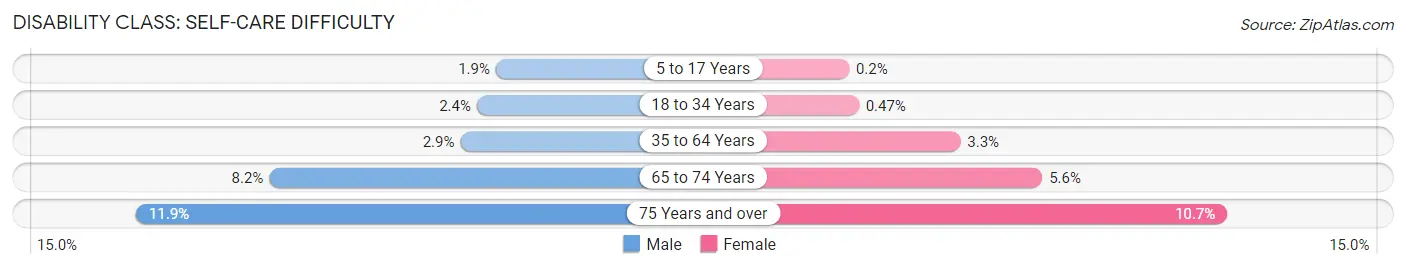
| Age Bracket | Male | Female |
| 5 to 17 Years | 53 (1.9%) | 6 (0.2%) |
| 18 to 34 Years | 103 (2.4%) | 22 (0.5%) |
| 35 to 64 Years | 167 (2.9%) | 203 (3.3%) |
| 65 to 74 Years | 104 (8.2%) | 101 (5.6%) |
| 75 Years and over | 79 (11.9%) | 137 (10.7%) |
Technology Access in Muskegon
Computing Device Access in Muskegon
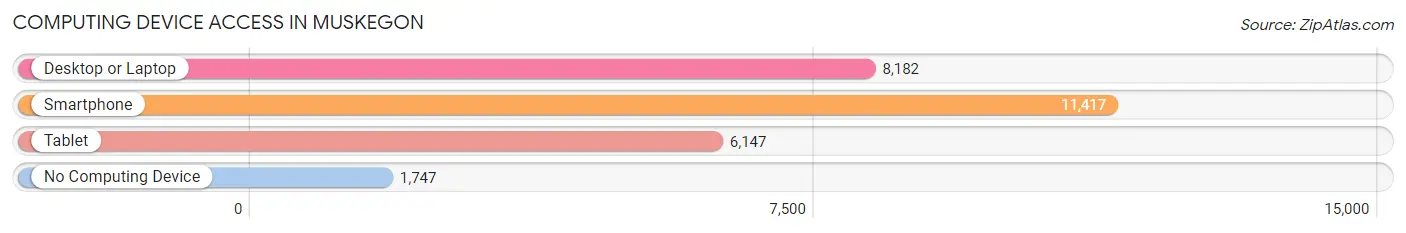
| Device Type | # Households | % Households |
| Desktop or Laptop | 8,182 | 57.3% |
| Smartphone | 11,417 | 79.9% |
| Tablet | 6,147 | 43.0% |
| No Computing Device | 1,747 | 12.2% |
| Total | 14,288 | 100.0% |
Internet Access in Muskegon
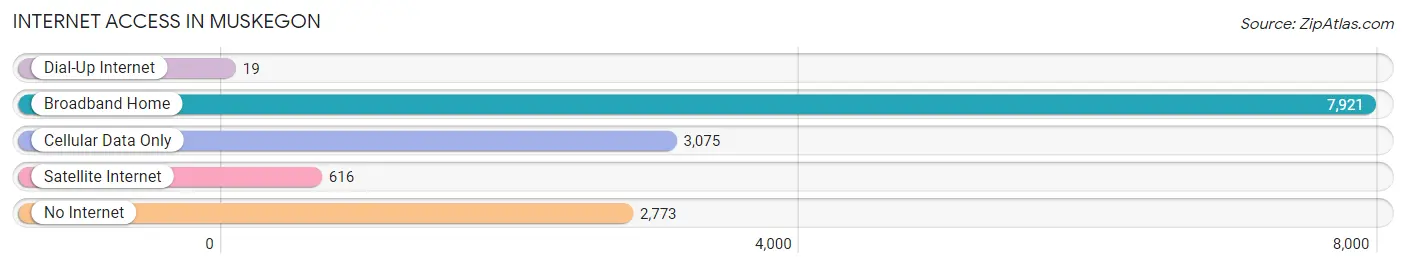
| Internet Type | # Households | % Households |
| Dial-Up Internet | 19 | 0.1% |
| Broadband Home | 7,921 | 55.4% |
| Cellular Data Only | 3,075 | 21.5% |
| Satellite Internet | 616 | 4.3% |
| No Internet | 2,773 | 19.4% |
| Total | 14,288 | 100.0% |
Muskegon Summary
Muskegon, Michigan is a city located in the western part of the state, on the shores of Lake Michigan. It is the county seat of Muskegon County and is the largest city in the county. The city has a population of 38,401 as of the 2010 census, making it the largest city on the eastern shore of Lake Michigan.
Geography
Muskegon is located at the mouth of the Muskegon River, which empties into Lake Michigan. The city is situated on a series of low hills and bluffs that overlook the lake. The city is surrounded by several lakes, including Muskegon Lake, Bear Lake, and Mona Lake. The city is also located near the Muskegon State Park, which is a popular destination for outdoor recreation.
The city has a total area of 16.2 square miles, of which 15.7 square miles is land and 0.5 square miles is water. The city is located in the Central Time Zone and observes Daylight Saving Time.
History
The area that is now Muskegon was first inhabited by the Ottawa and Pottawatomi Native American tribes. The first European settlers arrived in the area in the early 19th century, and the city was officially founded in 1837. The city was named after the Muskegon River, which was named after the Ottawa word for “marshy river or swamp.”
The city quickly grew in the late 19th century, due to its location on the lake and its proximity to the lumber industry. The city was a major hub for the lumber industry, and the city’s population grew rapidly. By the early 20th century, the city had become a major port and industrial center.
Economy
Muskegon’s economy is largely based on manufacturing and tourism. The city is home to several large manufacturing companies, including L3Harris Technologies, Gentex Corporation, and Brunswick Corporation. The city is also home to several large tourist attractions, including the Muskegon State Park, the Muskegon Museum of Art, and the Muskegon Lighthouse.
The city also has a thriving arts and culture scene, with several galleries, museums, and performing arts venues. The city is also home to several festivals and events, including the Muskegon Summer Celebration, the Muskegon Bike Time, and the Muskegon Air Show.
Demographics
As of the 2010 census, the population of Muskegon was 38,401. The racial makeup of the city was 79.2% White, 14.3% African American, 0.7% Native American, 1.2% Asian, 0.1% Pacific Islander, 1.7% from other races, and 2.9% from two or more races. Hispanic or Latino of any race were 5.2% of the population.
The median income for a household in the city was $35,945, and the median income for a family was $45,945. The per capita income for the city was $20,845. About 17.2% of the population was below the poverty line.
Conclusion
Muskegon, Michigan is a city located in the western part of the state, on the shores of Lake Michigan. It is the county seat of Muskegon County and is the largest city in the county. The city has a population of 38,401 as of the 2010 census, making it the largest city on the eastern shore of Lake Michigan. The city’s economy is largely based on manufacturing and tourism, and the city is home to several large tourist attractions. The city also has a thriving arts and culture scene, with several galleries, museums, and performing arts venues. The city’s population is largely white, with a small percentage of African Americans, Native Americans, Asians, and other races. The median income for a household in the city was $35,945, and the median income for a family was $45,945.
Common Questions
What is Per Capita Income in Muskegon?
Per Capita income in Muskegon is $22,262.
What is the Median Family Income in Muskegon?
Median Family Income in Muskegon is $51,665.
What is the Median Household income in Muskegon?
Median Household Income in Muskegon is $40,900.
What is Income or Wage Gap in Muskegon?
Income or Wage Gap in Muskegon is 27.9%.
Women in Muskegon earn 72.1 cents for every dollar earned by a man.
What is Family Income Deficit in Muskegon?
Family Income Deficit in Muskegon is $10,687.
Families that are below poverty line in Muskegon earn $10,687 less on average than the poverty threshold level.
What is Inequality or Gini Index in Muskegon?
Inequality or Gini Index in Muskegon is 0.46.
What is the Total Population of Muskegon?
Total Population of Muskegon is 38,286.
What is the Total Male Population of Muskegon?
Total Male Population of Muskegon is 19,671.
What is the Total Female Population of Muskegon?
Total Female Population of Muskegon is 18,615.
What is the Ratio of Males per 100 Females in Muskegon?
There are 105.67 Males per 100 Females in Muskegon.
What is the Ratio of Females per 100 Males in Muskegon?
There are 94.63 Females per 100 Males in Muskegon.
What is the Median Population Age in Muskegon?
Median Population Age in Muskegon is 36.1 Years.
What is the Average Family Size in Muskegon
Average Family Size in Muskegon is 3.2 People.
What is the Average Household Size in Muskegon
Average Household Size in Muskegon is 2.3 People.
How Large is the Labor Force in Muskegon?
There are 15,984 People in the Labor Forcein in Muskegon.
What is the Percentage of People in the Labor Force in Muskegon?
52.0% of People are in the Labor Force in Muskegon.
What is the Unemployment Rate in Muskegon?
Unemployment Rate in Muskegon is 10.4%.