Cities with the Most Immigrants from El Salvador in Connecticut
RELATED REPORTS & OPTIONS
El Salvador
Connecticut
Compare Cities
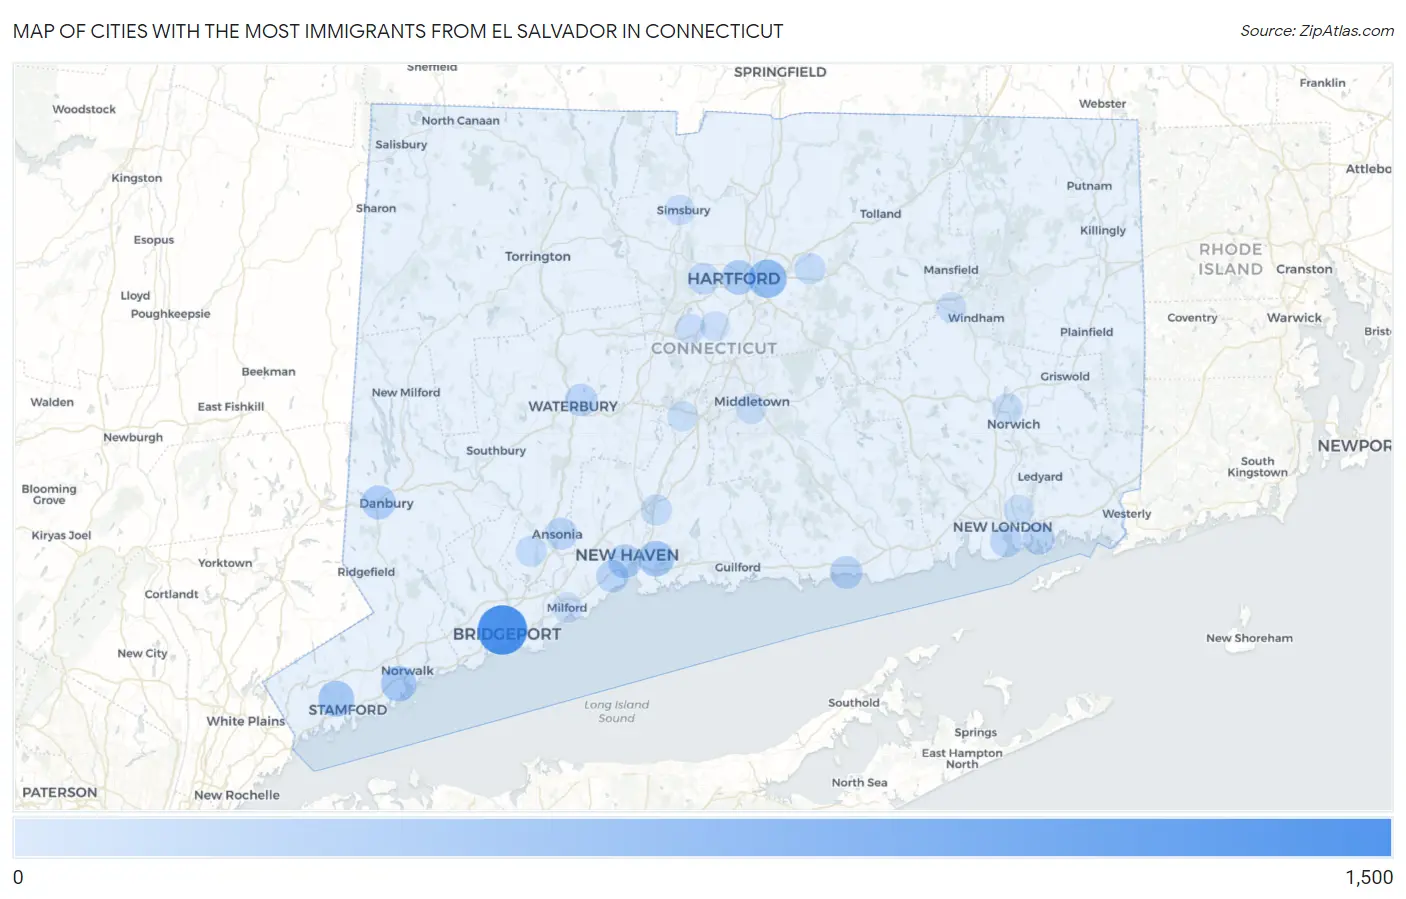
Map of Cities with the Most Immigrants from El Salvador in Connecticut
0
1,500
Cities with the Most Immigrants from El Salvador in Connecticut
| City | El Salvador | vs State | vs National | |
| 1. | Bridgeport | 1,368 | 6,024(22.71%)#1 | 1,408,349(0.10%)#165 |
| 2. | East Hartford | 573 | 6,024(9.51%)#2 | 1,408,349(0.04%)#355 |
| 3. | Stamford | 394 | 6,024(6.54%)#3 | 1,408,349(0.03%)#498 |
| 4. | East Haven | 378 | 6,024(6.27%)#4 | 1,408,349(0.03%)#521 |
| 5. | Norwalk | 367 | 6,024(6.09%)#5 | 1,408,349(0.03%)#540 |
| 6. | Hartford | 301 | 6,024(5.00%)#6 | 1,408,349(0.02%)#646 |
| 7. | Danbury | 263 | 6,024(4.37%)#7 | 1,408,349(0.02%)#710 |
| 8. | New Haven | 243 | 6,024(4.03%)#8 | 1,408,349(0.02%)#750 |
| 9. | Westbrook Center | 178 | 6,024(2.95%)#9 | 1,408,349(0.01%)#919 |
| 10. | Waterbury | 166 | 6,024(2.76%)#10 | 1,408,349(0.01%)#968 |
| 11. | West Haven | 160 | 6,024(2.66%)#11 | 1,408,349(0.01%)#989 |
| 12. | Ansonia | 147 | 6,024(2.44%)#12 | 1,408,349(0.01%)#1,046 |
| 13. | New London | 135 | 6,024(2.24%)#13 | 1,408,349(0.01%)#1,101 |
| 14. | Poquonock Bridge | 132 | 6,024(2.19%)#14 | 1,408,349(0.01%)#1,115 |
| 15. | West Hartford | 114 | 6,024(1.89%)#15 | 1,408,349(0.01%)#1,214 |
| 16. | Shelton | 74 | 6,024(1.23%)#16 | 1,408,349(0.01%)#1,530 |
| 17. | North Haven | 74 | 6,024(1.23%)#17 | 1,408,349(0.01%)#1,533 |
| 18. | Manchester | 68 | 6,024(1.13%)#18 | 1,408,349(0.00%)#1,602 |
| 19. | Naugatuck Borough | 67 | 6,024(1.11%)#19 | 1,408,349(0.00%)#1,615 |
| 20. | Middletown | 41 | 6,024(0.68%)#20 | 1,408,349(0.00%)#2,038 |
| 21. | Norwich | 38 | 6,024(0.63%)#21 | 1,408,349(0.00%)#2,110 |
| 22. | New Britain | 24 | 6,024(0.40%)#22 | 1,408,349(0.00%)#2,468 |
| 23. | Milford City Balance | 18 | 6,024(0.30%)#23 | 1,408,349(0.00%)#2,733 |
| 24. | Meriden | 17 | 6,024(0.28%)#24 | 1,408,349(0.00%)#2,769 |
| 25. | Simsbury Center | 15 | 6,024(0.25%)#25 | 1,408,349(0.00%)#2,900 |
| 26. | Conning Towers Nautilus Park | 13 | 6,024(0.22%)#26 | 1,408,349(0.00%)#3,020 |
| 27. | Newington | 8 | 6,024(0.13%)#27 | 1,408,349(0.00%)#3,326 |
| 28. | Willimantic | 8 | 6,024(0.13%)#28 | 1,408,349(0.00%)#3,332 |
1
2Common Questions
What are the Top 10 Cities with the Most Immigrants from El Salvador in Connecticut?
Top 10 Cities with the Most Immigrants from El Salvador in Connecticut are:
#1
1,368
#2
573
#3
394
#4
378
#5
367
#6
301
#7
263
#8
243
#9
178
#10
166
What city has the Most Immigrants from El Salvador in Connecticut?
Bridgeport has the Most Immigrants from El Salvador in Connecticut with 1,368.
What is the Total Immigrants from El Salvador in the State of Connecticut?
Total Immigrants from El Salvador in Connecticut is 6,024.
What is the Total Immigrants from El Salvador in the United States?
Total Immigrants from El Salvador in the United States is 1,408,349.