Cities with the Most Immigrants from El Salvador in Minnesota
RELATED REPORTS & OPTIONS
El Salvador
Minnesota
Compare Cities
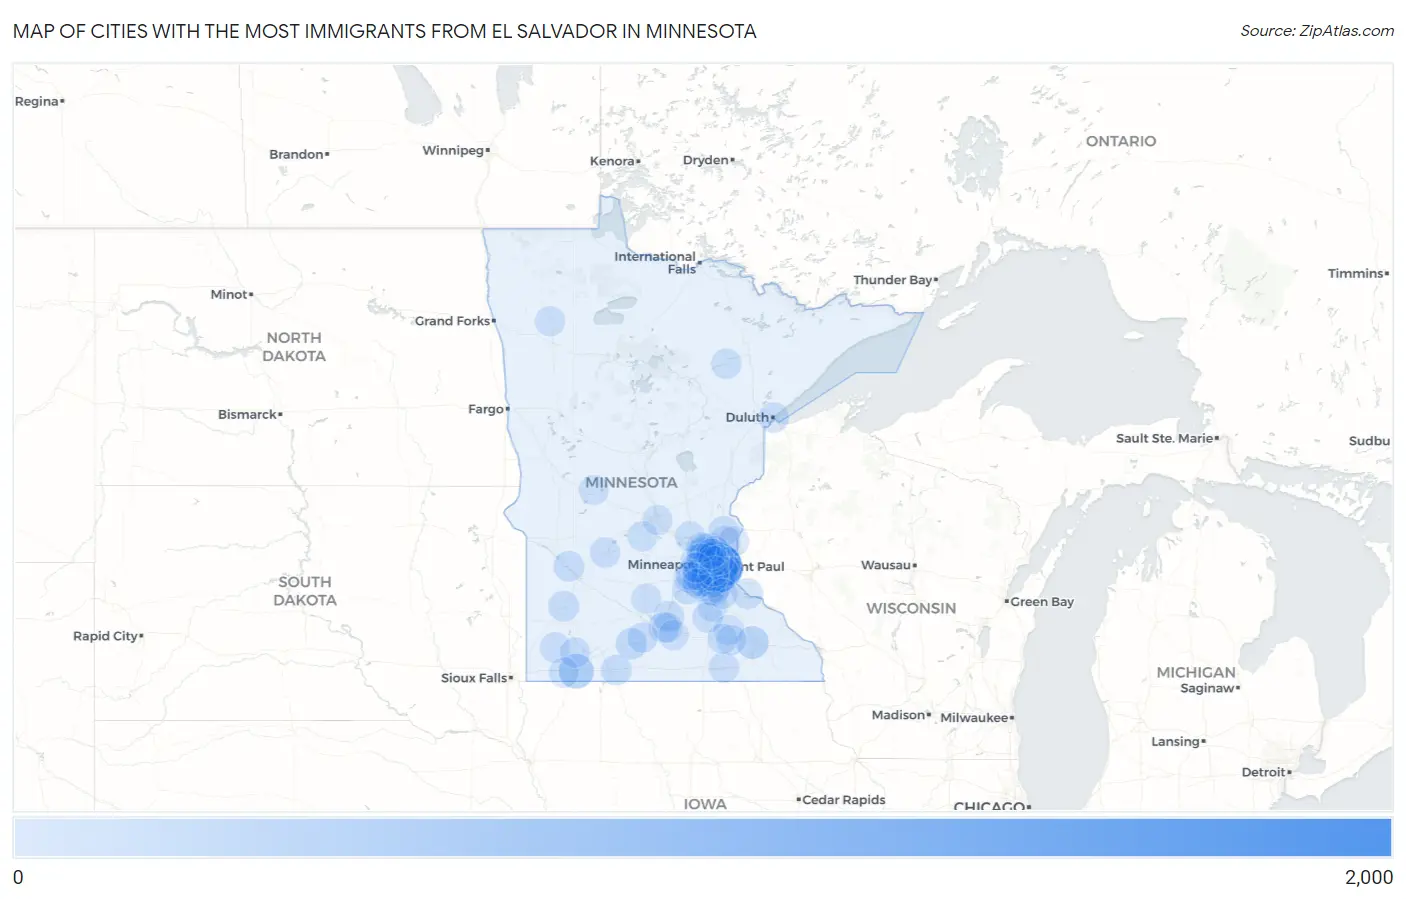
Map of Cities with the Most Immigrants from El Salvador in Minnesota
0
2,000
Cities with the Most Immigrants from El Salvador in Minnesota
| City | El Salvador | vs State | vs National | |
| 1. | St Paul | 1,853 | 6,841(27.09%)#1 | 1,408,349(0.13%)#121 |
| 2. | Worthington | 414 | 6,841(6.05%)#2 | 1,408,349(0.03%)#469 |
| 3. | Minneapolis | 348 | 6,841(5.09%)#3 | 1,408,349(0.02%)#563 |
| 4. | Brooklyn Park | 289 | 6,841(4.22%)#4 | 1,408,349(0.02%)#664 |
| 5. | South St Paul | 286 | 6,841(4.18%)#5 | 1,408,349(0.02%)#671 |
| 6. | Brooklyn Center | 262 | 6,841(3.83%)#6 | 1,408,349(0.02%)#714 |
| 7. | Inver Grove Heights | 242 | 6,841(3.54%)#7 | 1,408,349(0.02%)#754 |
| 8. | Rochester | 224 | 6,841(3.27%)#8 | 1,408,349(0.02%)#796 |
| 9. | Fridley | 201 | 6,841(2.94%)#9 | 1,408,349(0.01%)#848 |
| 10. | Oakdale | 148 | 6,841(2.16%)#10 | 1,408,349(0.01%)#1,039 |
| 11. | Bloomington | 136 | 6,841(1.99%)#11 | 1,408,349(0.01%)#1,091 |
| 12. | Rosemount | 134 | 6,841(1.96%)#12 | 1,408,349(0.01%)#1,104 |
| 13. | Burnsville | 122 | 6,841(1.78%)#13 | 1,408,349(0.01%)#1,159 |
| 14. | Lakeville | 115 | 6,841(1.68%)#14 | 1,408,349(0.01%)#1,205 |
| 15. | St James | 114 | 6,841(1.67%)#15 | 1,408,349(0.01%)#1,219 |
| 16. | Blaine | 101 | 6,841(1.48%)#16 | 1,408,349(0.01%)#1,293 |
| 17. | Farmington | 94 | 6,841(1.37%)#17 | 1,408,349(0.01%)#1,351 |
| 18. | Columbia Heights | 92 | 6,841(1.34%)#18 | 1,408,349(0.01%)#1,365 |
| 19. | Edina | 87 | 6,841(1.27%)#19 | 1,408,349(0.01%)#1,409 |
| 20. | Hopkins | 75 | 6,841(1.10%)#20 | 1,408,349(0.01%)#1,520 |
| 21. | Woodbury | 73 | 6,841(1.07%)#21 | 1,408,349(0.01%)#1,539 |
| 22. | Jordan | 73 | 6,841(1.07%)#22 | 1,408,349(0.01%)#1,547 |
| 23. | Plymouth | 62 | 6,841(0.91%)#23 | 1,408,349(0.00%)#1,687 |
| 24. | Red Wing | 56 | 6,841(0.82%)#24 | 1,408,349(0.00%)#1,786 |
| 25. | Landfall | 56 | 6,841(0.82%)#25 | 1,408,349(0.00%)#1,795 |
| 26. | Montevideo | 54 | 6,841(0.79%)#26 | 1,408,349(0.00%)#1,826 |
| 27. | Shakopee | 50 | 6,841(0.73%)#27 | 1,408,349(0.00%)#1,881 |
| 28. | St Peter | 50 | 6,841(0.73%)#28 | 1,408,349(0.00%)#1,888 |
| 29. | Alpha | 49 | 6,841(0.72%)#29 | 1,408,349(0.00%)#1,909 |
| 30. | Marshall | 48 | 6,841(0.70%)#30 | 1,408,349(0.00%)#1,918 |
| 31. | Richfield | 46 | 6,841(0.67%)#31 | 1,408,349(0.00%)#1,941 |
| 32. | Savage | 45 | 6,841(0.66%)#32 | 1,408,349(0.00%)#1,972 |
| 33. | Chaska | 43 | 6,841(0.63%)#33 | 1,408,349(0.00%)#2,003 |
| 34. | Newport | 43 | 6,841(0.63%)#34 | 1,408,349(0.00%)#2,015 |
| 35. | New Brighton | 42 | 6,841(0.61%)#35 | 1,408,349(0.00%)#2,022 |
| 36. | Chanhassen | 34 | 6,841(0.50%)#36 | 1,408,349(0.00%)#2,200 |
| 37. | North Mankato | 34 | 6,841(0.50%)#37 | 1,408,349(0.00%)#2,204 |
| 38. | Eden Prairie | 32 | 6,841(0.47%)#38 | 1,408,349(0.00%)#2,238 |
| 39. | Chandler | 31 | 6,841(0.45%)#39 | 1,408,349(0.00%)#2,294 |
| 40. | Spring Lake Park | 30 | 6,841(0.44%)#40 | 1,408,349(0.00%)#2,310 |
| 41. | Willmar | 28 | 6,841(0.41%)#41 | 1,408,349(0.00%)#2,358 |
| 42. | Apple Valley | 27 | 6,841(0.39%)#42 | 1,408,349(0.00%)#2,378 |
| 43. | Austin | 27 | 6,841(0.39%)#43 | 1,408,349(0.00%)#2,381 |
| 44. | Arden Hills | 27 | 6,841(0.39%)#44 | 1,408,349(0.00%)#2,387 |
| 45. | Fulda | 26 | 6,841(0.38%)#45 | 1,408,349(0.00%)#2,436 |
| 46. | Madelia | 24 | 6,841(0.35%)#46 | 1,408,349(0.00%)#2,502 |
| 47. | Hibbing | 22 | 6,841(0.32%)#47 | 1,408,349(0.00%)#2,568 |
| 48. | Watkins | 22 | 6,841(0.32%)#48 | 1,408,349(0.00%)#2,593 |
| 49. | Forest Lake | 21 | 6,841(0.31%)#49 | 1,408,349(0.00%)#2,607 |
| 50. | Northfield | 21 | 6,841(0.31%)#50 | 1,408,349(0.00%)#2,608 |
| 51. | Faribault | 19 | 6,841(0.28%)#51 | 1,408,349(0.00%)#2,698 |
| 52. | Stacy | 19 | 6,841(0.28%)#52 | 1,408,349(0.00%)#2,717 |
| 53. | Hilltop | 17 | 6,841(0.25%)#53 | 1,408,349(0.00%)#2,806 |
| 54. | Duluth | 16 | 6,841(0.23%)#54 | 1,408,349(0.00%)#2,812 |
| 55. | Rushmore | 15 | 6,841(0.22%)#55 | 1,408,349(0.00%)#2,923 |
| 56. | Circle Pines | 13 | 6,841(0.19%)#56 | 1,408,349(0.00%)#3,026 |
| 57. | Eagan | 12 | 6,841(0.18%)#57 | 1,408,349(0.00%)#3,050 |
| 58. | Scandia | 12 | 6,841(0.18%)#58 | 1,408,349(0.00%)#3,088 |
| 59. | St Cloud | 11 | 6,841(0.16%)#59 | 1,408,349(0.00%)#3,109 |
| 60. | Coon Rapids | 9 | 6,841(0.13%)#60 | 1,408,349(0.00%)#3,235 |
| 61. | Elk River | 9 | 6,841(0.13%)#61 | 1,408,349(0.00%)#3,247 |
| 62. | West Concord | 9 | 6,841(0.13%)#62 | 1,408,349(0.00%)#3,302 |
| 63. | New Hope | 8 | 6,841(0.12%)#63 | 1,408,349(0.00%)#3,329 |
| 64. | Little Canada | 8 | 6,841(0.12%)#64 | 1,408,349(0.00%)#3,344 |
| 65. | Dodge Center | 8 | 6,841(0.12%)#65 | 1,408,349(0.00%)#3,372 |
| 66. | Roseville | 6 | 6,841(0.09%)#66 | 1,408,349(0.00%)#3,484 |
| 67. | Champlin | 6 | 6,841(0.09%)#67 | 1,408,349(0.00%)#3,489 |
| 68. | Mendota Heights | 6 | 6,841(0.09%)#68 | 1,408,349(0.00%)#3,506 |
| 69. | Winthrop | 5 | 6,841(0.07%)#69 | 1,408,349(0.00%)#3,616 |
| 70. | Minnetonka | 4 | 6,841(0.06%)#70 | 1,408,349(0.00%)#3,640 |
| 71. | Mounds View | 4 | 6,841(0.06%)#71 | 1,408,349(0.00%)#3,650 |
| 72. | Hampton | 4 | 6,841(0.06%)#72 | 1,408,349(0.00%)#3,709 |
| 73. | St Clair | 3 | 6,841(0.04%)#73 | 1,408,349(0.00%)#3,768 |
| 74. | Claremont | 3 | 6,841(0.04%)#74 | 1,408,349(0.00%)#3,772 |
| 75. | Plummer | 3 | 6,841(0.04%)#75 | 1,408,349(0.00%)#3,777 |
| 76. | Mankato | 2 | 6,841(0.03%)#76 | 1,408,349(0.00%)#3,784 |
| 77. | Prior Lake | 2 | 6,841(0.03%)#77 | 1,408,349(0.00%)#3,786 |
| 78. | Nelson | 2 | 6,841(0.03%)#78 | 1,408,349(0.00%)#3,861 |
Common Questions
What are the Top 10 Cities with the Most Immigrants from El Salvador in Minnesota?
Top 10 Cities with the Most Immigrants from El Salvador in Minnesota are:
#1
1,853
#2
414
#3
348
#4
289
#5
286
#6
262
#7
242
#8
224
#9
201
#10
148
What city has the Most Immigrants from El Salvador in Minnesota?
St Paul has the Most Immigrants from El Salvador in Minnesota with 1,853.
What is the Total Immigrants from El Salvador in the State of Minnesota?
Total Immigrants from El Salvador in Minnesota is 6,841.
What is the Total Immigrants from El Salvador in the United States?
Total Immigrants from El Salvador in the United States is 1,408,349.