Cities with the Highest Percentage of Native / Alaskan Population in Maryland
RELATED REPORTS & OPTIONS
Native / Alaskan
Maryland
Compare Cities
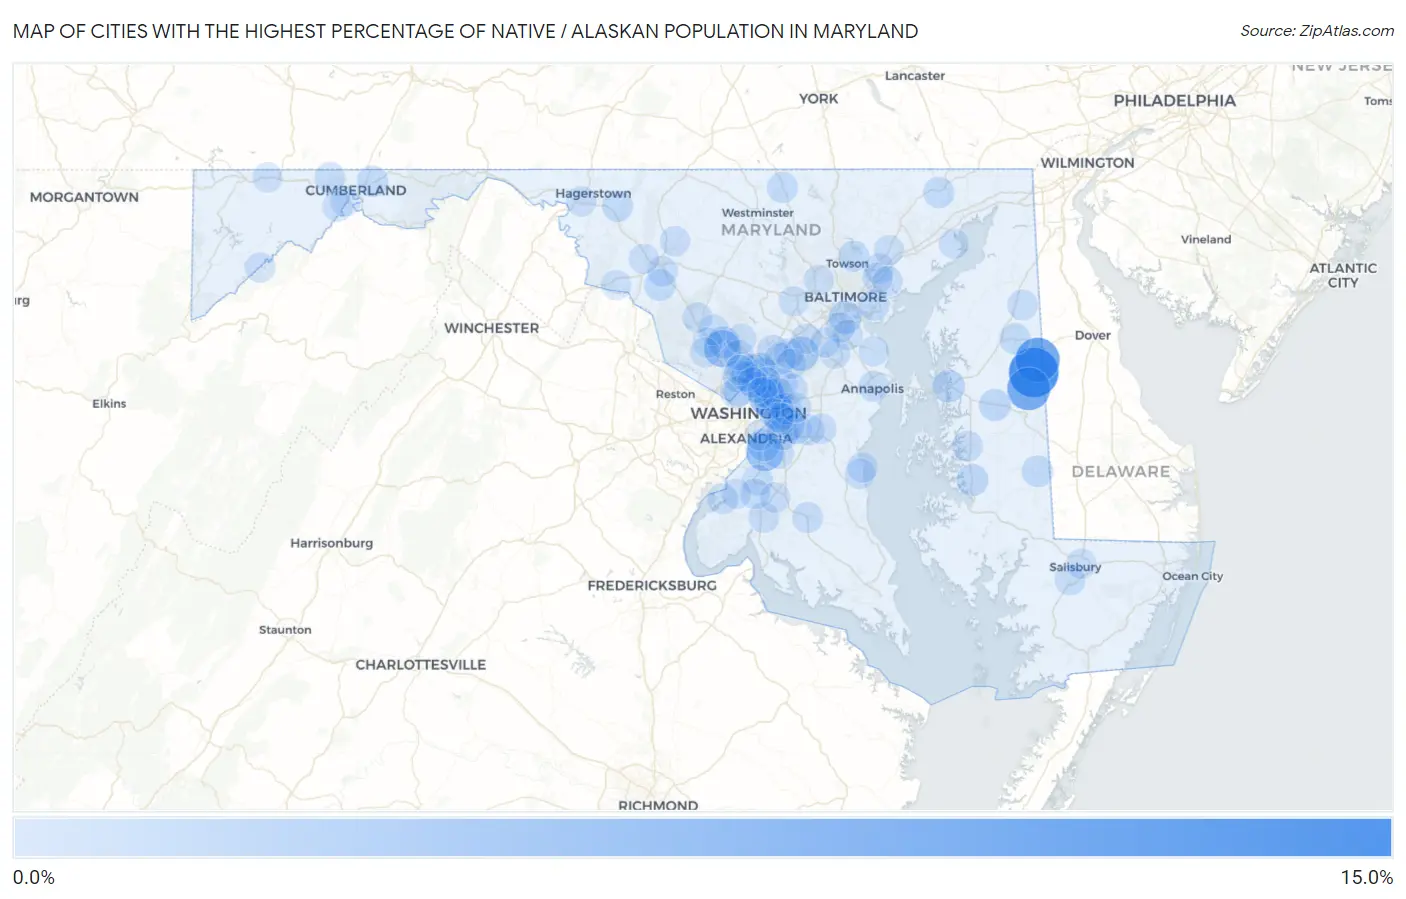
Map of Cities with the Highest Percentage of Native / Alaskan Population in Maryland
0.0%
15.0%
Cities with the Highest Percentage of Native / Alaskan Population in Maryland
| City | Native / Alaskan | vs State | vs National | |
| 1. | Goldsboro | 13.7% | 0.30%(+13.4)#1 | 0.84%(+12.9)#1,173 |
| 2. | Henderson | 10.1% | 0.30%(+9.77)#2 | 0.84%(+9.23)#1,383 |
| 3. | Greensboro | 9.1% | 0.30%(+8.80)#3 | 0.84%(+8.26)#1,446 |
| 4. | Maryland Park | 5.3% | 0.30%(+5.01)#4 | 0.84%(+4.46)#1,924 |
| 5. | Friendly | 5.2% | 0.30%(+4.88)#5 | 0.84%(+4.34)#1,945 |
| 6. | Derwood | 4.9% | 0.30%(+4.62)#6 | 0.84%(+4.08)#2,014 |
| 7. | Brentwood | 4.8% | 0.30%(+4.51)#7 | 0.84%(+3.97)#2,034 |
| 8. | Fairmount Heights | 3.6% | 0.30%(+3.33)#8 | 0.84%(+2.78)#2,393 |
| 9. | Maryland City | 3.3% | 0.30%(+2.97)#9 | 0.84%(+2.42)#2,532 |
| 10. | Hillandale | 2.8% | 0.30%(+2.54)#10 | 0.84%(+2.00)#2,745 |
| 11. | Brooklyn Park | 2.3% | 0.30%(+2.01)#11 | 0.84%(+1.47)#3,099 |
| 12. | Forestville | 2.2% | 0.30%(+1.90)#12 | 0.84%(+1.35)#3,201 |
| 13. | Oxon Hill | 1.9% | 0.30%(+1.60)#13 | 0.84%(+1.06)#3,515 |
| 14. | Colmar Manor | 1.8% | 0.30%(+1.55)#14 | 0.84%(+1.01)#3,585 |
| 15. | Queenstown | 1.8% | 0.30%(+1.54)#15 | 0.84%(+0.999)#3,592 |
| 16. | White Oak | 1.7% | 0.30%(+1.41)#16 | 0.84%(+0.869)#3,765 |
| 17. | Morningside | 1.6% | 0.30%(+1.34)#17 | 0.84%(+0.801)#3,874 |
| 18. | Redland | 1.6% | 0.30%(+1.28)#18 | 0.84%(+0.739)#3,964 |
| 19. | South Kensington | 1.6% | 0.30%(+1.26)#19 | 0.84%(+0.711)#4,005 |
| 20. | Queen Anne | 1.5% | 0.30%(+1.22)#20 | 0.84%(+0.674)#4,064 |
| 21. | Trappe | 1.5% | 0.30%(+1.17)#21 | 0.84%(+0.630)#4,131 |
| 22. | Hyattsville | 1.4% | 0.30%(+1.06)#22 | 0.84%(+0.516)#4,338 |
| 23. | East Riverdale | 1.3% | 0.30%(+1.03)#23 | 0.84%(+0.486)#4,384 |
| 24. | Buckeystown | 1.3% | 0.30%(+0.998)#24 | 0.84%(+0.454)#4,452 |
| 25. | Federalsburg | 1.3% | 0.30%(+0.980)#25 | 0.84%(+0.436)#4,483 |
| 26. | Kemp Mill | 1.3% | 0.30%(+0.958)#26 | 0.84%(+0.414)#4,524 |
| 27. | Friendship Heights Village | 1.2% | 0.30%(+0.861)#27 | 0.84%(+0.317)#4,744 |
| 28. | Barclay | 1.1% | 0.30%(+0.845)#28 | 0.84%(+0.301)#4,792 |
| 29. | Darlington | 1.0% | 0.30%(+0.748)#29 | 0.84%(+0.204)#5,039 |
| 30. | Pleasant Grove | 1.0% | 0.30%(+0.748)#30 | 0.84%(+0.204)#5,043 |
| 31. | Konterra | 1.0% | 0.30%(+0.733)#31 | 0.84%(+0.189)#5,090 |
| 32. | Summerfield | 0.97% | 0.30%(+0.668)#32 | 0.84%(+0.125)#5,303 |
| 33. | Dundalk | 0.97% | 0.30%(+0.667)#33 | 0.84%(+0.123)#5,305 |
| 34. | Takoma Park | 0.96% | 0.30%(+0.666)#34 | 0.84%(+0.122)#5,313 |
| 35. | Manchester | 0.93% | 0.30%(+0.628)#35 | 0.84%(+0.084)#5,442 |
| 36. | Hampton | 0.91% | 0.30%(+0.608)#36 | 0.84%(+0.064)#5,509 |
| 37. | Mount Aetna | 0.90% | 0.30%(+0.603)#37 | 0.84%(+0.059)#5,529 |
| 38. | Walker Mill | 0.86% | 0.30%(+0.565)#38 | 0.84%(+0.021)#5,675 |
| 39. | Mount Savage | 0.86% | 0.30%(+0.561)#39 | 0.84%(+0.018)#5,690 |
| 40. | Marlboro Village | 0.85% | 0.30%(+0.557)#40 | 0.84%(+0.013)#5,710 |
| 41. | Naval Academy | 0.84% | 0.30%(+0.546)#41 | 0.84%(+0.002)#5,755 |
| 42. | Easton | 0.82% | 0.30%(+0.526)#42 | 0.84%(-0.018)#5,832 |
| 43. | Glassmanor | 0.82% | 0.30%(+0.521)#43 | 0.84%(-0.023)#5,857 |
| 44. | Indian Head | 0.81% | 0.30%(+0.516)#44 | 0.84%(-0.028)#5,872 |
| 45. | Hughesville | 0.78% | 0.30%(+0.485)#45 | 0.84%(-0.059)#5,997 |
| 46. | Wheaton | 0.74% | 0.30%(+0.445)#46 | 0.84%(-0.099)#6,158 |
| 47. | Accokeek | 0.73% | 0.30%(+0.432)#47 | 0.84%(-0.112)#6,209 |
| 48. | Burtonsville | 0.69% | 0.30%(+0.391)#48 | 0.84%(-0.153)#6,387 |
| 49. | Westphalia | 0.68% | 0.30%(+0.386)#49 | 0.84%(-0.158)#6,404 |
| 50. | Laurel | 0.67% | 0.30%(+0.368)#50 | 0.84%(-0.176)#6,484 |
| 51. | Fruitland | 0.66% | 0.30%(+0.363)#51 | 0.84%(-0.181)#6,517 |
| 52. | Millington | 0.64% | 0.30%(+0.344)#52 | 0.84%(-0.200)#6,609 |
| 53. | Chevy Chase Village | 0.64% | 0.30%(+0.339)#53 | 0.84%(-0.205)#6,629 |
| 54. | Greenbelt | 0.62% | 0.30%(+0.323)#54 | 0.84%(-0.221)#6,721 |
| 55. | La Plata | 0.61% | 0.30%(+0.315)#55 | 0.84%(-0.229)#6,762 |
| 56. | Ballenger Creek | 0.60% | 0.30%(+0.307)#56 | 0.84%(-0.237)#6,807 |
| 57. | Adelphi | 0.58% | 0.30%(+0.287)#57 | 0.84%(-0.257)#6,916 |
| 58. | Forest Glen | 0.58% | 0.30%(+0.285)#58 | 0.84%(-0.258)#6,921 |
| 59. | Cresaptown | 0.57% | 0.30%(+0.271)#59 | 0.84%(-0.273)#7,015 |
| 60. | Chesapeake Beach | 0.55% | 0.30%(+0.253)#60 | 0.84%(-0.291)#7,128 |
| 61. | Jessup | 0.54% | 0.30%(+0.244)#61 | 0.84%(-0.300)#7,181 |
| 62. | Glen Burnie | 0.54% | 0.30%(+0.243)#62 | 0.84%(-0.301)#7,191 |
| 63. | Marlboro Meadows | 0.53% | 0.30%(+0.235)#63 | 0.84%(-0.309)#7,232 |
| 64. | Halfway | 0.53% | 0.30%(+0.231)#64 | 0.84%(-0.313)#7,261 |
| 65. | White Marsh | 0.51% | 0.30%(+0.215)#65 | 0.84%(-0.329)#7,348 |
| 66. | Aspen Hill | 0.51% | 0.30%(+0.213)#66 | 0.84%(-0.331)#7,359 |
| 67. | Rossville | 0.50% | 0.30%(+0.199)#67 | 0.84%(-0.345)#7,455 |
| 68. | Bensville | 0.49% | 0.30%(+0.188)#68 | 0.84%(-0.356)#7,523 |
| 69. | Middle River | 0.47% | 0.30%(+0.168)#69 | 0.84%(-0.376)#7,662 |
| 70. | Montgomery Village | 0.46% | 0.30%(+0.166)#70 | 0.84%(-0.378)#7,682 |
| 71. | Clarksburg | 0.46% | 0.30%(+0.161)#71 | 0.84%(-0.383)#7,720 |
| 72. | Gambrills | 0.45% | 0.30%(+0.152)#72 | 0.84%(-0.392)#7,773 |
| 73. | Kitzmiller | 0.45% | 0.30%(+0.149)#73 | 0.84%(-0.395)#7,797 |
| 74. | Seabrook | 0.44% | 0.30%(+0.146)#74 | 0.84%(-0.398)#7,811 |
| 75. | Lake Shore | 0.42% | 0.30%(+0.126)#75 | 0.84%(-0.418)#7,959 |
| 76. | Capitol Heights | 0.42% | 0.30%(+0.124)#76 | 0.84%(-0.420)#7,975 |
| 77. | Waldorf | 0.42% | 0.30%(+0.123)#77 | 0.84%(-0.421)#7,986 |
| 78. | Walkersville | 0.42% | 0.30%(+0.119)#78 | 0.84%(-0.425)#8,015 |
| 79. | North Beach | 0.42% | 0.30%(+0.118)#79 | 0.84%(-0.426)#8,021 |
| 80. | Potomac Park | 0.41% | 0.30%(+0.112)#80 | 0.84%(-0.432)#8,059 |
| 81. | Kingsville | 0.41% | 0.30%(+0.111)#81 | 0.84%(-0.433)#8,073 |
| 82. | Silver Spring | 0.39% | 0.30%(+0.092)#82 | 0.84%(-0.452)#8,225 |
| 83. | Clinton | 0.39% | 0.30%(+0.090)#83 | 0.84%(-0.454)#8,234 |
| 84. | Chillum | 0.38% | 0.30%(+0.084)#84 | 0.84%(-0.460)#8,294 |
| 85. | South Laurel | 0.38% | 0.30%(+0.082)#85 | 0.84%(-0.462)#8,308 |
| 86. | Salisbury | 0.38% | 0.30%(+0.082)#86 | 0.84%(-0.462)#8,317 |
| 87. | Ferndale | 0.37% | 0.30%(+0.074)#87 | 0.84%(-0.470)#8,393 |
| 88. | Aberdeen Proving Ground | 0.37% | 0.30%(+0.072)#88 | 0.84%(-0.472)#8,410 |
| 89. | North Kensington | 0.37% | 0.30%(+0.068)#89 | 0.84%(-0.476)#8,442 |
| 90. | Gaithersburg | 0.35% | 0.30%(+0.057)#90 | 0.84%(-0.487)#8,531 |
| 91. | Braddock Heights | 0.35% | 0.30%(+0.052)#91 | 0.84%(-0.492)#8,573 |
| 92. | Severn | 0.35% | 0.30%(+0.051)#92 | 0.84%(-0.493)#8,581 |
| 93. | Lake Arbor | 0.35% | 0.30%(+0.051)#93 | 0.84%(-0.493)#8,582 |
| 94. | Olney | 0.34% | 0.30%(+0.043)#94 | 0.84%(-0.501)#8,660 |
| 95. | Rosemont | 0.34% | 0.30%(+0.038)#95 | 0.84%(-0.506)#8,732 |
| 96. | North Potomac | 0.33% | 0.30%(+0.030)#96 | 0.84%(-0.514)#8,811 |
| 97. | Lochearn | 0.32% | 0.30%(+0.024)#97 | 0.84%(-0.520)#8,873 |
| 98. | Grantsville | 0.31% | 0.30%(+0.016)#98 | 0.84%(-0.528)#8,953 |
| 99. | Ellicott City | 0.30% | 0.30%(+0.007)#99 | 0.84%(-0.537)#9,056 |
| 100. | Bryans Road | 0.30% | 0.30%(+0.005)#100 | 0.84%(-0.539)#9,074 |
Common Questions
What are the Top 10 Cities with the Highest Percentage of Native / Alaskan Population in Maryland?
Top 10 Cities with the Highest Percentage of Native / Alaskan Population in Maryland are:
#1
13.7%
#2
10.1%
#3
9.1%
#4
5.2%
#5
4.9%
#6
4.8%
#7
3.6%
#8
3.3%
#9
2.8%
#10
2.3%
What city has the Highest Percentage of Native / Alaskan Population in Maryland?
Goldsboro has the Highest Percentage of Native / Alaskan Population in Maryland with 13.7%.
What is the Percentage of Native / Alaskan Population in the State of Maryland?
Percentage of Native / Alaskan Population in Maryland is 0.30%.
What is the Percentage of Native / Alaskan Population in the United States?
Percentage of Native / Alaskan Population in the United States is 0.84%.