Mount Savage, MD
Mount Savage Map
Mount Savage Overview
582
TOTAL POPULATION
340
MALE POPULATION
242
FEMALE POPULATION
140.50
MALES / 100 FEMALES
71.18
FEMALES / 100 MALES
54.0
MEDIAN AGE
2.9
AVG FAMILY SIZE
2.5
AVG HOUSEHOLD SIZE
$42,460
PER CAPITA INCOME
$66,042
AVG FAMILY INCOME
$48,355
AVG HOUSEHOLD INCOME
0.60
INEQUALITY / GINI INDEX
320
LABOR FORCE [ PEOPLE ]
61.2%
PERCENT IN LABOR FORCE
20.6%
UNEMPLOYMENT RATE
Mount Savage Zip Codes
Mount Savage Area Codes
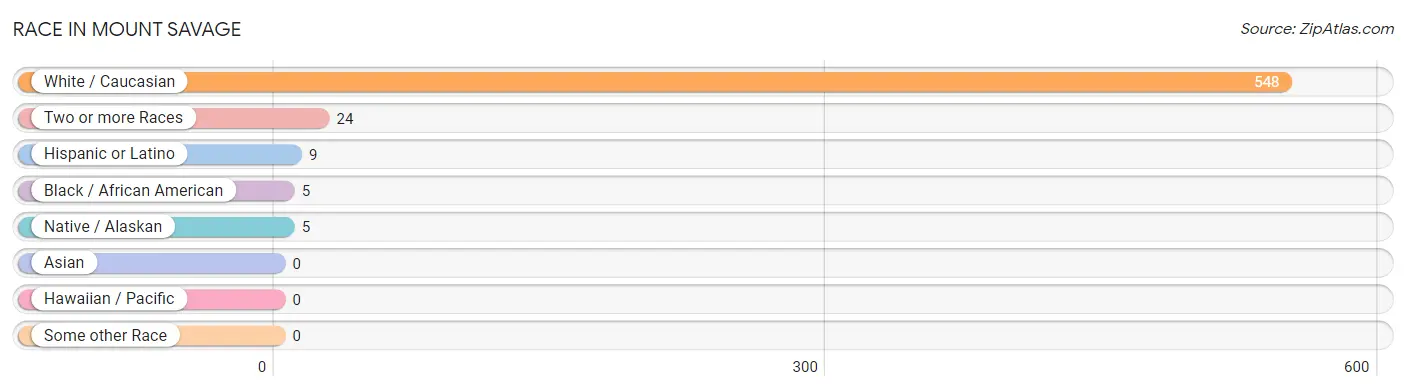
Race in Mount Savage
The most populous races in Mount Savage are White / Caucasian (548 | 94.2%), Two or more Races (24 | 4.1%), and Hispanic or Latino (9 | 1.5%).
| Race | # Population | % Population |
| Asian | 0 | 0.0% |
| Black / African American | 5 | 0.9% |
| Hawaiian / Pacific | 0 | 0.0% |
| Hispanic or Latino | 9 | 1.5% |
| Native / Alaskan | 5 | 0.9% |
| White / Caucasian | 548 | 94.2% |
| Two or more Races | 24 | 4.1% |
| Some other Race | 0 | 0.0% |
| Total | 582 | 100.0% |
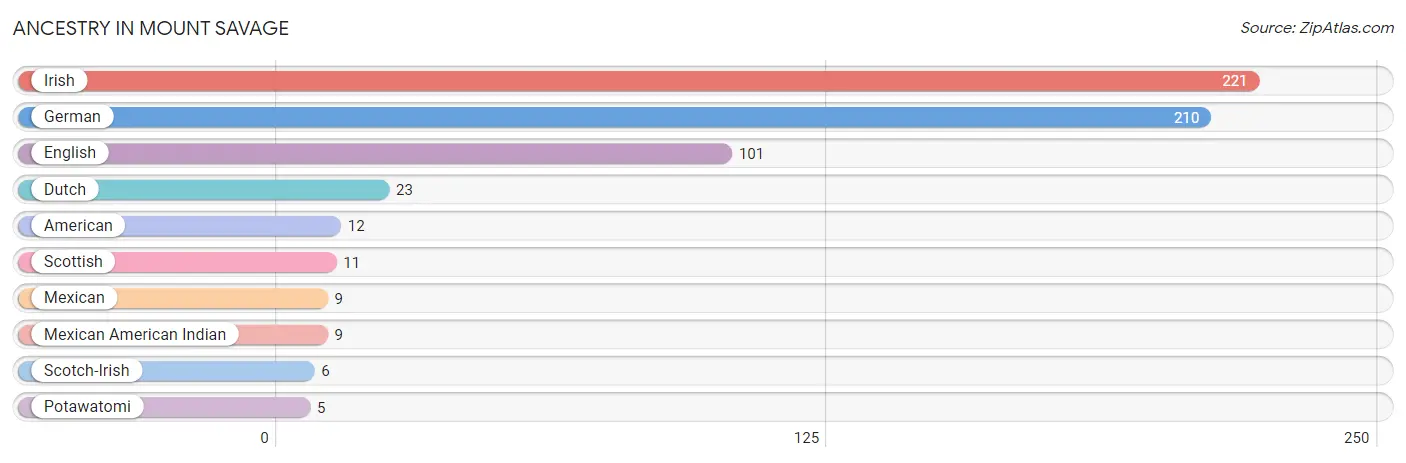
Ancestry in Mount Savage
The most populous ancestries reported in Mount Savage are Irish (221 | 38.0%), German (210 | 36.1%), English (101 | 17.3%), Dutch (23 | 4.0%), and American (12 | 2.1%), together accounting for 97.4% of all Mount Savage residents.
| Ancestry | # Population | % Population |
| American | 12 | 2.1% |
| Dutch | 23 | 4.0% |
| English | 101 | 17.3% |
| German | 210 | 36.1% |
| Irish | 221 | 38.0% |
| Mexican | 9 | 1.5% |
| Mexican American Indian | 9 | 1.5% |
| Potawatomi | 5 | 0.9% |
| Scotch-Irish | 6 | 1.0% |
| Scottish | 11 | 1.9% | View All 10 Rows |
Immigrants in Mount Savage

| Immigration Origin | # Population | % Population | View All 0 Rows |
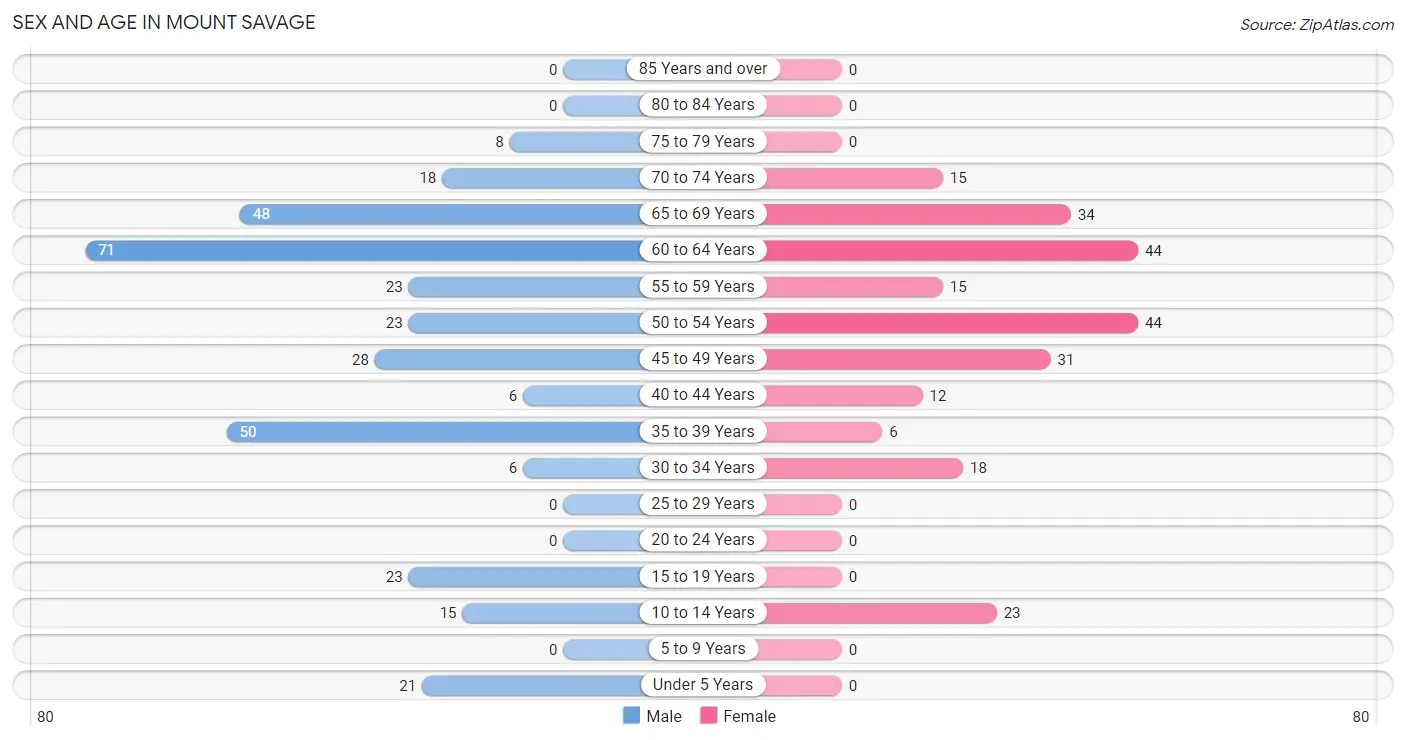
Sex and Age in Mount Savage
Sex and Age in Mount Savage
The most populous age groups in Mount Savage are 60 to 64 Years (71 | 20.9%) for men and 50 to 54 Years (44 | 18.2%) for women.
| Age Bracket | Male | Female |
| Under 5 Years | 21 (6.2%) | 0 (0.0%) |
| 5 to 9 Years | 0 (0.0%) | 0 (0.0%) |
| 10 to 14 Years | 15 (4.4%) | 23 (9.5%) |
| 15 to 19 Years | 23 (6.8%) | 0 (0.0%) |
| 20 to 24 Years | 0 (0.0%) | 0 (0.0%) |
| 25 to 29 Years | 0 (0.0%) | 0 (0.0%) |
| 30 to 34 Years | 6 (1.8%) | 18 (7.4%) |
| 35 to 39 Years | 50 (14.7%) | 6 (2.5%) |
| 40 to 44 Years | 6 (1.8%) | 12 (5.0%) |
| 45 to 49 Years | 28 (8.2%) | 31 (12.8%) |
| 50 to 54 Years | 23 (6.8%) | 44 (18.2%) |
| 55 to 59 Years | 23 (6.8%) | 15 (6.2%) |
| 60 to 64 Years | 71 (20.9%) | 44 (18.2%) |
| 65 to 69 Years | 48 (14.1%) | 34 (14.1%) |
| 70 to 74 Years | 18 (5.3%) | 15 (6.2%) |
| 75 to 79 Years | 8 (2.4%) | 0 (0.0%) |
| 80 to 84 Years | 0 (0.0%) | 0 (0.0%) |
| 85 Years and over | 0 (0.0%) | 0 (0.0%) |
| Total | 340 (100.0%) | 242 (100.0%) |
Families and Households in Mount Savage
Median Family Size in Mount Savage
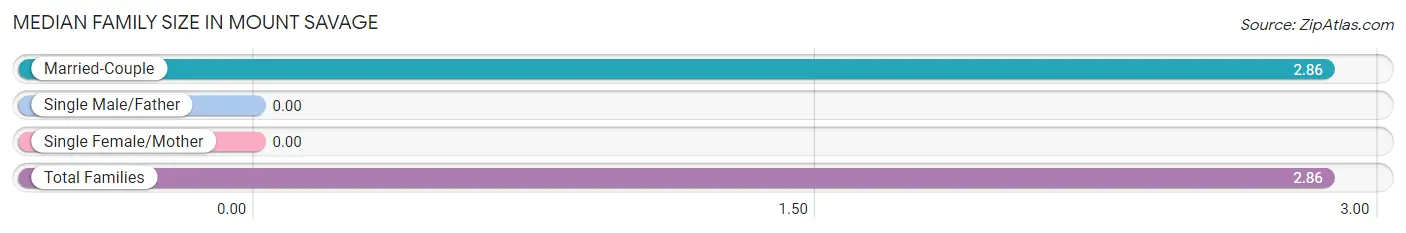
| Family Type | # Families | Family Size |
| Married-Couple | 167 (100.0%) | 2.86 |
| Single Male/Father | 0 (0.0%) | - |
| Single Female/Mother | 0 (0.0%) | - |
| Total Families | 167 (100.0%) | 2.86 |
Median Household Size in Mount Savage
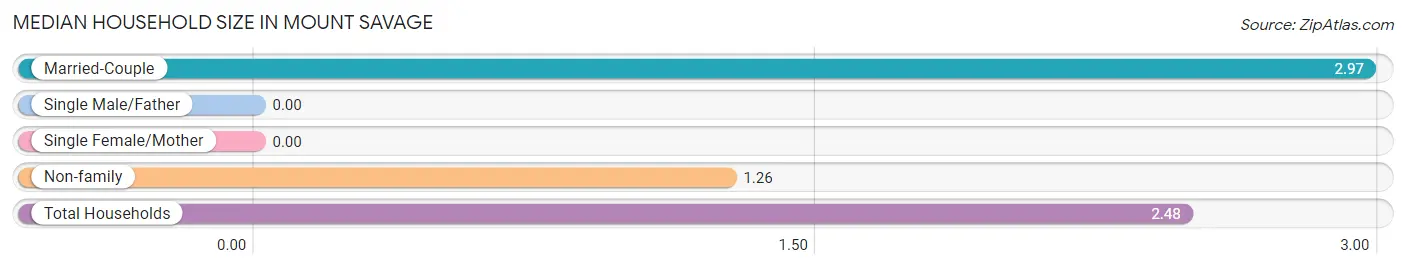
| Household Type | # Households | Household Size |
| Married-Couple | 167 (71.1%) | 2.97 |
| Single Male/Father | 0 (0.0%) | - |
| Single Female/Mother | 0 (0.0%) | - |
| Non-family | 68 (28.9%) | 1.26 |
| Total Households | 235 (100.0%) | 2.48 |
Household Size by Marriage Status in Mount Savage
Out of a total of 235 households in Mount Savage, 167 (71.1%) are family households, while 68 (28.9%) are nonfamily households. The most numerous type of family households are 2-person households, comprising 105, and the most common type of nonfamily households are 1-person households, comprising 58.
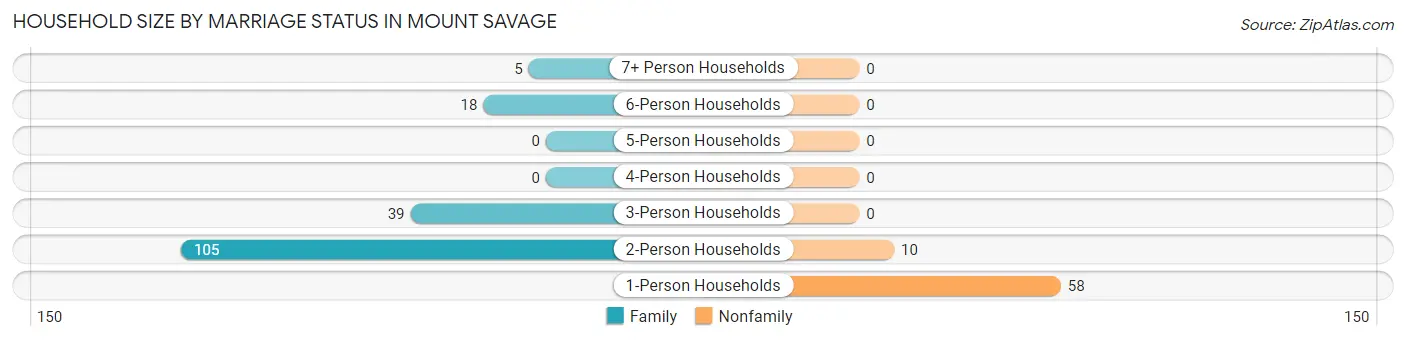
| Household Size | Family Households | Nonfamily Households |
| 1-Person Households | - | 58 (24.7%) |
| 2-Person Households | 105 (44.7%) | 10 (4.3%) |
| 3-Person Households | 39 (16.6%) | 0 (0.0%) |
| 4-Person Households | 0 (0.0%) | 0 (0.0%) |
| 5-Person Households | 0 (0.0%) | 0 (0.0%) |
| 6-Person Households | 18 (7.7%) | 0 (0.0%) |
| 7+ Person Households | 5 (2.1%) | 0 (0.0%) |
| Total | 167 (71.1%) | 68 (28.9%) |
Female Fertility in Mount Savage
Fertility by Age in Mount Savage
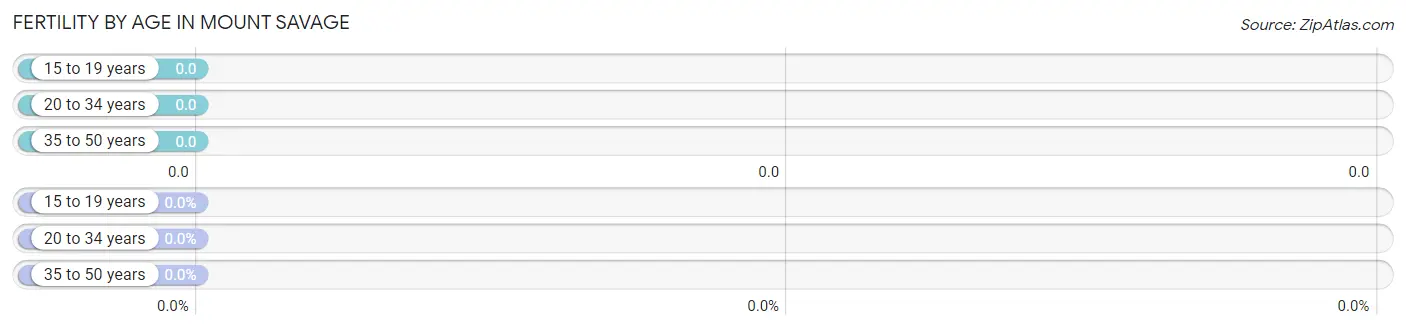
| Age Bracket | Women with Births | Births / 1,000 Women |
| 15 to 19 years | 0 (0.0%) | 0.0 |
| 20 to 34 years | 0 (0.0%) | 0.0 |
| 35 to 50 years | 0 (0.0%) | 0.0 |
| Total | 0 (0.0%) | 0.0 |
Fertility by Age by Marriage Status in Mount Savage
| Age Bracket | Married | Unmarried |
| 15 to 19 years | 0 (0.0%) | 0 (0.0%) |
| 20 to 34 years | 0 (0.0%) | 0 (0.0%) |
| 35 to 50 years | 0 (0.0%) | 0 (0.0%) |
| Total | 0 (0.0%) | 0 (0.0%) |
Fertility by Education in Mount Savage

| Educational Attainment | Women with Births | Births / 1,000 Women |
| Less than High School | 0 (0.0%) | 0.0 |
| High School Diploma | 0 (0.0%) | 0.0 |
| College or Associate's Degree | 0 (0.0%) | 0.0 |
| Bachelor's Degree | 0 (0.0%) | 0.0 |
| Graduate Degree | 0 (0.0%) | 0.0 |
| Total | 0 (0.0%) | 0.0 |
Fertility by Education by Marriage Status in Mount Savage
| Educational Attainment | Married | Unmarried |
| Less than High School | 0 (0.0%) | 0 (0.0%) |
| High School Diploma | 0 (0.0%) | 0 (0.0%) |
| College or Associate's Degree | 0 (0.0%) | 0 (0.0%) |
| Bachelor's Degree | 0 (0.0%) | 0 (0.0%) |
| Graduate Degree | 0 (0.0%) | 0 (0.0%) |
| Total | 0 (0.0%) | 0 (0.0%) |
Income in Mount Savage
Income Overview in Mount Savage
Per Capita Income in Mount Savage is $42,460, while median incomes of families and households are $66,042 and $48,355 respectively.
| Characteristic | Number | Measure |
| Per Capita Income | 582 | $42,460 |
| Median Family Income | 167 | $66,042 |
| Mean Family Income | 167 | $120,893 |
| Median Household Income | 235 | $48,355 |
| Mean Household Income | 235 | $95,737 |
| Income Deficit | 167 | $0 |
| Wage / Income Gap (%) | 582 | 0.00% |
| Wage / Income Gap ($) | 582 | 100.00¢ per $1 |
| Gini / Inequality Index | 582 | 0.60 |
Earnings by Sex in Mount Savage
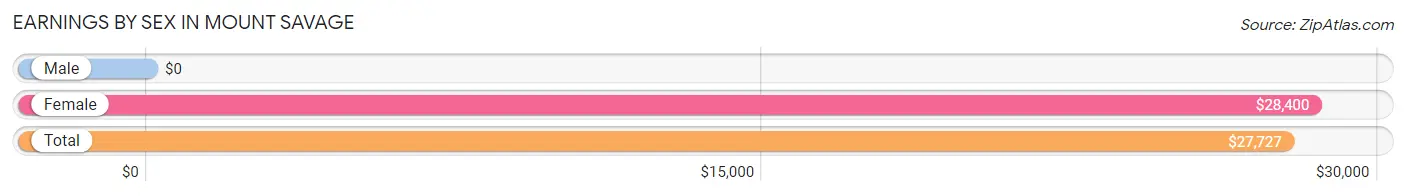
| Sex | Number | Average Earnings |
| Male | 160 (47.6%) | $0 |
| Female | 176 (52.4%) | $28,400 |
| Total | 336 (100.0%) | $27,727 |
Earnings by Sex by Income Bracket in Mount Savage
The most common earnings brackets in Mount Savage are $2,500 to $4,999 for men (28 | 17.5%) and $25,000 to $29,999 for women (25 | 14.2%).
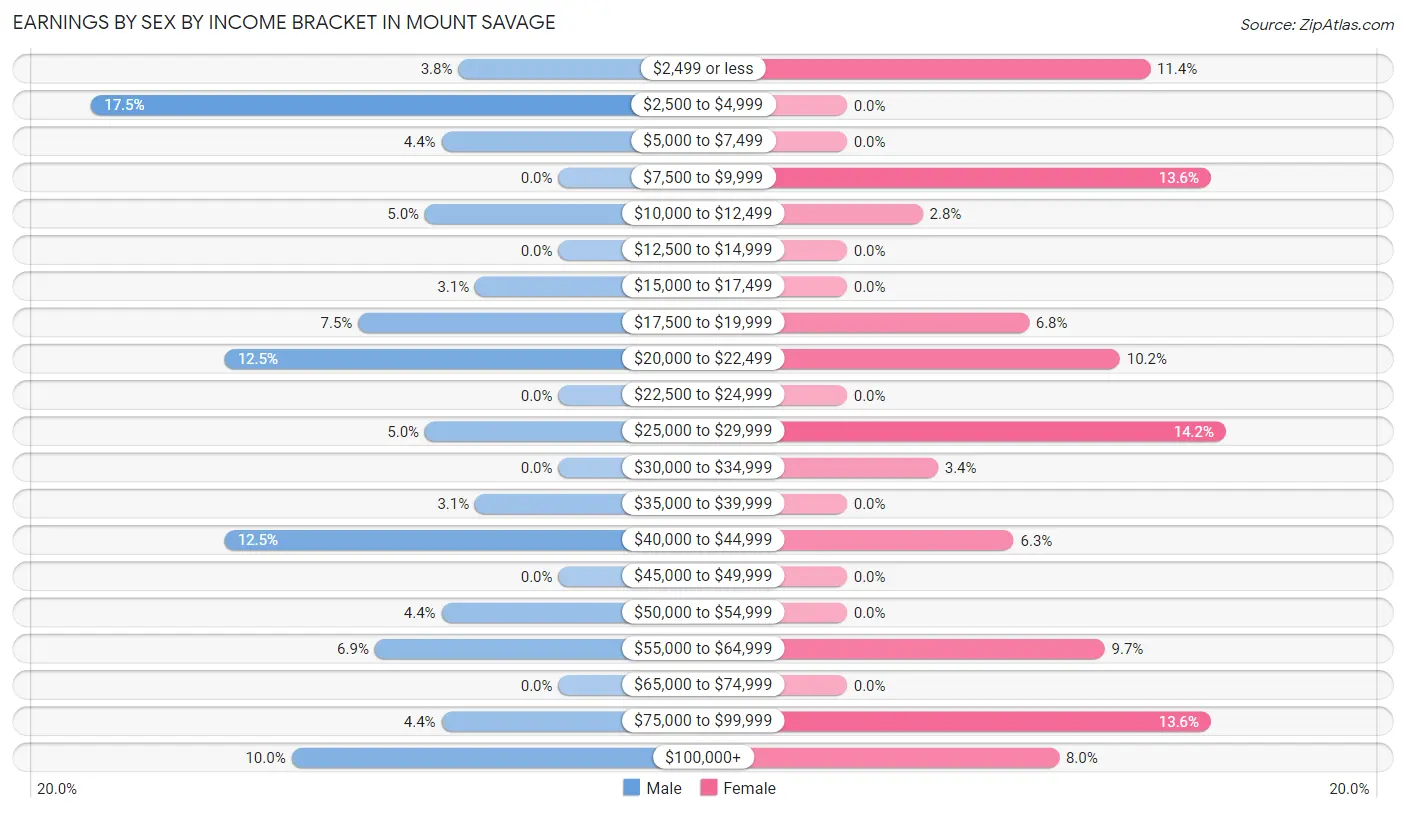
| Income | Male | Female |
| $2,499 or less | 6 (3.7%) | 20 (11.4%) |
| $2,500 to $4,999 | 28 (17.5%) | 0 (0.0%) |
| $5,000 to $7,499 | 7 (4.4%) | 0 (0.0%) |
| $7,500 to $9,999 | 0 (0.0%) | 24 (13.6%) |
| $10,000 to $12,499 | 8 (5.0%) | 5 (2.8%) |
| $12,500 to $14,999 | 0 (0.0%) | 0 (0.0%) |
| $15,000 to $17,499 | 5 (3.1%) | 0 (0.0%) |
| $17,500 to $19,999 | 12 (7.5%) | 12 (6.8%) |
| $20,000 to $22,499 | 20 (12.5%) | 18 (10.2%) |
| $22,500 to $24,999 | 0 (0.0%) | 0 (0.0%) |
| $25,000 to $29,999 | 8 (5.0%) | 25 (14.2%) |
| $30,000 to $34,999 | 0 (0.0%) | 6 (3.4%) |
| $35,000 to $39,999 | 5 (3.1%) | 0 (0.0%) |
| $40,000 to $44,999 | 20 (12.5%) | 11 (6.2%) |
| $45,000 to $49,999 | 0 (0.0%) | 0 (0.0%) |
| $50,000 to $54,999 | 7 (4.4%) | 0 (0.0%) |
| $55,000 to $64,999 | 11 (6.9%) | 17 (9.7%) |
| $65,000 to $74,999 | 0 (0.0%) | 0 (0.0%) |
| $75,000 to $99,999 | 7 (4.4%) | 24 (13.6%) |
| $100,000+ | 16 (10.0%) | 14 (8.0%) |
| Total | 160 (100.0%) | 176 (100.0%) |
Earnings by Sex by Educational Attainment in Mount Savage
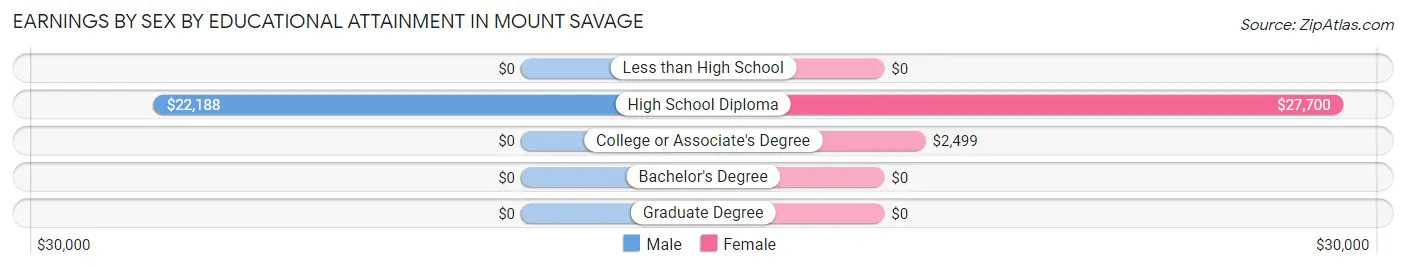
| Educational Attainment | Male Income | Female Income |
| Less than High School | - | - |
| High School Diploma | $22,188 | $27,700 |
| College or Associate's Degree | - | - |
| Bachelor's Degree | - | - |
| Graduate Degree | - | - |
| Total | - | - |
Family Income in Mount Savage
Family Income Brackets in Mount Savage
According to the Mount Savage family income data, there are 39 families falling into the $50,000 to $74,999 income range, which is the most common income bracket and makes up 23.4% of all families.
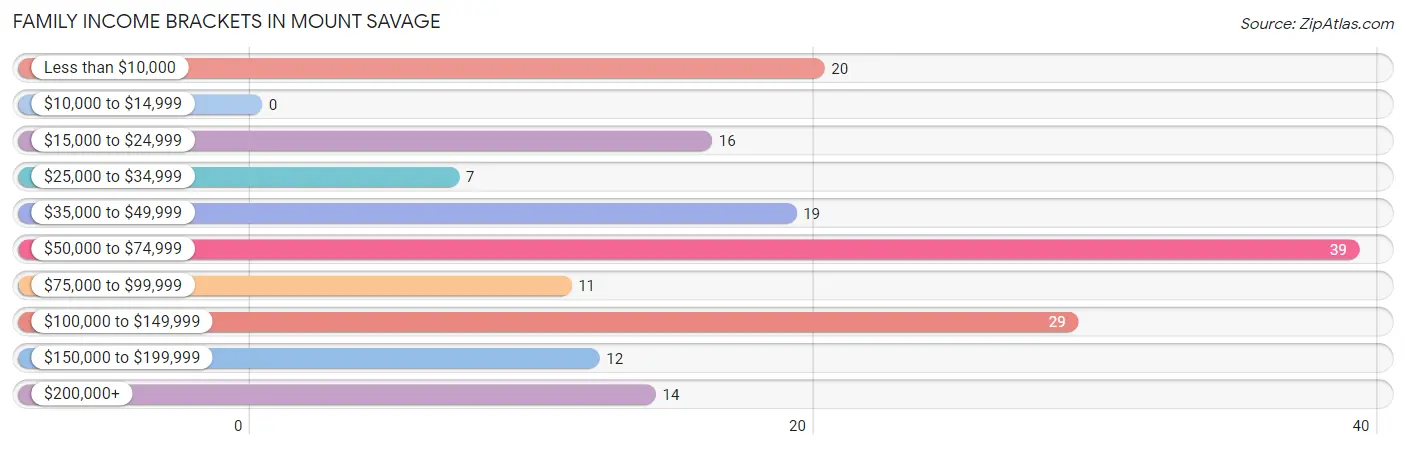
| Income Bracket | # Families | % Families |
| Less than $10,000 | 20 | 12.0% |
| $10,000 to $14,999 | 0 | 0.0% |
| $15,000 to $24,999 | 16 | 9.6% |
| $25,000 to $34,999 | 7 | 4.2% |
| $35,000 to $49,999 | 19 | 11.4% |
| $50,000 to $74,999 | 39 | 23.4% |
| $75,000 to $99,999 | 11 | 6.6% |
| $100,000 to $149,999 | 29 | 17.4% |
| $150,000 to $199,999 | 12 | 7.2% |
| $200,000+ | 14 | 8.4% |
Family Income by Famaliy Size in Mount Savage
3-person families (39 | 23.4%) account for the highest median family income in Mount Savage with $135,156 per family, while 3-person families (39 | 23.4%) have the highest median income of $45,052 per family member.
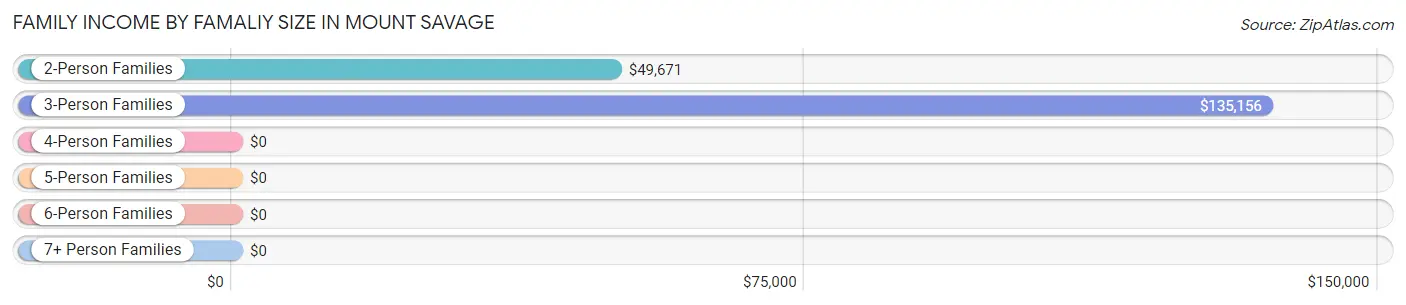
| Income Bracket | # Families | Median Income |
| 2-Person Families | 105 (62.9%) | $49,671 |
| 3-Person Families | 39 (23.4%) | $135,156 |
| 4-Person Families | 0 (0.0%) | $0 |
| 5-Person Families | 18 (10.8%) | $0 |
| 6-Person Families | 0 (0.0%) | $0 |
| 7+ Person Families | 5 (3.0%) | $0 |
| Total | 167 (100.0%) | $66,042 |
Family Income by Number of Earners in Mount Savage
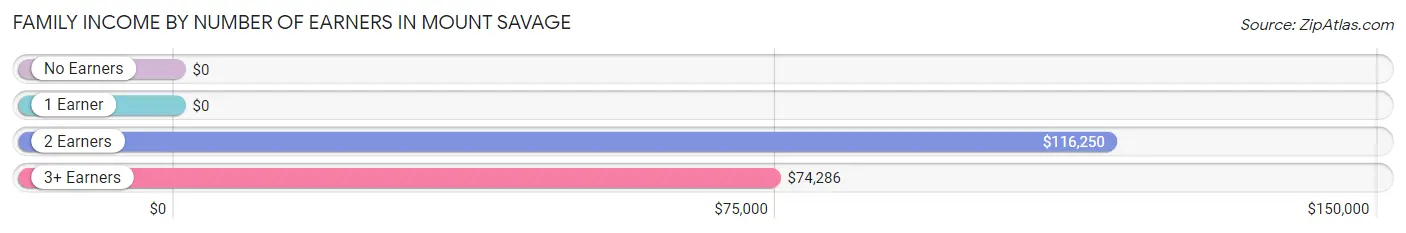
| Number of Earners | # Families | Median Income |
| No Earners | 3 (1.8%) | $0 |
| 1 Earner | 67 (40.1%) | $0 |
| 2 Earners | 73 (43.7%) | $116,250 |
| 3+ Earners | 24 (14.4%) | $74,286 |
| Total | 167 (100.0%) | $66,042 |
Household Income in Mount Savage
Household Income Brackets in Mount Savage
With 45 households falling in the category, the $25,000 to $34,999 income range is the most frequent in Mount Savage, accounting for 19.2% of all households. In contrast, only 8 households (3.4%) fall into the $10,000 to $14,999 income bracket, making it the least populous group.
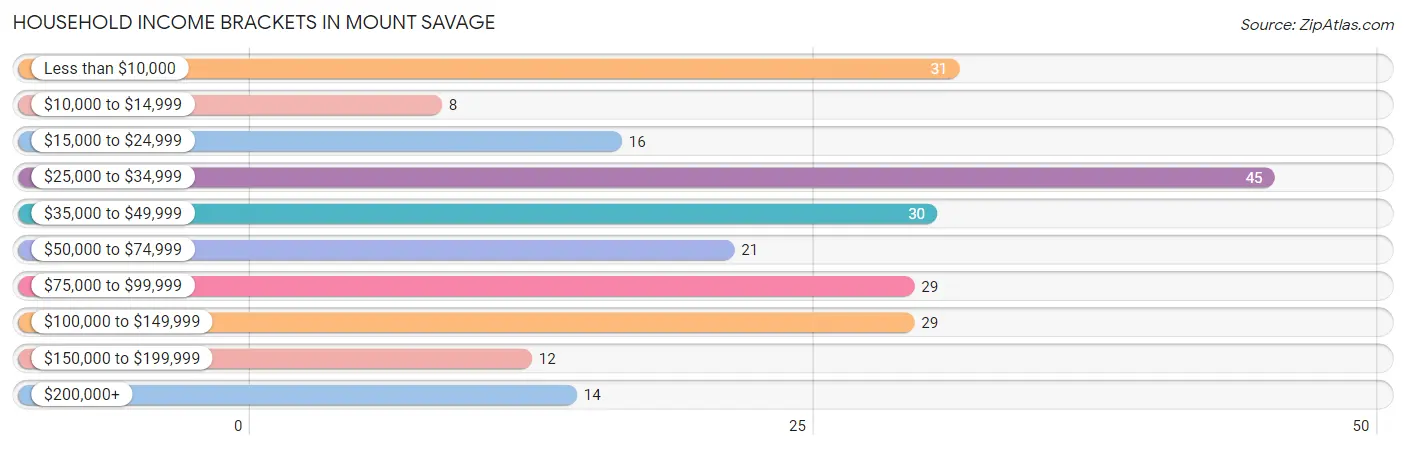
| Income Bracket | # Households | % Households |
| Less than $10,000 | 31 | 13.2% |
| $10,000 to $14,999 | 8 | 3.4% |
| $15,000 to $24,999 | 16 | 6.8% |
| $25,000 to $34,999 | 45 | 19.1% |
| $35,000 to $49,999 | 30 | 12.8% |
| $50,000 to $74,999 | 21 | 8.9% |
| $75,000 to $99,999 | 29 | 12.3% |
| $100,000 to $149,999 | 29 | 12.3% |
| $150,000 to $199,999 | 12 | 5.1% |
| $200,000+ | 14 | 6.0% |
Household Income by Householder Age in Mount Savage
The median household income in Mount Savage is $48,355, with the highest median household income of $106,500 found in the 25 to 44 years age bracket for the primary householder. A total of 20 households (8.5%) fall into this category.
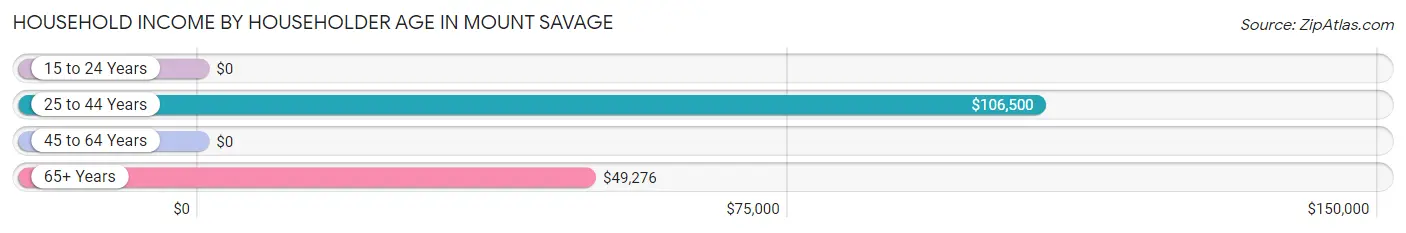
| Income Bracket | # Households | Median Income |
| 15 to 24 Years | 0 (0.0%) | $0 |
| 25 to 44 Years | 20 (8.5%) | $106,500 |
| 45 to 64 Years | 140 (59.6%) | $0 |
| 65+ Years | 75 (31.9%) | $49,276 |
| Total | 235 (100.0%) | $48,355 |
Poverty in Mount Savage
Income Below Poverty by Sex and Age in Mount Savage
With 11.8% poverty level for males and 16.5% for females among the residents of Mount Savage, 45 to 54 year old males and 65 to 74 year old females are the most vulnerable to poverty, with 31 males (60.8%) and 16 females (32.7%) in their respective age groups living below the poverty level.
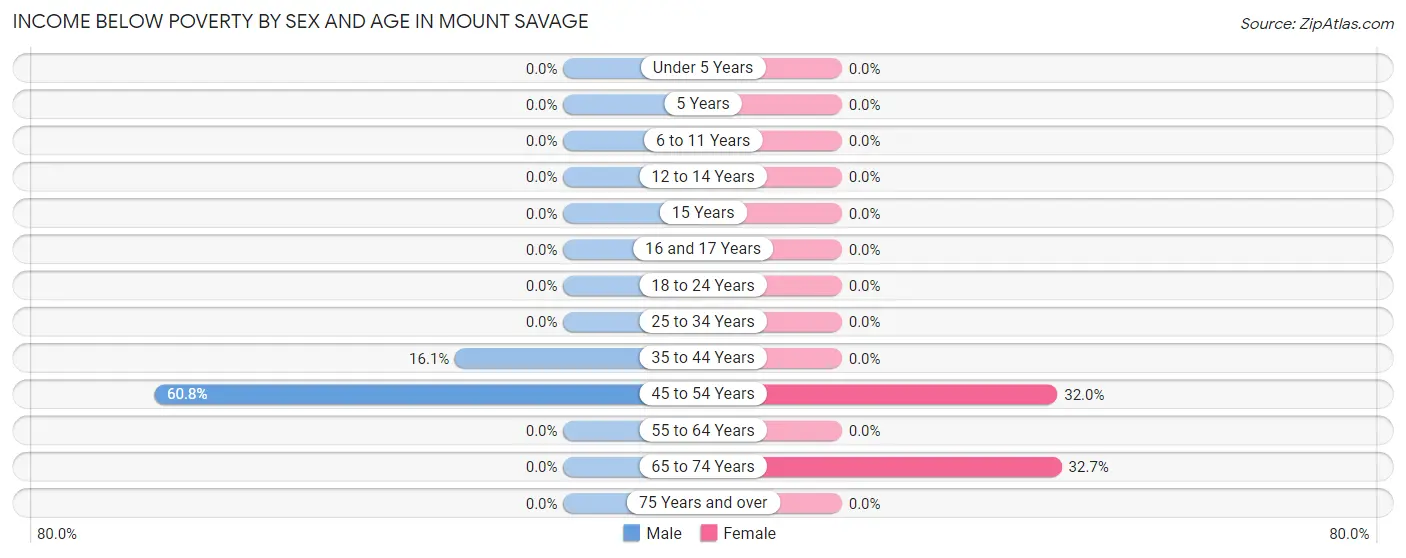
| Age Bracket | Male | Female |
| Under 5 Years | 0 (0.0%) | 0 (0.0%) |
| 5 Years | 0 (0.0%) | 0 (0.0%) |
| 6 to 11 Years | 0 (0.0%) | 0 (0.0%) |
| 12 to 14 Years | 0 (0.0%) | 0 (0.0%) |
| 15 Years | 0 (0.0%) | 0 (0.0%) |
| 16 and 17 Years | 0 (0.0%) | 0 (0.0%) |
| 18 to 24 Years | 0 (0.0%) | 0 (0.0%) |
| 25 to 34 Years | 0 (0.0%) | 0 (0.0%) |
| 35 to 44 Years | 9 (16.1%) | 0 (0.0%) |
| 45 to 54 Years | 31 (60.8%) | 24 (32.0%) |
| 55 to 64 Years | 0 (0.0%) | 0 (0.0%) |
| 65 to 74 Years | 0 (0.0%) | 16 (32.7%) |
| 75 Years and over | 0 (0.0%) | 0 (0.0%) |
| Total | 40 (11.8%) | 40 (16.5%) |
Income Above Poverty by Sex and Age in Mount Savage
According to the poverty statistics in Mount Savage, males aged under 5 years and females aged 12 to 14 years are the age groups that are most secure financially, with 100.0% of males and 100.0% of females in these age groups living above the poverty line.
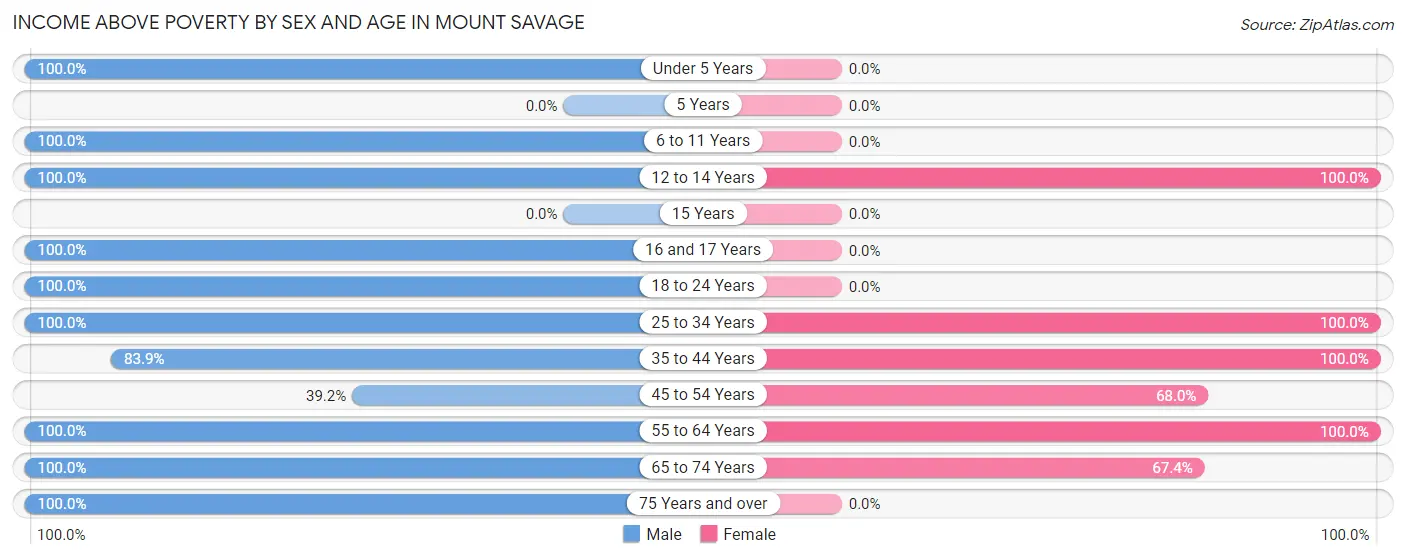
| Age Bracket | Male | Female |
| Under 5 Years | 21 (100.0%) | 0 (0.0%) |
| 5 Years | 0 (0.0%) | 0 (0.0%) |
| 6 to 11 Years | 8 (100.0%) | 0 (0.0%) |
| 12 to 14 Years | 7 (100.0%) | 23 (100.0%) |
| 15 Years | 0 (0.0%) | 0 (0.0%) |
| 16 and 17 Years | 11 (100.0%) | 0 (0.0%) |
| 18 to 24 Years | 12 (100.0%) | 0 (0.0%) |
| 25 to 34 Years | 6 (100.0%) | 18 (100.0%) |
| 35 to 44 Years | 47 (83.9%) | 18 (100.0%) |
| 45 to 54 Years | 20 (39.2%) | 51 (68.0%) |
| 55 to 64 Years | 94 (100.0%) | 59 (100.0%) |
| 65 to 74 Years | 66 (100.0%) | 33 (67.3%) |
| 75 Years and over | 8 (100.0%) | 0 (0.0%) |
| Total | 300 (88.2%) | 202 (83.5%) |
Income Below Poverty Among Married-Couple Families in Mount Savage
The poverty statistics for married-couple families in Mount Savage show that 12.0% or 20 of the total 167 families live below the poverty line. Families with no children have the highest poverty rate of 15.1%, comprising of 20 families. On the other hand, families with 1 or 2 children have the lowest poverty rate of 0.0%, which includes 0 families.
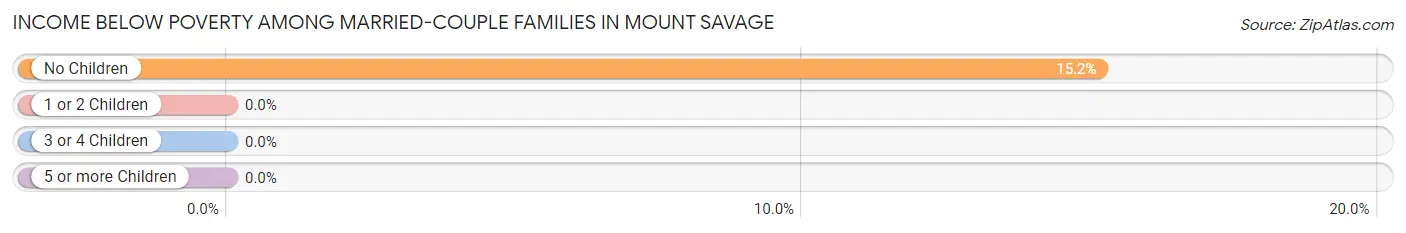
| Children | Above Poverty | Below Poverty |
| No Children | 112 (84.9%) | 20 (15.1%) |
| 1 or 2 Children | 30 (100.0%) | 0 (0.0%) |
| 3 or 4 Children | 5 (100.0%) | 0 (0.0%) |
| 5 or more Children | 0 (0.0%) | 0 (0.0%) |
| Total | 147 (88.0%) | 20 (12.0%) |
Income Below Poverty Among Single-Parent Households in Mount Savage
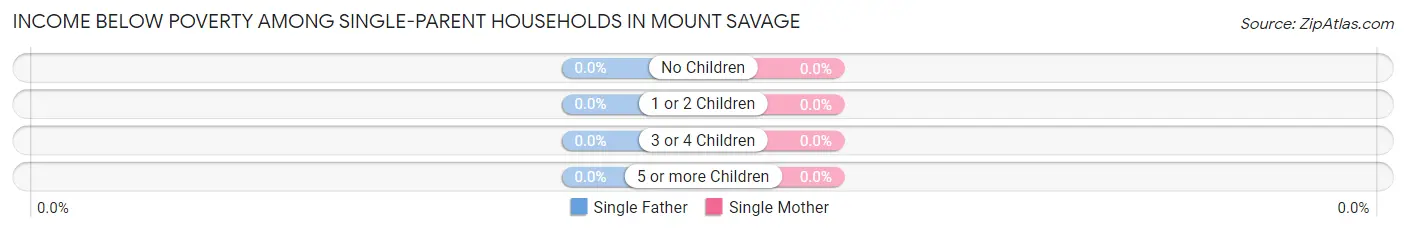
| Children | Single Father | Single Mother |
| No Children | 0 (0.0%) | 0 (0.0%) |
| 1 or 2 Children | 0 (0.0%) | 0 (0.0%) |
| 3 or 4 Children | 0 (0.0%) | 0 (0.0%) |
| 5 or more Children | 0 (0.0%) | 0 (0.0%) |
| Total | 0 (0.0%) | 0 (0.0%) |
Income Below Poverty Among Married-Couple vs Single-Parent Households in Mount Savage
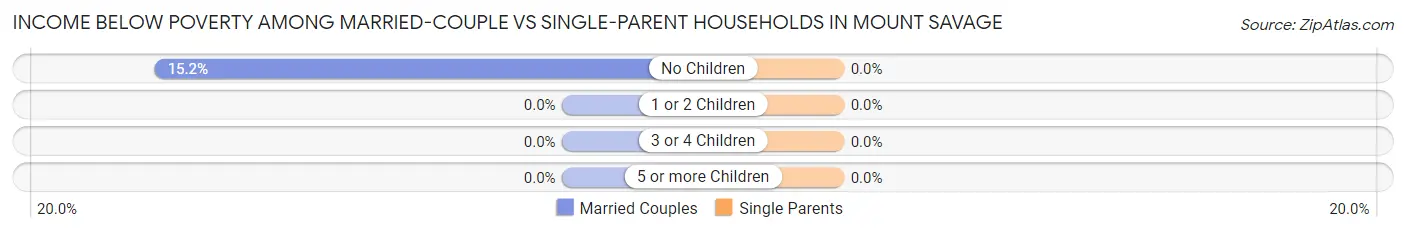
| Children | Married-Couple Families | Single-Parent Households |
| No Children | 20 (15.1%) | 0 (0.0%) |
| 1 or 2 Children | 0 (0.0%) | 0 (0.0%) |
| 3 or 4 Children | 0 (0.0%) | 0 (0.0%) |
| 5 or more Children | 0 (0.0%) | 0 (0.0%) |
| Total | 20 (12.0%) | 0 (0.0%) |
Employment Characteristics in Mount Savage
Employment by Class of Employer in Mount Savage
Among the 254 employed individuals in Mount Savage, private company employees (137 | 53.9%), not-for-profit organizations (36 | 14.2%), and self-employed (incorporated) (35 | 13.8%) make up the most common classes of employment.
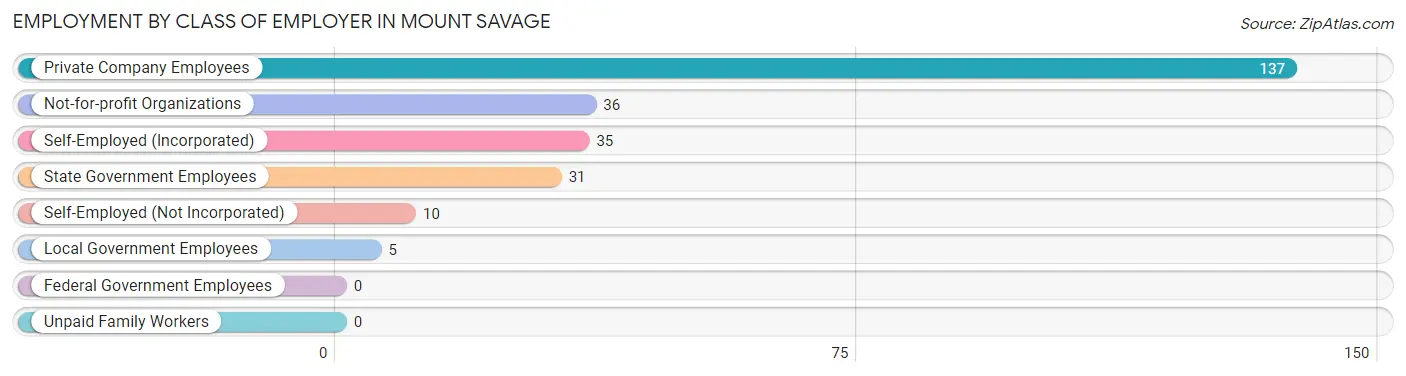
| Employer Class | # Employees | % Employees |
| Private Company Employees | 137 | 53.9% |
| Self-Employed (Incorporated) | 35 | 13.8% |
| Self-Employed (Not Incorporated) | 10 | 3.9% |
| Not-for-profit Organizations | 36 | 14.2% |
| Local Government Employees | 5 | 2.0% |
| State Government Employees | 31 | 12.2% |
| Federal Government Employees | 0 | 0.0% |
| Unpaid Family Workers | 0 | 0.0% |
| Total | 254 | 100.0% |
Employment Status by Age in Mount Savage
According to the labor force statistics for Mount Savage, out of the total population over 16 years of age (523), 61.2% or 320 individuals are in the labor force, with 20.6% or 66 of them unemployed. The age group with the highest labor force participation rate is 30 to 34 years, with 100.0% or 24 individuals in the labor force. Within the labor force, the 16 to 19 years age range has the highest percentage of unemployed individuals, with 50.0% or 6 of them being unemployed.
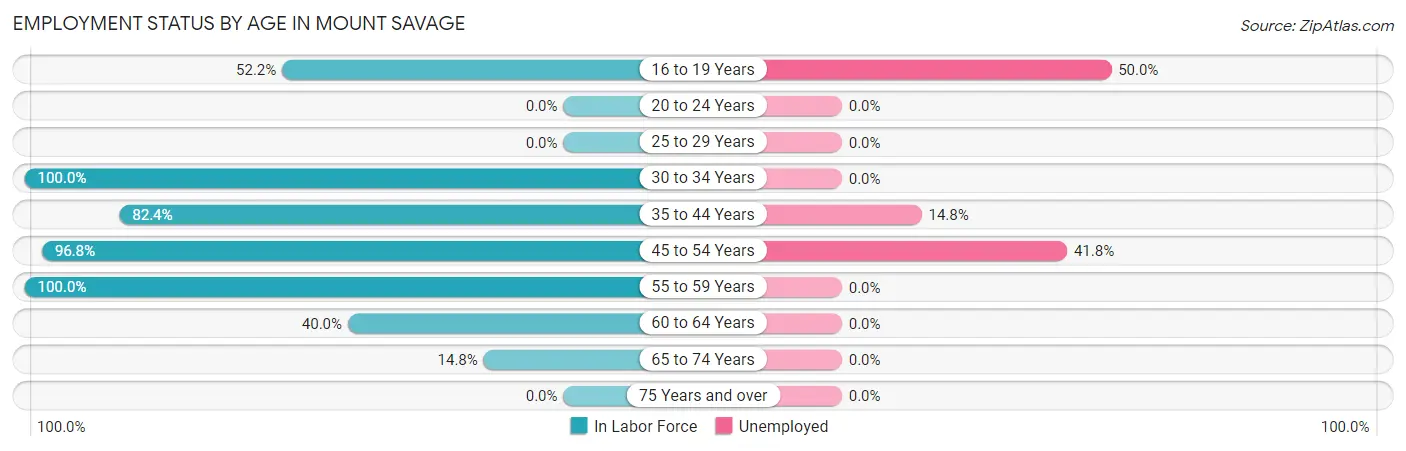
| Age Bracket | In Labor Force | Unemployed |
| 16 to 19 Years | 12 (52.2%) | 6 (50.0%) |
| 20 to 24 Years | 0 (0.0%) | 0 (0.0%) |
| 25 to 29 Years | 0 (0.0%) | 0 (0.0%) |
| 30 to 34 Years | 24 (100.0%) | 0 (0.0%) |
| 35 to 44 Years | 61 (82.4%) | 9 (14.8%) |
| 45 to 54 Years | 122 (96.8%) | 51 (41.8%) |
| 55 to 59 Years | 38 (100.0%) | 0 (0.0%) |
| 60 to 64 Years | 46 (40.0%) | 0 (0.0%) |
| 65 to 74 Years | 17 (14.8%) | 0 (0.0%) |
| 75 Years and over | 0 (0.0%) | 0 (0.0%) |
| Total | 320 (61.2%) | 66 (20.6%) |
Employment Status by Educational Attainment in Mount Savage
According to labor force statistics for Mount Savage, 77.2% of individuals (291) out of the total population between 25 and 64 years of age (377) are in the labor force, with 20.6% or 60 of them being unemployed. The group with the highest labor force participation rate are those with the educational attainment of bachelor's degree or higher, with 100.0% or 42 individuals in the labor force. Within the labor force, individuals with college / associate degree education have the highest percentage of unemployment, with 41.7% or 20 of them being unemployed.
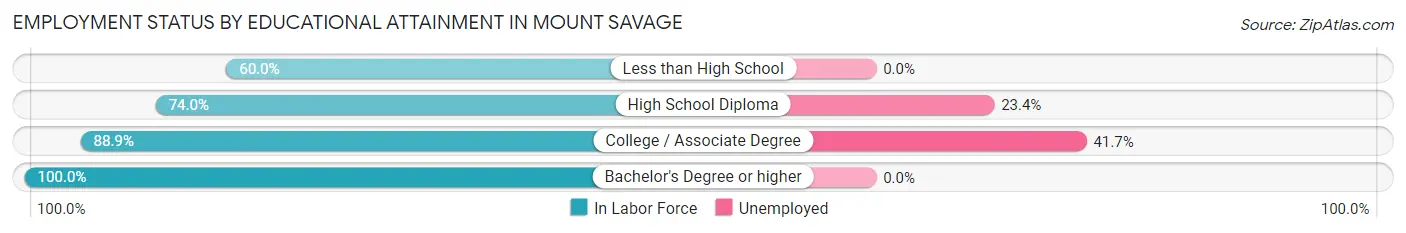
| Educational Attainment | In Labor Force | Unemployed |
| Less than High School | 30 (60.0%) | 0 (0.0%) |
| High School Diploma | 171 (74.0%) | 54 (23.4%) |
| College / Associate Degree | 48 (88.9%) | 23 (41.7%) |
| Bachelor's Degree or higher | 42 (100.0%) | 0 (0.0%) |
| Total | 291 (77.2%) | 78 (20.6%) |
Employment Occupations by Sex in Mount Savage
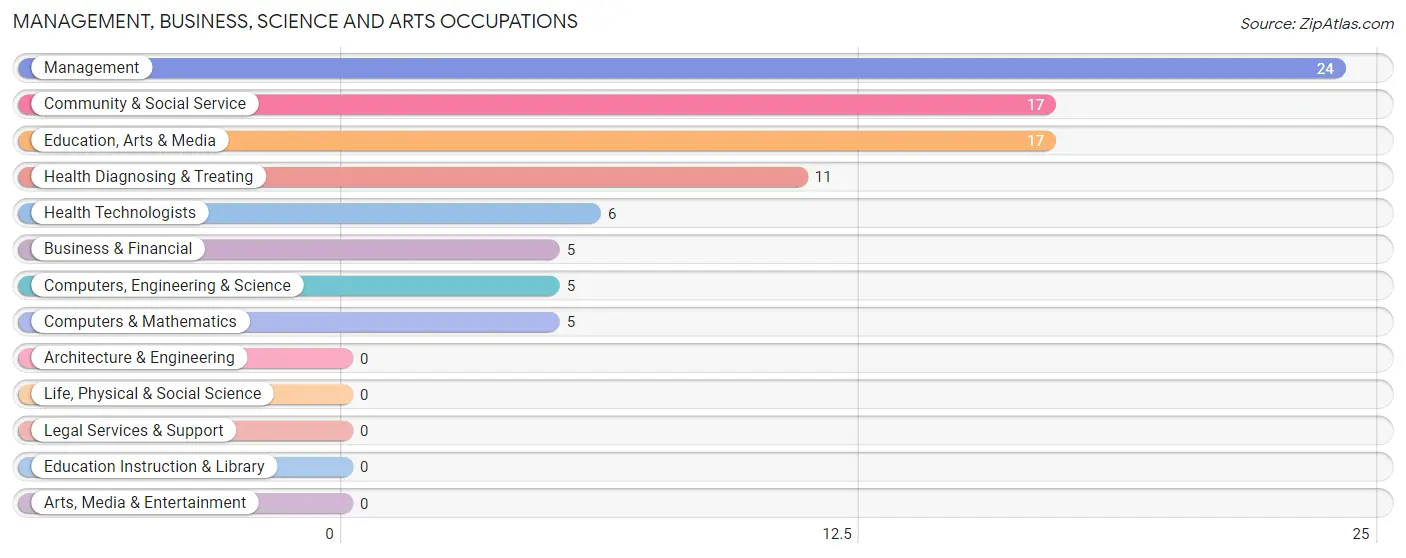
Management, Business, Science and Arts Occupations
The most common Management, Business, Science and Arts occupations in Mount Savage are Management (24 | 9.5%), Community & Social Service (17 | 6.7%), Education, Arts & Media (17 | 6.7%), Health Diagnosing & Treating (11 | 4.3%), and Health Technologists (6 | 2.4%).
Management, Business, Science and Arts Occupations by Sex
Within the Management, Business, Science and Arts occupations in Mount Savage, the most male-oriented occupations are Health Technologists (100.0%), Community & Social Service (70.6%), and Education, Arts & Media (70.6%), while the most female-oriented occupations are Management (100.0%), Business & Financial (100.0%), and Computers, Engineering & Science (100.0%).
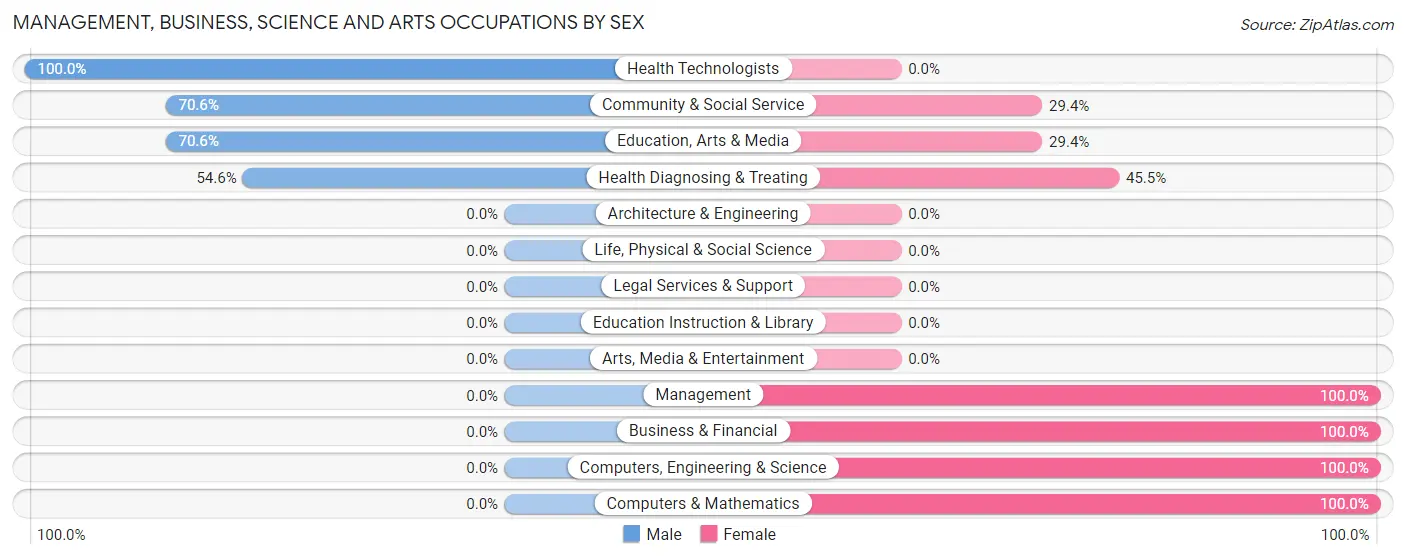
| Occupation | Male | Female |
| Management | 0 (0.0%) | 24 (100.0%) |
| Business & Financial | 0 (0.0%) | 5 (100.0%) |
| Computers, Engineering & Science | 0 (0.0%) | 5 (100.0%) |
| Computers & Mathematics | 0 (0.0%) | 5 (100.0%) |
| Architecture & Engineering | 0 (0.0%) | 0 (0.0%) |
| Life, Physical & Social Science | 0 (0.0%) | 0 (0.0%) |
| Community & Social Service | 12 (70.6%) | 5 (29.4%) |
| Education, Arts & Media | 12 (70.6%) | 5 (29.4%) |
| Legal Services & Support | 0 (0.0%) | 0 (0.0%) |
| Education Instruction & Library | 0 (0.0%) | 0 (0.0%) |
| Arts, Media & Entertainment | 0 (0.0%) | 0 (0.0%) |
| Health Diagnosing & Treating | 6 (54.5%) | 5 (45.5%) |
| Health Technologists | 6 (100.0%) | 0 (0.0%) |
| Total (Category) | 18 (29.0%) | 44 (71.0%) |
| Total (Overall) | 123 (48.4%) | 131 (51.6%) |
Services Occupations
The most common Services occupations in Mount Savage are Security & Protection (15 | 5.9%), Law Enforcement (15 | 5.9%), and Cleaning & Maintenance (6 | 2.4%).
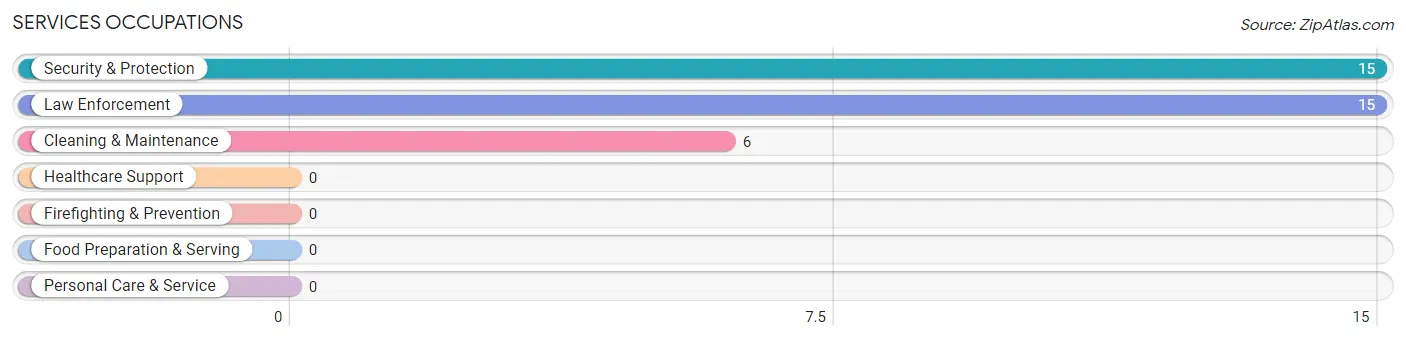
Services Occupations by Sex
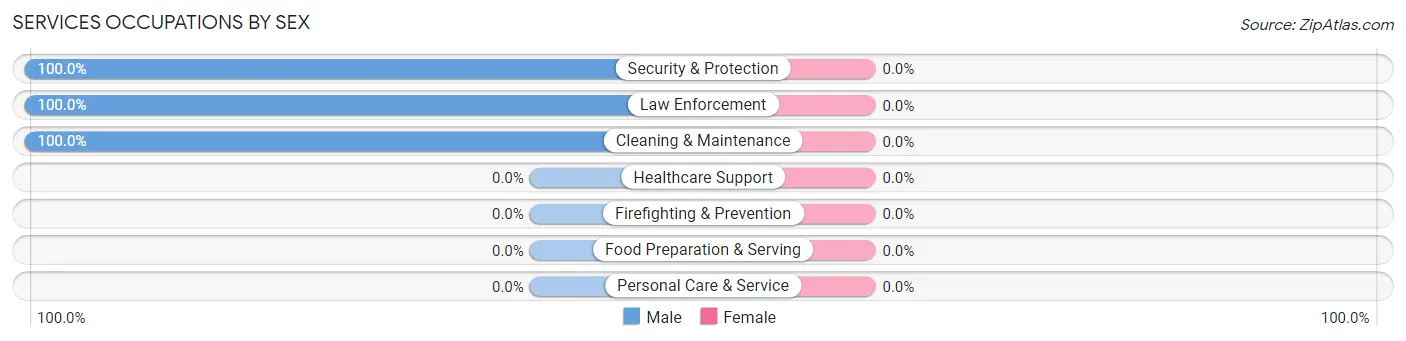
| Occupation | Male | Female |
| Healthcare Support | 0 (0.0%) | 0 (0.0%) |
| Security & Protection | 15 (100.0%) | 0 (0.0%) |
| Firefighting & Prevention | 0 (0.0%) | 0 (0.0%) |
| Law Enforcement | 15 (100.0%) | 0 (0.0%) |
| Food Preparation & Serving | 0 (0.0%) | 0 (0.0%) |
| Cleaning & Maintenance | 6 (100.0%) | 0 (0.0%) |
| Personal Care & Service | 0 (0.0%) | 0 (0.0%) |
| Total (Category) | 21 (100.0%) | 0 (0.0%) |
| Total (Overall) | 123 (48.4%) | 131 (51.6%) |
Sales and Office Occupations
The most common Sales and Office occupations in Mount Savage are Sales & Related (62 | 24.4%), and Office & Administration (37 | 14.6%).
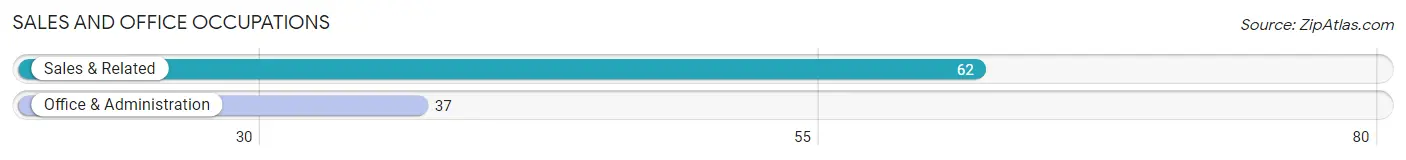
Sales and Office Occupations by Sex
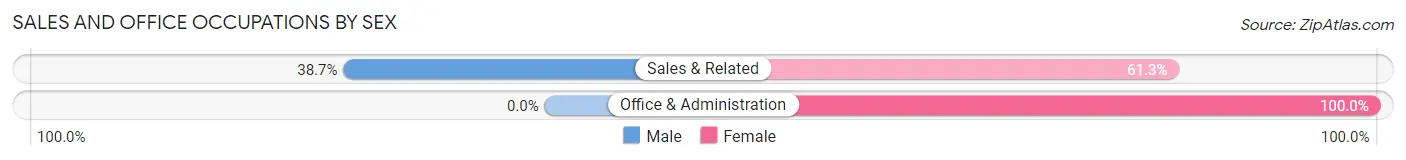
| Occupation | Male | Female |
| Sales & Related | 24 (38.7%) | 38 (61.3%) |
| Office & Administration | 0 (0.0%) | 37 (100.0%) |
| Total (Category) | 24 (24.2%) | 75 (75.8%) |
| Total (Overall) | 123 (48.4%) | 131 (51.6%) |
Natural Resources, Construction and Maintenance Occupations
The most common Natural Resources, Construction and Maintenance occupations in Mount Savage are , and Installation, Maintenance & Repair (11 | 4.3%).
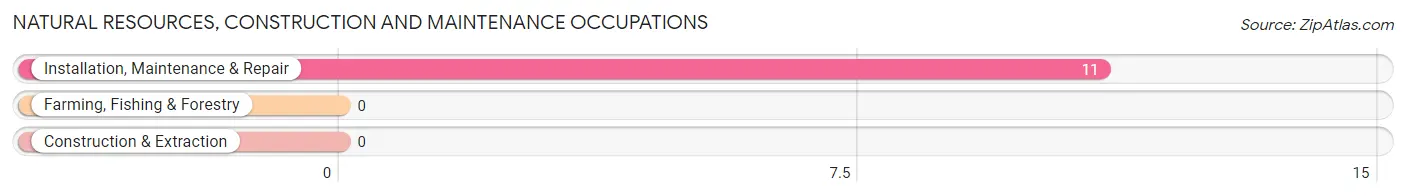
Natural Resources, Construction and Maintenance Occupations by Sex
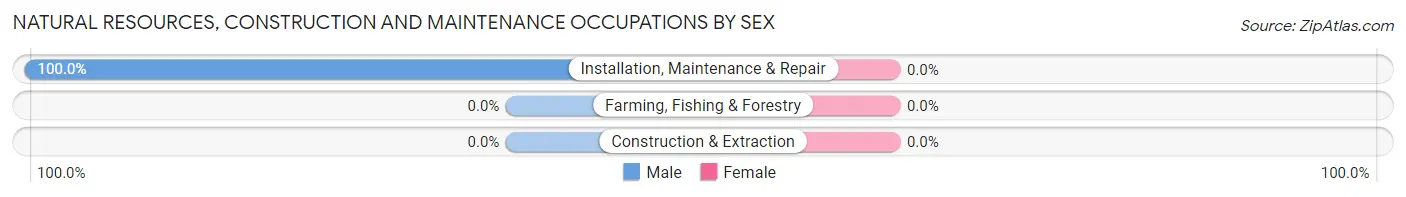
| Occupation | Male | Female |
| Farming, Fishing & Forestry | 0 (0.0%) | 0 (0.0%) |
| Construction & Extraction | 0 (0.0%) | 0 (0.0%) |
| Installation, Maintenance & Repair | 11 (100.0%) | 0 (0.0%) |
| Total (Category) | 11 (100.0%) | 0 (0.0%) |
| Total (Overall) | 123 (48.4%) | 131 (51.6%) |
Production, Transportation and Moving Occupations
The most common Production, Transportation and Moving occupations in Mount Savage are Production (26 | 10.2%), Material Moving (20 | 7.9%), and Transportation (15 | 5.9%).
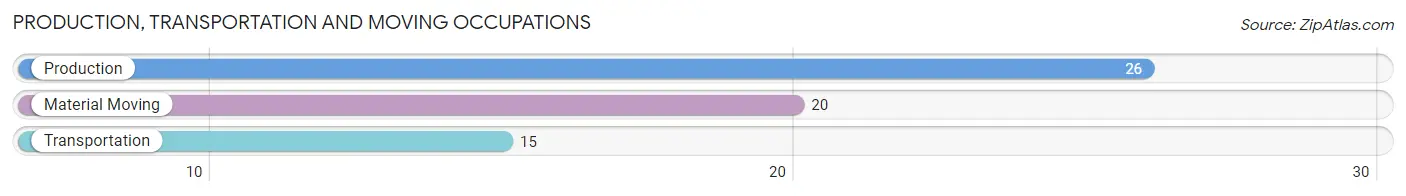
Production, Transportation and Moving Occupations by Sex
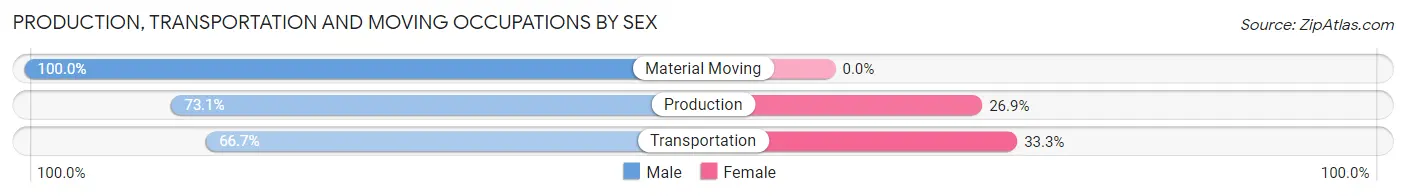
| Occupation | Male | Female |
| Production | 19 (73.1%) | 7 (26.9%) |
| Transportation | 10 (66.7%) | 5 (33.3%) |
| Material Moving | 20 (100.0%) | 0 (0.0%) |
| Total (Category) | 49 (80.3%) | 12 (19.7%) |
| Total (Overall) | 123 (48.4%) | 131 (51.6%) |
Employment Industries by Sex in Mount Savage
Employment Industries in Mount Savage
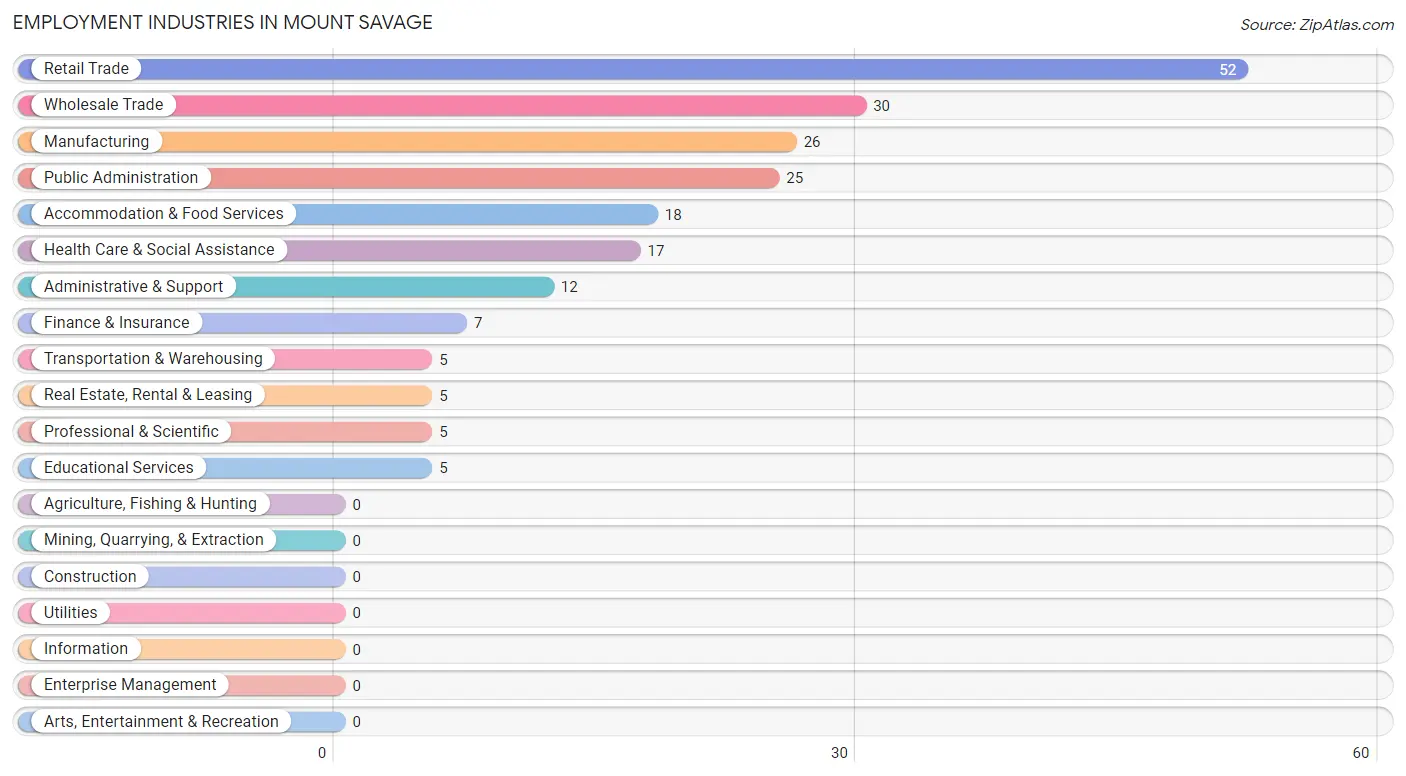
The major employment industries in Mount Savage include Retail Trade (52 | 20.5%), Wholesale Trade (30 | 11.8%), Manufacturing (26 | 10.2%), Public Administration (25 | 9.8%), and Accommodation & Food Services (18 | 7.1%).
Employment Industries by Sex in Mount Savage
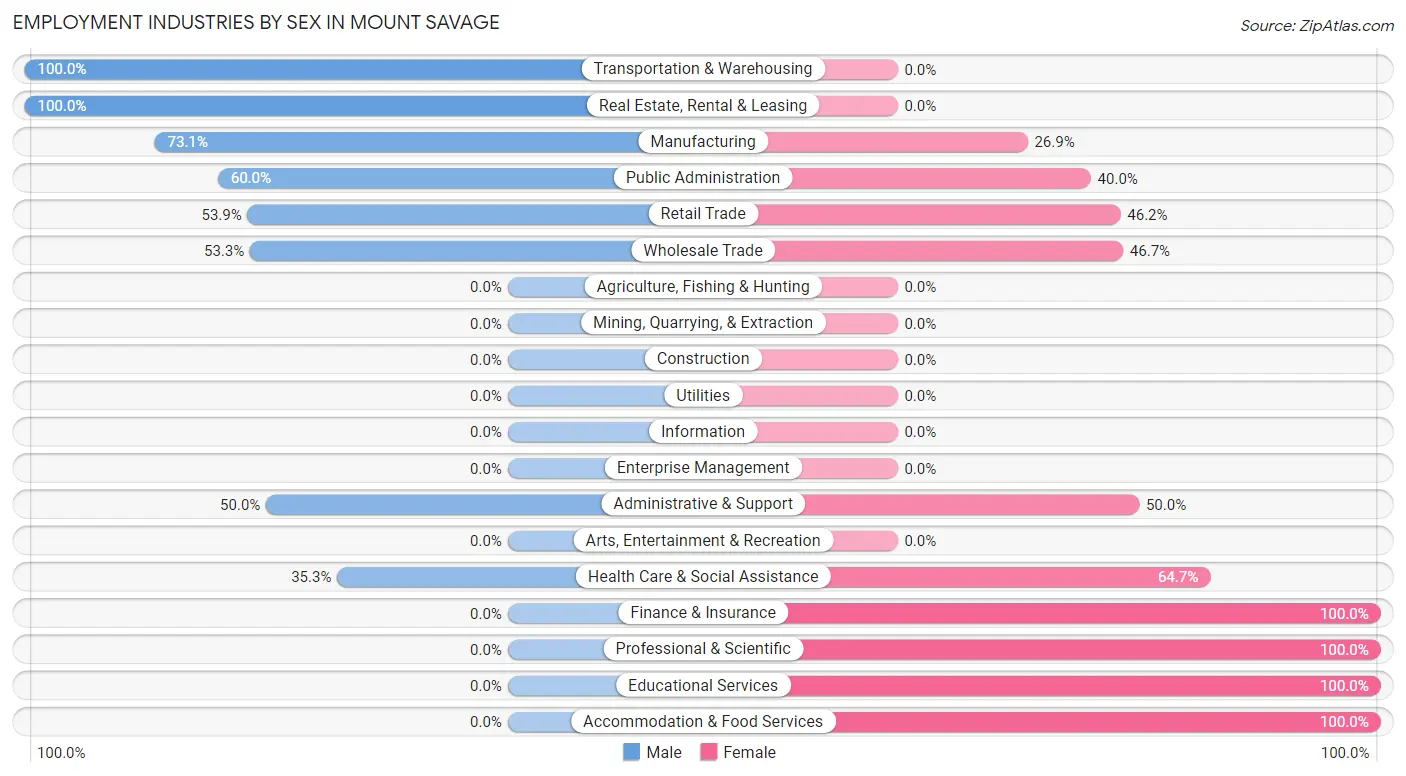
The Mount Savage industries that see more men than women are Transportation & Warehousing (100.0%), Real Estate, Rental & Leasing (100.0%), and Manufacturing (73.1%), whereas the industries that tend to have a higher number of women are Finance & Insurance (100.0%), Professional & Scientific (100.0%), and Educational Services (100.0%).
| Industry | Male | Female |
| Agriculture, Fishing & Hunting | 0 (0.0%) | 0 (0.0%) |
| Mining, Quarrying, & Extraction | 0 (0.0%) | 0 (0.0%) |
| Construction | 0 (0.0%) | 0 (0.0%) |
| Manufacturing | 19 (73.1%) | 7 (26.9%) |
| Wholesale Trade | 16 (53.3%) | 14 (46.7%) |
| Retail Trade | 28 (53.8%) | 24 (46.2%) |
| Transportation & Warehousing | 5 (100.0%) | 0 (0.0%) |
| Utilities | 0 (0.0%) | 0 (0.0%) |
| Information | 0 (0.0%) | 0 (0.0%) |
| Finance & Insurance | 0 (0.0%) | 7 (100.0%) |
| Real Estate, Rental & Leasing | 5 (100.0%) | 0 (0.0%) |
| Professional & Scientific | 0 (0.0%) | 5 (100.0%) |
| Enterprise Management | 0 (0.0%) | 0 (0.0%) |
| Administrative & Support | 6 (50.0%) | 6 (50.0%) |
| Educational Services | 0 (0.0%) | 5 (100.0%) |
| Health Care & Social Assistance | 6 (35.3%) | 11 (64.7%) |
| Arts, Entertainment & Recreation | 0 (0.0%) | 0 (0.0%) |
| Accommodation & Food Services | 0 (0.0%) | 18 (100.0%) |
| Public Administration | 15 (60.0%) | 10 (40.0%) |
| Total | 123 (48.4%) | 131 (51.6%) |
Education in Mount Savage
School Enrollment in Mount Savage
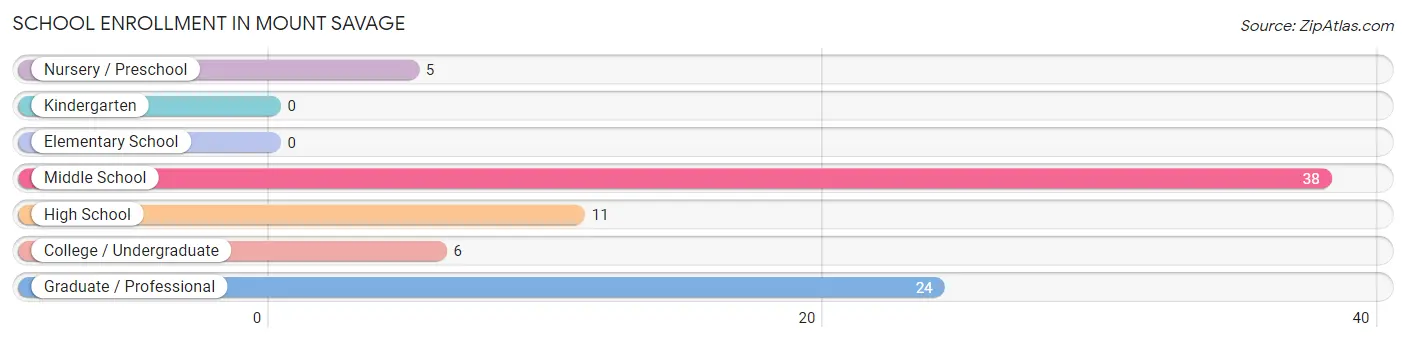
The most common levels of schooling among the 84 students in Mount Savage are middle school (38 | 45.2%), graduate / professional (24 | 28.6%), and high school (11 | 13.1%).
| School Level | # Students | % Students |
| Nursery / Preschool | 5 | 5.9% |
| Kindergarten | 0 | 0.0% |
| Elementary School | 0 | 0.0% |
| Middle School | 38 | 45.2% |
| High School | 11 | 13.1% |
| College / Undergraduate | 6 | 7.1% |
| Graduate / Professional | 24 | 28.6% |
| Total | 84 | 100.0% |
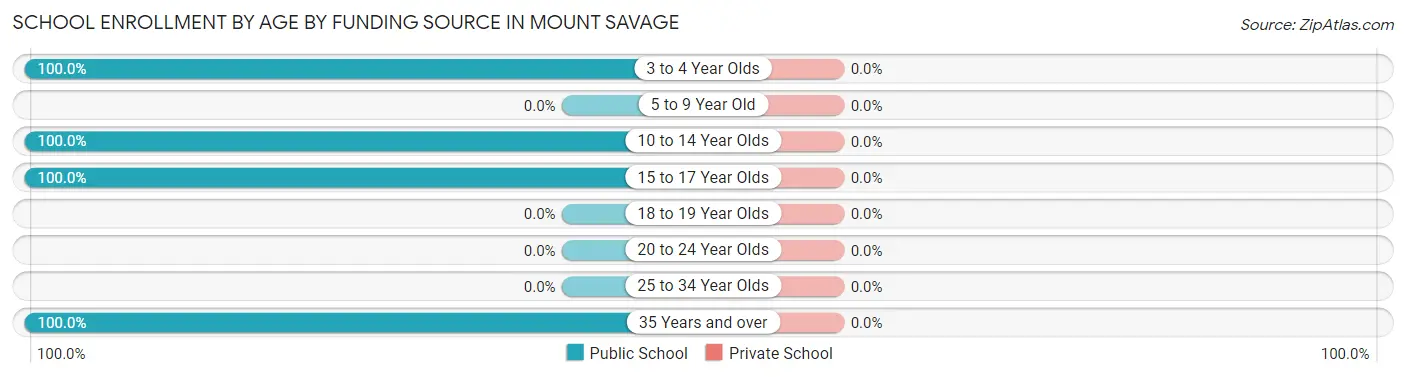
School Enrollment by Age by Funding Source in Mount Savage
| Age Bracket | Public School | Private School |
| 3 to 4 Year Olds | 5 (100.0%) | 0 (0.0%) |
| 5 to 9 Year Old | 0 (0.0%) | 0 (0.0%) |
| 10 to 14 Year Olds | 38 (100.0%) | 0 (0.0%) |
| 15 to 17 Year Olds | 11 (100.0%) | 0 (0.0%) |
| 18 to 19 Year Olds | 0 (0.0%) | 0 (0.0%) |
| 20 to 24 Year Olds | 0 (0.0%) | 0 (0.0%) |
| 25 to 34 Year Olds | 0 (0.0%) | 0 (0.0%) |
| 35 Years and over | 30 (100.0%) | 0 (0.0%) |
| Total | 84 (100.0%) | 0 (0.0%) |
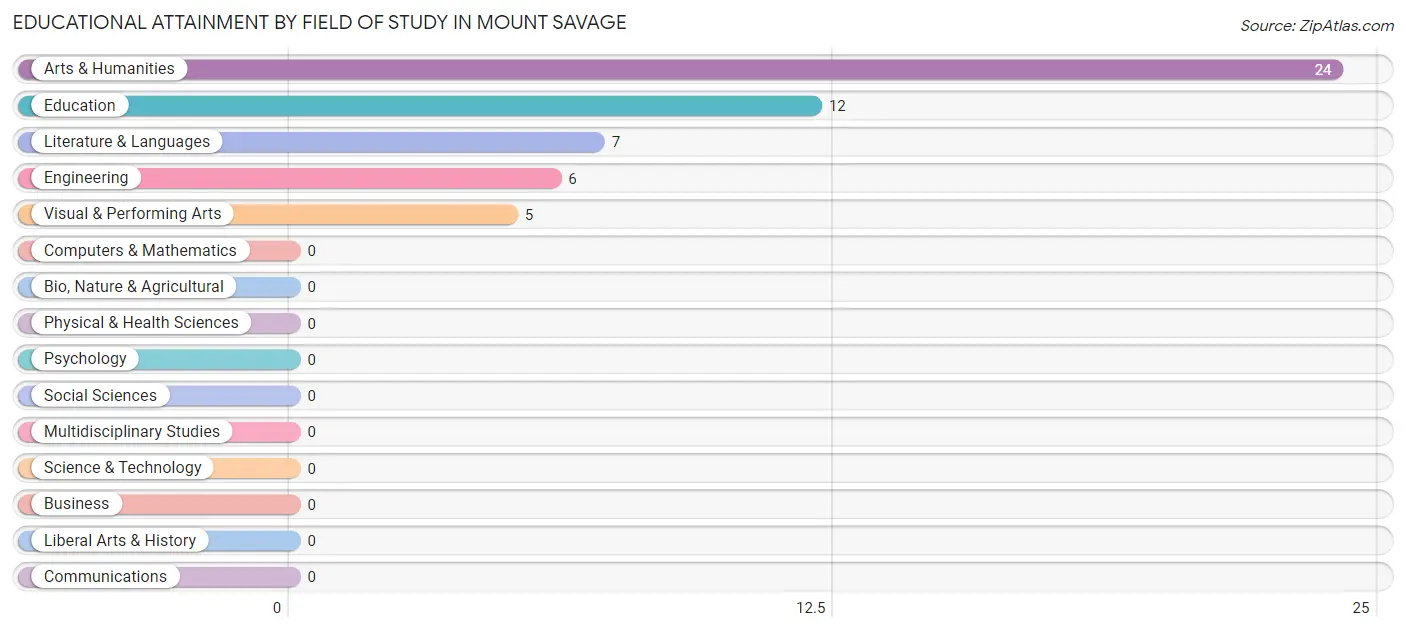
Educational Attainment by Field of Study in Mount Savage
Arts & humanities (24 | 44.4%), education (12 | 22.2%), literature & languages (7 | 13.0%), engineering (6 | 11.1%), and visual & performing arts (5 | 9.3%) are the most common fields of study among 54 individuals in Mount Savage who have obtained a bachelor's degree or higher.
| Field of Study | # Graduates | % Graduates |
| Computers & Mathematics | 0 | 0.0% |
| Bio, Nature & Agricultural | 0 | 0.0% |
| Physical & Health Sciences | 0 | 0.0% |
| Psychology | 0 | 0.0% |
| Social Sciences | 0 | 0.0% |
| Engineering | 6 | 11.1% |
| Multidisciplinary Studies | 0 | 0.0% |
| Science & Technology | 0 | 0.0% |
| Business | 0 | 0.0% |
| Education | 12 | 22.2% |
| Literature & Languages | 7 | 13.0% |
| Liberal Arts & History | 0 | 0.0% |
| Visual & Performing Arts | 5 | 9.3% |
| Communications | 0 | 0.0% |
| Arts & Humanities | 24 | 44.4% |
| Total | 54 | 100.0% |
Transportation & Commute in Mount Savage
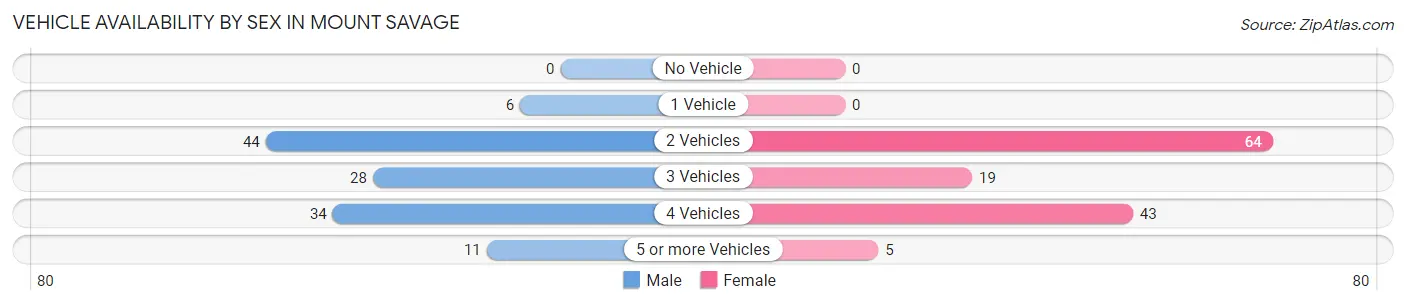
Vehicle Availability by Sex in Mount Savage
The most prevalent vehicle ownership categories in Mount Savage are males with 2 vehicles (44, accounting for 35.8%) and females with 2 vehicles (64, making up 33.6%).
| Vehicles Available | Male | Female |
| No Vehicle | 0 (0.0%) | 0 (0.0%) |
| 1 Vehicle | 6 (4.9%) | 0 (0.0%) |
| 2 Vehicles | 44 (35.8%) | 64 (48.8%) |
| 3 Vehicles | 28 (22.8%) | 19 (14.5%) |
| 4 Vehicles | 34 (27.6%) | 43 (32.8%) |
| 5 or more Vehicles | 11 (8.9%) | 5 (3.8%) |
| Total | 123 (100.0%) | 131 (100.0%) |
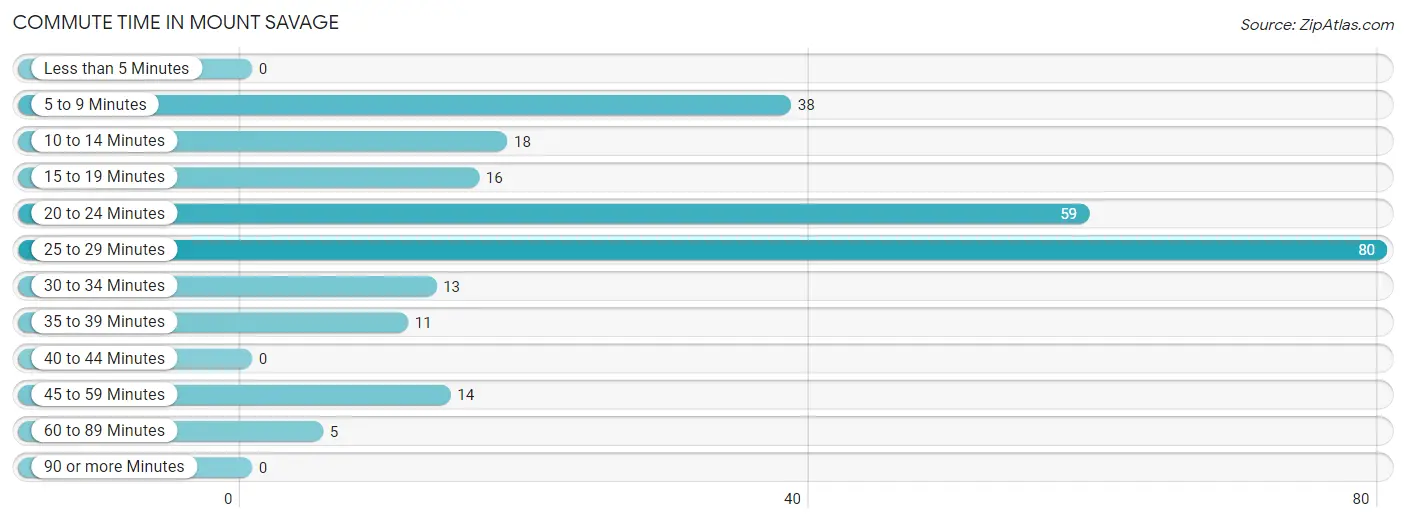
Commute Time in Mount Savage
The most frequently occuring commute durations in Mount Savage are 25 to 29 minutes (80 commuters, 31.5%), 20 to 24 minutes (59 commuters, 23.2%), and 5 to 9 minutes (38 commuters, 15.0%).
| Commute Time | # Commuters | % Commuters |
| Less than 5 Minutes | 0 | 0.0% |
| 5 to 9 Minutes | 38 | 15.0% |
| 10 to 14 Minutes | 18 | 7.1% |
| 15 to 19 Minutes | 16 | 6.3% |
| 20 to 24 Minutes | 59 | 23.2% |
| 25 to 29 Minutes | 80 | 31.5% |
| 30 to 34 Minutes | 13 | 5.1% |
| 35 to 39 Minutes | 11 | 4.3% |
| 40 to 44 Minutes | 0 | 0.0% |
| 45 to 59 Minutes | 14 | 5.5% |
| 60 to 89 Minutes | 5 | 2.0% |
| 90 or more Minutes | 0 | 0.0% |
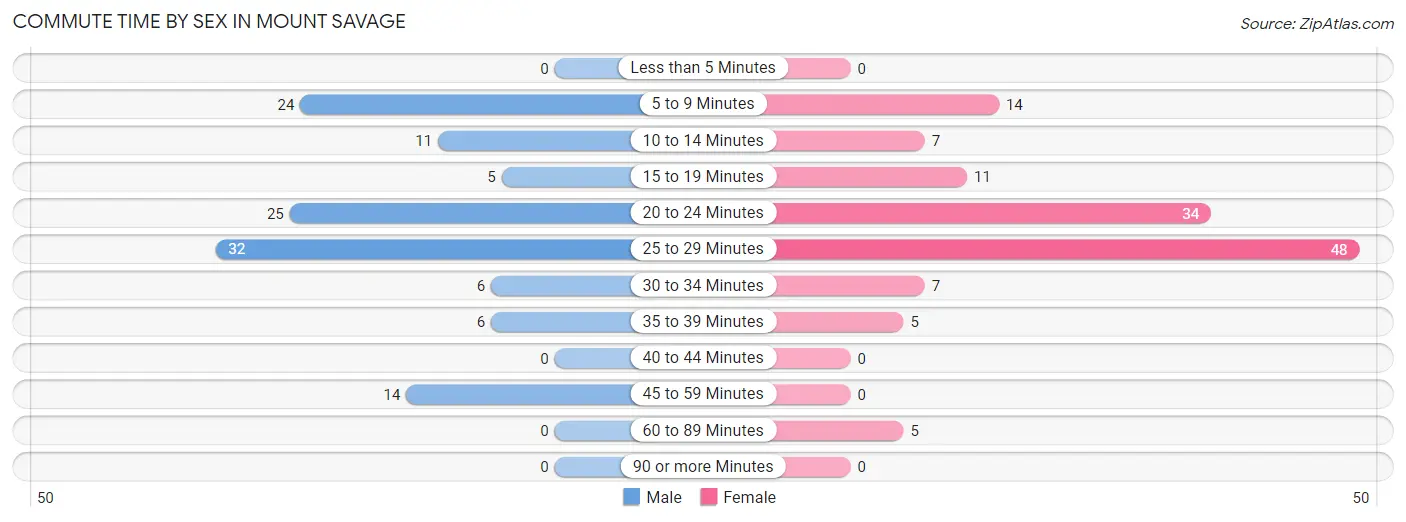
Commute Time by Sex in Mount Savage
The most common commute times in Mount Savage are 25 to 29 minutes (32 commuters, 26.0%) for males and 25 to 29 minutes (48 commuters, 36.6%) for females.
| Commute Time | Male | Female |
| Less than 5 Minutes | 0 (0.0%) | 0 (0.0%) |
| 5 to 9 Minutes | 24 (19.5%) | 14 (10.7%) |
| 10 to 14 Minutes | 11 (8.9%) | 7 (5.3%) |
| 15 to 19 Minutes | 5 (4.1%) | 11 (8.4%) |
| 20 to 24 Minutes | 25 (20.3%) | 34 (26.0%) |
| 25 to 29 Minutes | 32 (26.0%) | 48 (36.6%) |
| 30 to 34 Minutes | 6 (4.9%) | 7 (5.3%) |
| 35 to 39 Minutes | 6 (4.9%) | 5 (3.8%) |
| 40 to 44 Minutes | 0 (0.0%) | 0 (0.0%) |
| 45 to 59 Minutes | 14 (11.4%) | 0 (0.0%) |
| 60 to 89 Minutes | 0 (0.0%) | 5 (3.8%) |
| 90 or more Minutes | 0 (0.0%) | 0 (0.0%) |
Time of Departure to Work by Sex in Mount Savage
The most frequent times of departure to work in Mount Savage are 12:00 PM to 3:59 PM (34, 27.6%) for males and 9:00 AM to 9:59 AM (38, 29.0%) for females.
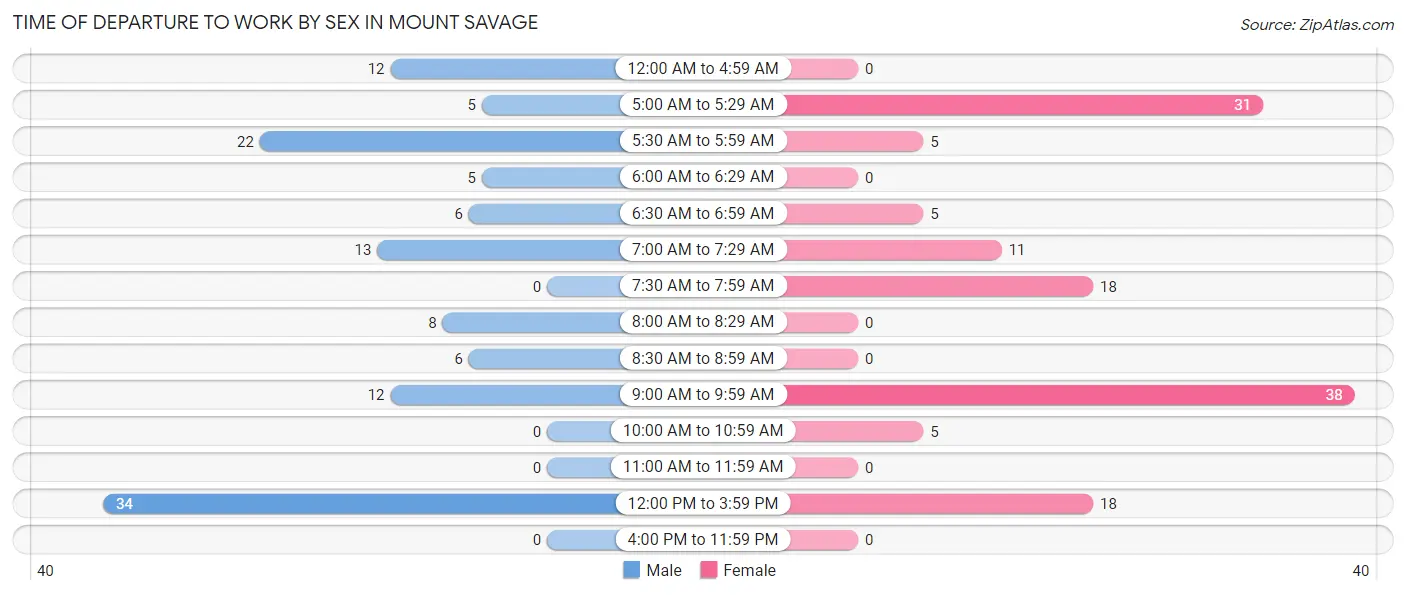
| Time of Departure | Male | Female |
| 12:00 AM to 4:59 AM | 12 (9.8%) | 0 (0.0%) |
| 5:00 AM to 5:29 AM | 5 (4.1%) | 31 (23.7%) |
| 5:30 AM to 5:59 AM | 22 (17.9%) | 5 (3.8%) |
| 6:00 AM to 6:29 AM | 5 (4.1%) | 0 (0.0%) |
| 6:30 AM to 6:59 AM | 6 (4.9%) | 5 (3.8%) |
| 7:00 AM to 7:29 AM | 13 (10.6%) | 11 (8.4%) |
| 7:30 AM to 7:59 AM | 0 (0.0%) | 18 (13.7%) |
| 8:00 AM to 8:29 AM | 8 (6.5%) | 0 (0.0%) |
| 8:30 AM to 8:59 AM | 6 (4.9%) | 0 (0.0%) |
| 9:00 AM to 9:59 AM | 12 (9.8%) | 38 (29.0%) |
| 10:00 AM to 10:59 AM | 0 (0.0%) | 5 (3.8%) |
| 11:00 AM to 11:59 AM | 0 (0.0%) | 0 (0.0%) |
| 12:00 PM to 3:59 PM | 34 (27.6%) | 18 (13.7%) |
| 4:00 PM to 11:59 PM | 0 (0.0%) | 0 (0.0%) |
| Total | 123 (100.0%) | 131 (100.0%) |
Housing Occupancy in Mount Savage
Occupancy by Ownership in Mount Savage
Of the total 235 dwellings in Mount Savage, owner-occupied units account for 175 (74.5%), while renter-occupied units make up 60 (25.5%).
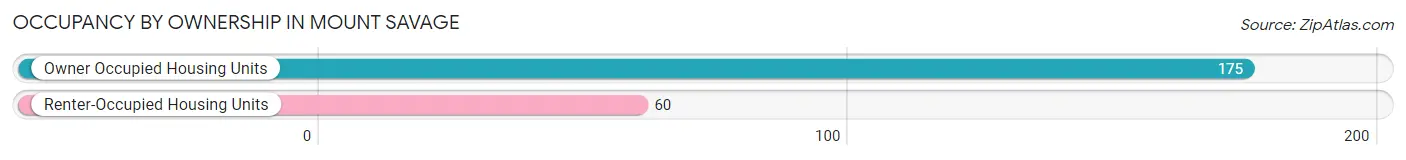
| Occupancy | # Housing Units | % Housing Units |
| Owner Occupied Housing Units | 175 | 74.5% |
| Renter-Occupied Housing Units | 60 | 25.5% |
| Total Occupied Housing Units | 235 | 100.0% |
Occupancy by Household Size in Mount Savage
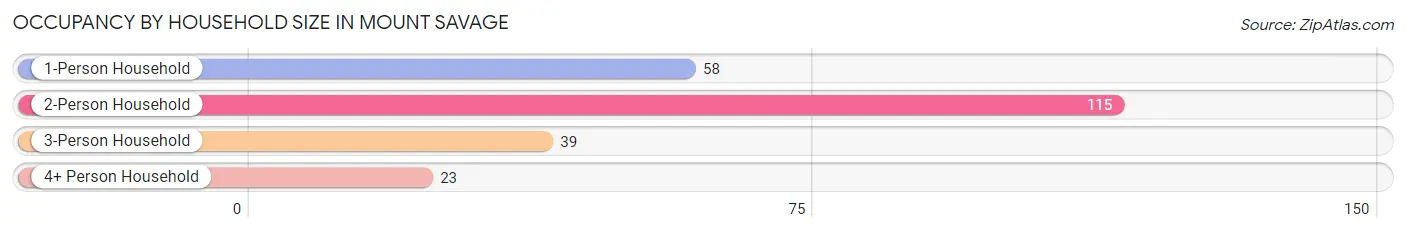
| Household Size | # Housing Units | % Housing Units |
| 1-Person Household | 58 | 24.7% |
| 2-Person Household | 115 | 48.9% |
| 3-Person Household | 39 | 16.6% |
| 4+ Person Household | 23 | 9.8% |
| Total Housing Units | 235 | 100.0% |
Occupancy by Ownership by Household Size in Mount Savage
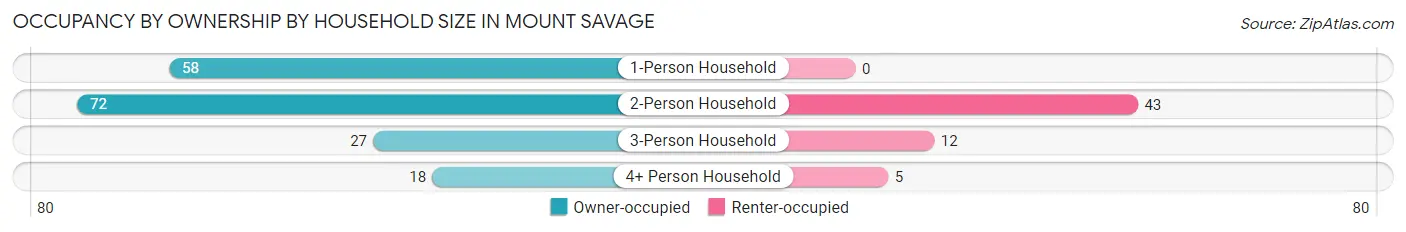
| Household Size | Owner-occupied | Renter-occupied |
| 1-Person Household | 58 (100.0%) | 0 (0.0%) |
| 2-Person Household | 72 (62.6%) | 43 (37.4%) |
| 3-Person Household | 27 (69.2%) | 12 (30.8%) |
| 4+ Person Household | 18 (78.3%) | 5 (21.7%) |
| Total Housing Units | 175 (74.5%) | 60 (25.5%) |
Occupancy by Educational Attainment in Mount Savage
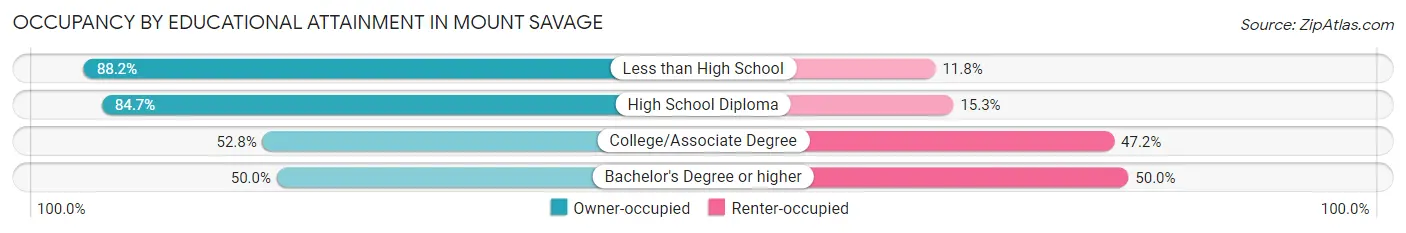
| Household Size | Owner-occupied | Renter-occupied |
| Less than High School | 30 (88.2%) | 4 (11.8%) |
| High School Diploma | 105 (84.7%) | 19 (15.3%) |
| College/Associate Degree | 28 (52.8%) | 25 (47.2%) |
| Bachelor's Degree or higher | 12 (50.0%) | 12 (50.0%) |
Occupancy by Age of Householder in Mount Savage
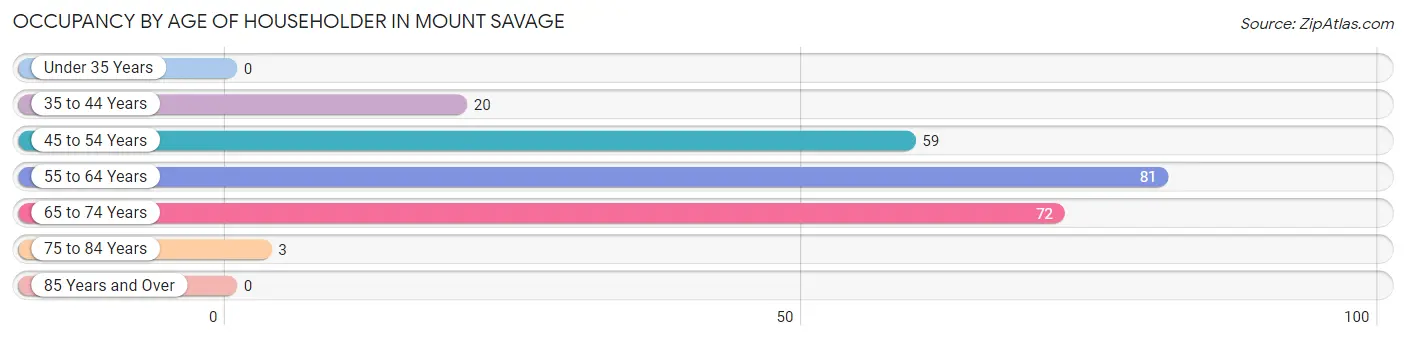
| Age Bracket | # Households | % Households |
| Under 35 Years | 0 | 0.0% |
| 35 to 44 Years | 20 | 8.5% |
| 45 to 54 Years | 59 | 25.1% |
| 55 to 64 Years | 81 | 34.5% |
| 65 to 74 Years | 72 | 30.6% |
| 75 to 84 Years | 3 | 1.3% |
| 85 Years and Over | 0 | 0.0% |
| Total | 235 | 100.0% |
Housing Finances in Mount Savage
Median Income by Occupancy in Mount Savage
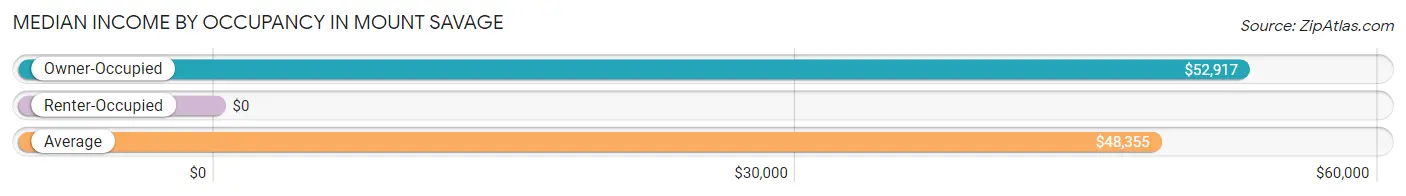
| Occupancy Type | # Households | Median Income |
| Owner-Occupied | 175 (74.5%) | $52,917 |
| Renter-Occupied | 60 (25.5%) | $0 |
| Average | 235 (100.0%) | $48,355 |
Occupancy by Householder Income Bracket in Mount Savage
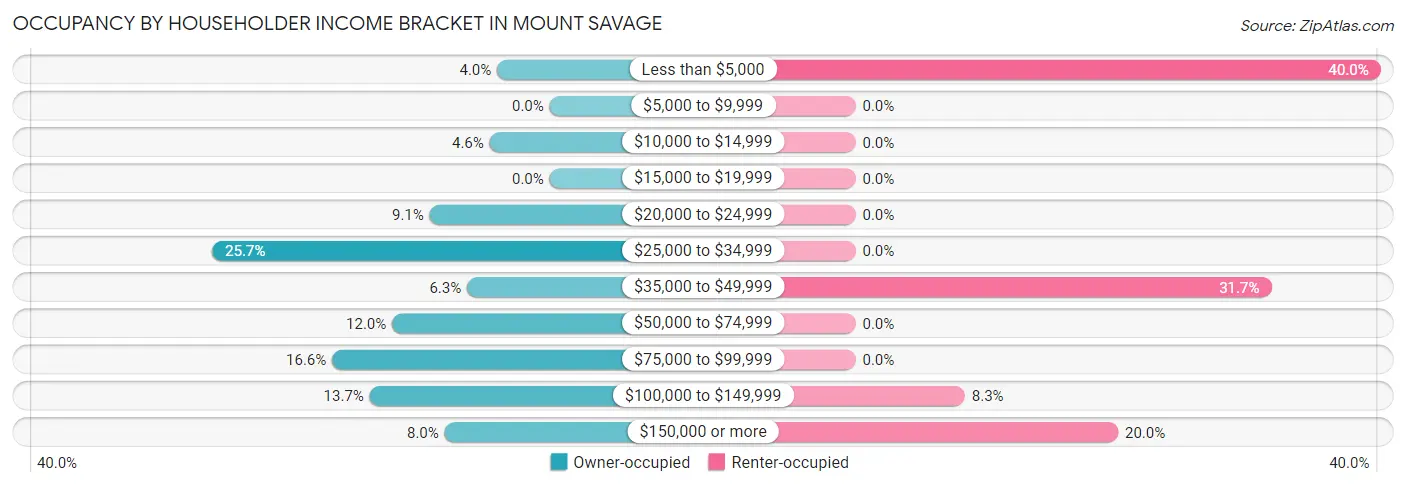
| Income Bracket | Owner-occupied | Renter-occupied |
| Less than $5,000 | 7 (4.0%) | 24 (40.0%) |
| $5,000 to $9,999 | 0 (0.0%) | 0 (0.0%) |
| $10,000 to $14,999 | 8 (4.6%) | 0 (0.0%) |
| $15,000 to $19,999 | 0 (0.0%) | 0 (0.0%) |
| $20,000 to $24,999 | 16 (9.1%) | 0 (0.0%) |
| $25,000 to $34,999 | 45 (25.7%) | 0 (0.0%) |
| $35,000 to $49,999 | 11 (6.3%) | 19 (31.7%) |
| $50,000 to $74,999 | 21 (12.0%) | 0 (0.0%) |
| $75,000 to $99,999 | 29 (16.6%) | 0 (0.0%) |
| $100,000 to $149,999 | 24 (13.7%) | 5 (8.3%) |
| $150,000 or more | 14 (8.0%) | 12 (20.0%) |
| Total | 175 (100.0%) | 60 (100.0%) |
Monthly Housing Cost Tiers in Mount Savage
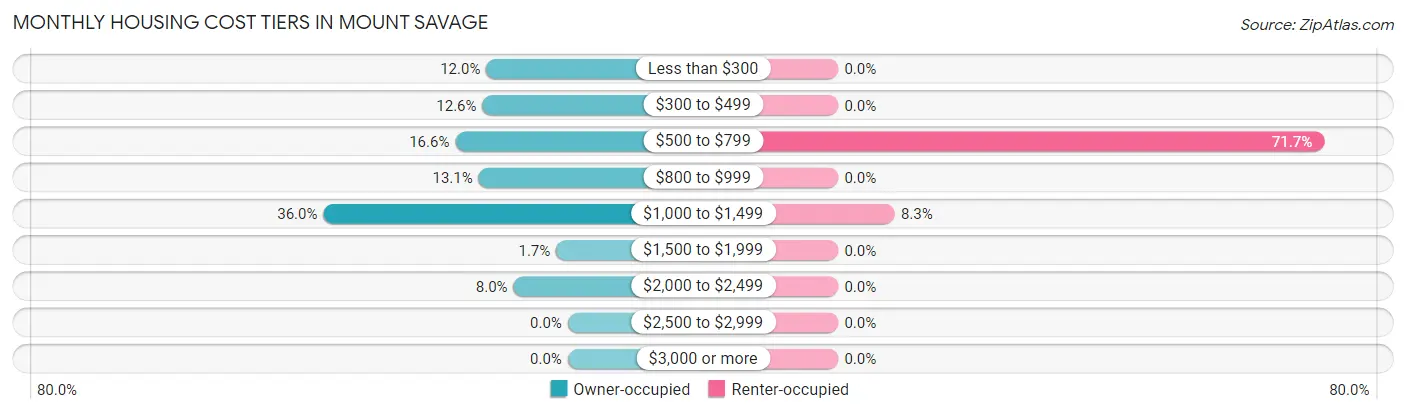
| Monthly Cost | Owner-occupied | Renter-occupied |
| Less than $300 | 21 (12.0%) | 0 (0.0%) |
| $300 to $499 | 22 (12.6%) | 0 (0.0%) |
| $500 to $799 | 29 (16.6%) | 43 (71.7%) |
| $800 to $999 | 23 (13.1%) | 0 (0.0%) |
| $1,000 to $1,499 | 63 (36.0%) | 5 (8.3%) |
| $1,500 to $1,999 | 3 (1.7%) | 0 (0.0%) |
| $2,000 to $2,499 | 14 (8.0%) | 0 (0.0%) |
| $2,500 to $2,999 | 0 (0.0%) | 0 (0.0%) |
| $3,000 or more | 0 (0.0%) | 0 (0.0%) |
| Total | 175 (100.0%) | 60 (100.0%) |
Physical Housing Characteristics in Mount Savage
Housing Structures in Mount Savage
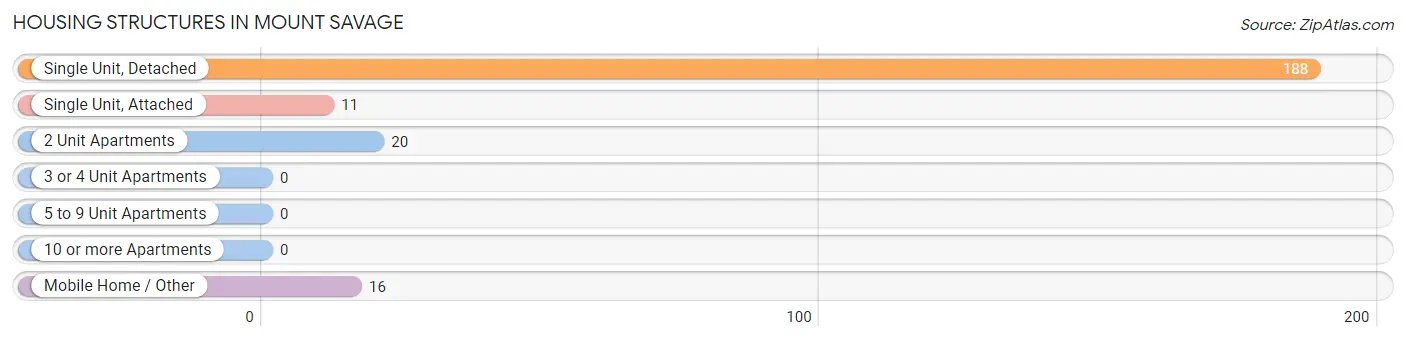
| Structure Type | # Housing Units | % Housing Units |
| Single Unit, Detached | 188 | 80.0% |
| Single Unit, Attached | 11 | 4.7% |
| 2 Unit Apartments | 20 | 8.5% |
| 3 or 4 Unit Apartments | 0 | 0.0% |
| 5 to 9 Unit Apartments | 0 | 0.0% |
| 10 or more Apartments | 0 | 0.0% |
| Mobile Home / Other | 16 | 6.8% |
| Total | 235 | 100.0% |
Housing Structures by Occupancy in Mount Savage
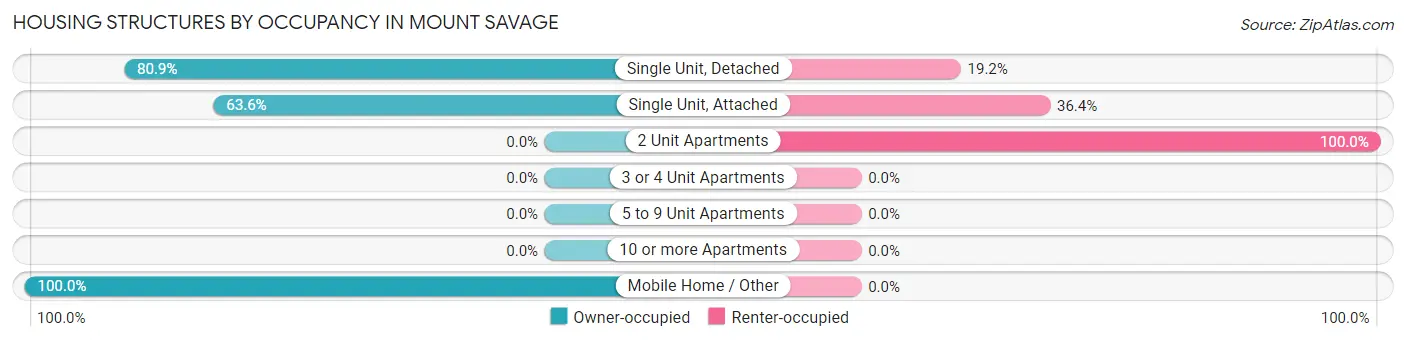
| Structure Type | Owner-occupied | Renter-occupied |
| Single Unit, Detached | 152 (80.8%) | 36 (19.2%) |
| Single Unit, Attached | 7 (63.6%) | 4 (36.4%) |
| 2 Unit Apartments | 0 (0.0%) | 20 (100.0%) |
| 3 or 4 Unit Apartments | 0 (0.0%) | 0 (0.0%) |
| 5 to 9 Unit Apartments | 0 (0.0%) | 0 (0.0%) |
| 10 or more Apartments | 0 (0.0%) | 0 (0.0%) |
| Mobile Home / Other | 16 (100.0%) | 0 (0.0%) |
| Total | 175 (74.5%) | 60 (25.5%) |
Housing Structures by Number of Rooms in Mount Savage
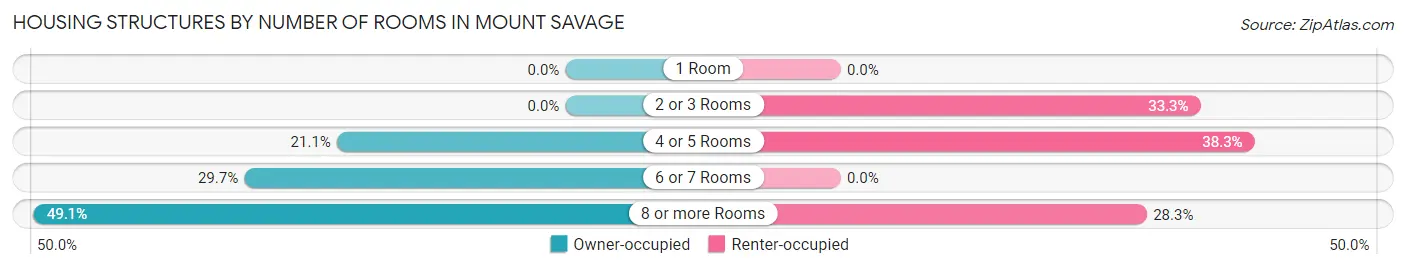
| Number of Rooms | Owner-occupied | Renter-occupied |
| 1 Room | 0 (0.0%) | 0 (0.0%) |
| 2 or 3 Rooms | 0 (0.0%) | 20 (33.3%) |
| 4 or 5 Rooms | 37 (21.1%) | 23 (38.3%) |
| 6 or 7 Rooms | 52 (29.7%) | 0 (0.0%) |
| 8 or more Rooms | 86 (49.1%) | 17 (28.3%) |
| Total | 175 (100.0%) | 60 (100.0%) |
Housing Structure by Heating Type in Mount Savage
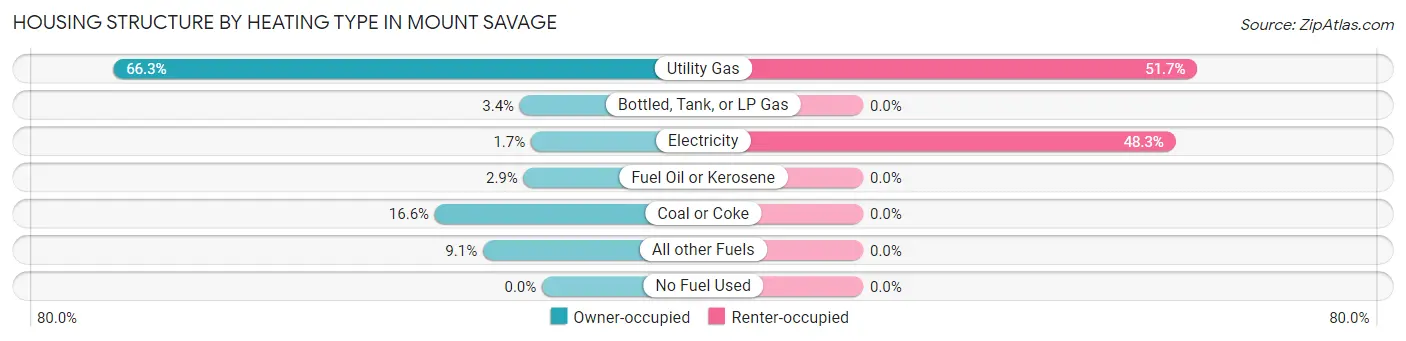
| Heating Type | Owner-occupied | Renter-occupied |
| Utility Gas | 116 (66.3%) | 31 (51.7%) |
| Bottled, Tank, or LP Gas | 6 (3.4%) | 0 (0.0%) |
| Electricity | 3 (1.7%) | 29 (48.3%) |
| Fuel Oil or Kerosene | 5 (2.9%) | 0 (0.0%) |
| Coal or Coke | 29 (16.6%) | 0 (0.0%) |
| All other Fuels | 16 (9.1%) | 0 (0.0%) |
| No Fuel Used | 0 (0.0%) | 0 (0.0%) |
| Total | 175 (100.0%) | 60 (100.0%) |
Household Vehicle Usage in Mount Savage
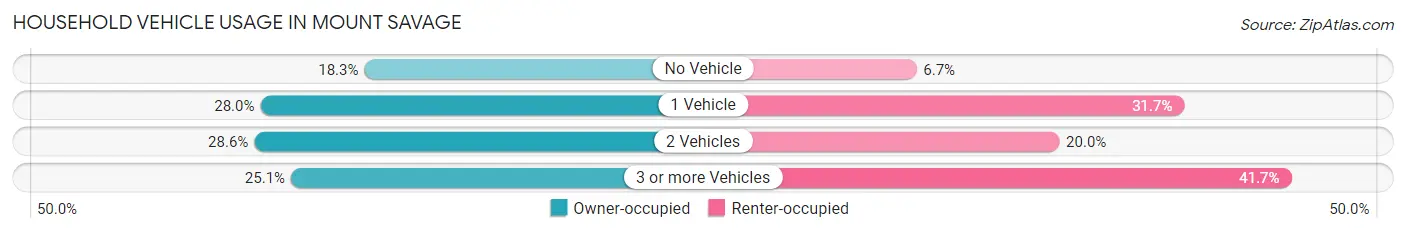
| Vehicles per Household | Owner-occupied | Renter-occupied |
| No Vehicle | 32 (18.3%) | 4 (6.7%) |
| 1 Vehicle | 49 (28.0%) | 19 (31.7%) |
| 2 Vehicles | 50 (28.6%) | 12 (20.0%) |
| 3 or more Vehicles | 44 (25.1%) | 25 (41.7%) |
| Total | 175 (100.0%) | 60 (100.0%) |
Real Estate & Mortgages in Mount Savage
Real Estate and Mortgage Overview in Mount Savage
| Characteristic | Without Mortgage | With Mortgage |
| Housing Units | 81 | 94 |
| Median Property Value | $102,800 | $102,000 |
| Median Household Income | - | - |
| Monthly Housing Costs | $519 | $0 |
| Real Estate Taxes | $883 | $0 |
Property Value by Mortgage Status in Mount Savage
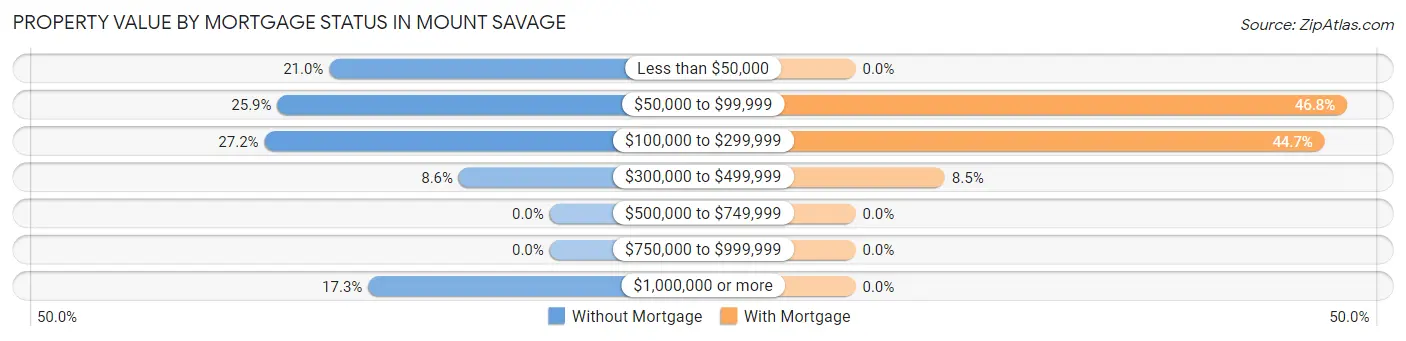
| Property Value | Without Mortgage | With Mortgage |
| Less than $50,000 | 17 (21.0%) | 0 (0.0%) |
| $50,000 to $99,999 | 21 (25.9%) | 44 (46.8%) |
| $100,000 to $299,999 | 22 (27.2%) | 42 (44.7%) |
| $300,000 to $499,999 | 7 (8.6%) | 8 (8.5%) |
| $500,000 to $749,999 | 0 (0.0%) | 0 (0.0%) |
| $750,000 to $999,999 | 0 (0.0%) | 0 (0.0%) |
| $1,000,000 or more | 14 (17.3%) | 0 (0.0%) |
| Total | 81 (100.0%) | 94 (100.0%) |
Household Income by Mortgage Status in Mount Savage
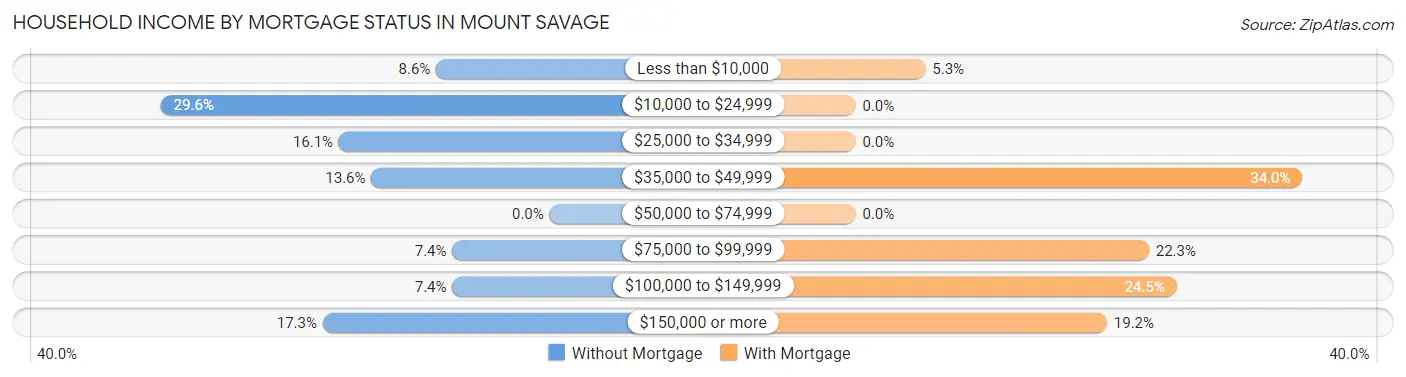
| Household Income | Without Mortgage | With Mortgage |
| Less than $10,000 | 7 (8.6%) | 5 (5.3%) |
| $10,000 to $24,999 | 24 (29.6%) | 0 (0.0%) |
| $25,000 to $34,999 | 13 (16.1%) | 0 (0.0%) |
| $35,000 to $49,999 | 11 (13.6%) | 32 (34.0%) |
| $50,000 to $74,999 | 0 (0.0%) | 0 (0.0%) |
| $75,000 to $99,999 | 6 (7.4%) | 21 (22.3%) |
| $100,000 to $149,999 | 6 (7.4%) | 23 (24.5%) |
| $150,000 or more | 14 (17.3%) | 18 (19.2%) |
| Total | 81 (100.0%) | 94 (100.0%) |
Property Value to Household Income Ratio in Mount Savage
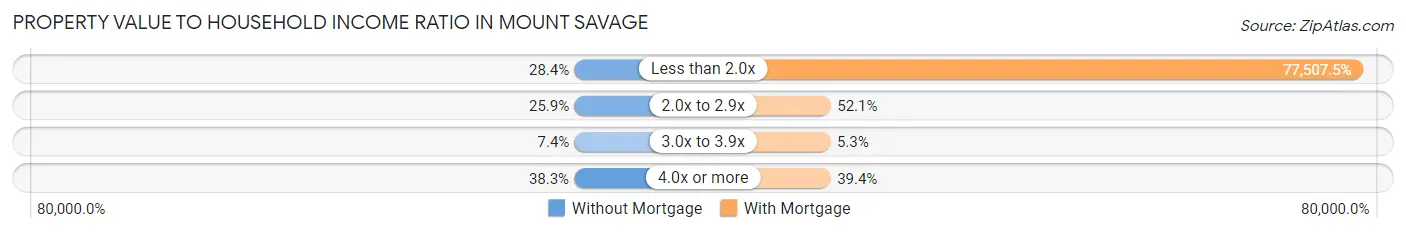
| Value-to-Income Ratio | Without Mortgage | With Mortgage |
| Less than 2.0x | 23 (28.4%) | 72,857 (77,507.4%) |
| 2.0x to 2.9x | 21 (25.9%) | 49 (52.1%) |
| 3.0x to 3.9x | 6 (7.4%) | 5 (5.3%) |
| 4.0x or more | 31 (38.3%) | 37 (39.4%) |
| Total | 81 (100.0%) | 94 (100.0%) |
Real Estate Taxes by Mortgage Status in Mount Savage
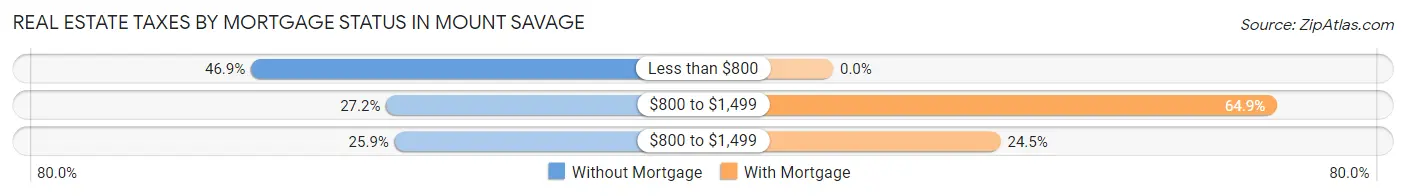
| Property Taxes | Without Mortgage | With Mortgage |
| Less than $800 | 38 (46.9%) | 0 (0.0%) |
| $800 to $1,499 | 22 (27.2%) | 61 (64.9%) |
| $800 to $1,499 | 21 (25.9%) | 23 (24.5%) |
| Total | 81 (100.0%) | 94 (100.0%) |
Health & Disability in Mount Savage
Health Insurance Coverage by Age in Mount Savage
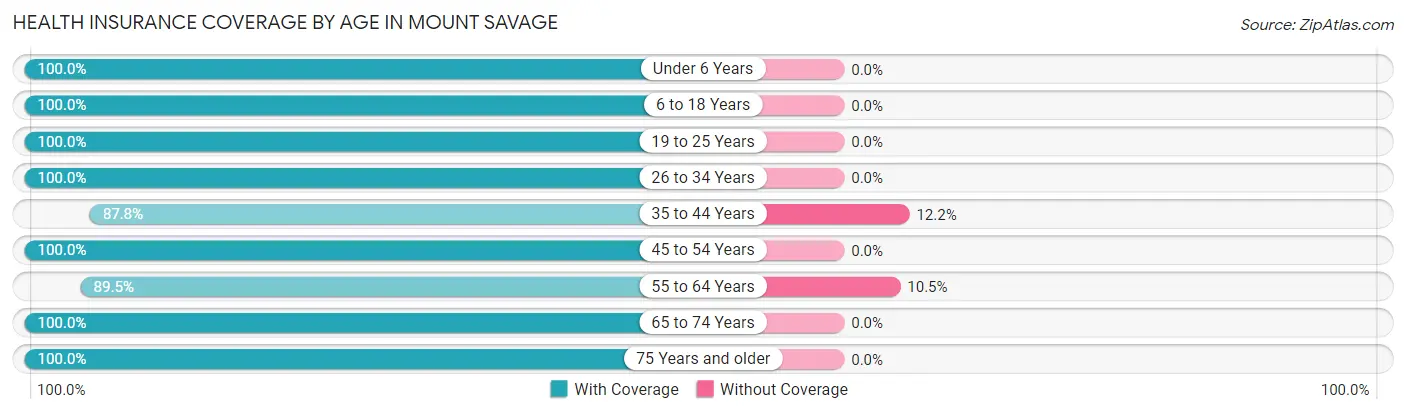
| Age Bracket | With Coverage | Without Coverage |
| Under 6 Years | 21 (100.0%) | 0 (0.0%) |
| 6 to 18 Years | 49 (100.0%) | 0 (0.0%) |
| 19 to 25 Years | 12 (100.0%) | 0 (0.0%) |
| 26 to 34 Years | 24 (100.0%) | 0 (0.0%) |
| 35 to 44 Years | 65 (87.8%) | 9 (12.2%) |
| 45 to 54 Years | 126 (100.0%) | 0 (0.0%) |
| 55 to 64 Years | 137 (89.5%) | 16 (10.5%) |
| 65 to 74 Years | 115 (100.0%) | 0 (0.0%) |
| 75 Years and older | 8 (100.0%) | 0 (0.0%) |
| Total | 557 (95.7%) | 25 (4.3%) |
Health Insurance Coverage by Citizenship Status in Mount Savage
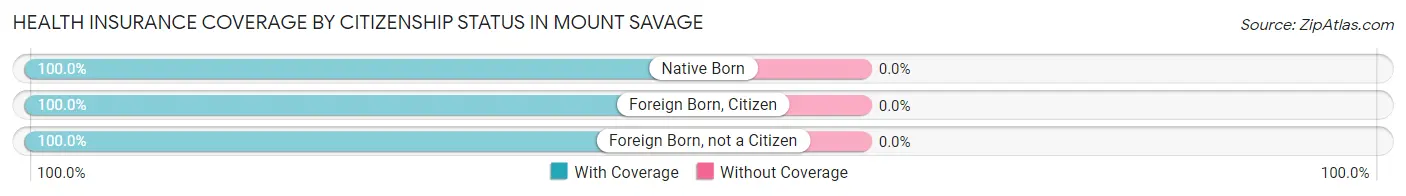
| Citizenship Status | With Coverage | Without Coverage |
| Native Born | 21 (100.0%) | 0 (0.0%) |
| Foreign Born, Citizen | 49 (100.0%) | 0 (0.0%) |
| Foreign Born, not a Citizen | 12 (100.0%) | 0 (0.0%) |
Health Insurance Coverage by Household Income in Mount Savage
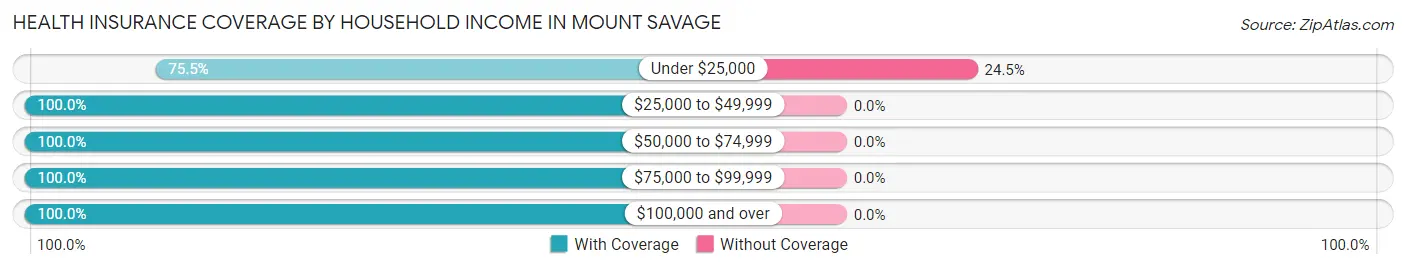
| Household Income | With Coverage | Without Coverage |
| Under $25,000 | 77 (75.5%) | 25 (24.5%) |
| $25,000 to $49,999 | 115 (100.0%) | 0 (0.0%) |
| $50,000 to $74,999 | 50 (100.0%) | 0 (0.0%) |
| $75,000 to $99,999 | 130 (100.0%) | 0 (0.0%) |
| $100,000 and over | 185 (100.0%) | 0 (0.0%) |
Public vs Private Health Insurance Coverage by Age in Mount Savage
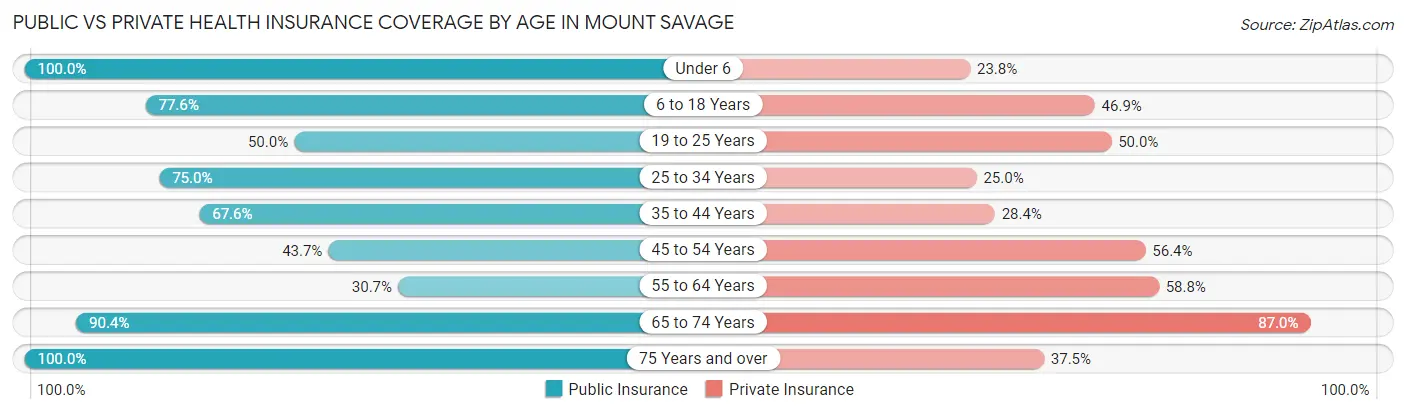
| Age Bracket | Public Insurance | Private Insurance |
| Under 6 | 21 (100.0%) | 5 (23.8%) |
| 6 to 18 Years | 38 (77.5%) | 23 (46.9%) |
| 19 to 25 Years | 6 (50.0%) | 6 (50.0%) |
| 25 to 34 Years | 18 (75.0%) | 6 (25.0%) |
| 35 to 44 Years | 50 (67.6%) | 21 (28.4%) |
| 45 to 54 Years | 55 (43.6%) | 71 (56.4%) |
| 55 to 64 Years | 47 (30.7%) | 90 (58.8%) |
| 65 to 74 Years | 104 (90.4%) | 100 (87.0%) |
| 75 Years and over | 8 (100.0%) | 3 (37.5%) |
| Total | 347 (59.6%) | 325 (55.8%) |
Disability Status by Sex by Age in Mount Savage
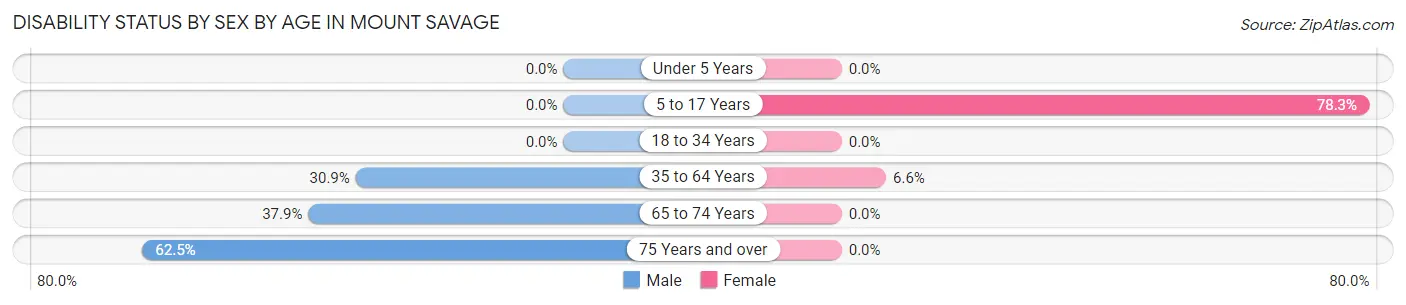
| Age Bracket | Male | Female |
| Under 5 Years | 0 (0.0%) | 0 (0.0%) |
| 5 to 17 Years | 0 (0.0%) | 18 (78.3%) |
| 18 to 34 Years | 0 (0.0%) | 0 (0.0%) |
| 35 to 64 Years | 62 (30.8%) | 10 (6.6%) |
| 65 to 74 Years | 25 (37.9%) | 0 (0.0%) |
| 75 Years and over | 5 (62.5%) | 0 (0.0%) |
Disability Class by Sex by Age in Mount Savage
Disability Class: Hearing Difficulty
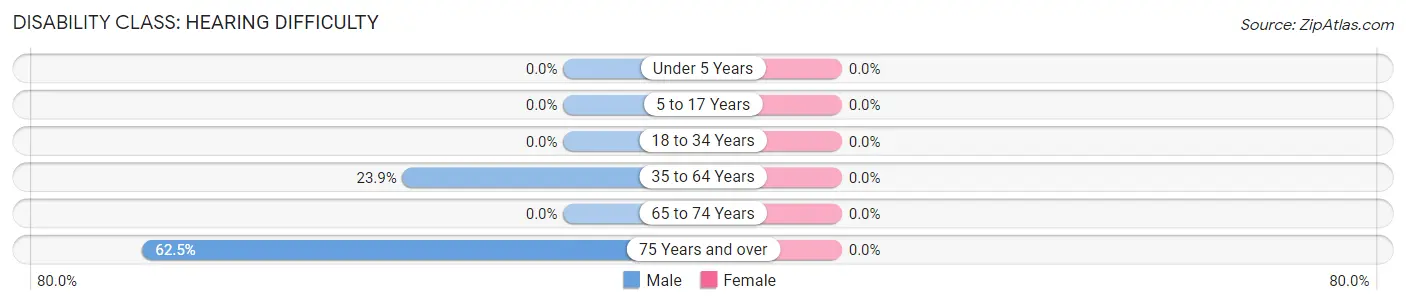
| Age Bracket | Male | Female |
| Under 5 Years | 0 (0.0%) | 0 (0.0%) |
| 5 to 17 Years | 0 (0.0%) | 0 (0.0%) |
| 18 to 34 Years | 0 (0.0%) | 0 (0.0%) |
| 35 to 64 Years | 48 (23.9%) | 0 (0.0%) |
| 65 to 74 Years | 0 (0.0%) | 0 (0.0%) |
| 75 Years and over | 5 (62.5%) | 0 (0.0%) |
Disability Class: Vision Difficulty
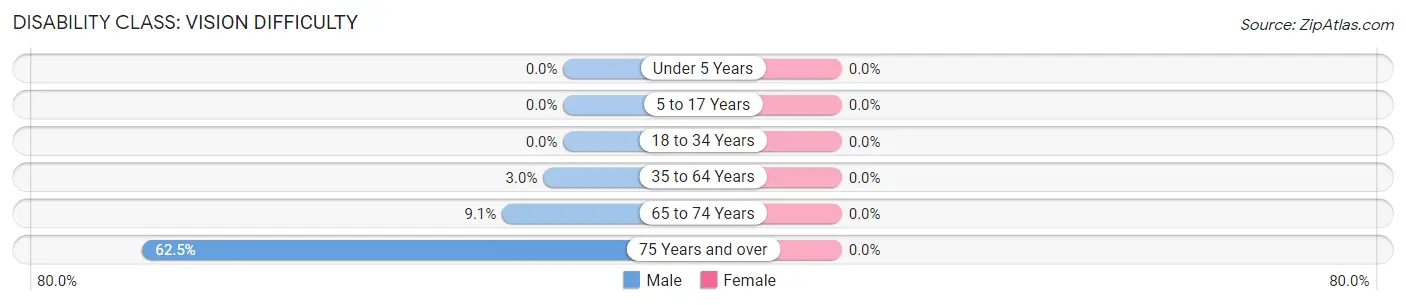
| Age Bracket | Male | Female |
| Under 5 Years | 0 (0.0%) | 0 (0.0%) |
| 5 to 17 Years | 0 (0.0%) | 0 (0.0%) |
| 18 to 34 Years | 0 (0.0%) | 0 (0.0%) |
| 35 to 64 Years | 6 (3.0%) | 0 (0.0%) |
| 65 to 74 Years | 6 (9.1%) | 0 (0.0%) |
| 75 Years and over | 5 (62.5%) | 0 (0.0%) |
Disability Class: Cognitive Difficulty
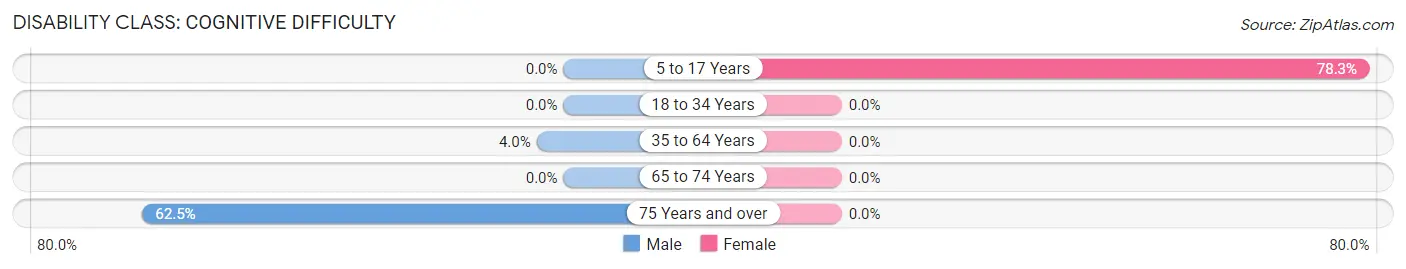
| Age Bracket | Male | Female |
| 5 to 17 Years | 0 (0.0%) | 18 (78.3%) |
| 18 to 34 Years | 0 (0.0%) | 0 (0.0%) |
| 35 to 64 Years | 8 (4.0%) | 0 (0.0%) |
| 65 to 74 Years | 0 (0.0%) | 0 (0.0%) |
| 75 Years and over | 5 (62.5%) | 0 (0.0%) |
Disability Class: Ambulatory Difficulty
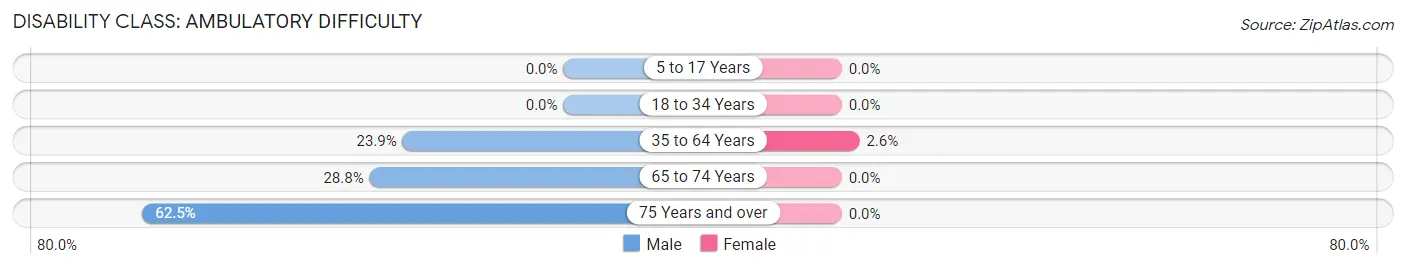
| Age Bracket | Male | Female |
| 5 to 17 Years | 0 (0.0%) | 0 (0.0%) |
| 18 to 34 Years | 0 (0.0%) | 0 (0.0%) |
| 35 to 64 Years | 48 (23.9%) | 4 (2.6%) |
| 65 to 74 Years | 19 (28.8%) | 0 (0.0%) |
| 75 Years and over | 5 (62.5%) | 0 (0.0%) |
Disability Class: Self-Care Difficulty
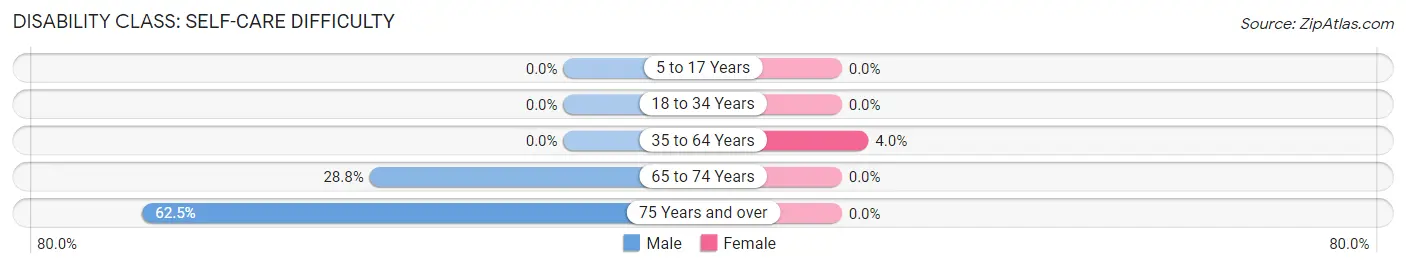
| Age Bracket | Male | Female |
| 5 to 17 Years | 0 (0.0%) | 0 (0.0%) |
| 18 to 34 Years | 0 (0.0%) | 0 (0.0%) |
| 35 to 64 Years | 0 (0.0%) | 6 (4.0%) |
| 65 to 74 Years | 19 (28.8%) | 0 (0.0%) |
| 75 Years and over | 5 (62.5%) | 0 (0.0%) |
Technology Access in Mount Savage
Computing Device Access in Mount Savage
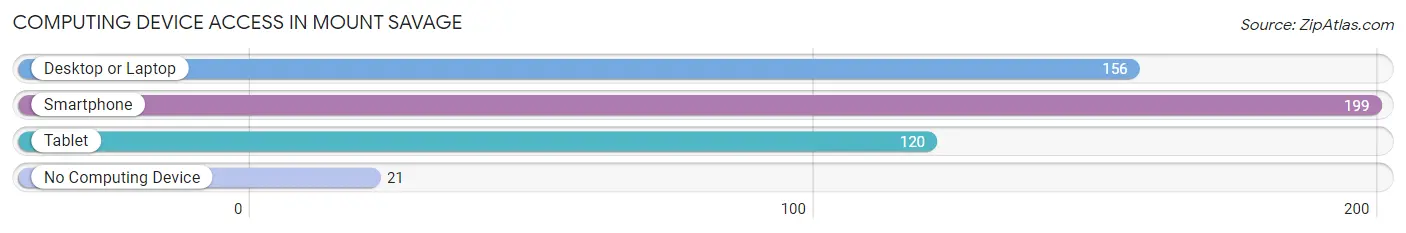
| Device Type | # Households | % Households |
| Desktop or Laptop | 156 | 66.4% |
| Smartphone | 199 | 84.7% |
| Tablet | 120 | 51.1% |
| No Computing Device | 21 | 8.9% |
| Total | 235 | 100.0% |
Internet Access in Mount Savage
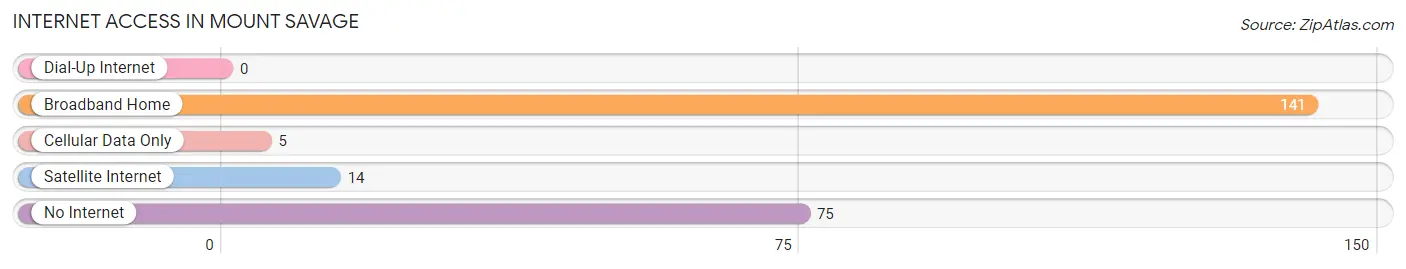
| Internet Type | # Households | % Households |
| Dial-Up Internet | 0 | 0.0% |
| Broadband Home | 141 | 60.0% |
| Cellular Data Only | 5 | 2.1% |
| Satellite Internet | 14 | 6.0% |
| No Internet | 75 | 31.9% |
| Total | 235 | 100.0% |
Mount Savage Summary
History
The small town of Mount Savage, Maryland is located in Allegany County, in the western part of the state. It is situated in the Appalachian Mountains, and is part of the Cumberland Metropolitan Statistical Area. The town was founded in 1817 by a group of settlers from Pennsylvania, who were looking for a place to build a new life. The town was named after the nearby Savage Mountain, which was named after the Native American chief, Chief Savage.
The town was originally a small farming community, and the main industry was coal mining. The coal mines were the main source of employment for the town, and the town grew rapidly in the late 19th century. By the early 20th century, the town had become a major coal mining center, and the population had grown to over 2,000 people.
The town was also home to a number of other industries, including a brickyard, a sawmill, and a flour mill. The town also had a number of stores, including a general store, a drug store, and a hardware store.
The town was also home to a number of churches, including the Methodist Episcopal Church, the Presbyterian Church, and the Roman Catholic Church. The town also had a number of schools, including a high school, a middle school, and an elementary school.
Geography
Mount Savage is located in the Appalachian Mountains, in the western part of Maryland. The town is situated in a valley, surrounded by hills and mountains. The town is located at the intersection of Interstate 68 and US Route 40. The town is located about 25 miles east of Cumberland, Maryland, and about 50 miles west of Baltimore, Maryland.
The town is located in a temperate climate, with hot summers and cold winters. The average temperature in the summer is around 75 degrees Fahrenheit, and the average temperature in the winter is around 35 degrees Fahrenheit. The town receives an average of 40 inches of precipitation per year.
Economy
The economy of Mount Savage is largely based on coal mining. The town was once a major coal mining center, and the coal mines were the main source of employment for the town. The coal mines have since closed, but the town still has a number of other industries, including a brickyard, a sawmill, and a flour mill.
The town also has a number of stores, including a general store, a drug store, and a hardware store. The town also has a number of restaurants, including a pizza parlor, a diner, and a Chinese restaurant.
Demographics
As of the 2010 census, the population of Mount Savage was 1,845. The racial makeup of the town was 95.3% White, 1.2% African American, 0.3% Native American, 0.3% Asian, 0.1% Pacific Islander, 0.7% from other races, and 2.1% from two or more races. Hispanic or Latino of any race were 1.7% of the population.
The median household income in the town was $37,917, and the median family income was $45,625. The per capita income in the town was $19,945. About 11.3% of the population was below the poverty line.
Common Questions
What is the Total Population of Mount Savage?
Total Population of Mount Savage is 582.
What is the Total Male Population of Mount Savage?
Total Male Population of Mount Savage is 340.
What is the Total Female Population of Mount Savage?
Total Female Population of Mount Savage is 242.
What is the Ratio of Males per 100 Females in Mount Savage?
There are 140.50 Males per 100 Females in Mount Savage.
What is the Ratio of Females per 100 Males in Mount Savage?
There are 71.18 Females per 100 Males in Mount Savage.
What is the Median Population Age in Mount Savage?
Median Population Age in Mount Savage is 54.0 Years.
What is the Average Family Size in Mount Savage
Average Family Size in Mount Savage is 2.9 People.
What is the Average Household Size in Mount Savage
Average Household Size in Mount Savage is 2.5 People.
What is Per Capita Income in Mount Savage?
Per Capita income in Mount Savage is $42,460.
What is the Median Family Income in Mount Savage?
Median Family Income in Mount Savage is $66,042.
What is the Median Household income in Mount Savage?
Median Household Income in Mount Savage is $48,355.
What is Inequality or Gini Index in Mount Savage?
Inequality or Gini Index in Mount Savage is 0.60.
How Large is the Labor Force in Mount Savage?
There are 320 People in the Labor Forcein in Mount Savage.
What is the Percentage of People in the Labor Force in Mount Savage?
61.2% of People are in the Labor Force in Mount Savage.
What is the Unemployment Rate in Mount Savage?
Unemployment Rate in Mount Savage is 20.6%.