Gambrills, MD Map & Demographics
Gambrills Map
Gambrills Overview
$55,717
PER CAPITA INCOME
$165,469
AVG FAMILY INCOME
$146,875
AVG HOUSEHOLD INCOME
31.8%
WAGE / INCOME GAP [ % ]
68.2¢/ $1
WAGE / INCOME GAP [ $ ]
$32,080
FAMILY INCOME DEFICIT
0.37
INEQUALITY / GINI INDEX
3,111
TOTAL POPULATION
1,544
MALE POPULATION
1,567
FEMALE POPULATION
98.53
MALES / 100 FEMALES
101.49
FEMALES / 100 MALES
42.0
MEDIAN AGE
3.4
AVG FAMILY SIZE
3.1
AVG HOUSEHOLD SIZE
1,629
LABOR FORCE [ PEOPLE ]
67.3%
PERCENT IN LABOR FORCE
2.0%
UNEMPLOYMENT RATE
Gambrills Zip Codes
Gambrills Area Codes
Income in Gambrills
Income Overview in Gambrills
Per Capita Income in Gambrills is $55,717, while median incomes of families and households are $165,469 and $146,875 respectively.
| Characteristic | Number | Measure |
| Per Capita Income | 3,111 | $55,717 |
| Median Family Income | 840 | $165,469 |
| Mean Family Income | 840 | $178,815 |
| Median Household Income | 992 | $146,875 |
| Mean Household Income | 992 | $165,164 |
| Income Deficit | 840 | $32,080 |
| Wage / Income Gap (%) | 3,111 | 31.76% |
| Wage / Income Gap ($) | 3,111 | 68.24¢ per $1 |
| Gini / Inequality Index | 3,111 | 0.37 |
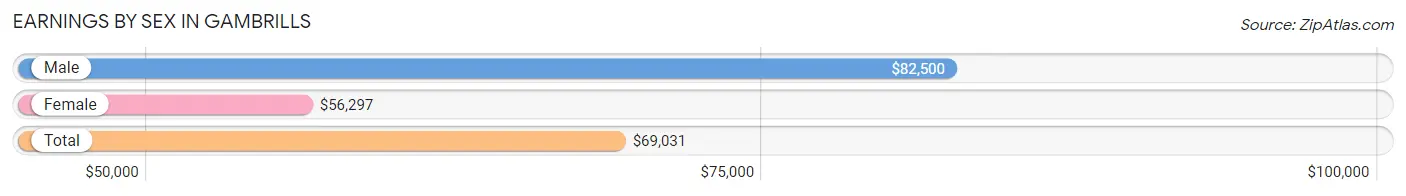
Earnings by Sex in Gambrills
Average Earnings in Gambrills are $69,031, $82,500 for men and $56,297 for women, a difference of 31.8%.
| Sex | Number | Average Earnings |
| Male | 926 (55.3%) | $82,500 |
| Female | 747 (44.7%) | $56,297 |
| Total | 1,673 (100.0%) | $69,031 |
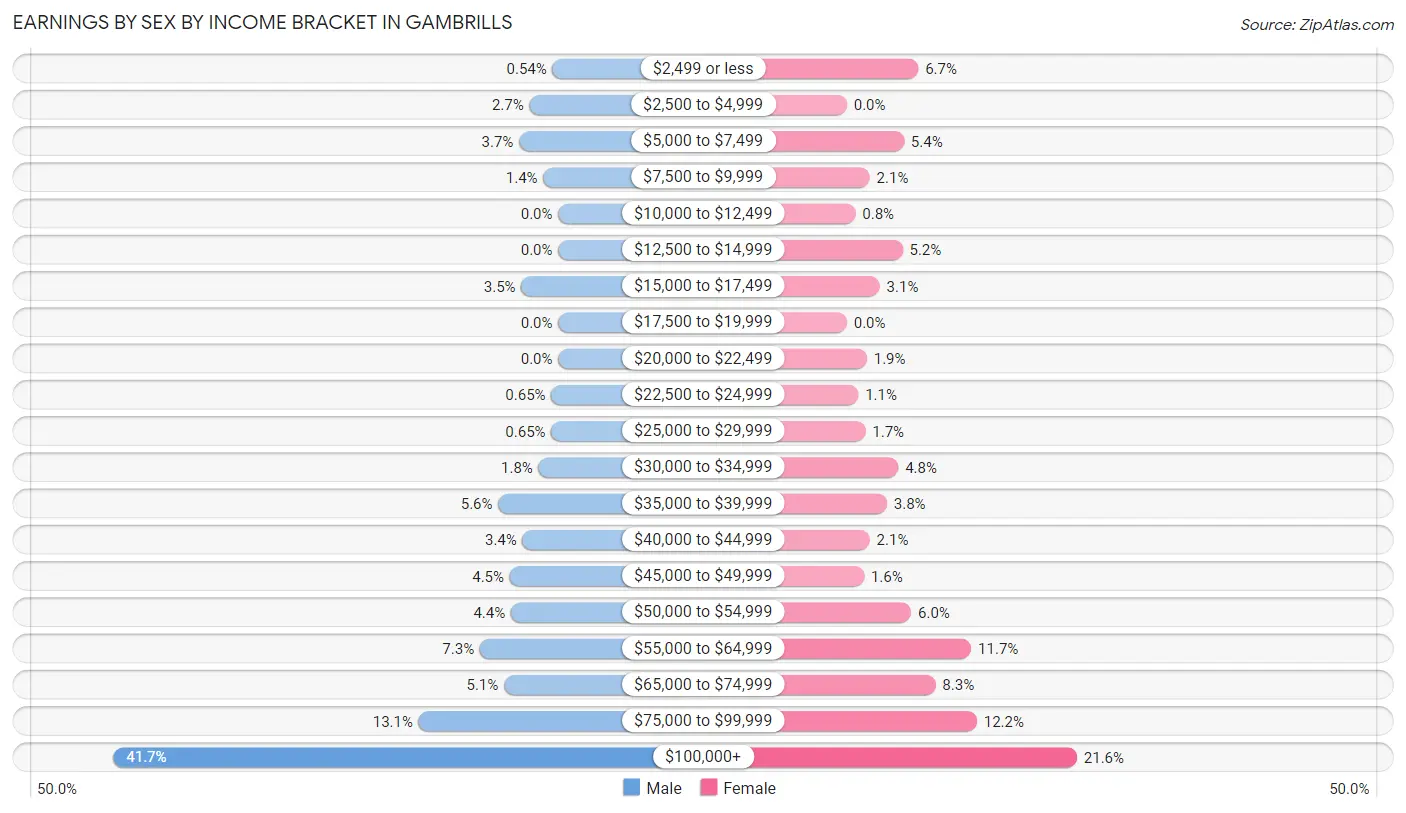
Earnings by Sex by Income Bracket in Gambrills
The most common earnings brackets in Gambrills are $100,000+ for men (386 | 41.7%) and $100,000+ for women (161 | 21.5%).
| Income | Male | Female |
| $2,499 or less | 5 (0.5%) | 50 (6.7%) |
| $2,500 to $4,999 | 25 (2.7%) | 0 (0.0%) |
| $5,000 to $7,499 | 34 (3.7%) | 40 (5.3%) |
| $7,500 to $9,999 | 13 (1.4%) | 16 (2.1%) |
| $10,000 to $12,499 | 0 (0.0%) | 6 (0.8%) |
| $12,500 to $14,999 | 0 (0.0%) | 39 (5.2%) |
| $15,000 to $17,499 | 32 (3.5%) | 23 (3.1%) |
| $17,500 to $19,999 | 0 (0.0%) | 0 (0.0%) |
| $20,000 to $22,499 | 0 (0.0%) | 14 (1.9%) |
| $22,500 to $24,999 | 6 (0.6%) | 8 (1.1%) |
| $25,000 to $29,999 | 6 (0.6%) | 13 (1.7%) |
| $30,000 to $34,999 | 17 (1.8%) | 36 (4.8%) |
| $35,000 to $39,999 | 52 (5.6%) | 28 (3.7%) |
| $40,000 to $44,999 | 31 (3.4%) | 16 (2.1%) |
| $45,000 to $49,999 | 42 (4.5%) | 12 (1.6%) |
| $50,000 to $54,999 | 41 (4.4%) | 45 (6.0%) |
| $55,000 to $64,999 | 68 (7.3%) | 87 (11.7%) |
| $65,000 to $74,999 | 47 (5.1%) | 62 (8.3%) |
| $75,000 to $99,999 | 121 (13.1%) | 91 (12.2%) |
| $100,000+ | 386 (41.7%) | 161 (21.5%) |
| Total | 926 (100.0%) | 747 (100.0%) |
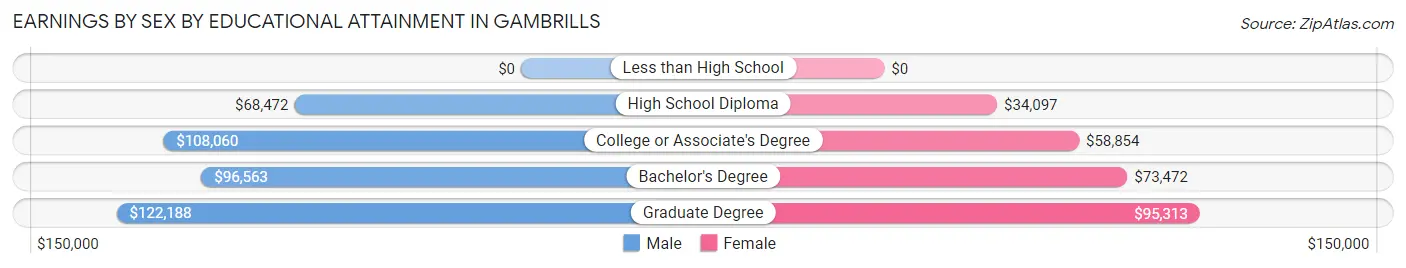
Earnings by Sex by Educational Attainment in Gambrills
Average earnings in Gambrills are $90,357 for men and $60,000 for women, a difference of 33.6%. Men with an educational attainment of graduate degree enjoy the highest average annual earnings of $122,188, while those with high school diploma education earn the least with $68,472. Women with an educational attainment of graduate degree earn the most with the average annual earnings of $95,313, while those with high school diploma education have the smallest earnings of $34,097.
| Educational Attainment | Male Income | Female Income |
| Less than High School | - | - |
| High School Diploma | $68,472 | $34,097 |
| College or Associate's Degree | $108,060 | $58,854 |
| Bachelor's Degree | $96,563 | $73,472 |
| Graduate Degree | $122,188 | $95,313 |
| Total | $90,357 | $60,000 |
Family Income in Gambrills
Family Income Brackets in Gambrills
According to the Gambrills family income data, there are 304 families falling into the $200,000+ income range, which is the most common income bracket and makes up 36.2% of all families. Conversely, the $10,000 to $14,999 income bracket is the least frequent group with only 1 families (0.1%) belonging to this category.
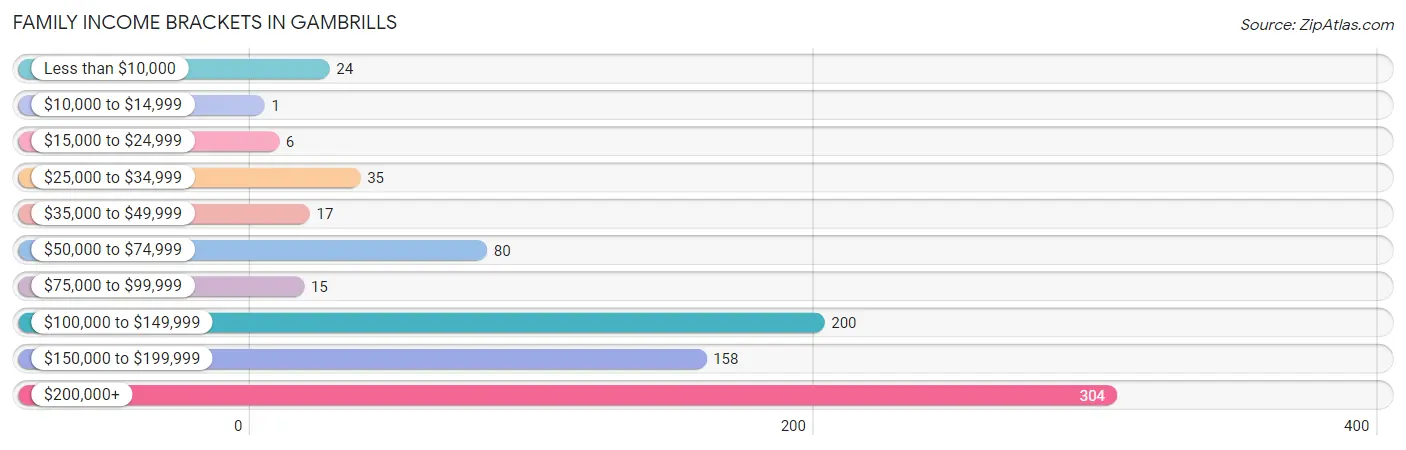
| Income Bracket | # Families | % Families |
| Less than $10,000 | 24 | 2.9% |
| $10,000 to $14,999 | 1 | 0.1% |
| $15,000 to $24,999 | 6 | 0.7% |
| $25,000 to $34,999 | 35 | 4.2% |
| $35,000 to $49,999 | 17 | 2.0% |
| $50,000 to $74,999 | 80 | 9.5% |
| $75,000 to $99,999 | 15 | 1.8% |
| $100,000 to $149,999 | 200 | 23.8% |
| $150,000 to $199,999 | 158 | 18.8% |
| $200,000+ | 304 | 36.2% |
Family Income by Famaliy Size in Gambrills
4-person families (155 | 18.4%) account for the highest median family income in Gambrills with $194,250 per family, while 2-person families (327 | 38.9%) have the highest median income of $81,490 per family member.
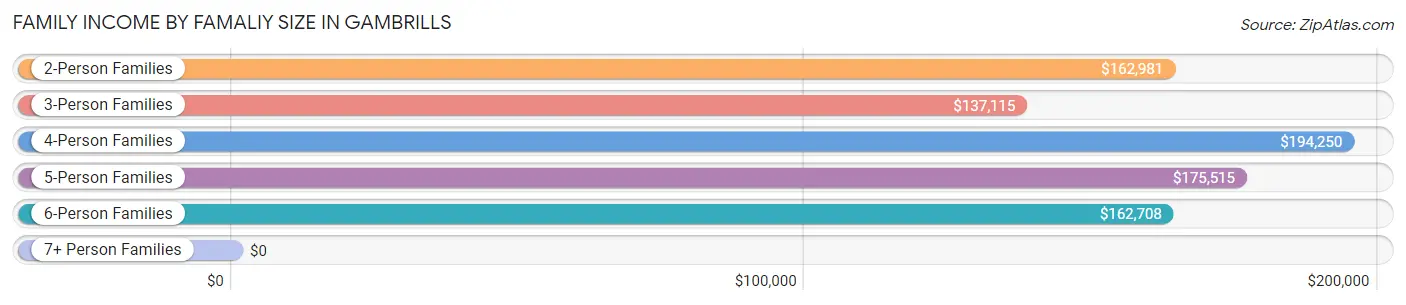
| Income Bracket | # Families | Median Income |
| 2-Person Families | 327 (38.9%) | $162,981 |
| 3-Person Families | 198 (23.6%) | $137,115 |
| 4-Person Families | 155 (18.4%) | $194,250 |
| 5-Person Families | 131 (15.6%) | $175,515 |
| 6-Person Families | 23 (2.7%) | $162,708 |
| 7+ Person Families | 6 (0.7%) | $0 |
| Total | 840 (100.0%) | $165,469 |
Family Income by Number of Earners in Gambrills
The median family income in Gambrills is $165,469, with families comprising 3+ earners (151) having the highest median family income of $235,208, while families with no earners (112) have the lowest median family income of $83,750, accounting for 18.0% and 13.3% of families, respectively.
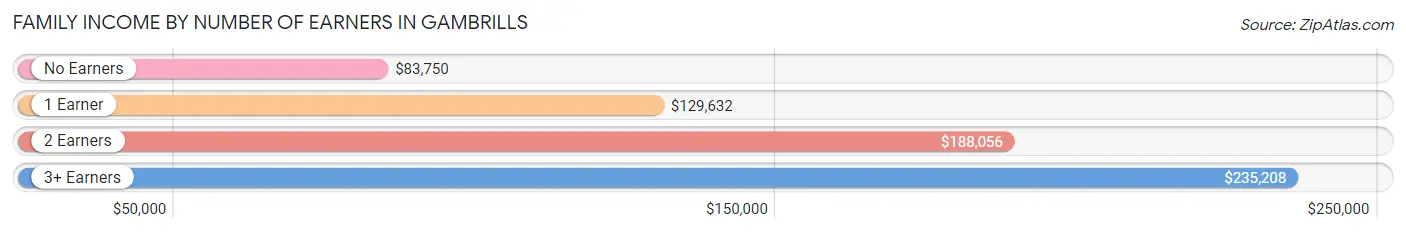
| Number of Earners | # Families | Median Income |
| No Earners | 112 (13.3%) | $83,750 |
| 1 Earner | 211 (25.1%) | $129,632 |
| 2 Earners | 366 (43.6%) | $188,056 |
| 3+ Earners | 151 (18.0%) | $235,208 |
| Total | 840 (100.0%) | $165,469 |
Household Income in Gambrills
Household Income Brackets in Gambrills
With 339 households falling in the category, the $200,000+ income range is the most frequent in Gambrills, accounting for 34.2% of all households. In contrast, only 1 households (0.1%) fall into the $10,000 to $14,999 income bracket, making it the least populous group.
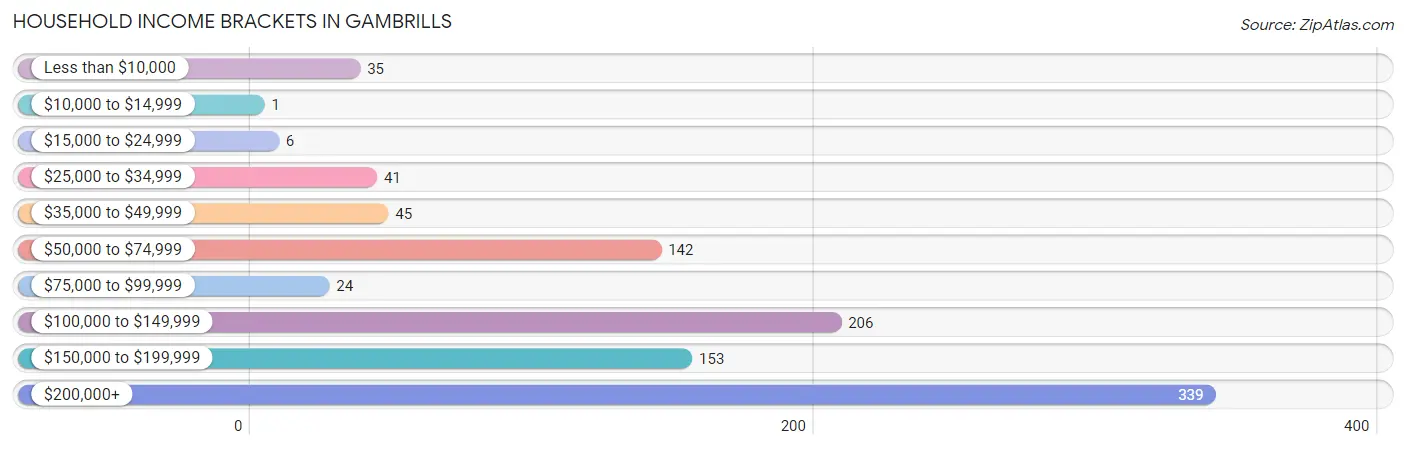
| Income Bracket | # Households | % Households |
| Less than $10,000 | 35 | 3.5% |
| $10,000 to $14,999 | 1 | 0.1% |
| $15,000 to $24,999 | 6 | 0.6% |
| $25,000 to $34,999 | 41 | 4.1% |
| $35,000 to $49,999 | 45 | 4.5% |
| $50,000 to $74,999 | 142 | 14.3% |
| $75,000 to $99,999 | 24 | 2.4% |
| $100,000 to $149,999 | 206 | 20.8% |
| $150,000 to $199,999 | 153 | 15.4% |
| $200,000+ | 339 | 34.2% |
Household Income by Householder Age in Gambrills
The median household income in Gambrills is $146,875, with the highest median household income of $176,838 found in the 25 to 44 years age bracket for the primary householder. A total of 251 households (25.3%) fall into this category. Meanwhile, the 15 to 24 years age bracket for the primary householder has the lowest median household income of $0, with 6 households (0.6%) in this group.
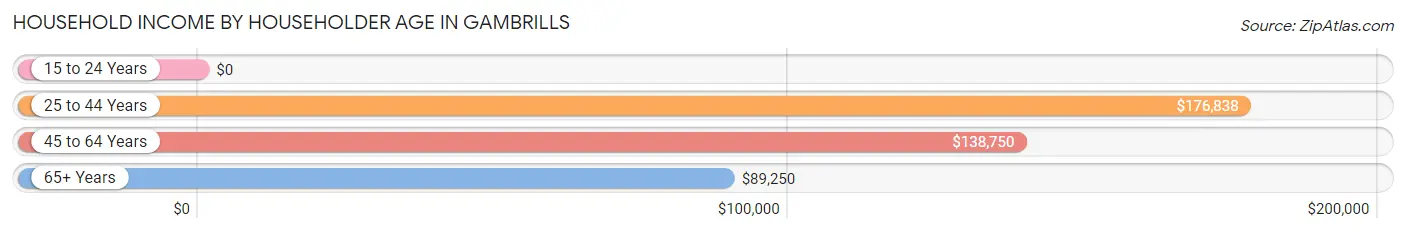
| Income Bracket | # Households | Median Income |
| 15 to 24 Years | 6 (0.6%) | $0 |
| 25 to 44 Years | 251 (25.3%) | $176,838 |
| 45 to 64 Years | 500 (50.4%) | $138,750 |
| 65+ Years | 235 (23.7%) | $89,250 |
| Total | 992 (100.0%) | $146,875 |
Poverty in Gambrills
Income Below Poverty by Sex and Age in Gambrills
With 5.8% poverty level for males and 6.0% for females among the residents of Gambrills, 75 year old and over males and 18 to 24 year old females are the most vulnerable to poverty, with 19 males (20.6%) and 26 females (40.0%) in their respective age groups living below the poverty level.
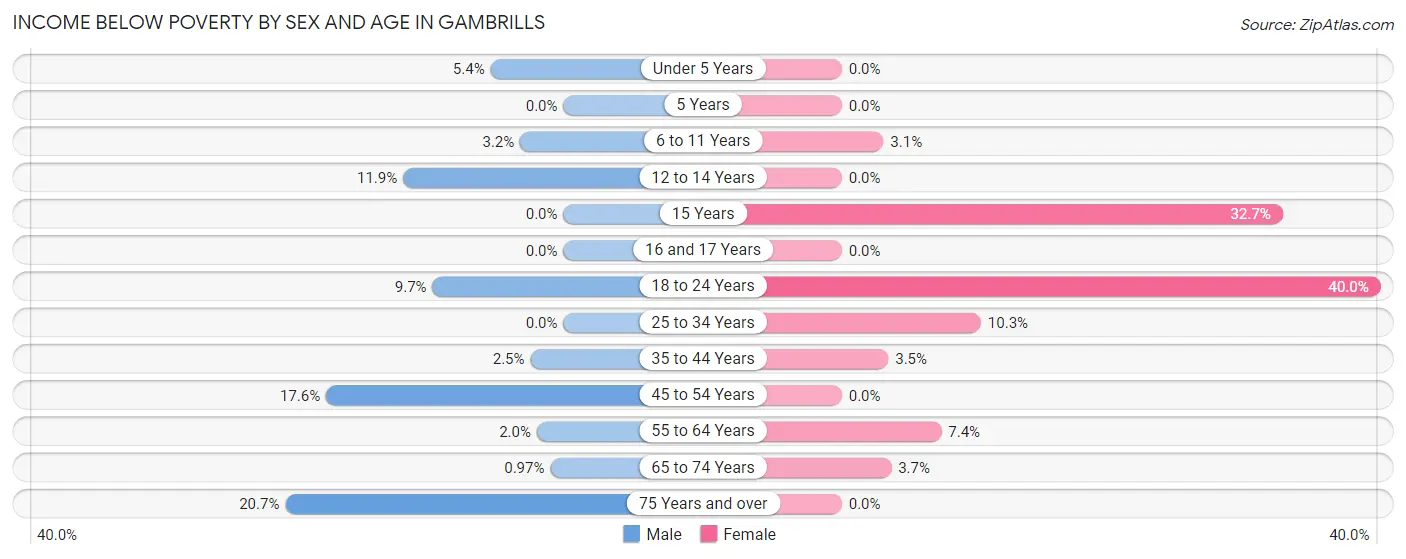
| Age Bracket | Male | Female |
| Under 5 Years | 4 (5.4%) | 0 (0.0%) |
| 5 Years | 0 (0.0%) | 0 (0.0%) |
| 6 to 11 Years | 5 (3.2%) | 5 (3.1%) |
| 12 to 14 Years | 5 (11.9%) | 0 (0.0%) |
| 15 Years | 0 (0.0%) | 18 (32.7%) |
| 16 and 17 Years | 0 (0.0%) | 0 (0.0%) |
| 18 to 24 Years | 7 (9.7%) | 26 (40.0%) |
| 25 to 34 Years | 0 (0.0%) | 19 (10.3%) |
| 35 to 44 Years | 6 (2.5%) | 5 (3.5%) |
| 45 to 54 Years | 37 (17.6%) | 0 (0.0%) |
| 55 to 64 Years | 6 (2.0%) | 17 (7.4%) |
| 65 to 74 Years | 1 (1.0%) | 4 (3.7%) |
| 75 Years and over | 19 (20.6%) | 0 (0.0%) |
| Total | 90 (5.8%) | 94 (6.0%) |
Income Above Poverty by Sex and Age in Gambrills
According to the poverty statistics in Gambrills, males aged 5 years and females aged under 5 years are the age groups that are most secure financially, with 100.0% of males and 100.0% of females in these age groups living above the poverty line.
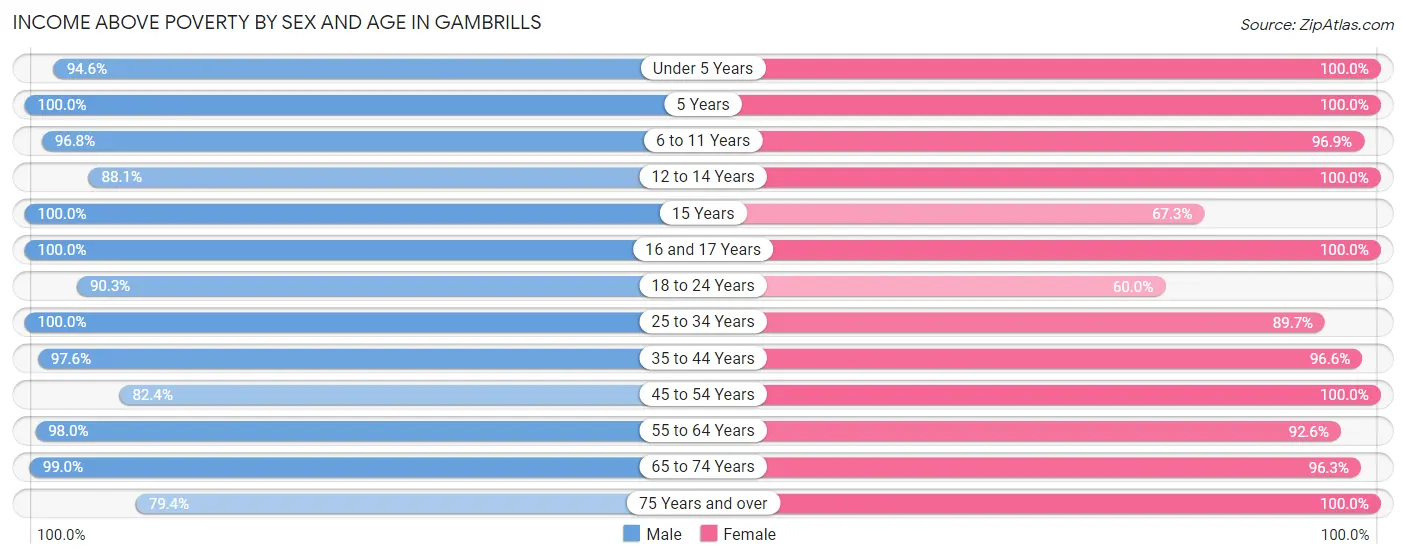
| Age Bracket | Male | Female |
| Under 5 Years | 70 (94.6%) | 96 (100.0%) |
| 5 Years | 9 (100.0%) | 30 (100.0%) |
| 6 to 11 Years | 151 (96.8%) | 157 (96.9%) |
| 12 to 14 Years | 37 (88.1%) | 39 (100.0%) |
| 15 Years | 27 (100.0%) | 37 (67.3%) |
| 16 and 17 Years | 31 (100.0%) | 47 (100.0%) |
| 18 to 24 Years | 65 (90.3%) | 39 (60.0%) |
| 25 to 34 Years | 178 (100.0%) | 165 (89.7%) |
| 35 to 44 Years | 239 (97.6%) | 140 (96.6%) |
| 45 to 54 Years | 173 (82.4%) | 304 (100.0%) |
| 55 to 64 Years | 299 (98.0%) | 213 (92.6%) |
| 65 to 74 Years | 102 (99.0%) | 105 (96.3%) |
| 75 Years and over | 73 (79.3%) | 101 (100.0%) |
| Total | 1,454 (94.2%) | 1,473 (94.0%) |
Income Below Poverty Among Married-Couple Families in Gambrills
The poverty statistics for married-couple families in Gambrills show that 3.3% or 25 of the total 763 families live below the poverty line. Families with 3 or 4 children have the highest poverty rate of 9.8%, comprising of 6 families. On the other hand, families with no children have the lowest poverty rate of 0.3%, which includes 1 families.
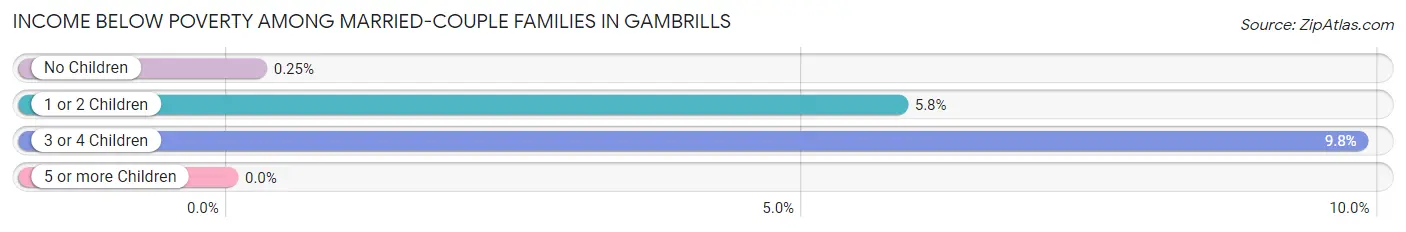
| Children | Above Poverty | Below Poverty |
| No Children | 392 (99.8%) | 1 (0.3%) |
| 1 or 2 Children | 291 (94.2%) | 18 (5.8%) |
| 3 or 4 Children | 55 (90.2%) | 6 (9.8%) |
| 5 or more Children | 0 (0.0%) | 0 (0.0%) |
| Total | 738 (96.7%) | 25 (3.3%) |
Income Below Poverty Among Single-Parent Households in Gambrills
| Children | Single Father | Single Mother |
| No Children | 0 (0.0%) | 0 (0.0%) |
| 1 or 2 Children | 0 (0.0%) | 0 (0.0%) |
| 3 or 4 Children | 0 (0.0%) | 0 (0.0%) |
| 5 or more Children | 0 (0.0%) | 0 (0.0%) |
| Total | 0 (0.0%) | 0 (0.0%) |
Income Below Poverty Among Married-Couple vs Single-Parent Households in Gambrills
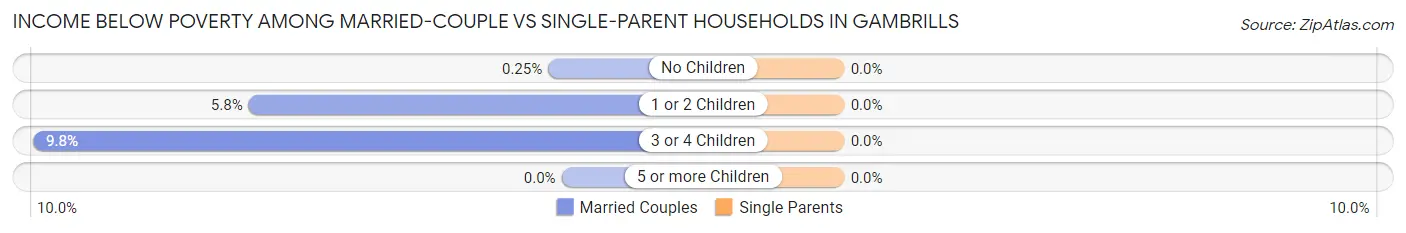
| Children | Married-Couple Families | Single-Parent Households |
| No Children | 1 (0.3%) | 0 (0.0%) |
| 1 or 2 Children | 18 (5.8%) | 0 (0.0%) |
| 3 or 4 Children | 6 (9.8%) | 0 (0.0%) |
| 5 or more Children | 0 (0.0%) | 0 (0.0%) |
| Total | 25 (3.3%) | 0 (0.0%) |
Race in Gambrills
The most populous races in Gambrills are White / Caucasian (2,458 | 79.0%), Two or more Races (384 | 12.3%), and Hispanic or Latino (292 | 9.4%).
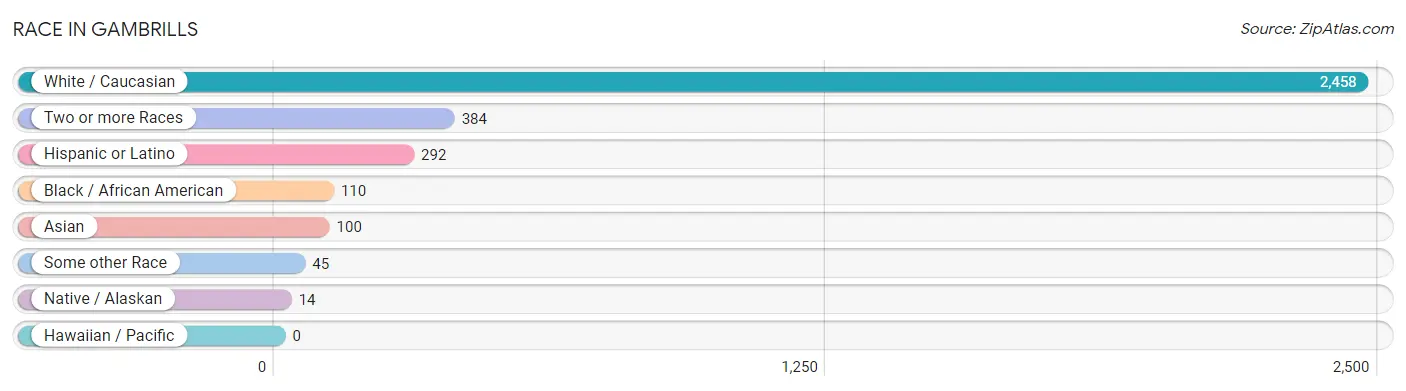
| Race | # Population | % Population |
| Asian | 100 | 3.2% |
| Black / African American | 110 | 3.5% |
| Hawaiian / Pacific | 0 | 0.0% |
| Hispanic or Latino | 292 | 9.4% |
| Native / Alaskan | 14 | 0.4% |
| White / Caucasian | 2,458 | 79.0% |
| Two or more Races | 384 | 12.3% |
| Some other Race | 45 | 1.5% |
| Total | 3,111 | 100.0% |
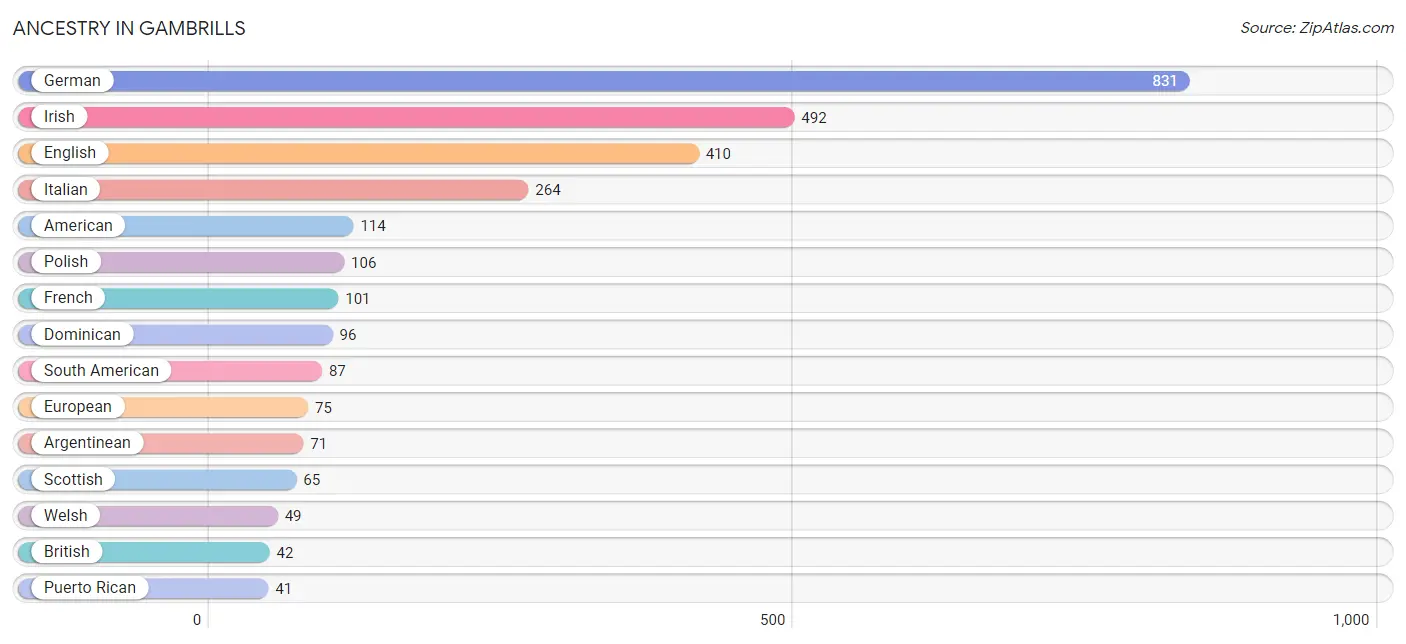
Ancestry in Gambrills
The most populous ancestries reported in Gambrills are German (831 | 26.7%), Irish (492 | 15.8%), English (410 | 13.2%), Italian (264 | 8.5%), and American (114 | 3.7%), together accounting for 67.8% of all Gambrills residents.
| Ancestry | # Population | % Population |
| American | 114 | 3.7% |
| Argentinean | 71 | 2.3% |
| Austrian | 21 | 0.7% |
| Belgian | 6 | 0.2% |
| British | 42 | 1.3% |
| Burmese | 30 | 1.0% |
| Celtic | 6 | 0.2% |
| Central American | 28 | 0.9% |
| Chippewa | 29 | 0.9% |
| Colombian | 16 | 0.5% |
| Czech | 5 | 0.2% |
| Danish | 11 | 0.4% |
| Dominican | 96 | 3.1% |
| Eastern European | 11 | 0.4% |
| English | 410 | 13.2% |
| European | 75 | 2.4% |
| French | 101 | 3.3% |
| French Canadian | 31 | 1.0% |
| German | 831 | 26.7% |
| Greek | 17 | 0.5% |
| Indian (Asian) | 31 | 1.0% |
| Irish | 492 | 15.8% |
| Italian | 264 | 8.5% |
| Jamaican | 5 | 0.2% |
| Korean | 18 | 0.6% |
| Mexican | 40 | 1.3% |
| Northern European | 11 | 0.4% |
| Norwegian | 12 | 0.4% |
| Pakistani | 11 | 0.4% |
| Polish | 106 | 3.4% |
| Puerto Rican | 41 | 1.3% |
| Romanian | 35 | 1.1% |
| Russian | 6 | 0.2% |
| Salvadoran | 28 | 0.9% |
| Scotch-Irish | 12 | 0.4% |
| Scottish | 65 | 2.1% |
| Serbian | 9 | 0.3% |
| Slavic | 17 | 0.5% |
| South American | 87 | 2.8% |
| Sri Lankan | 35 | 1.1% |
| Swedish | 23 | 0.7% |
| Swiss | 6 | 0.2% |
| Thai | 9 | 0.3% |
| Ukrainian | 12 | 0.4% |
| Welsh | 49 | 1.6% |
| West Indian | 23 | 0.7% | View All 46 Rows |
Immigrants in Gambrills
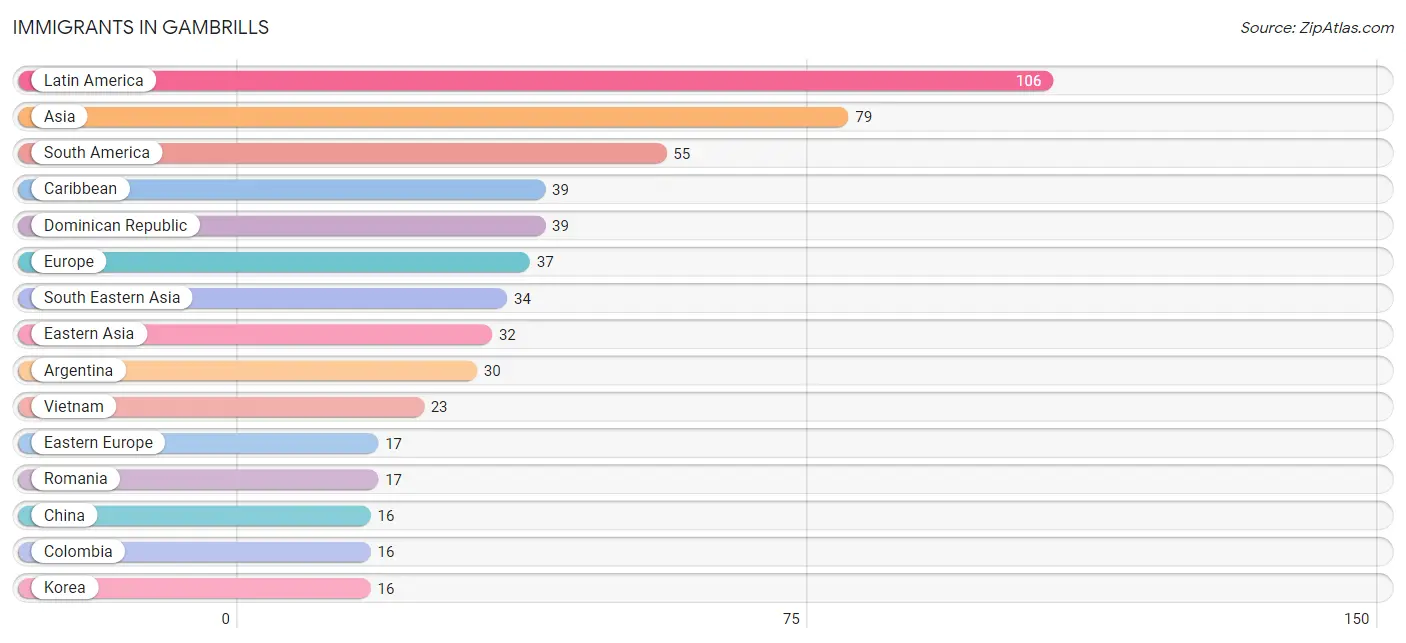
The most numerous immigrant groups reported in Gambrills came from Latin America (106 | 3.4%), Asia (79 | 2.5%), South America (55 | 1.8%), Caribbean (39 | 1.3%), and Dominican Republic (39 | 1.3%), together accounting for 10.2% of all Gambrills residents.
| Immigration Origin | # Population | % Population |
| Argentina | 30 | 1.0% |
| Asia | 79 | 2.5% |
| Bangladesh | 9 | 0.3% |
| Belgium | 6 | 0.2% |
| Brazil | 9 | 0.3% |
| Caribbean | 39 | 1.3% |
| Central America | 12 | 0.4% |
| China | 16 | 0.5% |
| Colombia | 16 | 0.5% |
| Dominican Republic | 39 | 1.3% |
| Eastern Asia | 32 | 1.0% |
| Eastern Europe | 17 | 0.5% |
| El Salvador | 12 | 0.4% |
| England | 5 | 0.2% |
| Europe | 37 | 1.2% |
| Germany | 9 | 0.3% |
| India | 4 | 0.1% |
| Korea | 16 | 0.5% |
| Latin America | 106 | 3.4% |
| Northern Europe | 5 | 0.2% |
| Romania | 17 | 0.5% |
| South America | 55 | 1.8% |
| South Central Asia | 13 | 0.4% |
| South Eastern Asia | 34 | 1.1% |
| Thailand | 11 | 0.4% |
| Vietnam | 23 | 0.7% |
| Western Europe | 15 | 0.5% | View All 27 Rows |
Sex and Age in Gambrills
Sex and Age in Gambrills
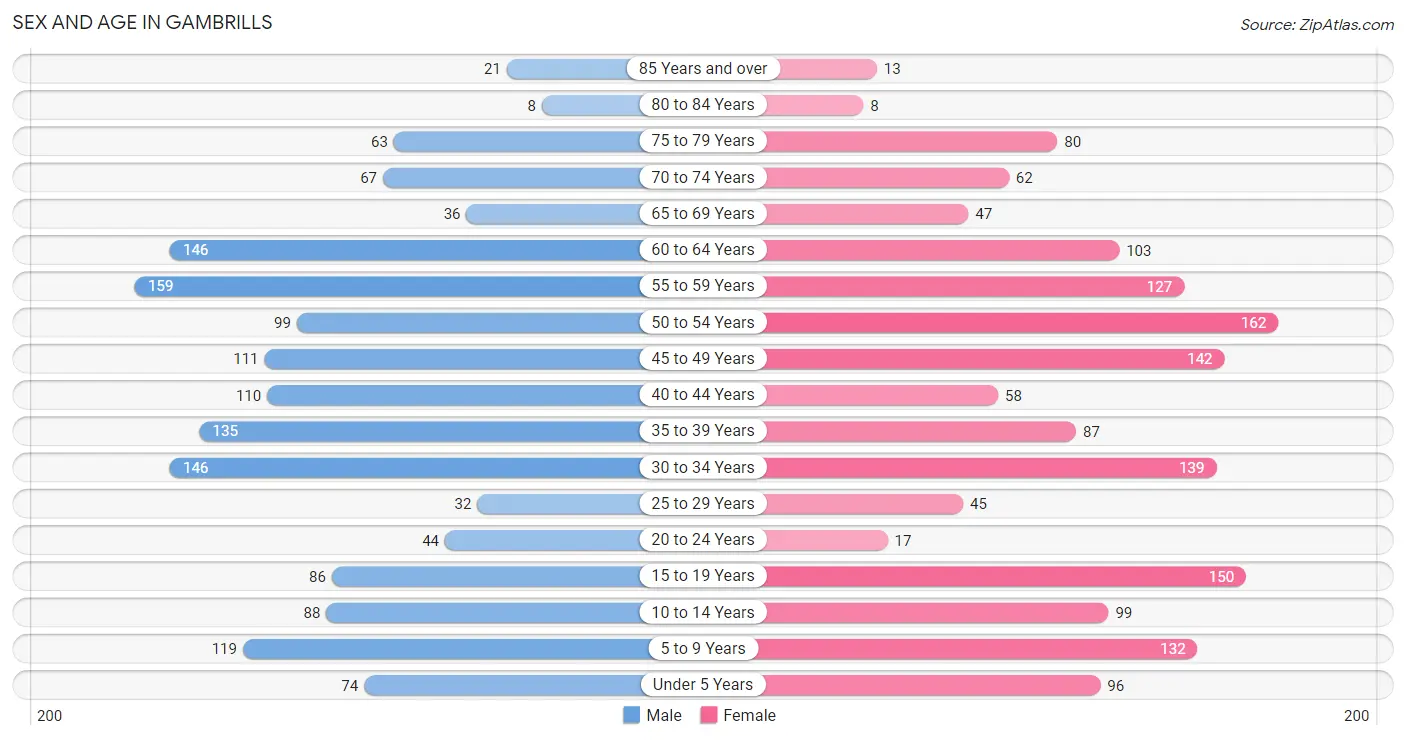
The most populous age groups in Gambrills are 55 to 59 Years (159 | 10.3%) for men and 50 to 54 Years (162 | 10.3%) for women.
| Age Bracket | Male | Female |
| Under 5 Years | 74 (4.8%) | 96 (6.1%) |
| 5 to 9 Years | 119 (7.7%) | 132 (8.4%) |
| 10 to 14 Years | 88 (5.7%) | 99 (6.3%) |
| 15 to 19 Years | 86 (5.6%) | 150 (9.6%) |
| 20 to 24 Years | 44 (2.9%) | 17 (1.1%) |
| 25 to 29 Years | 32 (2.1%) | 45 (2.9%) |
| 30 to 34 Years | 146 (9.5%) | 139 (8.9%) |
| 35 to 39 Years | 135 (8.7%) | 87 (5.6%) |
| 40 to 44 Years | 110 (7.1%) | 58 (3.7%) |
| 45 to 49 Years | 111 (7.2%) | 142 (9.1%) |
| 50 to 54 Years | 99 (6.4%) | 162 (10.3%) |
| 55 to 59 Years | 159 (10.3%) | 127 (8.1%) |
| 60 to 64 Years | 146 (9.5%) | 103 (6.6%) |
| 65 to 69 Years | 36 (2.3%) | 47 (3.0%) |
| 70 to 74 Years | 67 (4.3%) | 62 (4.0%) |
| 75 to 79 Years | 63 (4.1%) | 80 (5.1%) |
| 80 to 84 Years | 8 (0.5%) | 8 (0.5%) |
| 85 Years and over | 21 (1.4%) | 13 (0.8%) |
| Total | 1,544 (100.0%) | 1,567 (100.0%) |
Families and Households in Gambrills
Median Family Size in Gambrills
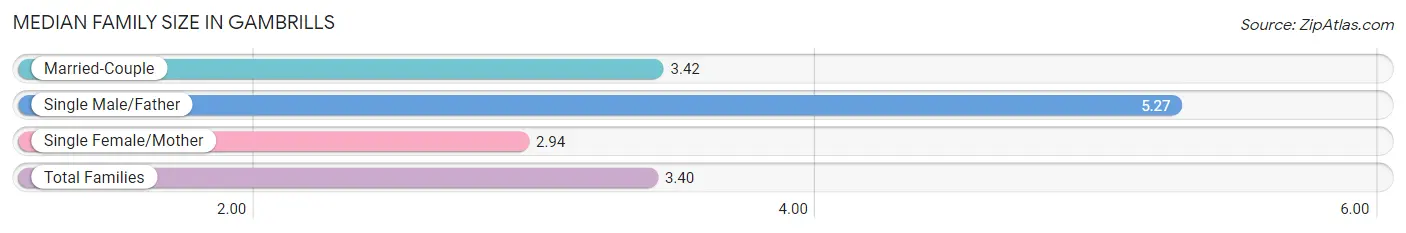
The median family size in Gambrills is 3.40 persons per family, with single male/father families (11 | 1.3%) accounting for the largest median family size of 5.27 persons per family. On the other hand, single female/mother families (66 | 7.9%) represent the smallest median family size with 2.94 persons per family.
| Family Type | # Families | Family Size |
| Married-Couple | 763 (90.8%) | 3.42 |
| Single Male/Father | 11 (1.3%) | 5.27 |
| Single Female/Mother | 66 (7.9%) | 2.94 |
| Total Families | 840 (100.0%) | 3.40 |
Median Household Size in Gambrills
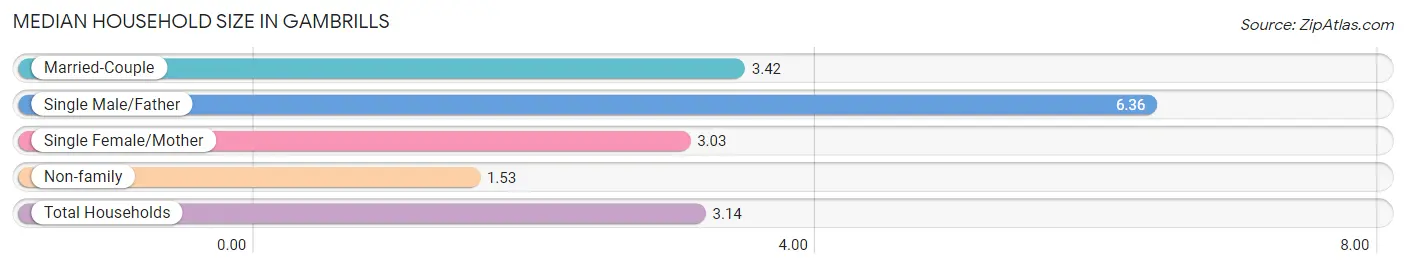
The median household size in Gambrills is 3.14 persons per household, with single male/father households (11 | 1.1%) accounting for the largest median household size of 6.36 persons per household. non-family households (152 | 15.3%) represent the smallest median household size with 1.53 persons per household.
| Household Type | # Households | Household Size |
| Married-Couple | 763 (76.9%) | 3.42 |
| Single Male/Father | 11 (1.1%) | 6.36 |
| Single Female/Mother | 66 (6.7%) | 3.03 |
| Non-family | 152 (15.3%) | 1.53 |
| Total Households | 992 (100.0%) | 3.14 |
Household Size by Marriage Status in Gambrills
Out of a total of 992 households in Gambrills, 840 (84.7%) are family households, while 152 (15.3%) are nonfamily households. The most numerous type of family households are 2-person households, comprising 321, and the most common type of nonfamily households are 1-person households, comprising 90.
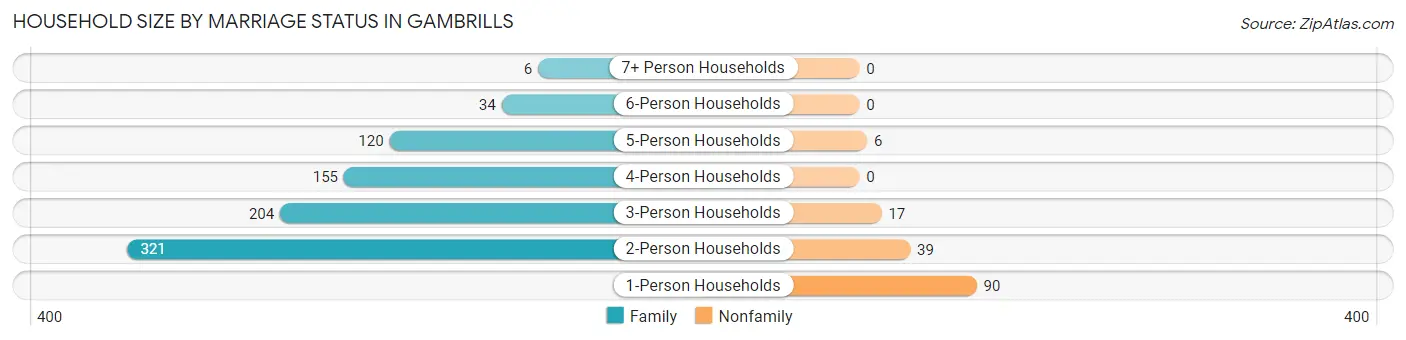
| Household Size | Family Households | Nonfamily Households |
| 1-Person Households | - | 90 (9.1%) |
| 2-Person Households | 321 (32.4%) | 39 (3.9%) |
| 3-Person Households | 204 (20.6%) | 17 (1.7%) |
| 4-Person Households | 155 (15.6%) | 0 (0.0%) |
| 5-Person Households | 120 (12.1%) | 6 (0.6%) |
| 6-Person Households | 34 (3.4%) | 0 (0.0%) |
| 7+ Person Households | 6 (0.6%) | 0 (0.0%) |
| Total | 840 (84.7%) | 152 (15.3%) |
Female Fertility in Gambrills
Fertility by Age in Gambrills
Average fertility rate in Gambrills is 58.0 births per 1,000 women. Women in the age bracket of 20 to 34 years have the highest fertility rate with 159.0 births per 1,000 women. Women in the age bracket of 20 to 34 years acount for 84.2% of all women with births.
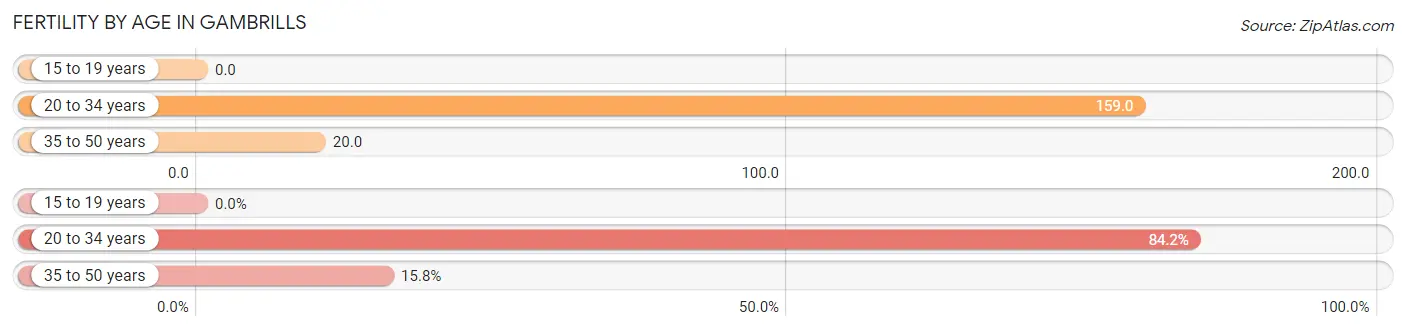
| Age Bracket | Women with Births | Births / 1,000 Women |
| 15 to 19 years | 0 (0.0%) | 0.0 |
| 20 to 34 years | 32 (84.2%) | 159.0 |
| 35 to 50 years | 6 (15.8%) | 20.0 |
| Total | 38 (100.0%) | 58.0 |
Fertility by Age by Marriage Status in Gambrills
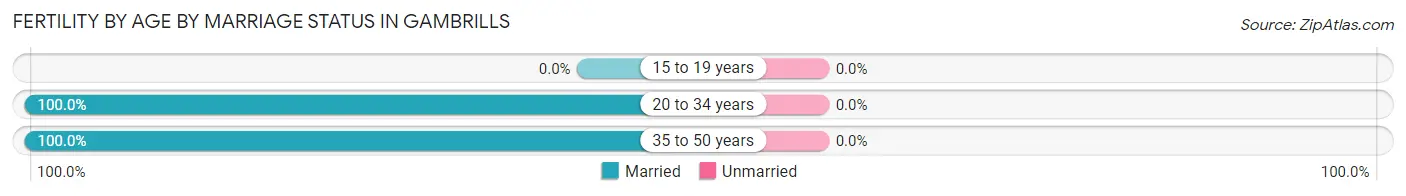
| Age Bracket | Married | Unmarried |
| 15 to 19 years | 0 (0.0%) | 0 (0.0%) |
| 20 to 34 years | 32 (100.0%) | 0 (0.0%) |
| 35 to 50 years | 6 (100.0%) | 0 (0.0%) |
| Total | 38 (100.0%) | 0 (0.0%) |
Fertility by Education in Gambrills
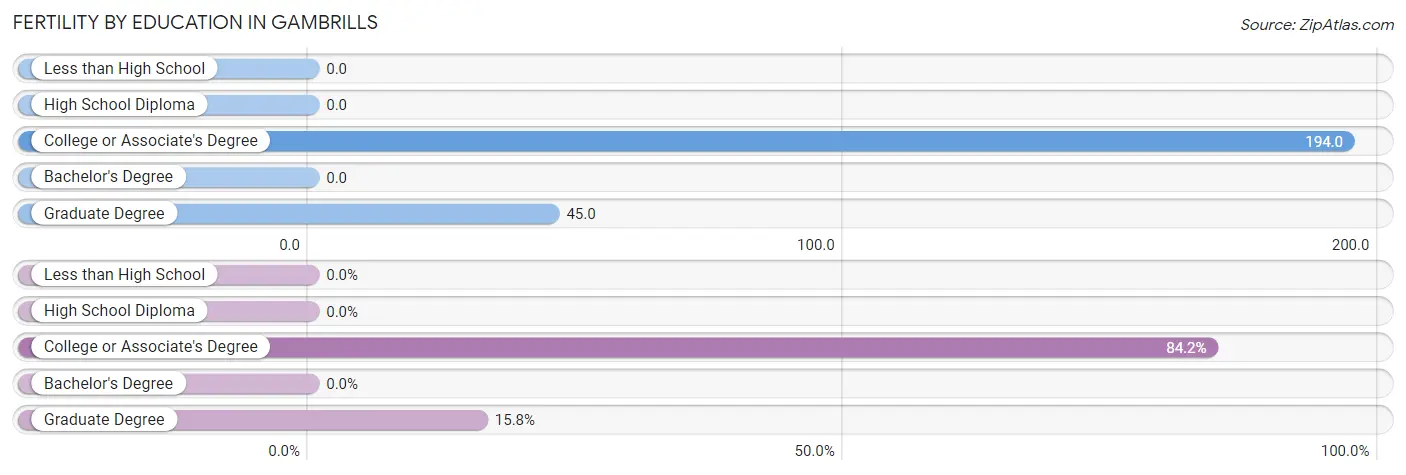
| Educational Attainment | Women with Births | Births / 1,000 Women |
| Less than High School | 0 (0.0%) | 0.0 |
| High School Diploma | 0 (0.0%) | 0.0 |
| College or Associate's Degree | 32 (84.2%) | 194.0 |
| Bachelor's Degree | 0 (0.0%) | 0.0 |
| Graduate Degree | 6 (15.8%) | 45.0 |
| Total | 38 (100.0%) | 58.0 |
Fertility by Education by Marriage Status in Gambrills
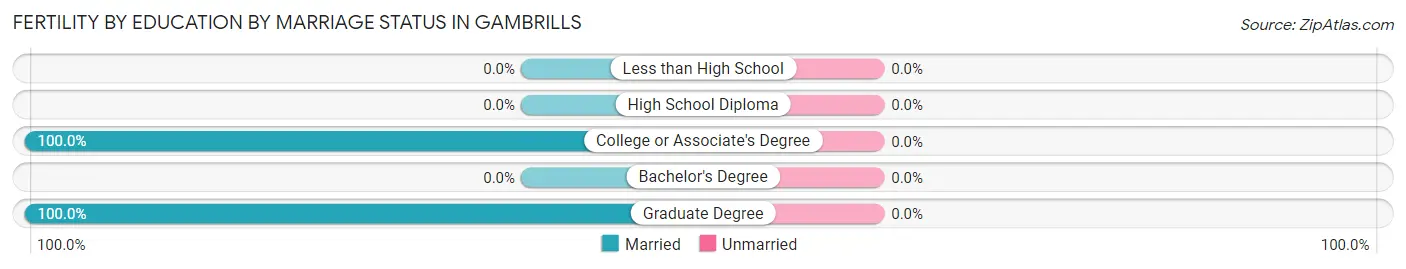
| Educational Attainment | Married | Unmarried |
| Less than High School | 0 (0.0%) | 0 (0.0%) |
| High School Diploma | 0 (0.0%) | 0 (0.0%) |
| College or Associate's Degree | 32 (100.0%) | 0 (0.0%) |
| Bachelor's Degree | 0 (0.0%) | 0 (0.0%) |
| Graduate Degree | 6 (100.0%) | 0 (0.0%) |
| Total | 38 (100.0%) | 0 (0.0%) |
Employment Characteristics in Gambrills
Employment by Class of Employer in Gambrills
Among the 1,553 employed individuals in Gambrills, private company employees (787 | 50.7%), federal government employees (387 | 24.9%), and self-employed (incorporated) (129 | 8.3%) make up the most common classes of employment.
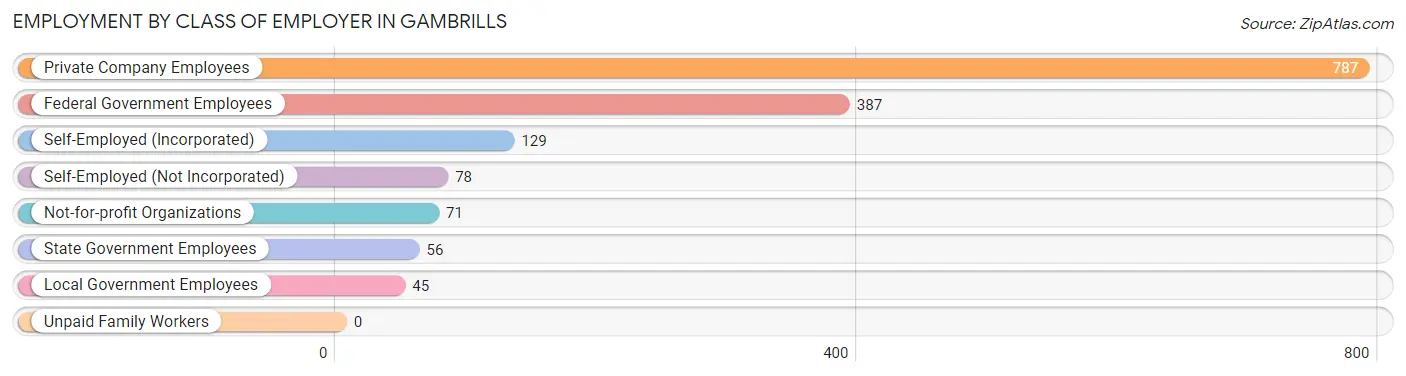
| Employer Class | # Employees | % Employees |
| Private Company Employees | 787 | 50.7% |
| Self-Employed (Incorporated) | 129 | 8.3% |
| Self-Employed (Not Incorporated) | 78 | 5.0% |
| Not-for-profit Organizations | 71 | 4.6% |
| Local Government Employees | 45 | 2.9% |
| State Government Employees | 56 | 3.6% |
| Federal Government Employees | 387 | 24.9% |
| Unpaid Family Workers | 0 | 0.0% |
| Total | 1,553 | 100.0% |
Employment Status by Age in Gambrills
According to the labor force statistics for Gambrills, out of the total population over 16 years of age (2,421), 67.3% or 1,629 individuals are in the labor force, with 2.0% or 33 of them unemployed. The age group with the highest labor force participation rate is 25 to 29 years, with 100.0% or 77 individuals in the labor force. Within the labor force, the 25 to 29 years age range has the highest percentage of unemployed individuals, with 15.6% or 12 of them being unemployed.
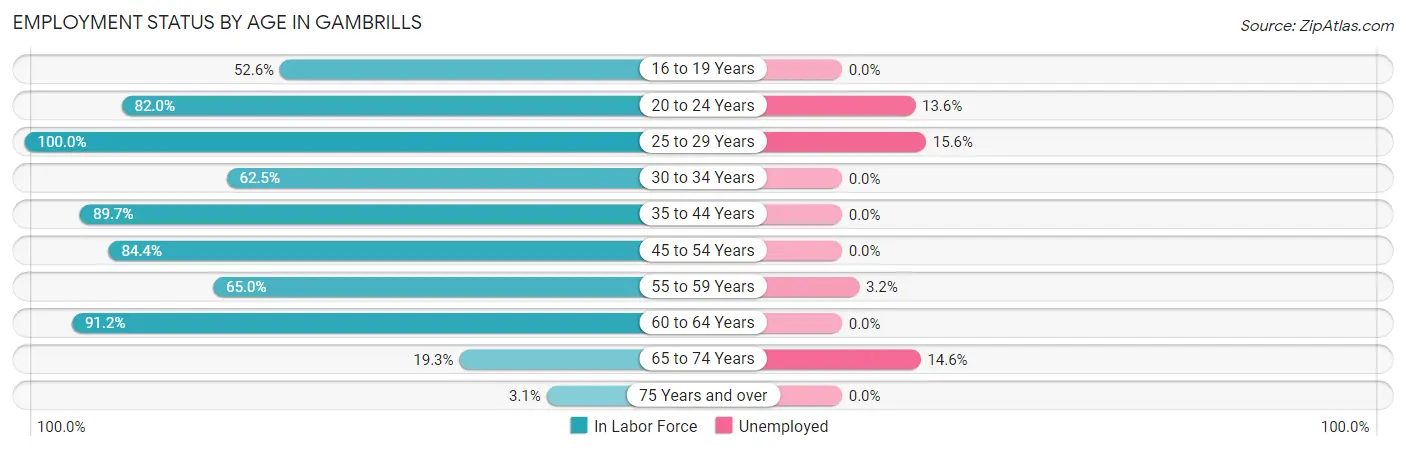
| Age Bracket | In Labor Force | Unemployed |
| 16 to 19 Years | 81 (52.6%) | 0 (0.0%) |
| 20 to 24 Years | 50 (82.0%) | 7 (13.6%) |
| 25 to 29 Years | 77 (100.0%) | 12 (15.6%) |
| 30 to 34 Years | 178 (62.5%) | 0 (0.0%) |
| 35 to 44 Years | 350 (89.7%) | 0 (0.0%) |
| 45 to 54 Years | 434 (84.4%) | 0 (0.0%) |
| 55 to 59 Years | 186 (65.0%) | 6 (3.2%) |
| 60 to 64 Years | 227 (91.2%) | 0 (0.0%) |
| 65 to 74 Years | 41 (19.3%) | 6 (14.6%) |
| 75 Years and over | 6 (3.1%) | 0 (0.0%) |
| Total | 1,629 (67.3%) | 33 (2.0%) |
Employment Status by Educational Attainment in Gambrills
According to labor force statistics for Gambrills, 80.6% of individuals (1,452) out of the total population between 25 and 64 years of age (1,801) are in the labor force, with 1.3% or 19 of them being unemployed. The group with the highest labor force participation rate are those with the educational attainment of bachelor's degree or higher, with 90.4% or 659 individuals in the labor force. Within the labor force, individuals with college / associate degree education have the highest percentage of unemployment, with 1.9% or 7 of them being unemployed.
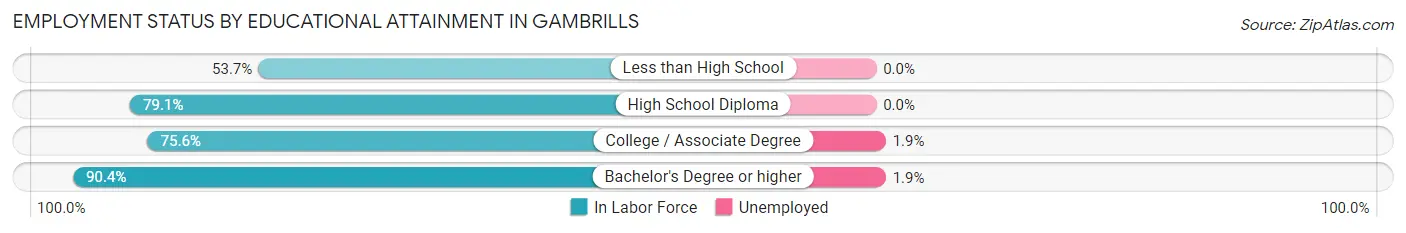
| Educational Attainment | In Labor Force | Unemployed |
| Less than High School | 79 (53.7%) | 0 (0.0%) |
| High School Diploma | 330 (79.1%) | 0 (0.0%) |
| College / Associate Degree | 384 (75.6%) | 10 (1.9%) |
| Bachelor's Degree or higher | 659 (90.4%) | 14 (1.9%) |
| Total | 1,452 (80.6%) | 23 (1.3%) |
Employment Occupations by Sex in Gambrills
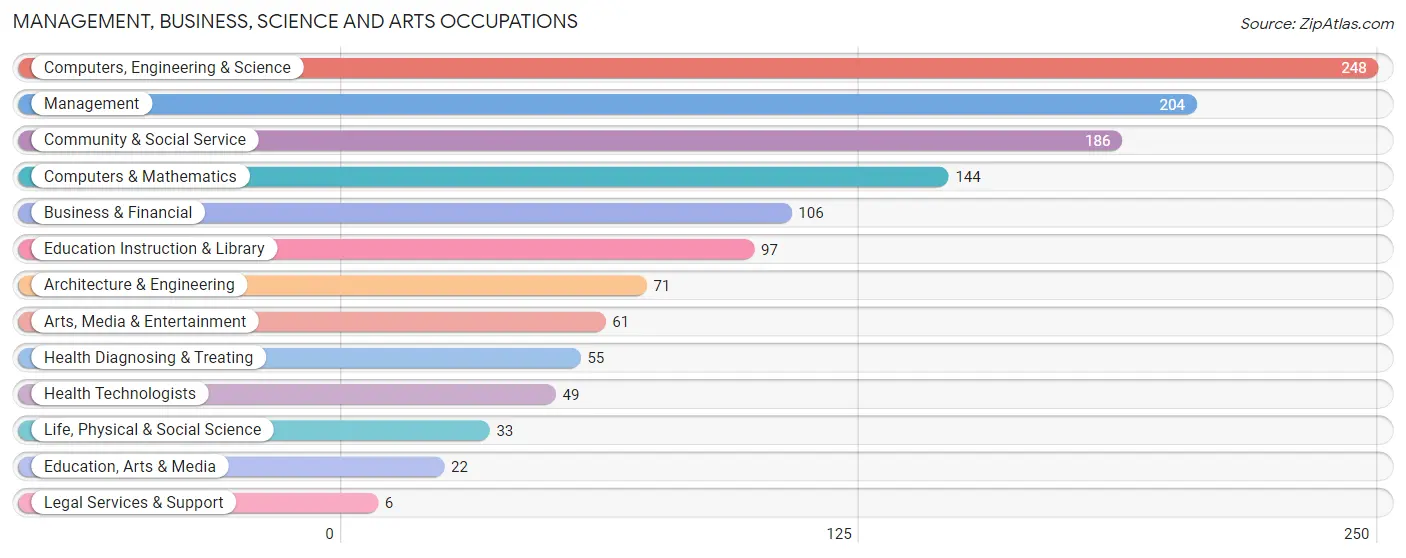
Management, Business, Science and Arts Occupations
The most common Management, Business, Science and Arts occupations in Gambrills are Computers, Engineering & Science (248 | 16.5%), Management (204 | 13.6%), Community & Social Service (186 | 12.3%), Computers & Mathematics (144 | 9.6%), and Business & Financial (106 | 7.0%).
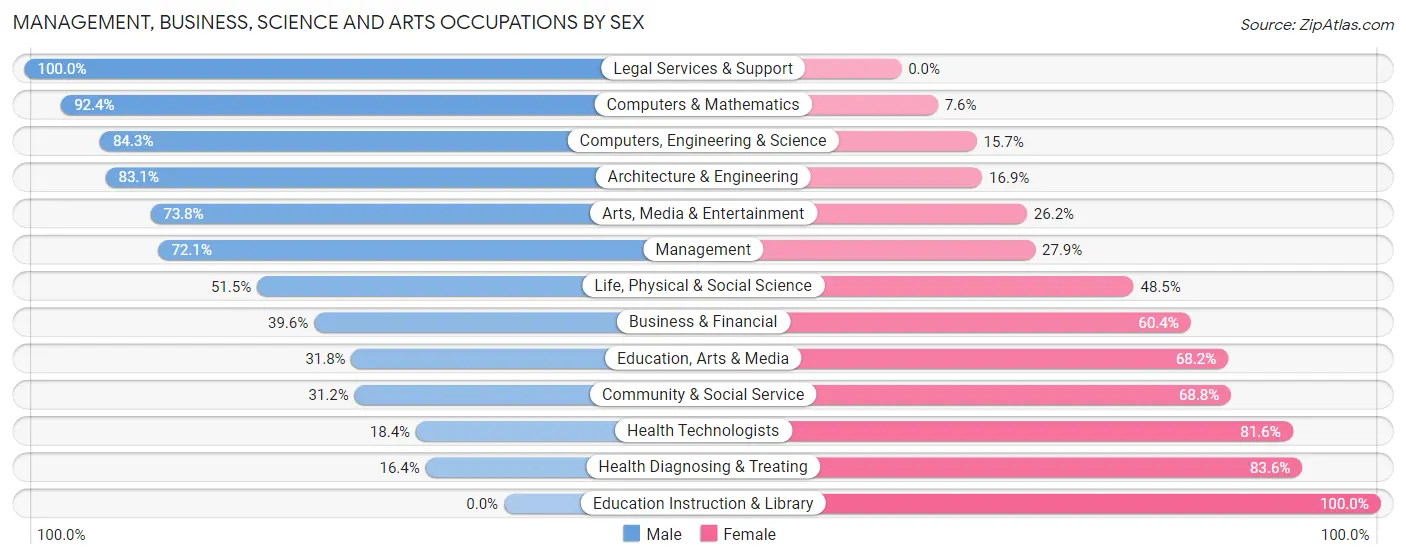
Management, Business, Science and Arts Occupations by Sex
Within the Management, Business, Science and Arts occupations in Gambrills, the most male-oriented occupations are Legal Services & Support (100.0%), Computers & Mathematics (92.4%), and Computers, Engineering & Science (84.3%), while the most female-oriented occupations are Education Instruction & Library (100.0%), Health Diagnosing & Treating (83.6%), and Health Technologists (81.6%).
| Occupation | Male | Female |
| Management | 147 (72.1%) | 57 (27.9%) |
| Business & Financial | 42 (39.6%) | 64 (60.4%) |
| Computers, Engineering & Science | 209 (84.3%) | 39 (15.7%) |
| Computers & Mathematics | 133 (92.4%) | 11 (7.6%) |
| Architecture & Engineering | 59 (83.1%) | 12 (16.9%) |
| Life, Physical & Social Science | 17 (51.5%) | 16 (48.5%) |
| Community & Social Service | 58 (31.2%) | 128 (68.8%) |
| Education, Arts & Media | 7 (31.8%) | 15 (68.2%) |
| Legal Services & Support | 6 (100.0%) | 0 (0.0%) |
| Education Instruction & Library | 0 (0.0%) | 97 (100.0%) |
| Arts, Media & Entertainment | 45 (73.8%) | 16 (26.2%) |
| Health Diagnosing & Treating | 9 (16.4%) | 46 (83.6%) |
| Health Technologists | 9 (18.4%) | 40 (81.6%) |
| Total (Category) | 465 (58.2%) | 334 (41.8%) |
| Total (Overall) | 833 (55.3%) | 673 (44.7%) |
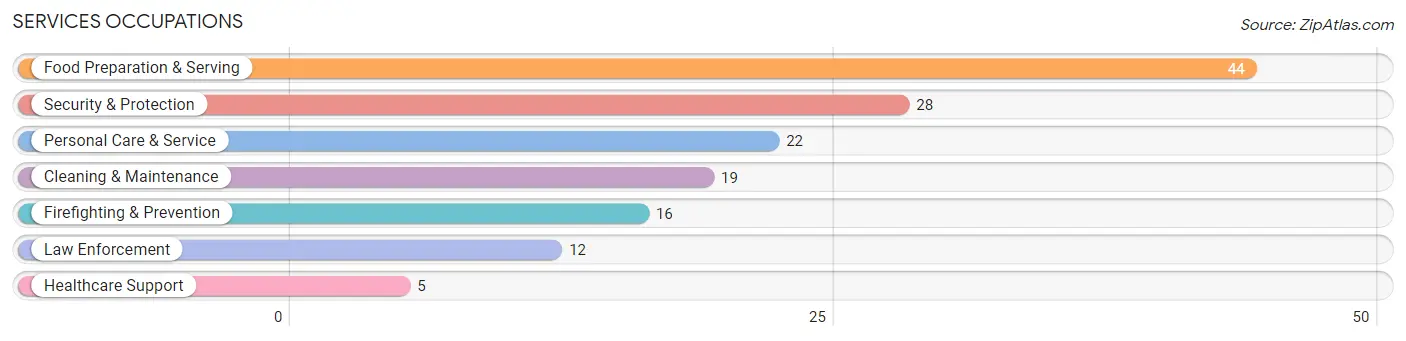
Services Occupations
The most common Services occupations in Gambrills are Food Preparation & Serving (44 | 2.9%), Security & Protection (28 | 1.9%), Personal Care & Service (22 | 1.5%), Cleaning & Maintenance (19 | 1.3%), and Firefighting & Prevention (16 | 1.1%).
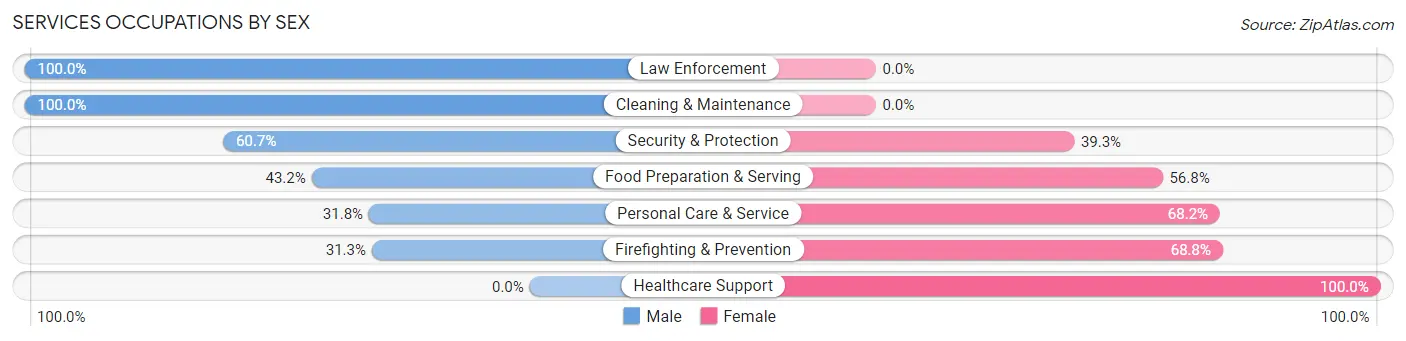
Services Occupations by Sex
Within the Services occupations in Gambrills, the most male-oriented occupations are Law Enforcement (100.0%), Cleaning & Maintenance (100.0%), and Security & Protection (60.7%), while the most female-oriented occupations are Healthcare Support (100.0%), Firefighting & Prevention (68.8%), and Personal Care & Service (68.2%).
| Occupation | Male | Female |
| Healthcare Support | 0 (0.0%) | 5 (100.0%) |
| Security & Protection | 17 (60.7%) | 11 (39.3%) |
| Firefighting & Prevention | 5 (31.2%) | 11 (68.8%) |
| Law Enforcement | 12 (100.0%) | 0 (0.0%) |
| Food Preparation & Serving | 19 (43.2%) | 25 (56.8%) |
| Cleaning & Maintenance | 19 (100.0%) | 0 (0.0%) |
| Personal Care & Service | 7 (31.8%) | 15 (68.2%) |
| Total (Category) | 62 (52.5%) | 56 (47.5%) |
| Total (Overall) | 833 (55.3%) | 673 (44.7%) |
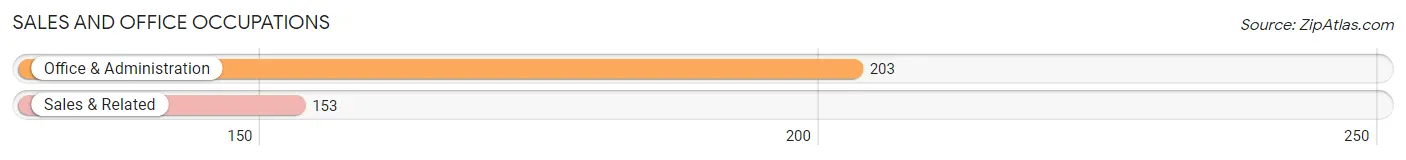
Sales and Office Occupations
The most common Sales and Office occupations in Gambrills are Office & Administration (203 | 13.5%), and Sales & Related (153 | 10.2%).
Sales and Office Occupations by Sex
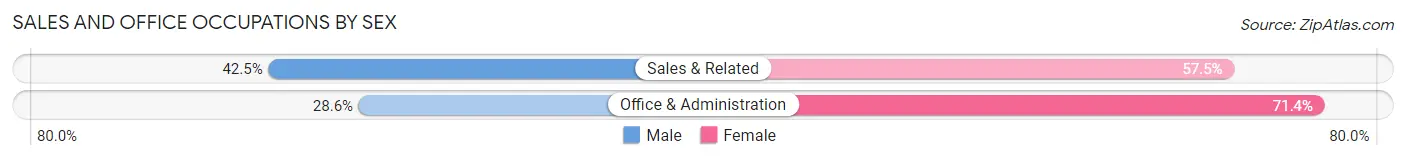
| Occupation | Male | Female |
| Sales & Related | 65 (42.5%) | 88 (57.5%) |
| Office & Administration | 58 (28.6%) | 145 (71.4%) |
| Total (Category) | 123 (34.5%) | 233 (65.4%) |
| Total (Overall) | 833 (55.3%) | 673 (44.7%) |
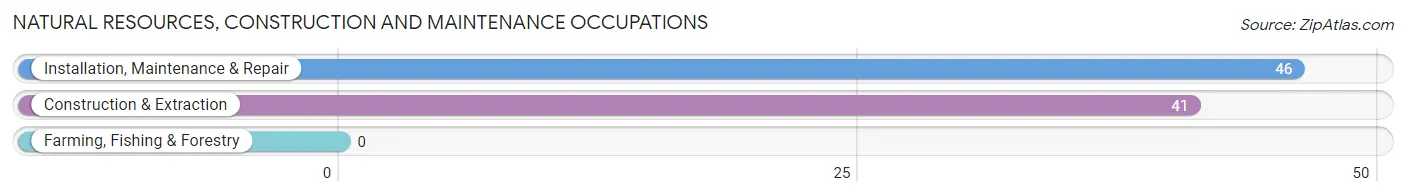
Natural Resources, Construction and Maintenance Occupations
The most common Natural Resources, Construction and Maintenance occupations in Gambrills are Installation, Maintenance & Repair (46 | 3.0%), and Construction & Extraction (41 | 2.7%).
Natural Resources, Construction and Maintenance Occupations by Sex
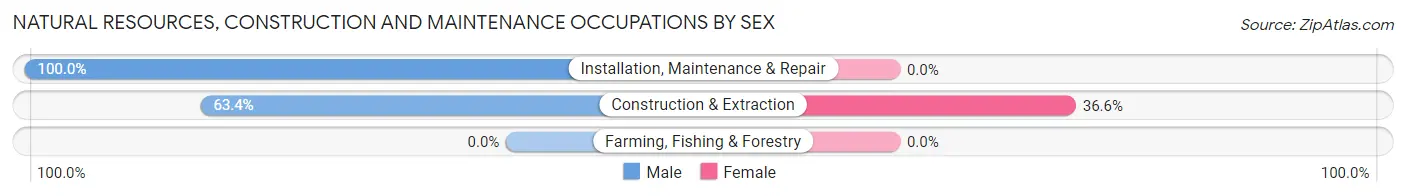
| Occupation | Male | Female |
| Farming, Fishing & Forestry | 0 (0.0%) | 0 (0.0%) |
| Construction & Extraction | 26 (63.4%) | 15 (36.6%) |
| Installation, Maintenance & Repair | 46 (100.0%) | 0 (0.0%) |
| Total (Category) | 72 (82.8%) | 15 (17.2%) |
| Total (Overall) | 833 (55.3%) | 673 (44.7%) |
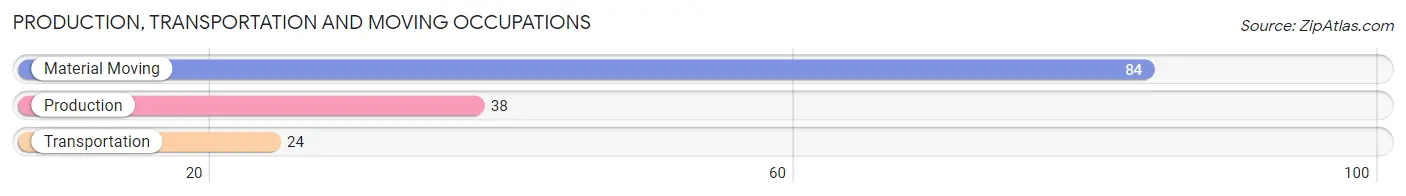
Production, Transportation and Moving Occupations
The most common Production, Transportation and Moving occupations in Gambrills are Material Moving (84 | 5.6%), Production (38 | 2.5%), and Transportation (24 | 1.6%).
Production, Transportation and Moving Occupations by Sex
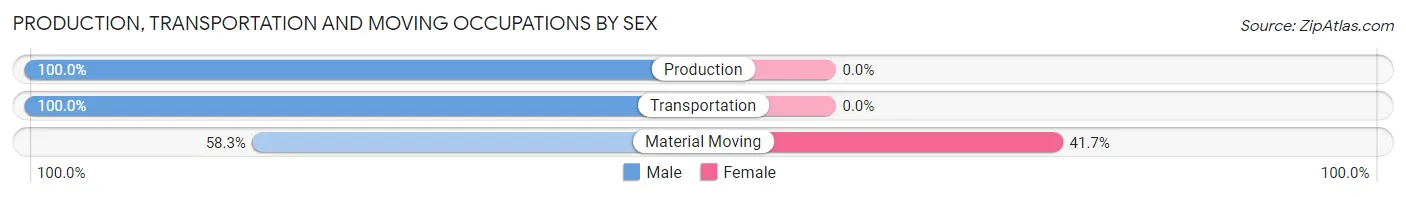
| Occupation | Male | Female |
| Production | 38 (100.0%) | 0 (0.0%) |
| Transportation | 24 (100.0%) | 0 (0.0%) |
| Material Moving | 49 (58.3%) | 35 (41.7%) |
| Total (Category) | 111 (76.0%) | 35 (24.0%) |
| Total (Overall) | 833 (55.3%) | 673 (44.7%) |
Employment Industries by Sex in Gambrills
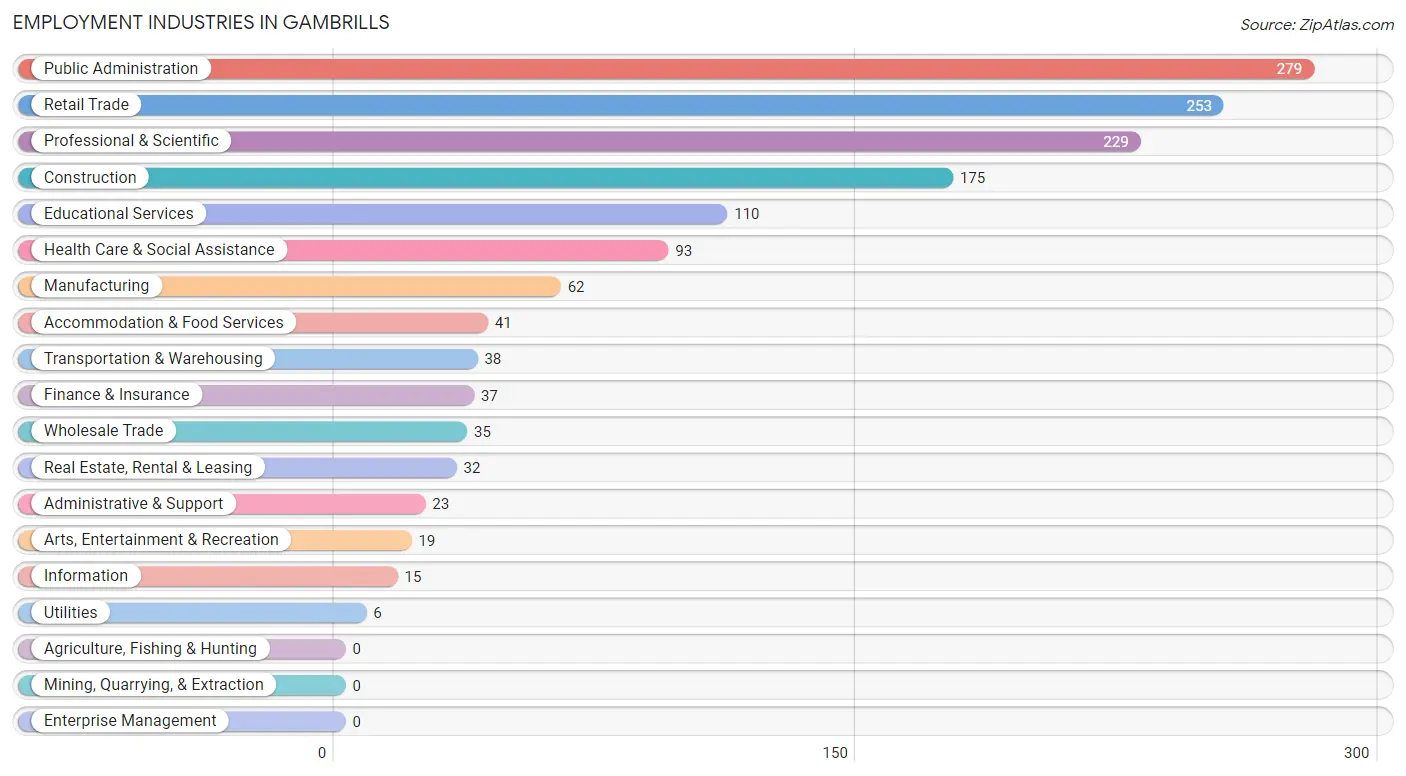
Employment Industries in Gambrills
The major employment industries in Gambrills include Public Administration (279 | 18.5%), Retail Trade (253 | 16.8%), Professional & Scientific (229 | 15.2%), Construction (175 | 11.6%), and Educational Services (110 | 7.3%).
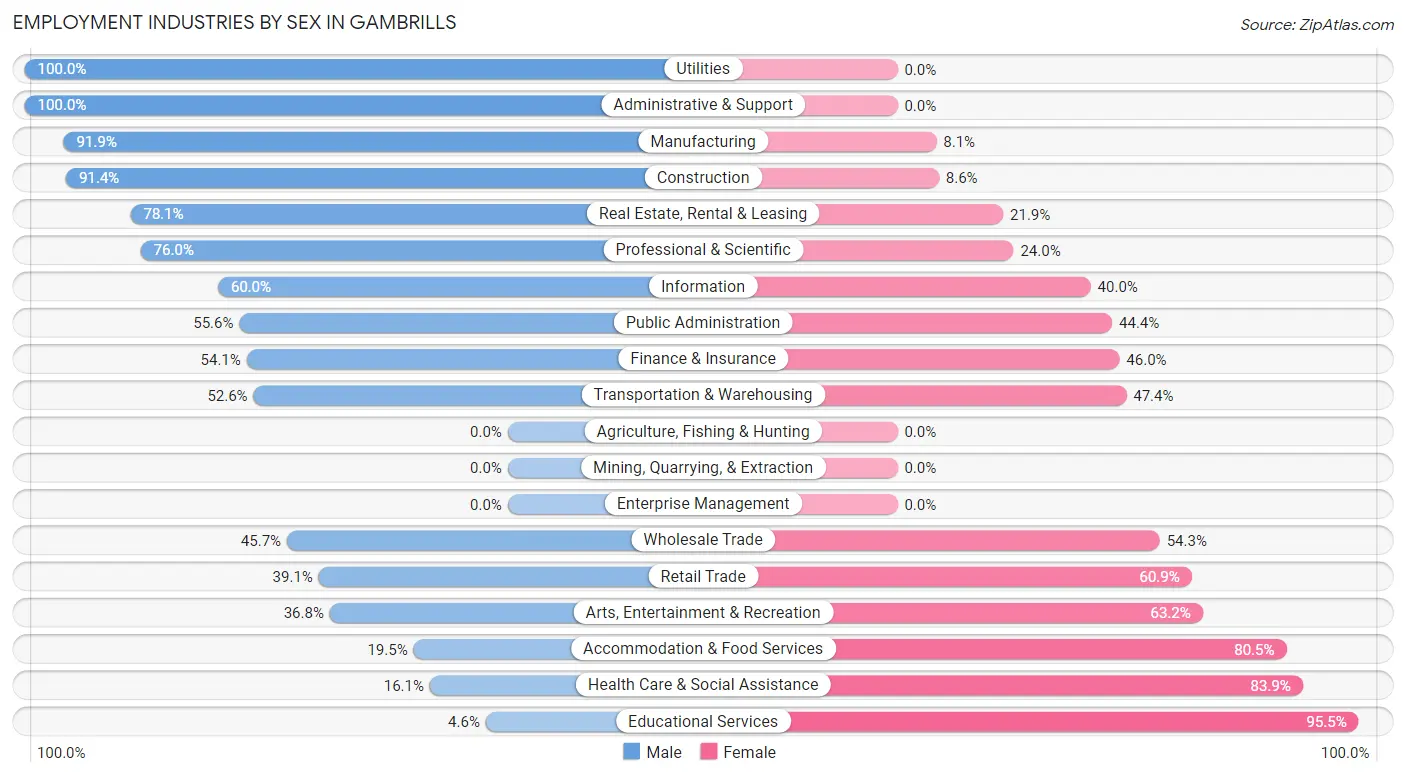
Employment Industries by Sex in Gambrills
The Gambrills industries that see more men than women are Utilities (100.0%), Administrative & Support (100.0%), and Manufacturing (91.9%), whereas the industries that tend to have a higher number of women are Educational Services (95.5%), Health Care & Social Assistance (83.9%), and Accommodation & Food Services (80.5%).
| Industry | Male | Female |
| Agriculture, Fishing & Hunting | 0 (0.0%) | 0 (0.0%) |
| Mining, Quarrying, & Extraction | 0 (0.0%) | 0 (0.0%) |
| Construction | 160 (91.4%) | 15 (8.6%) |
| Manufacturing | 57 (91.9%) | 5 (8.1%) |
| Wholesale Trade | 16 (45.7%) | 19 (54.3%) |
| Retail Trade | 99 (39.1%) | 154 (60.9%) |
| Transportation & Warehousing | 20 (52.6%) | 18 (47.4%) |
| Utilities | 6 (100.0%) | 0 (0.0%) |
| Information | 9 (60.0%) | 6 (40.0%) |
| Finance & Insurance | 20 (54.0%) | 17 (46.0%) |
| Real Estate, Rental & Leasing | 25 (78.1%) | 7 (21.9%) |
| Professional & Scientific | 174 (76.0%) | 55 (24.0%) |
| Enterprise Management | 0 (0.0%) | 0 (0.0%) |
| Administrative & Support | 23 (100.0%) | 0 (0.0%) |
| Educational Services | 5 (4.5%) | 105 (95.5%) |
| Health Care & Social Assistance | 15 (16.1%) | 78 (83.9%) |
| Arts, Entertainment & Recreation | 7 (36.8%) | 12 (63.2%) |
| Accommodation & Food Services | 8 (19.5%) | 33 (80.5%) |
| Public Administration | 155 (55.6%) | 124 (44.4%) |
| Total | 833 (55.3%) | 673 (44.7%) |
Education in Gambrills
School Enrollment in Gambrills
The most common levels of schooling among the 865 students in Gambrills are elementary school (273 | 31.6%), high school (208 | 24.0%), and college / undergraduate (141 | 16.3%).
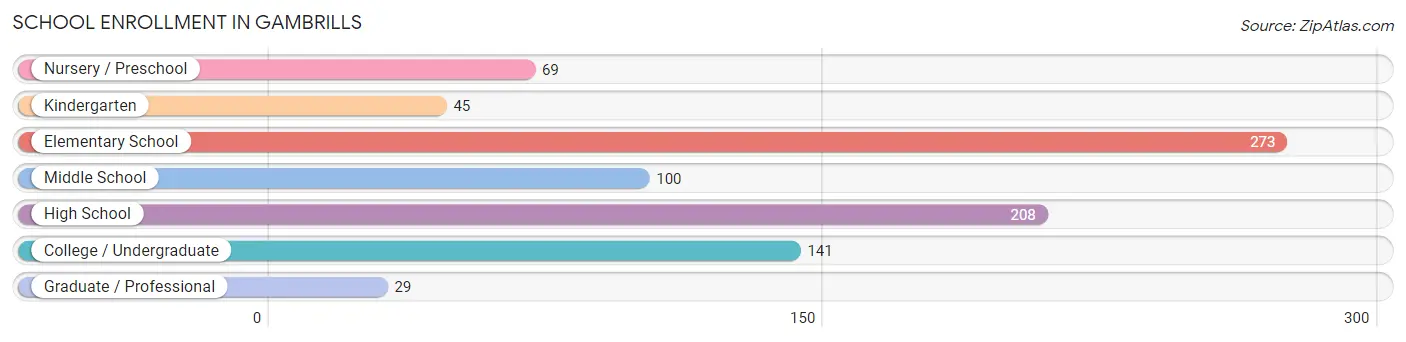
| School Level | # Students | % Students |
| Nursery / Preschool | 69 | 8.0% |
| Kindergarten | 45 | 5.2% |
| Elementary School | 273 | 31.6% |
| Middle School | 100 | 11.6% |
| High School | 208 | 24.0% |
| College / Undergraduate | 141 | 16.3% |
| Graduate / Professional | 29 | 3.4% |
| Total | 865 | 100.0% |
School Enrollment by Age by Funding Source in Gambrills
Out of a total of 865 students who are enrolled in schools in Gambrills, 252 (29.1%) attend a private institution, while the remaining 613 (70.9%) are enrolled in public schools. The age group of 3 to 4 year olds has the highest likelihood of being enrolled in private schools, with 63 (100.0% in the age bracket) enrolled. Conversely, the age group of 18 to 19 year olds has the lowest likelihood of being enrolled in a private school, with 61 (100.0% in the age bracket) attending a public institution.
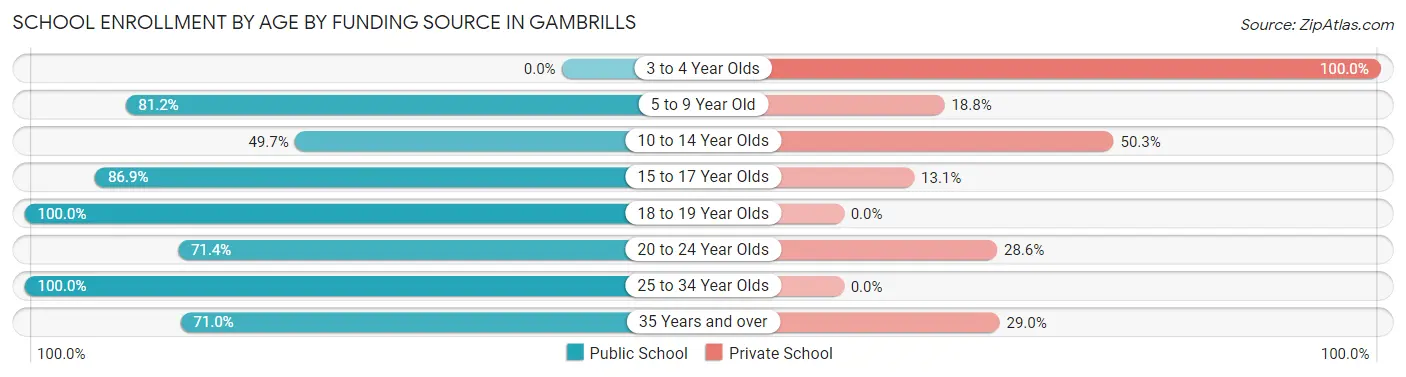
| Age Bracket | Public School | Private School |
| 3 to 4 Year Olds | 0 (0.0%) | 63 (100.0%) |
| 5 to 9 Year Old | 199 (81.2%) | 46 (18.8%) |
| 10 to 14 Year Olds | 93 (49.7%) | 94 (50.3%) |
| 15 to 17 Year Olds | 139 (86.9%) | 21 (13.1%) |
| 18 to 19 Year Olds | 61 (100.0%) | 0 (0.0%) |
| 20 to 24 Year Olds | 25 (71.4%) | 10 (28.6%) |
| 25 to 34 Year Olds | 52 (100.0%) | 0 (0.0%) |
| 35 Years and over | 44 (71.0%) | 18 (29.0%) |
| Total | 613 (70.9%) | 252 (29.1%) |
Educational Attainment by Field of Study in Gambrills
Business (144 | 14.2%), education (140 | 13.9%), engineering (113 | 11.2%), arts & humanities (92 | 9.1%), and science & technology (87 | 8.6%) are the most common fields of study among 1,011 individuals in Gambrills who have obtained a bachelor's degree or higher.
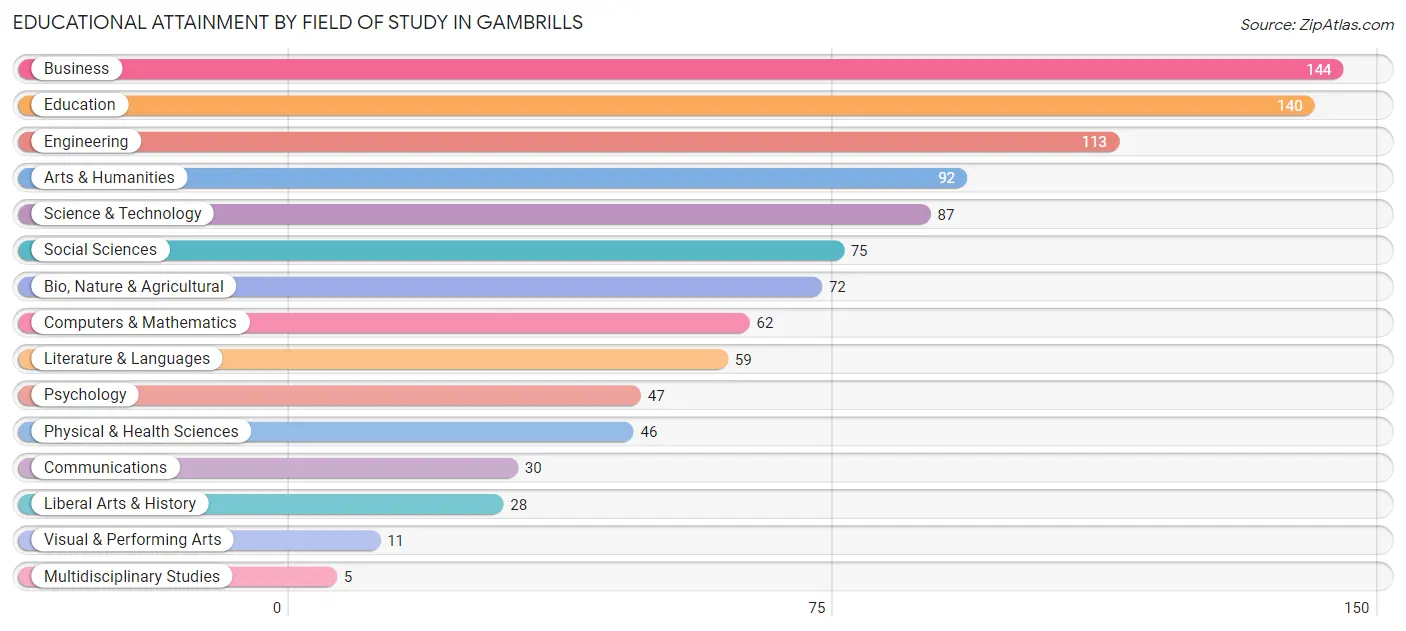
| Field of Study | # Graduates | % Graduates |
| Computers & Mathematics | 62 | 6.1% |
| Bio, Nature & Agricultural | 72 | 7.1% |
| Physical & Health Sciences | 46 | 4.5% |
| Psychology | 47 | 4.6% |
| Social Sciences | 75 | 7.4% |
| Engineering | 113 | 11.2% |
| Multidisciplinary Studies | 5 | 0.5% |
| Science & Technology | 87 | 8.6% |
| Business | 144 | 14.2% |
| Education | 140 | 13.9% |
| Literature & Languages | 59 | 5.8% |
| Liberal Arts & History | 28 | 2.8% |
| Visual & Performing Arts | 11 | 1.1% |
| Communications | 30 | 3.0% |
| Arts & Humanities | 92 | 9.1% |
| Total | 1,011 | 100.0% |
Transportation & Commute in Gambrills
Vehicle Availability by Sex in Gambrills
The most prevalent vehicle ownership categories in Gambrills are males with 2 vehicles (320, accounting for 36.5%) and females with 2 vehicles (241, making up 47.3%).
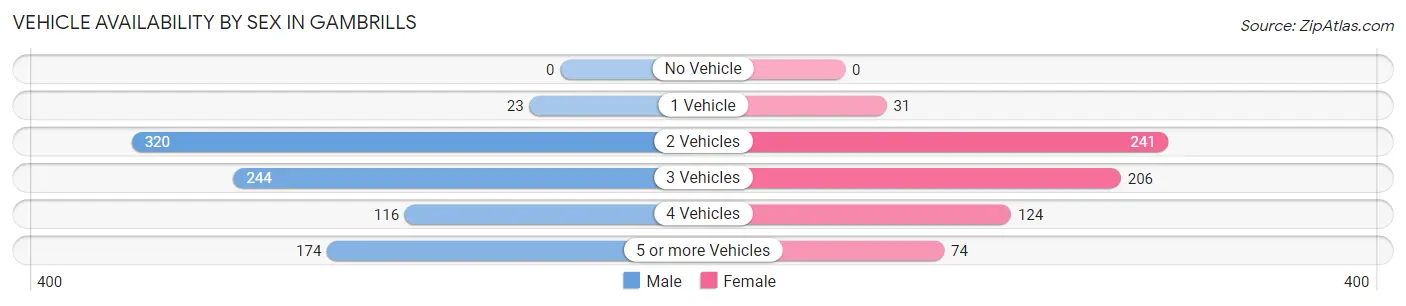
| Vehicles Available | Male | Female |
| No Vehicle | 0 (0.0%) | 0 (0.0%) |
| 1 Vehicle | 23 (2.6%) | 31 (4.6%) |
| 2 Vehicles | 320 (36.5%) | 241 (35.6%) |
| 3 Vehicles | 244 (27.8%) | 206 (30.5%) |
| 4 Vehicles | 116 (13.2%) | 124 (18.3%) |
| 5 or more Vehicles | 174 (19.8%) | 74 (11.0%) |
| Total | 877 (100.0%) | 676 (100.0%) |
Commute Time in Gambrills
The most frequently occuring commute durations in Gambrills are 20 to 24 minutes (262 commuters, 20.4%), 15 to 19 minutes (206 commuters, 16.1%), and 10 to 14 minutes (179 commuters, 14.0%).
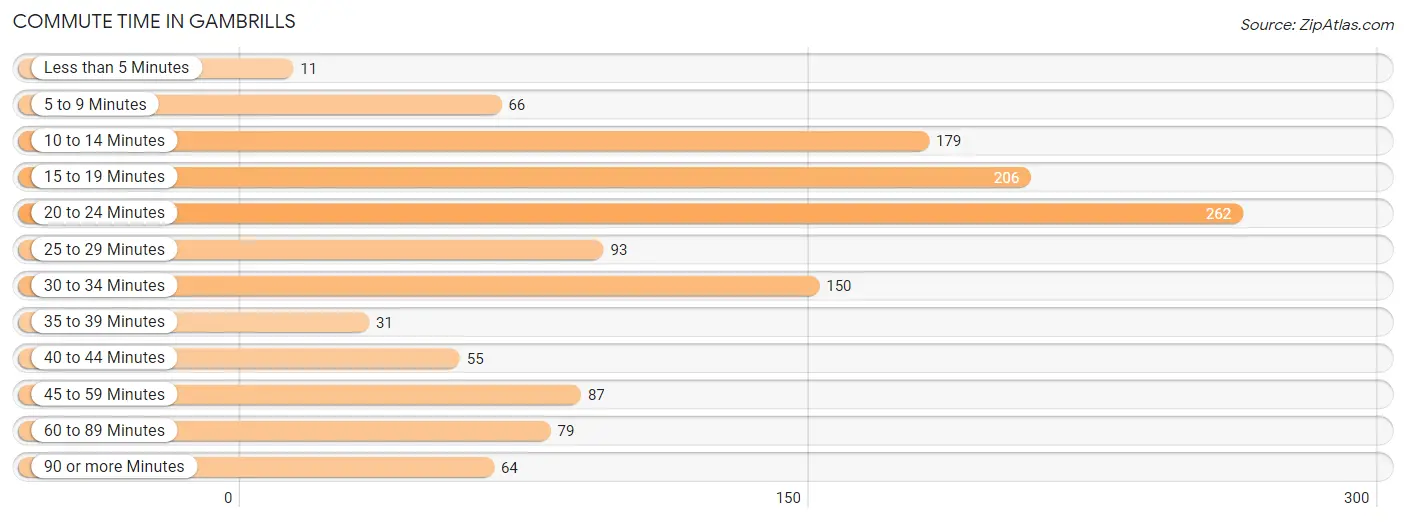
| Commute Time | # Commuters | % Commuters |
| Less than 5 Minutes | 11 | 0.9% |
| 5 to 9 Minutes | 66 | 5.1% |
| 10 to 14 Minutes | 179 | 14.0% |
| 15 to 19 Minutes | 206 | 16.1% |
| 20 to 24 Minutes | 262 | 20.4% |
| 25 to 29 Minutes | 93 | 7.2% |
| 30 to 34 Minutes | 150 | 11.7% |
| 35 to 39 Minutes | 31 | 2.4% |
| 40 to 44 Minutes | 55 | 4.3% |
| 45 to 59 Minutes | 87 | 6.8% |
| 60 to 89 Minutes | 79 | 6.2% |
| 90 or more Minutes | 64 | 5.0% |
Commute Time by Sex in Gambrills
The most common commute times in Gambrills are 15 to 19 minutes (124 commuters, 17.1%) for males and 20 to 24 minutes (145 commuters, 25.9%) for females.
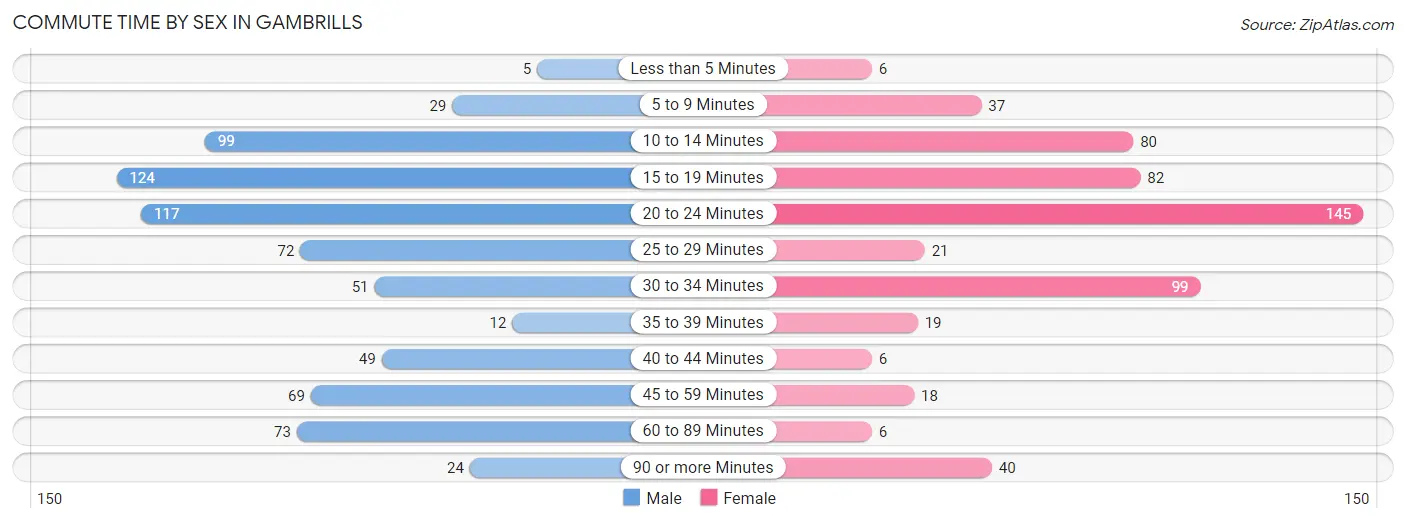
| Commute Time | Male | Female |
| Less than 5 Minutes | 5 (0.7%) | 6 (1.1%) |
| 5 to 9 Minutes | 29 (4.0%) | 37 (6.6%) |
| 10 to 14 Minutes | 99 (13.7%) | 80 (14.3%) |
| 15 to 19 Minutes | 124 (17.1%) | 82 (14.7%) |
| 20 to 24 Minutes | 117 (16.2%) | 145 (25.9%) |
| 25 to 29 Minutes | 72 (9.9%) | 21 (3.8%) |
| 30 to 34 Minutes | 51 (7.0%) | 99 (17.7%) |
| 35 to 39 Minutes | 12 (1.7%) | 19 (3.4%) |
| 40 to 44 Minutes | 49 (6.8%) | 6 (1.1%) |
| 45 to 59 Minutes | 69 (9.5%) | 18 (3.2%) |
| 60 to 89 Minutes | 73 (10.1%) | 6 (1.1%) |
| 90 or more Minutes | 24 (3.3%) | 40 (7.2%) |
Time of Departure to Work by Sex in Gambrills
The most frequent times of departure to work in Gambrills are 7:00 AM to 7:29 AM (157, 21.7%) for males and 7:00 AM to 7:29 AM (87, 15.6%) for females.
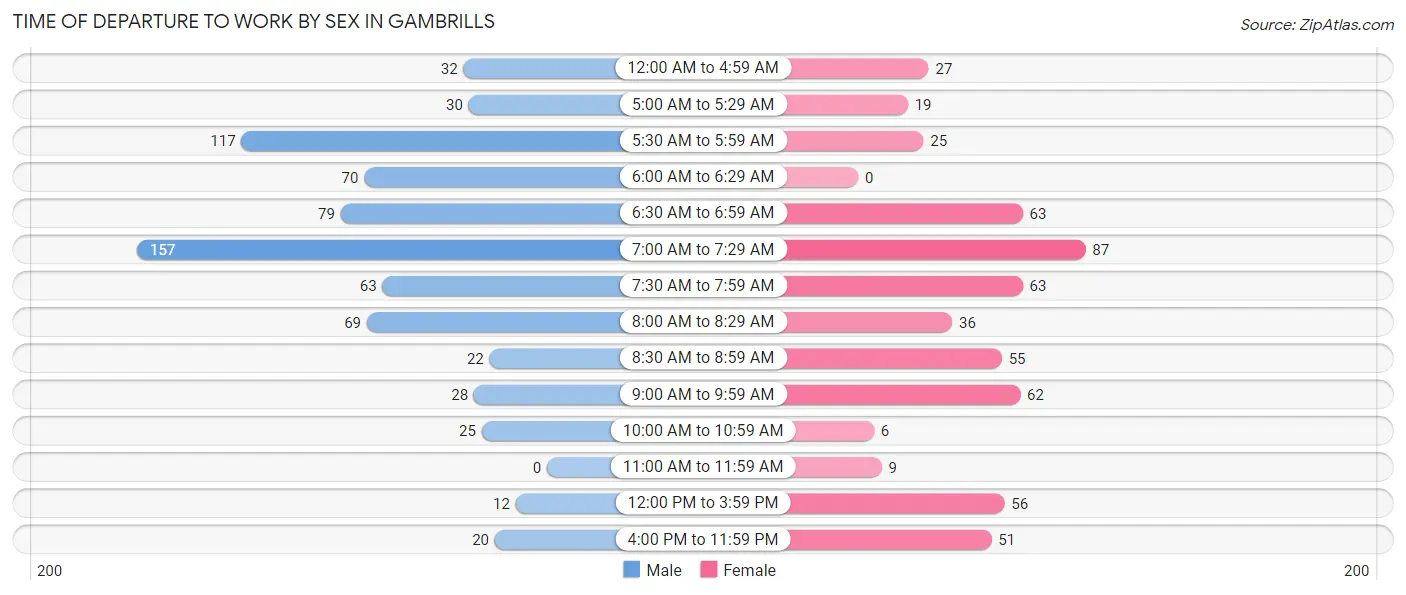
| Time of Departure | Male | Female |
| 12:00 AM to 4:59 AM | 32 (4.4%) | 27 (4.8%) |
| 5:00 AM to 5:29 AM | 30 (4.1%) | 19 (3.4%) |
| 5:30 AM to 5:59 AM | 117 (16.2%) | 25 (4.5%) |
| 6:00 AM to 6:29 AM | 70 (9.7%) | 0 (0.0%) |
| 6:30 AM to 6:59 AM | 79 (10.9%) | 63 (11.3%) |
| 7:00 AM to 7:29 AM | 157 (21.7%) | 87 (15.6%) |
| 7:30 AM to 7:59 AM | 63 (8.7%) | 63 (11.3%) |
| 8:00 AM to 8:29 AM | 69 (9.5%) | 36 (6.4%) |
| 8:30 AM to 8:59 AM | 22 (3.0%) | 55 (9.8%) |
| 9:00 AM to 9:59 AM | 28 (3.9%) | 62 (11.1%) |
| 10:00 AM to 10:59 AM | 25 (3.5%) | 6 (1.1%) |
| 11:00 AM to 11:59 AM | 0 (0.0%) | 9 (1.6%) |
| 12:00 PM to 3:59 PM | 12 (1.7%) | 56 (10.0%) |
| 4:00 PM to 11:59 PM | 20 (2.8%) | 51 (9.1%) |
| Total | 724 (100.0%) | 559 (100.0%) |
Housing Occupancy in Gambrills
Occupancy by Ownership in Gambrills
Of the total 992 dwellings in Gambrills, owner-occupied units account for 887 (89.4%), while renter-occupied units make up 105 (10.6%).
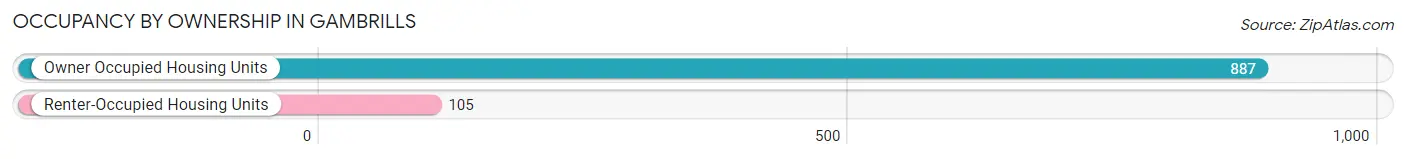
| Occupancy | # Housing Units | % Housing Units |
| Owner Occupied Housing Units | 887 | 89.4% |
| Renter-Occupied Housing Units | 105 | 10.6% |
| Total Occupied Housing Units | 992 | 100.0% |
Occupancy by Household Size in Gambrills
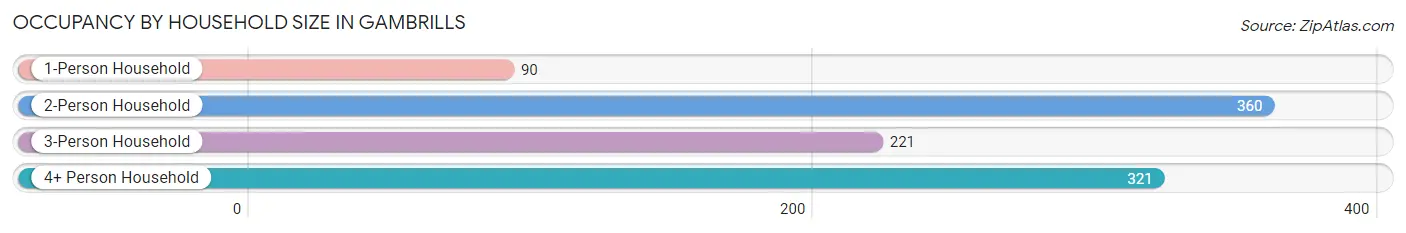
| Household Size | # Housing Units | % Housing Units |
| 1-Person Household | 90 | 9.1% |
| 2-Person Household | 360 | 36.3% |
| 3-Person Household | 221 | 22.3% |
| 4+ Person Household | 321 | 32.4% |
| Total Housing Units | 992 | 100.0% |
Occupancy by Ownership by Household Size in Gambrills
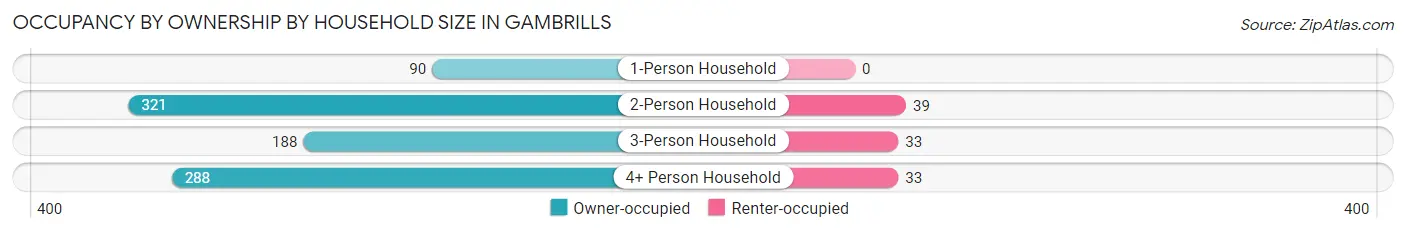
| Household Size | Owner-occupied | Renter-occupied |
| 1-Person Household | 90 (100.0%) | 0 (0.0%) |
| 2-Person Household | 321 (89.2%) | 39 (10.8%) |
| 3-Person Household | 188 (85.1%) | 33 (14.9%) |
| 4+ Person Household | 288 (89.7%) | 33 (10.3%) |
| Total Housing Units | 887 (89.4%) | 105 (10.6%) |
Occupancy by Educational Attainment in Gambrills
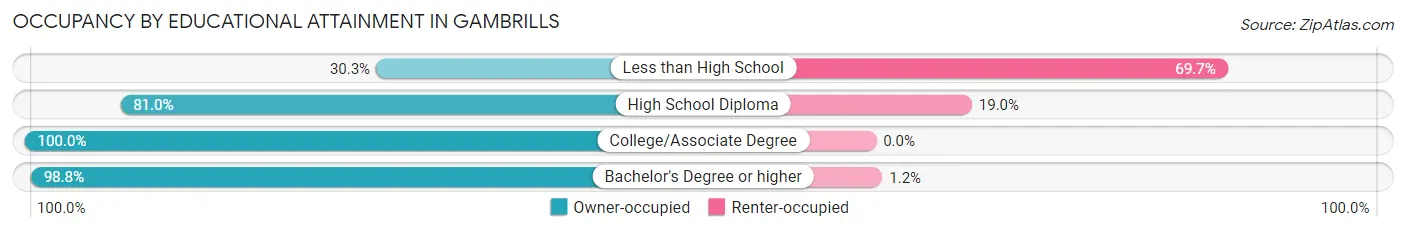
| Household Size | Owner-occupied | Renter-occupied |
| Less than High School | 27 (30.3%) | 62 (69.7%) |
| High School Diploma | 158 (81.0%) | 37 (19.0%) |
| College/Associate Degree | 218 (100.0%) | 0 (0.0%) |
| Bachelor's Degree or higher | 484 (98.8%) | 6 (1.2%) |
Occupancy by Age of Householder in Gambrills
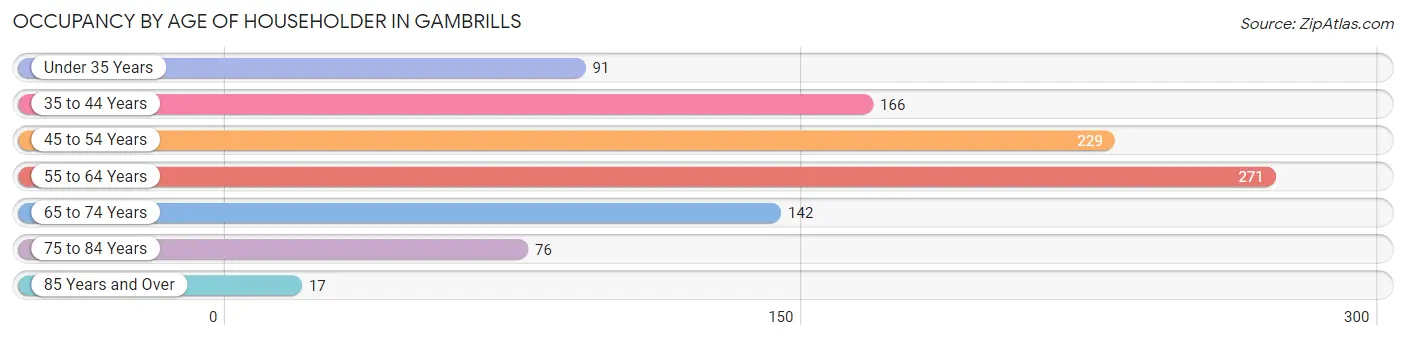
| Age Bracket | # Households | % Households |
| Under 35 Years | 91 | 9.2% |
| 35 to 44 Years | 166 | 16.7% |
| 45 to 54 Years | 229 | 23.1% |
| 55 to 64 Years | 271 | 27.3% |
| 65 to 74 Years | 142 | 14.3% |
| 75 to 84 Years | 76 | 7.7% |
| 85 Years and Over | 17 | 1.7% |
| Total | 992 | 100.0% |
Housing Finances in Gambrills
Median Income by Occupancy in Gambrills
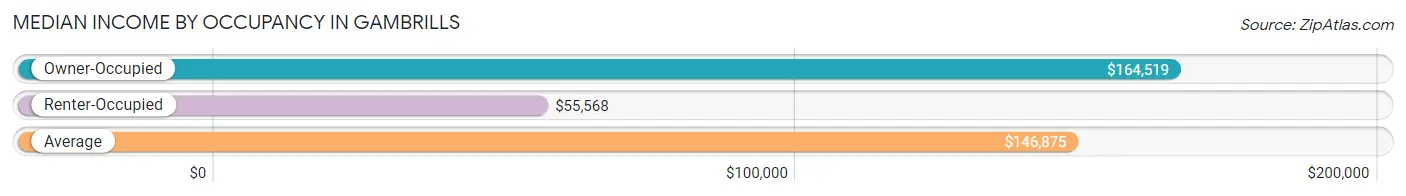
| Occupancy Type | # Households | Median Income |
| Owner-Occupied | 887 (89.4%) | $164,519 |
| Renter-Occupied | 105 (10.6%) | $55,568 |
| Average | 992 (100.0%) | $146,875 |
Occupancy by Householder Income Bracket in Gambrills
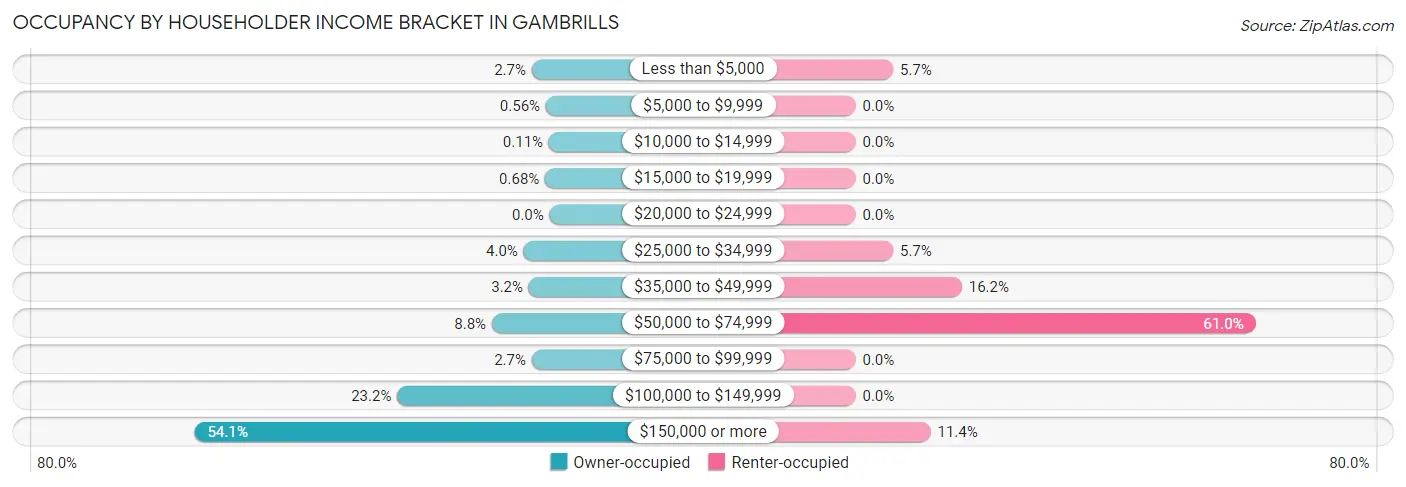
| Income Bracket | Owner-occupied | Renter-occupied |
| Less than $5,000 | 24 (2.7%) | 6 (5.7%) |
| $5,000 to $9,999 | 5 (0.6%) | 0 (0.0%) |
| $10,000 to $14,999 | 1 (0.1%) | 0 (0.0%) |
| $15,000 to $19,999 | 6 (0.7%) | 0 (0.0%) |
| $20,000 to $24,999 | 0 (0.0%) | 0 (0.0%) |
| $25,000 to $34,999 | 35 (4.0%) | 6 (5.7%) |
| $35,000 to $49,999 | 28 (3.2%) | 17 (16.2%) |
| $50,000 to $74,999 | 78 (8.8%) | 64 (61.0%) |
| $75,000 to $99,999 | 24 (2.7%) | 0 (0.0%) |
| $100,000 to $149,999 | 206 (23.2%) | 0 (0.0%) |
| $150,000 or more | 480 (54.1%) | 12 (11.4%) |
| Total | 887 (100.0%) | 105 (100.0%) |
Monthly Housing Cost Tiers in Gambrills
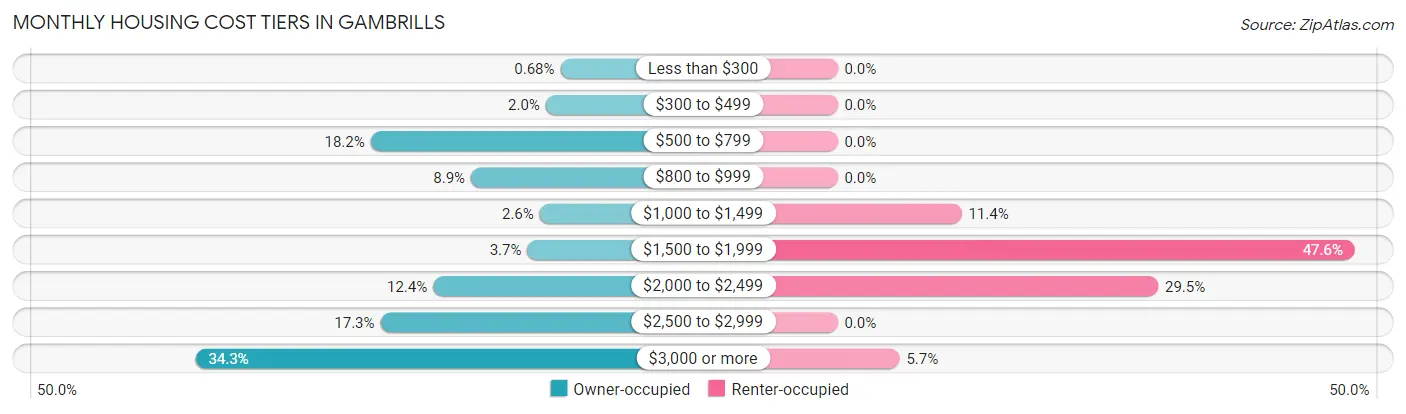
| Monthly Cost | Owner-occupied | Renter-occupied |
| Less than $300 | 6 (0.7%) | 0 (0.0%) |
| $300 to $499 | 18 (2.0%) | 0 (0.0%) |
| $500 to $799 | 161 (18.1%) | 0 (0.0%) |
| $800 to $999 | 79 (8.9%) | 0 (0.0%) |
| $1,000 to $1,499 | 23 (2.6%) | 12 (11.4%) |
| $1,500 to $1,999 | 33 (3.7%) | 50 (47.6%) |
| $2,000 to $2,499 | 110 (12.4%) | 31 (29.5%) |
| $2,500 to $2,999 | 153 (17.2%) | 0 (0.0%) |
| $3,000 or more | 304 (34.3%) | 6 (5.7%) |
| Total | 887 (100.0%) | 105 (100.0%) |
Physical Housing Characteristics in Gambrills
Housing Structures in Gambrills
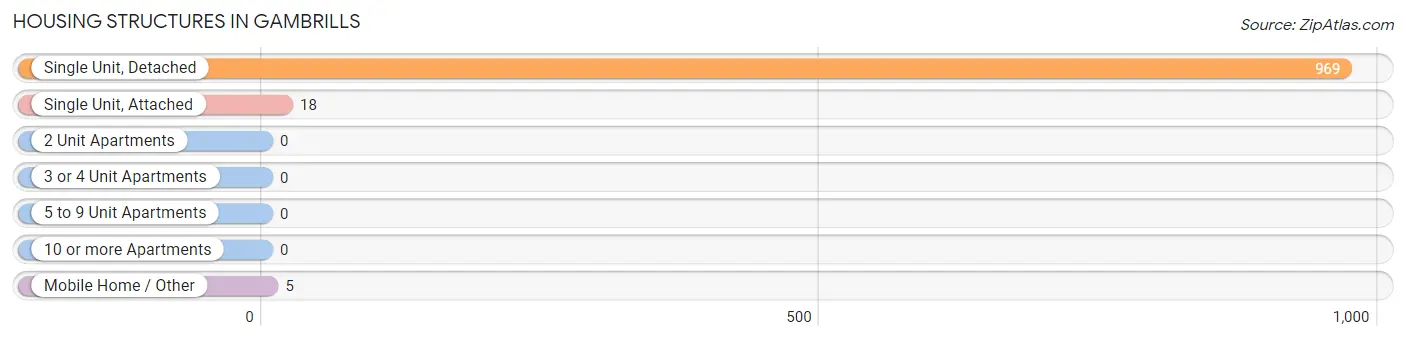
| Structure Type | # Housing Units | % Housing Units |
| Single Unit, Detached | 969 | 97.7% |
| Single Unit, Attached | 18 | 1.8% |
| 2 Unit Apartments | 0 | 0.0% |
| 3 or 4 Unit Apartments | 0 | 0.0% |
| 5 to 9 Unit Apartments | 0 | 0.0% |
| 10 or more Apartments | 0 | 0.0% |
| Mobile Home / Other | 5 | 0.5% |
| Total | 992 | 100.0% |
Housing Structures by Occupancy in Gambrills
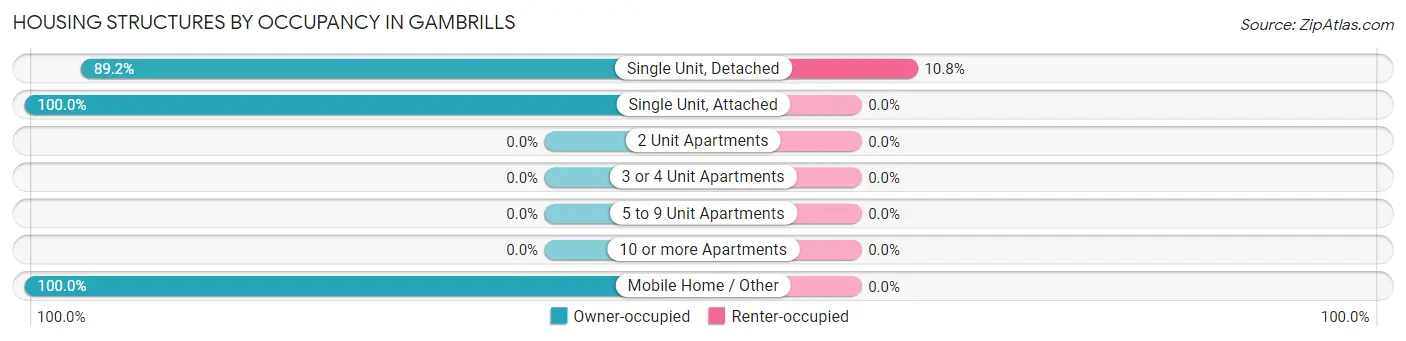
| Structure Type | Owner-occupied | Renter-occupied |
| Single Unit, Detached | 864 (89.2%) | 105 (10.8%) |
| Single Unit, Attached | 18 (100.0%) | 0 (0.0%) |
| 2 Unit Apartments | 0 (0.0%) | 0 (0.0%) |
| 3 or 4 Unit Apartments | 0 (0.0%) | 0 (0.0%) |
| 5 to 9 Unit Apartments | 0 (0.0%) | 0 (0.0%) |
| 10 or more Apartments | 0 (0.0%) | 0 (0.0%) |
| Mobile Home / Other | 5 (100.0%) | 0 (0.0%) |
| Total | 887 (89.4%) | 105 (10.6%) |
Housing Structures by Number of Rooms in Gambrills
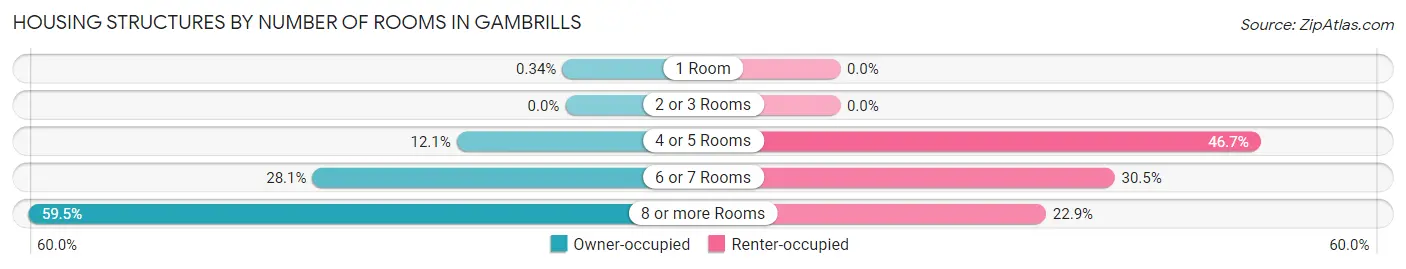
| Number of Rooms | Owner-occupied | Renter-occupied |
| 1 Room | 3 (0.3%) | 0 (0.0%) |
| 2 or 3 Rooms | 0 (0.0%) | 0 (0.0%) |
| 4 or 5 Rooms | 107 (12.1%) | 49 (46.7%) |
| 6 or 7 Rooms | 249 (28.1%) | 32 (30.5%) |
| 8 or more Rooms | 528 (59.5%) | 24 (22.9%) |
| Total | 887 (100.0%) | 105 (100.0%) |
Housing Structure by Heating Type in Gambrills
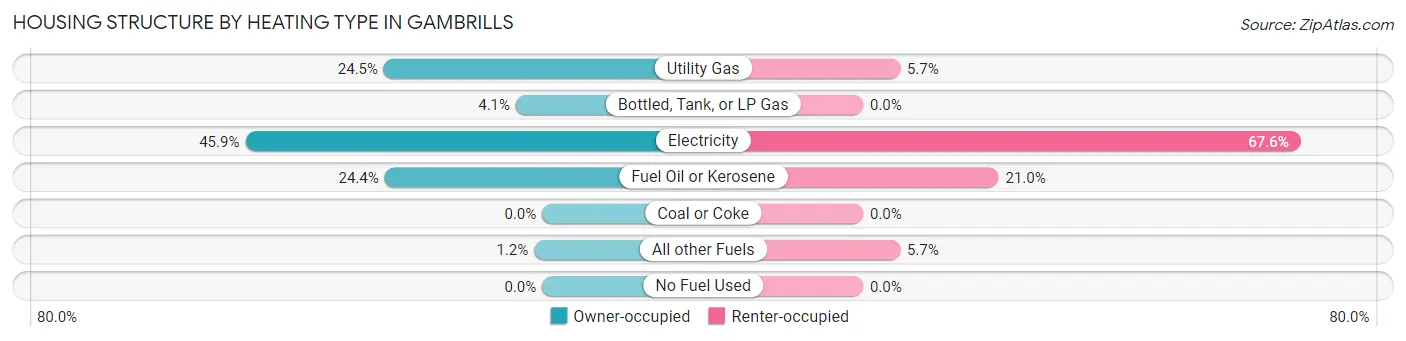
| Heating Type | Owner-occupied | Renter-occupied |
| Utility Gas | 217 (24.5%) | 6 (5.7%) |
| Bottled, Tank, or LP Gas | 36 (4.1%) | 0 (0.0%) |
| Electricity | 407 (45.9%) | 71 (67.6%) |
| Fuel Oil or Kerosene | 216 (24.3%) | 22 (20.9%) |
| Coal or Coke | 0 (0.0%) | 0 (0.0%) |
| All other Fuels | 11 (1.2%) | 6 (5.7%) |
| No Fuel Used | 0 (0.0%) | 0 (0.0%) |
| Total | 887 (100.0%) | 105 (100.0%) |
Household Vehicle Usage in Gambrills
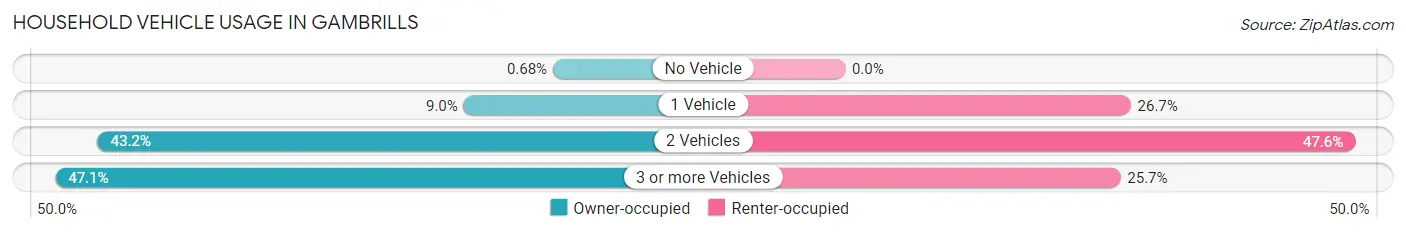
| Vehicles per Household | Owner-occupied | Renter-occupied |
| No Vehicle | 6 (0.7%) | 0 (0.0%) |
| 1 Vehicle | 80 (9.0%) | 28 (26.7%) |
| 2 Vehicles | 383 (43.2%) | 50 (47.6%) |
| 3 or more Vehicles | 418 (47.1%) | 27 (25.7%) |
| Total | 887 (100.0%) | 105 (100.0%) |
Real Estate & Mortgages in Gambrills
Real Estate and Mortgage Overview in Gambrills
| Characteristic | Without Mortgage | With Mortgage |
| Housing Units | 244 | 643 |
| Median Property Value | $485,000 | $573,200 |
| Median Household Income | $117,500 | $391 |
| Monthly Housing Costs | $728 | $304 |
| Real Estate Taxes | $4,167 | $22 |
Property Value by Mortgage Status in Gambrills
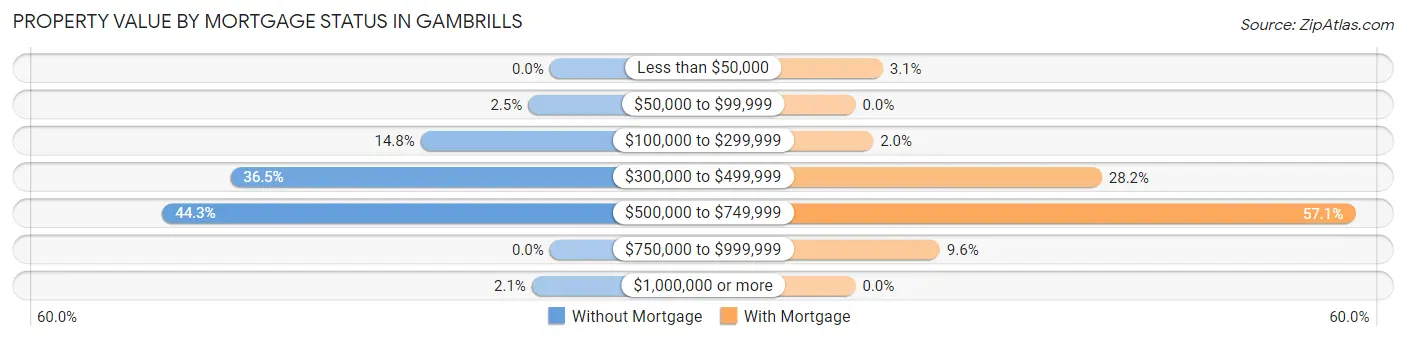
| Property Value | Without Mortgage | With Mortgage |
| Less than $50,000 | 0 (0.0%) | 20 (3.1%) |
| $50,000 to $99,999 | 6 (2.5%) | 0 (0.0%) |
| $100,000 to $299,999 | 36 (14.7%) | 13 (2.0%) |
| $300,000 to $499,999 | 89 (36.5%) | 181 (28.1%) |
| $500,000 to $749,999 | 108 (44.3%) | 367 (57.1%) |
| $750,000 to $999,999 | 0 (0.0%) | 62 (9.6%) |
| $1,000,000 or more | 5 (2.1%) | 0 (0.0%) |
| Total | 244 (100.0%) | 643 (100.0%) |
Household Income by Mortgage Status in Gambrills
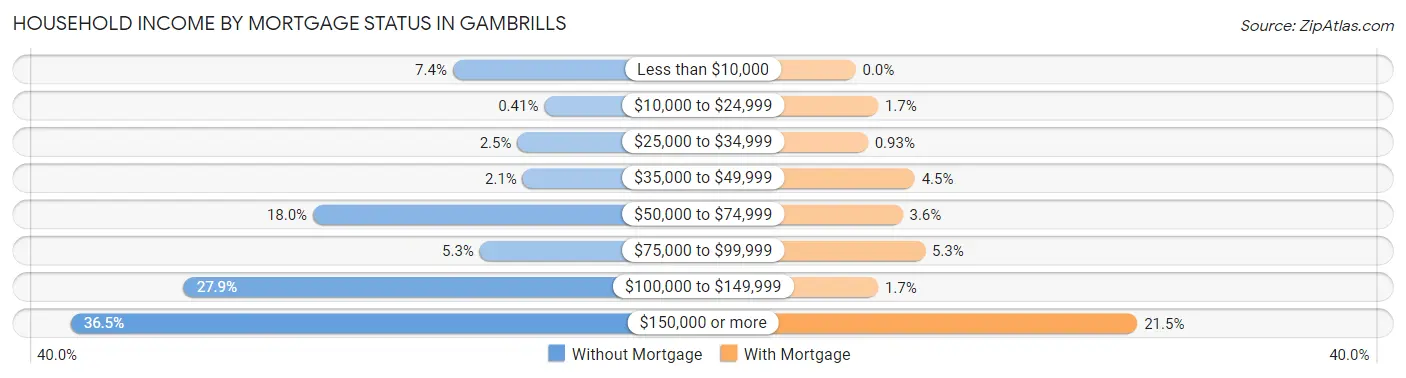
| Household Income | Without Mortgage | With Mortgage |
| Less than $10,000 | 18 (7.4%) | 0 (0.0%) |
| $10,000 to $24,999 | 1 (0.4%) | 11 (1.7%) |
| $25,000 to $34,999 | 6 (2.5%) | 6 (0.9%) |
| $35,000 to $49,999 | 5 (2.1%) | 29 (4.5%) |
| $50,000 to $74,999 | 44 (18.0%) | 23 (3.6%) |
| $75,000 to $99,999 | 13 (5.3%) | 34 (5.3%) |
| $100,000 to $149,999 | 68 (27.9%) | 11 (1.7%) |
| $150,000 or more | 89 (36.5%) | 138 (21.5%) |
| Total | 244 (100.0%) | 643 (100.0%) |
Property Value to Household Income Ratio in Gambrills
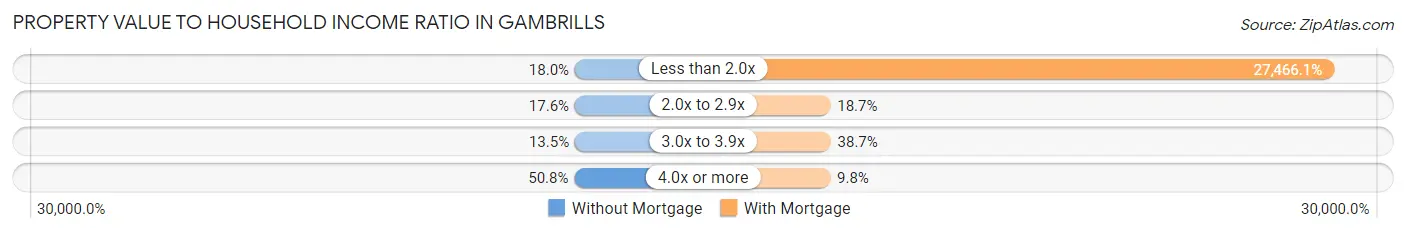
| Value-to-Income Ratio | Without Mortgage | With Mortgage |
| Less than 2.0x | 44 (18.0%) | 176,607 (27,466.1%) |
| 2.0x to 2.9x | 43 (17.6%) | 120 (18.7%) |
| 3.0x to 3.9x | 33 (13.5%) | 249 (38.7%) |
| 4.0x or more | 124 (50.8%) | 63 (9.8%) |
| Total | 244 (100.0%) | 643 (100.0%) |
Real Estate Taxes by Mortgage Status in Gambrills
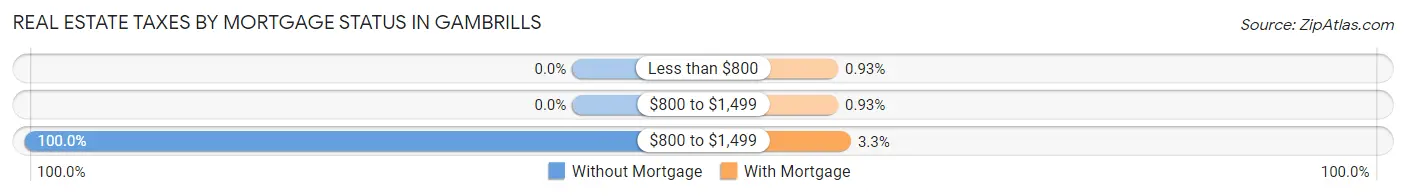
| Property Taxes | Without Mortgage | With Mortgage |
| Less than $800 | 0 (0.0%) | 6 (0.9%) |
| $800 to $1,499 | 0 (0.0%) | 6 (0.9%) |
| $800 to $1,499 | 244 (100.0%) | 21 (3.3%) |
| Total | 244 (100.0%) | 643 (100.0%) |
Health & Disability in Gambrills
Health Insurance Coverage by Age in Gambrills
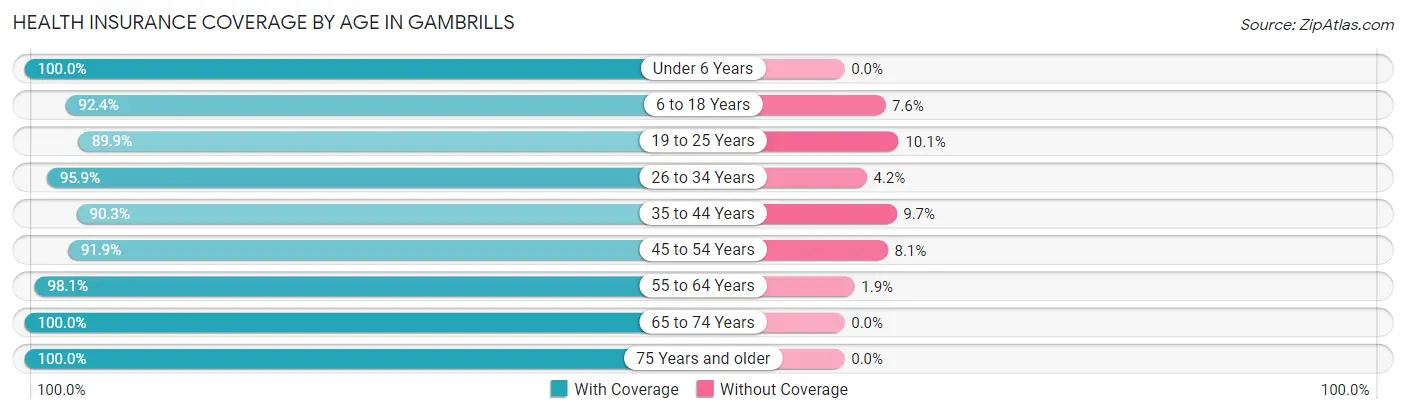
| Age Bracket | With Coverage | Without Coverage |
| Under 6 Years | 209 (100.0%) | 0 (0.0%) |
| 6 to 18 Years | 560 (92.4%) | 46 (7.6%) |
| 19 to 25 Years | 80 (89.9%) | 9 (10.1%) |
| 26 to 34 Years | 300 (95.9%) | 13 (4.2%) |
| 35 to 44 Years | 317 (90.3%) | 34 (9.7%) |
| 45 to 54 Years | 468 (91.9%) | 41 (8.1%) |
| 55 to 64 Years | 525 (98.1%) | 10 (1.9%) |
| 65 to 74 Years | 212 (100.0%) | 0 (0.0%) |
| 75 Years and older | 193 (100.0%) | 0 (0.0%) |
| Total | 2,864 (94.9%) | 153 (5.1%) |
Health Insurance Coverage by Citizenship Status in Gambrills
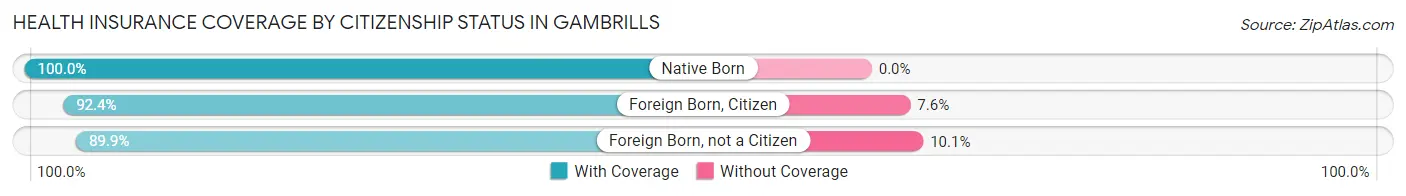
| Citizenship Status | With Coverage | Without Coverage |
| Native Born | 209 (100.0%) | 0 (0.0%) |
| Foreign Born, Citizen | 560 (92.4%) | 46 (7.6%) |
| Foreign Born, not a Citizen | 80 (89.9%) | 9 (10.1%) |
Health Insurance Coverage by Household Income in Gambrills
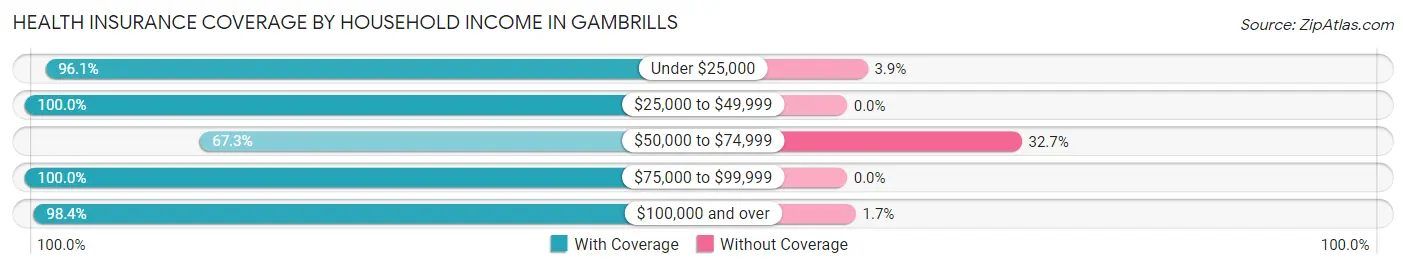
| Household Income | With Coverage | Without Coverage |
| Under $25,000 | 149 (96.1%) | 6 (3.9%) |
| $25,000 to $49,999 | 301 (100.0%) | 0 (0.0%) |
| $50,000 to $74,999 | 228 (67.3%) | 111 (32.7%) |
| $75,000 to $99,999 | 37 (100.0%) | 0 (0.0%) |
| $100,000 and over | 2,149 (98.4%) | 36 (1.7%) |
Public vs Private Health Insurance Coverage by Age in Gambrills
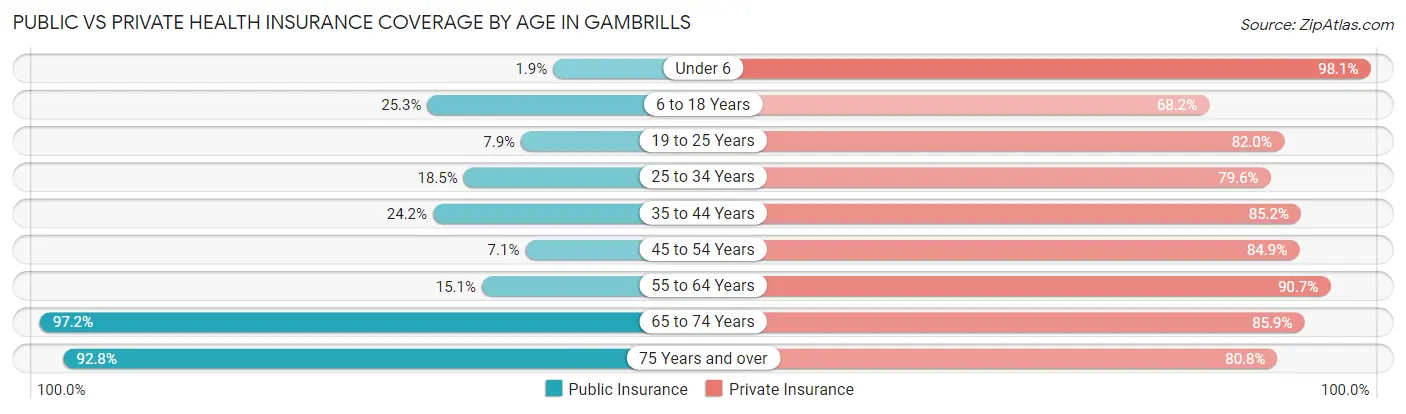
| Age Bracket | Public Insurance | Private Insurance |
| Under 6 | 4 (1.9%) | 205 (98.1%) |
| 6 to 18 Years | 153 (25.3%) | 413 (68.1%) |
| 19 to 25 Years | 7 (7.9%) | 73 (82.0%) |
| 25 to 34 Years | 58 (18.5%) | 249 (79.5%) |
| 35 to 44 Years | 85 (24.2%) | 299 (85.2%) |
| 45 to 54 Years | 36 (7.1%) | 432 (84.9%) |
| 55 to 64 Years | 81 (15.1%) | 485 (90.6%) |
| 65 to 74 Years | 206 (97.2%) | 182 (85.9%) |
| 75 Years and over | 179 (92.7%) | 156 (80.8%) |
| Total | 809 (26.8%) | 2,494 (82.7%) |
Disability Status by Sex by Age in Gambrills
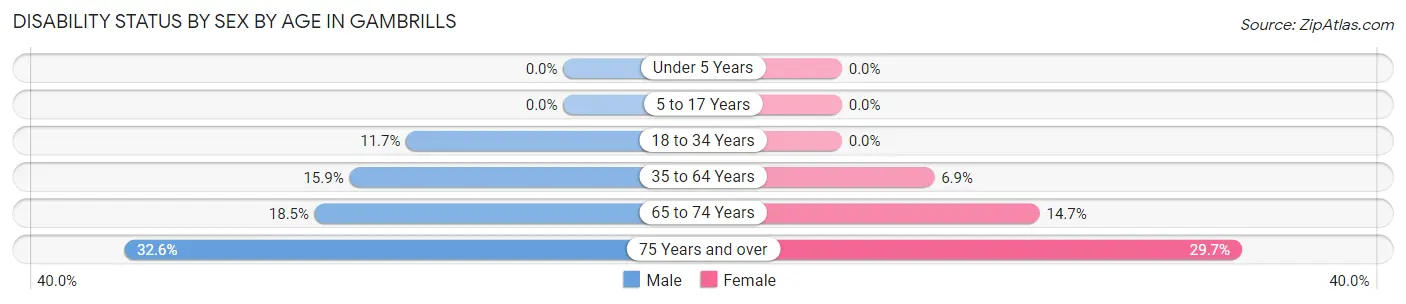
| Age Bracket | Male | Female |
| Under 5 Years | 0 (0.0%) | 0 (0.0%) |
| 5 to 17 Years | 0 (0.0%) | 0 (0.0%) |
| 18 to 34 Years | 26 (11.7%) | 0 (0.0%) |
| 35 to 64 Years | 115 (15.9%) | 46 (6.9%) |
| 65 to 74 Years | 19 (18.4%) | 16 (14.7%) |
| 75 Years and over | 30 (32.6%) | 30 (29.7%) |
Disability Class by Sex by Age in Gambrills
Disability Class: Hearing Difficulty
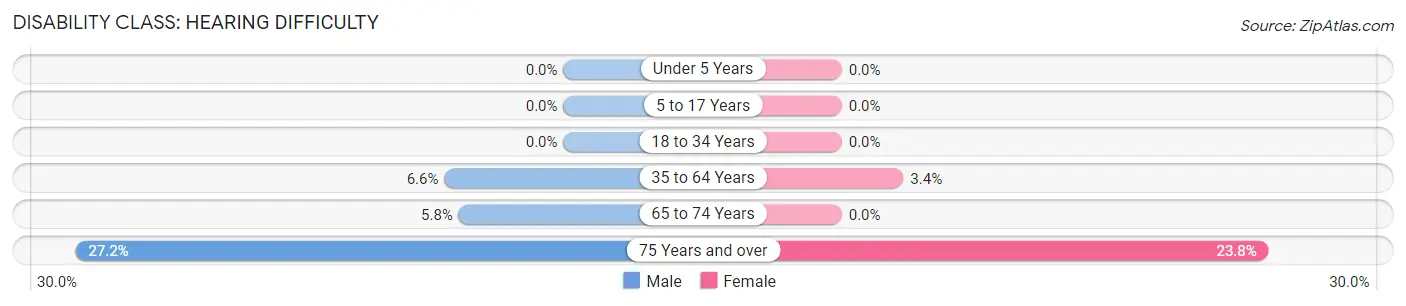
| Age Bracket | Male | Female |
| Under 5 Years | 0 (0.0%) | 0 (0.0%) |
| 5 to 17 Years | 0 (0.0%) | 0 (0.0%) |
| 18 to 34 Years | 0 (0.0%) | 0 (0.0%) |
| 35 to 64 Years | 48 (6.6%) | 23 (3.4%) |
| 65 to 74 Years | 6 (5.8%) | 0 (0.0%) |
| 75 Years and over | 25 (27.2%) | 24 (23.8%) |
Disability Class: Vision Difficulty
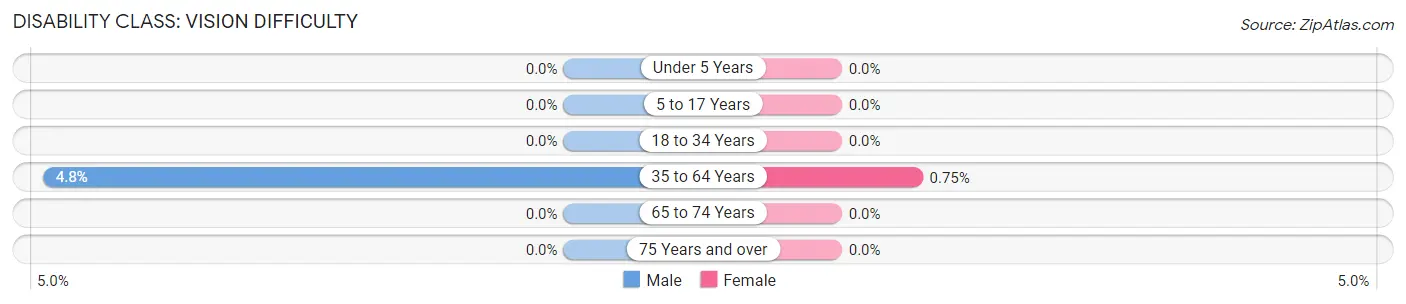
| Age Bracket | Male | Female |
| Under 5 Years | 0 (0.0%) | 0 (0.0%) |
| 5 to 17 Years | 0 (0.0%) | 0 (0.0%) |
| 18 to 34 Years | 0 (0.0%) | 0 (0.0%) |
| 35 to 64 Years | 35 (4.8%) | 5 (0.7%) |
| 65 to 74 Years | 0 (0.0%) | 0 (0.0%) |
| 75 Years and over | 0 (0.0%) | 0 (0.0%) |
Disability Class: Cognitive Difficulty
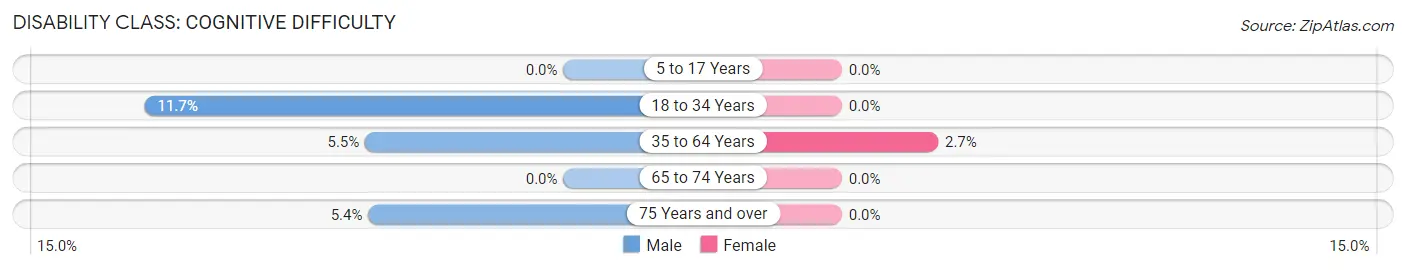
| Age Bracket | Male | Female |
| 5 to 17 Years | 0 (0.0%) | 0 (0.0%) |
| 18 to 34 Years | 26 (11.7%) | 0 (0.0%) |
| 35 to 64 Years | 40 (5.5%) | 18 (2.7%) |
| 65 to 74 Years | 0 (0.0%) | 0 (0.0%) |
| 75 Years and over | 5 (5.4%) | 0 (0.0%) |
Disability Class: Ambulatory Difficulty
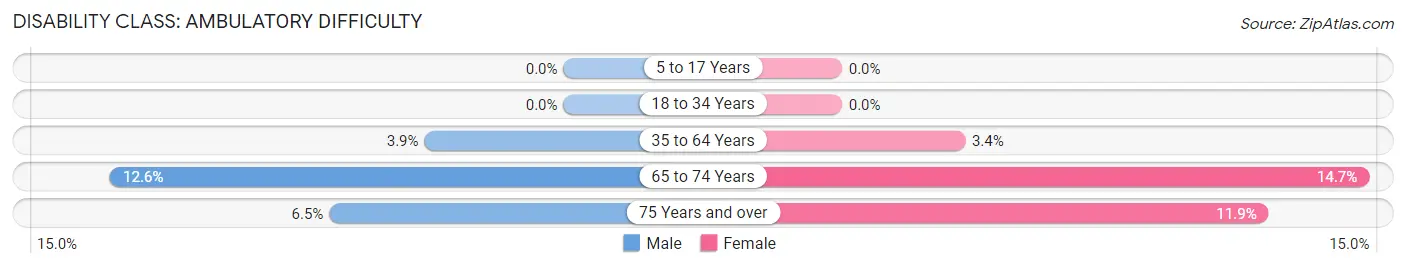
| Age Bracket | Male | Female |
| 5 to 17 Years | 0 (0.0%) | 0 (0.0%) |
| 18 to 34 Years | 0 (0.0%) | 0 (0.0%) |
| 35 to 64 Years | 28 (3.9%) | 23 (3.4%) |
| 65 to 74 Years | 13 (12.6%) | 16 (14.7%) |
| 75 Years and over | 6 (6.5%) | 12 (11.9%) |
Disability Class: Self-Care Difficulty
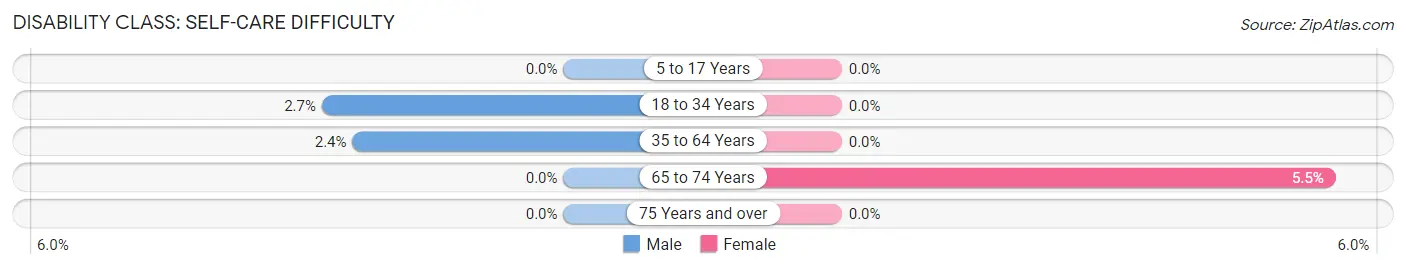
| Age Bracket | Male | Female |
| 5 to 17 Years | 0 (0.0%) | 0 (0.0%) |
| 18 to 34 Years | 6 (2.7%) | 0 (0.0%) |
| 35 to 64 Years | 17 (2.4%) | 0 (0.0%) |
| 65 to 74 Years | 0 (0.0%) | 6 (5.5%) |
| 75 Years and over | 0 (0.0%) | 0 (0.0%) |
Technology Access in Gambrills
Computing Device Access in Gambrills
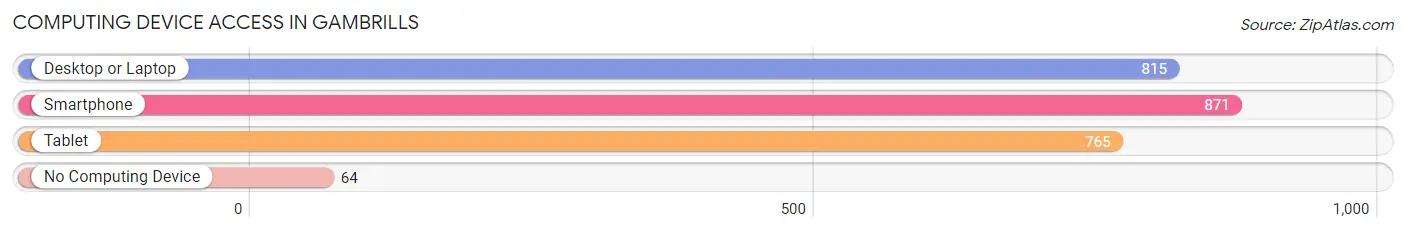
| Device Type | # Households | % Households |
| Desktop or Laptop | 815 | 82.2% |
| Smartphone | 871 | 87.8% |
| Tablet | 765 | 77.1% |
| No Computing Device | 64 | 6.5% |
| Total | 992 | 100.0% |
Internet Access in Gambrills
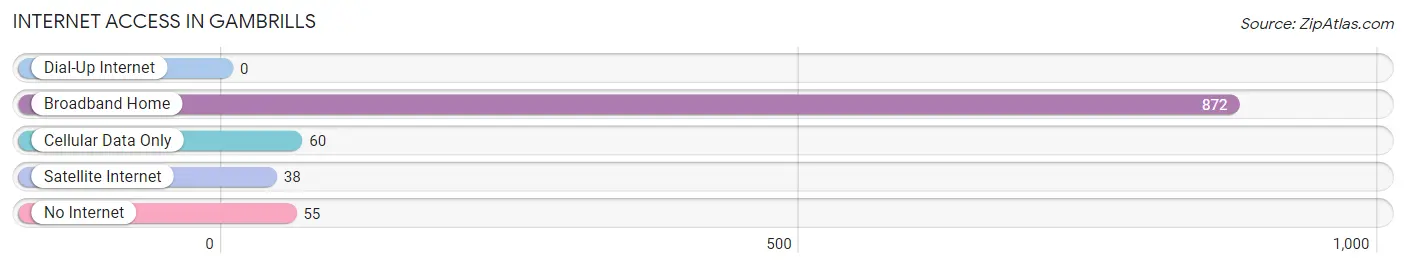
| Internet Type | # Households | % Households |
| Dial-Up Internet | 0 | 0.0% |
| Broadband Home | 872 | 87.9% |
| Cellular Data Only | 60 | 6.0% |
| Satellite Internet | 38 | 3.8% |
| No Internet | 55 | 5.5% |
| Total | 992 | 100.0% |
Gambrills Summary
History
Gambrills, Maryland is a small unincorporated community located in Anne Arundel County, Maryland. It is located just south of the city of Annapolis and is part of the Baltimore-Washington metropolitan area. The area was first settled in the late 1600s by English settlers, and the town was officially established in 1706. The town was named after the Gambrill family, who were prominent landowners in the area.
The town was a rural farming community for much of its history, but in the late 19th century, it began to develop into a suburban community. In the early 20th century, the town was home to a number of large estates, including the estate of William Gambrill, which is now the site of the Gambrills State Park.
Geography
Gambrills is located in Anne Arundel County, Maryland, just south of the city of Annapolis. It is situated on the western shore of the Chesapeake Bay, and is bordered by the Patuxent River to the north and the Severn River to the south. The town is located in a hilly area, with the highest point being the Gambrills State Park, which is located at an elevation of approximately 200 feet.
The town has a total area of 4.2 square miles, of which 0.2 square miles is water. The town is located in a humid subtropical climate zone, with hot, humid summers and mild winters.
Economy
Gambrills is primarily a residential community, and the majority of its residents are employed in the nearby cities of Annapolis and Baltimore. The town is home to a number of small businesses, including restaurants, retail stores, and professional services.
The town is also home to a number of government and military installations, including the Naval Academy, the National Security Agency, and the U.S. Army's Fort Meade. These installations provide a significant number of jobs to the local economy.
Demographics
As of the 2010 census, the population of Gambrills was 8,717. The racial makeup of the town was 79.3% White, 11.2% African American, 0.3% Native American, 4.2% Asian, 0.1% Pacific Islander, and 4.9% from other races. Hispanic or Latino of any race were 8.2% of the population.
The median household income in Gambrills was $90,945, and the median family income was $103,945. The per capita income for the town was $41,945. About 4.2% of families and 5.3% of the population were below the poverty line, including 6.2% of those under age 18 and 4.2% of those age 65 or over.
Common Questions
What is Per Capita Income in Gambrills?
Per Capita income in Gambrills is $55,717.
What is the Median Family Income in Gambrills?
Median Family Income in Gambrills is $165,469.
What is the Median Household income in Gambrills?
Median Household Income in Gambrills is $146,875.
What is Income or Wage Gap in Gambrills?
Income or Wage Gap in Gambrills is 31.8%.
Women in Gambrills earn 68.2 cents for every dollar earned by a man.
What is Family Income Deficit in Gambrills?
Family Income Deficit in Gambrills is $32,080.
Families that are below poverty line in Gambrills earn $32,080 less on average than the poverty threshold level.
What is Inequality or Gini Index in Gambrills?
Inequality or Gini Index in Gambrills is 0.37.
What is the Total Population of Gambrills?
Total Population of Gambrills is 3,111.
What is the Total Male Population of Gambrills?
Total Male Population of Gambrills is 1,544.
What is the Total Female Population of Gambrills?
Total Female Population of Gambrills is 1,567.
What is the Ratio of Males per 100 Females in Gambrills?
There are 98.53 Males per 100 Females in Gambrills.
What is the Ratio of Females per 100 Males in Gambrills?
There are 101.49 Females per 100 Males in Gambrills.
What is the Median Population Age in Gambrills?
Median Population Age in Gambrills is 42.0 Years.
What is the Average Family Size in Gambrills
Average Family Size in Gambrills is 3.4 People.
What is the Average Household Size in Gambrills
Average Household Size in Gambrills is 3.1 People.
How Large is the Labor Force in Gambrills?
There are 1,629 People in the Labor Forcein in Gambrills.
What is the Percentage of People in the Labor Force in Gambrills?
67.3% of People are in the Labor Force in Gambrills.
What is the Unemployment Rate in Gambrills?
Unemployment Rate in Gambrills is 2.0%.