Queenstown, MD Map & Demographics
Queenstown Map
Queenstown Overview
$40,979
PER CAPITA INCOME
$109,375
AVG FAMILY INCOME
$101,964
AVG HOUSEHOLD INCOME
2.2%
WAGE / INCOME GAP [ % ]
97.8¢/ $1
WAGE / INCOME GAP [ $ ]
0.39
INEQUALITY / GINI INDEX
815
TOTAL POPULATION
351
MALE POPULATION
464
FEMALE POPULATION
75.65
MALES / 100 FEMALES
132.19
FEMALES / 100 MALES
35.3
MEDIAN AGE
3.5
AVG FAMILY SIZE
3.0
AVG HOUSEHOLD SIZE
405
LABOR FORCE [ PEOPLE ]
69.3%
PERCENT IN LABOR FORCE
4.2%
UNEMPLOYMENT RATE
Queenstown Zip Codes
Income in Queenstown
Income Overview in Queenstown
Per Capita Income in Queenstown is $40,979, while median incomes of families and households are $109,375 and $101,964 respectively.
| Characteristic | Number | Measure |
| Per Capita Income | 815 | $40,979 |
| Median Family Income | 183 | $109,375 |
| Mean Family Income | 183 | $125,803 |
| Median Household Income | 273 | $101,964 |
| Mean Household Income | 273 | $114,431 |
| Income Deficit | 183 | $0 |
| Wage / Income Gap (%) | 815 | 2.19% |
| Wage / Income Gap ($) | 815 | 97.81¢ per $1 |
| Gini / Inequality Index | 815 | 0.39 |
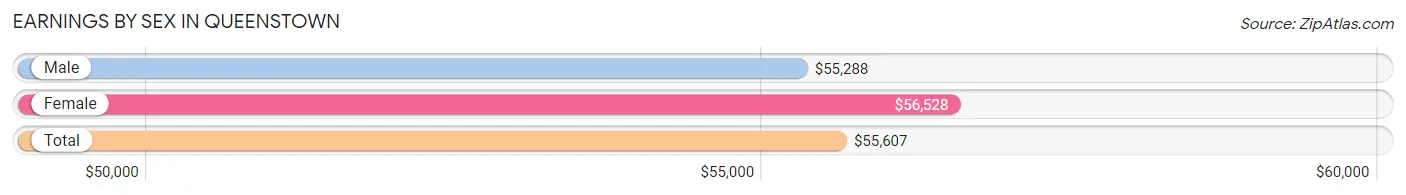
Earnings by Sex in Queenstown
Average Earnings in Queenstown are $55,607, $55,288 for men and $56,528 for women, a difference of 2.2%.
| Sex | Number | Average Earnings |
| Male | 236 (55.5%) | $55,288 |
| Female | 189 (44.5%) | $56,528 |
| Total | 425 (100.0%) | $55,607 |
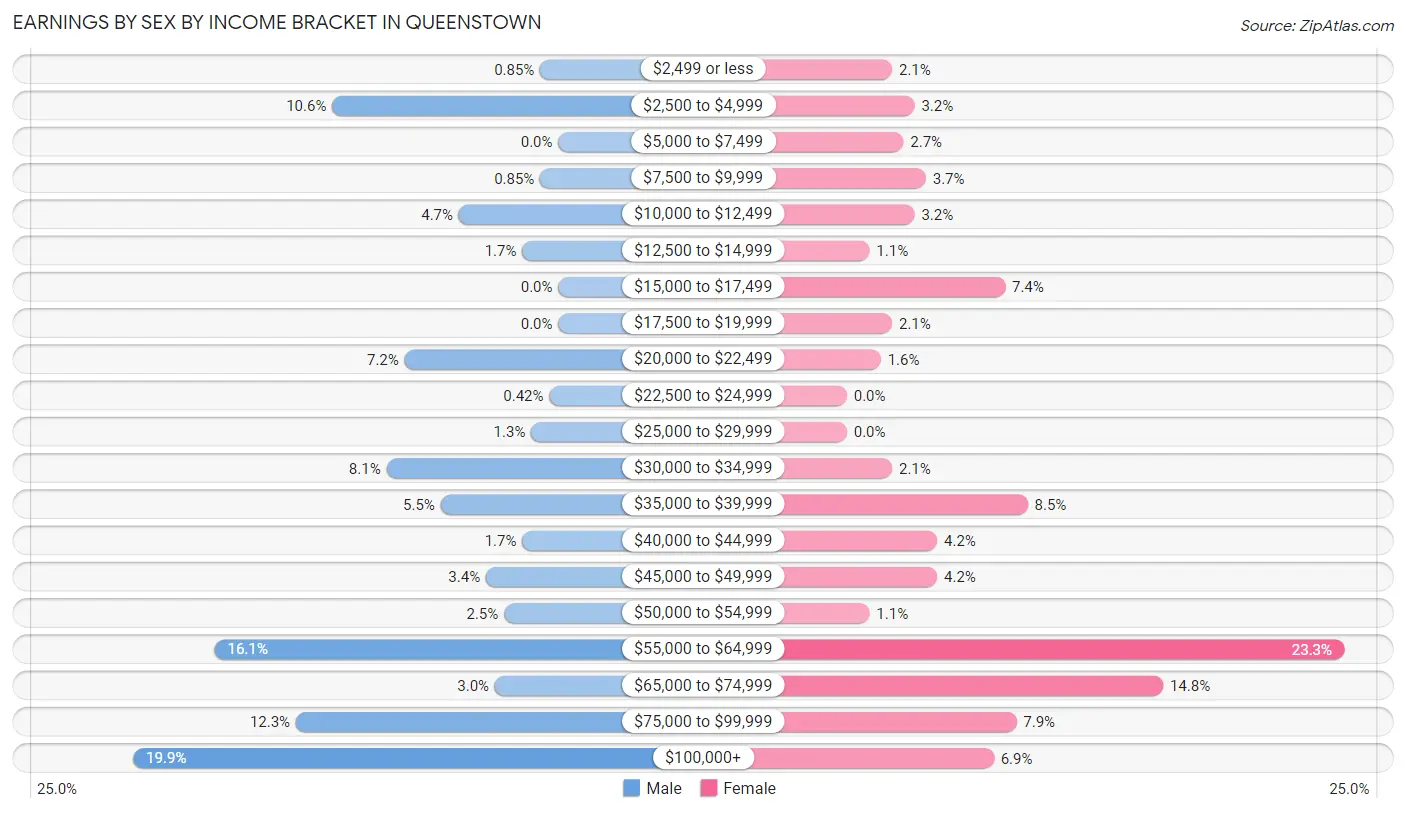
Earnings by Sex by Income Bracket in Queenstown
The most common earnings brackets in Queenstown are $100,000+ for men (47 | 19.9%) and $55,000 to $64,999 for women (44 | 23.3%).
| Income | Male | Female |
| $2,499 or less | 2 (0.9%) | 4 (2.1%) |
| $2,500 to $4,999 | 25 (10.6%) | 6 (3.2%) |
| $5,000 to $7,499 | 0 (0.0%) | 5 (2.6%) |
| $7,500 to $9,999 | 2 (0.9%) | 7 (3.7%) |
| $10,000 to $12,499 | 11 (4.7%) | 6 (3.2%) |
| $12,500 to $14,999 | 4 (1.7%) | 2 (1.1%) |
| $15,000 to $17,499 | 0 (0.0%) | 14 (7.4%) |
| $17,500 to $19,999 | 0 (0.0%) | 4 (2.1%) |
| $20,000 to $22,499 | 17 (7.2%) | 3 (1.6%) |
| $22,500 to $24,999 | 1 (0.4%) | 0 (0.0%) |
| $25,000 to $29,999 | 3 (1.3%) | 0 (0.0%) |
| $30,000 to $34,999 | 19 (8.1%) | 4 (2.1%) |
| $35,000 to $39,999 | 13 (5.5%) | 16 (8.5%) |
| $40,000 to $44,999 | 4 (1.7%) | 8 (4.2%) |
| $45,000 to $49,999 | 8 (3.4%) | 8 (4.2%) |
| $50,000 to $54,999 | 6 (2.5%) | 2 (1.1%) |
| $55,000 to $64,999 | 38 (16.1%) | 44 (23.3%) |
| $65,000 to $74,999 | 7 (3.0%) | 28 (14.8%) |
| $75,000 to $99,999 | 29 (12.3%) | 15 (7.9%) |
| $100,000+ | 47 (19.9%) | 13 (6.9%) |
| Total | 236 (100.0%) | 189 (100.0%) |
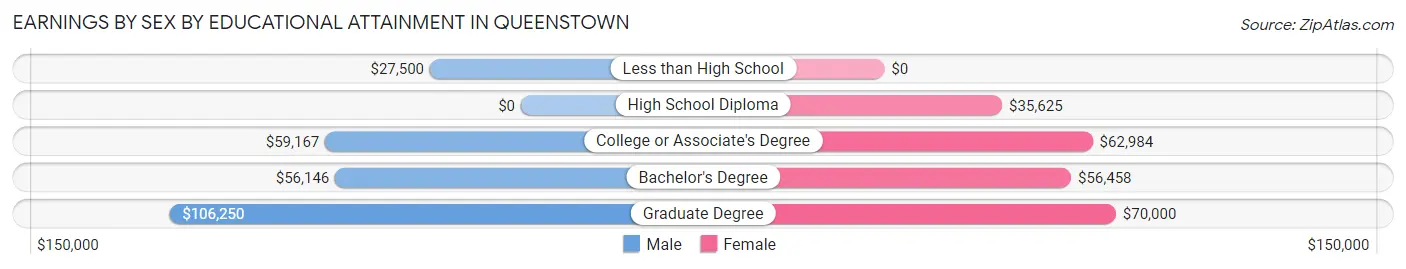
Earnings by Sex by Educational Attainment in Queenstown
Average earnings in Queenstown are $56,587 for men and $57,083 for women, a difference of 0.9%. Men with an educational attainment of graduate degree enjoy the highest average annual earnings of $106,250, while those with less than high school education earn the least with $27,500. Women with an educational attainment of graduate degree earn the most with the average annual earnings of $70,000, while those with high school diploma education have the smallest earnings of $35,625.
| Educational Attainment | Male Income | Female Income |
| Less than High School | $27,500 | $0 |
| High School Diploma | - | - |
| College or Associate's Degree | $59,167 | $62,984 |
| Bachelor's Degree | $56,146 | $56,458 |
| Graduate Degree | $106,250 | $70,000 |
| Total | $56,587 | $57,083 |
Family Income in Queenstown
Family Income Brackets in Queenstown
According to the Queenstown family income data, there are 48 families falling into the $100,000 to $149,999 income range, which is the most common income bracket and makes up 26.2% of all families.
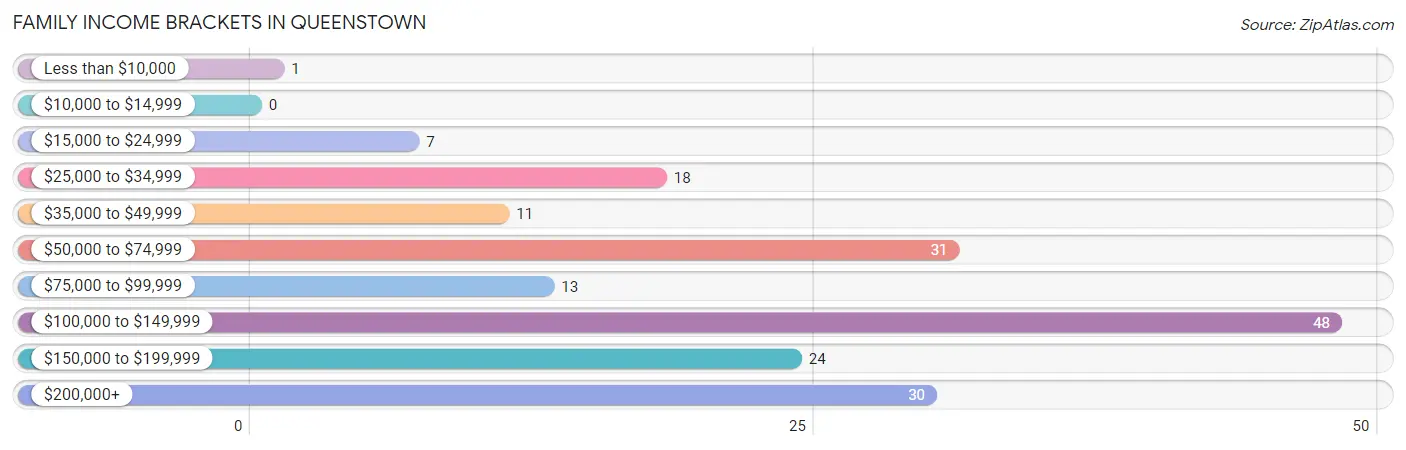
| Income Bracket | # Families | % Families |
| Less than $10,000 | 1 | 0.5% |
| $10,000 to $14,999 | 0 | 0.0% |
| $15,000 to $24,999 | 7 | 3.8% |
| $25,000 to $34,999 | 18 | 9.8% |
| $35,000 to $49,999 | 11 | 6.0% |
| $50,000 to $74,999 | 31 | 16.9% |
| $75,000 to $99,999 | 13 | 7.1% |
| $100,000 to $149,999 | 48 | 26.2% |
| $150,000 to $199,999 | 24 | 13.1% |
| $200,000+ | 30 | 16.4% |
Family Income by Famaliy Size in Queenstown
4-person families (11 | 6.0%) account for the highest median family income in Queenstown with $245,625 per family, while 4-person families (11 | 6.0%) have the highest median income of $61,406 per family member.
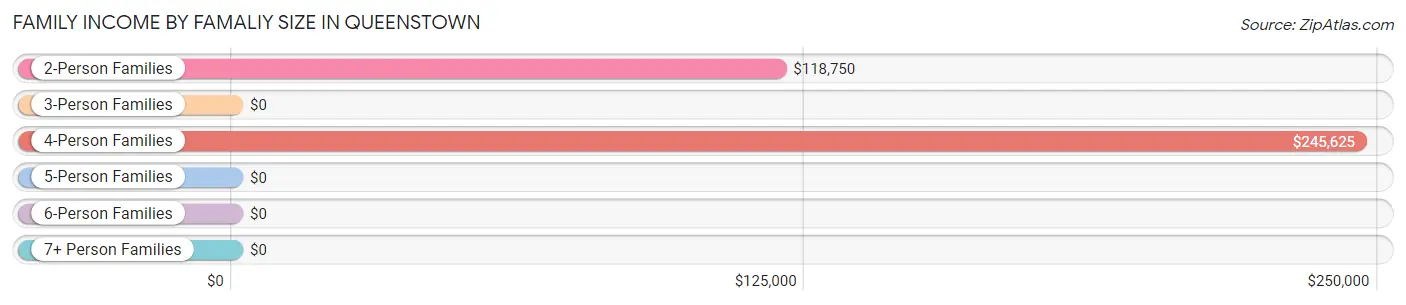
| Income Bracket | # Families | Median Income |
| 2-Person Families | 88 (48.1%) | $118,750 |
| 3-Person Families | 57 (31.1%) | $0 |
| 4-Person Families | 11 (6.0%) | $245,625 |
| 5-Person Families | 18 (9.8%) | $0 |
| 6-Person Families | 9 (4.9%) | $0 |
| 7+ Person Families | 0 (0.0%) | $0 |
| Total | 183 (100.0%) | $109,375 |
Family Income by Number of Earners in Queenstown
The median family income in Queenstown is $109,375, with families comprising 3+ earners (18) having the highest median family income of $202,500, while families with 1 earner (75) have the lowest median family income of $56,198, accounting for 9.8% and 41.0% of families, respectively.
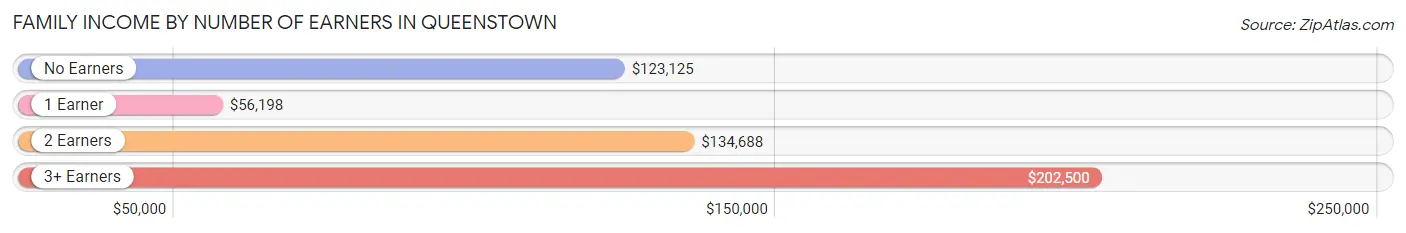
| Number of Earners | # Families | Median Income |
| No Earners | 23 (12.6%) | $123,125 |
| 1 Earner | 75 (41.0%) | $56,198 |
| 2 Earners | 67 (36.6%) | $134,688 |
| 3+ Earners | 18 (9.8%) | $202,500 |
| Total | 183 (100.0%) | $109,375 |
Household Income in Queenstown
Household Income Brackets in Queenstown
With 79 households falling in the category, the $100,000 to $149,999 income range is the most frequent in Queenstown, accounting for 28.9% of all households.
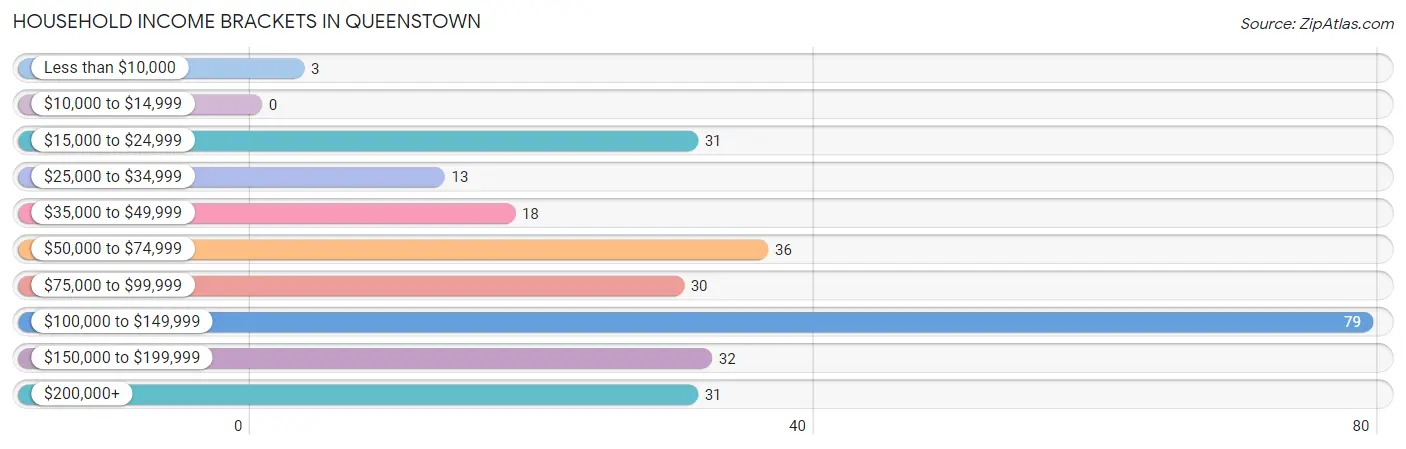
| Income Bracket | # Households | % Households |
| Less than $10,000 | 3 | 1.1% |
| $10,000 to $14,999 | 0 | 0.0% |
| $15,000 to $24,999 | 31 | 11.4% |
| $25,000 to $34,999 | 13 | 4.8% |
| $35,000 to $49,999 | 18 | 6.6% |
| $50,000 to $74,999 | 36 | 13.2% |
| $75,000 to $99,999 | 30 | 11.0% |
| $100,000 to $149,999 | 79 | 28.9% |
| $150,000 to $199,999 | 32 | 11.7% |
| $200,000+ | 31 | 11.4% |
Household Income by Householder Age in Queenstown
The median household income in Queenstown is $101,964, with the highest median household income of $149,375 found in the 45 to 64 years age bracket for the primary householder. A total of 102 households (37.4%) fall into this category.
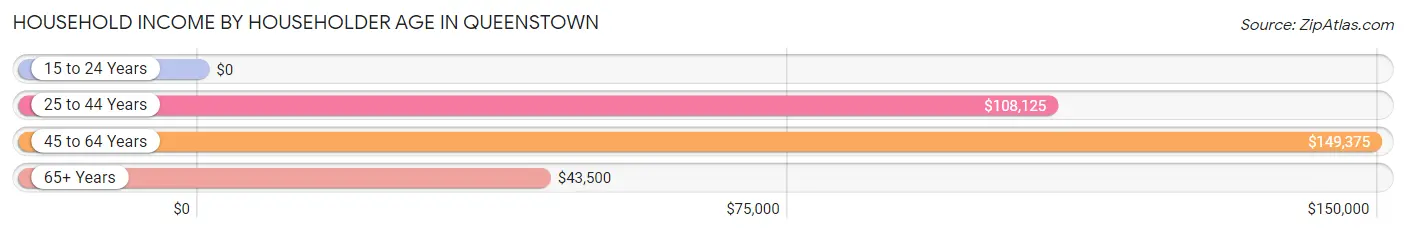
| Income Bracket | # Households | Median Income |
| 15 to 24 Years | 0 (0.0%) | $0 |
| 25 to 44 Years | 99 (36.3%) | $108,125 |
| 45 to 64 Years | 102 (37.4%) | $149,375 |
| 65+ Years | 72 (26.4%) | $43,500 |
| Total | 273 (100.0%) | $101,964 |
Poverty in Queenstown
Income Below Poverty by Sex and Age in Queenstown
With 12.5% poverty level for males and 25.7% for females among the residents of Queenstown, under 5 year old males and 12 to 14 year old females are the most vulnerable to poverty, with 11 males (64.7%) and 31 females (100.0%) in their respective age groups living below the poverty level.
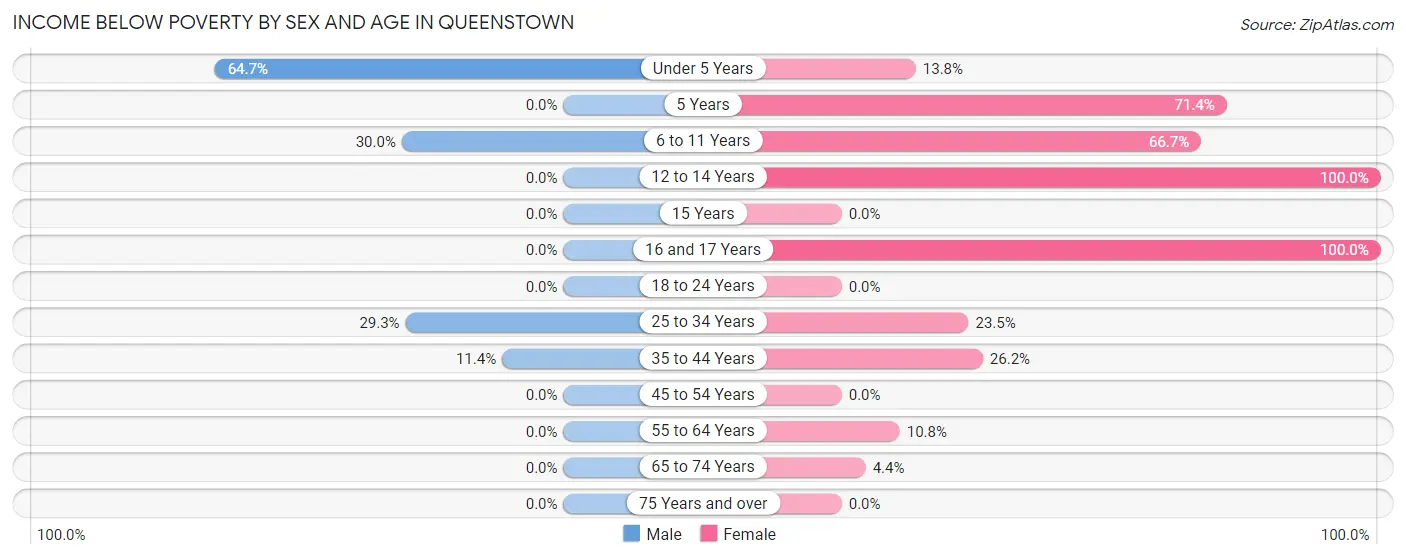
| Age Bracket | Male | Female |
| Under 5 Years | 11 (64.7%) | 11 (13.8%) |
| 5 Years | 0 (0.0%) | 5 (71.4%) |
| 6 to 11 Years | 6 (30.0%) | 26 (66.7%) |
| 12 to 14 Years | 0 (0.0%) | 31 (100.0%) |
| 15 Years | 0 (0.0%) | 0 (0.0%) |
| 16 and 17 Years | 0 (0.0%) | 9 (100.0%) |
| 18 to 24 Years | 0 (0.0%) | 0 (0.0%) |
| 25 to 34 Years | 17 (29.3%) | 16 (23.5%) |
| 35 to 44 Years | 9 (11.4%) | 11 (26.2%) |
| 45 to 54 Years | 0 (0.0%) | 0 (0.0%) |
| 55 to 64 Years | 0 (0.0%) | 7 (10.8%) |
| 65 to 74 Years | 0 (0.0%) | 2 (4.4%) |
| 75 Years and over | 0 (0.0%) | 0 (0.0%) |
| Total | 43 (12.5%) | 118 (25.7%) |
Income Above Poverty by Sex and Age in Queenstown
According to the poverty statistics in Queenstown, males aged 5 years and females aged 15 years are the age groups that are most secure financially, with 100.0% of males and 100.0% of females in these age groups living above the poverty line.
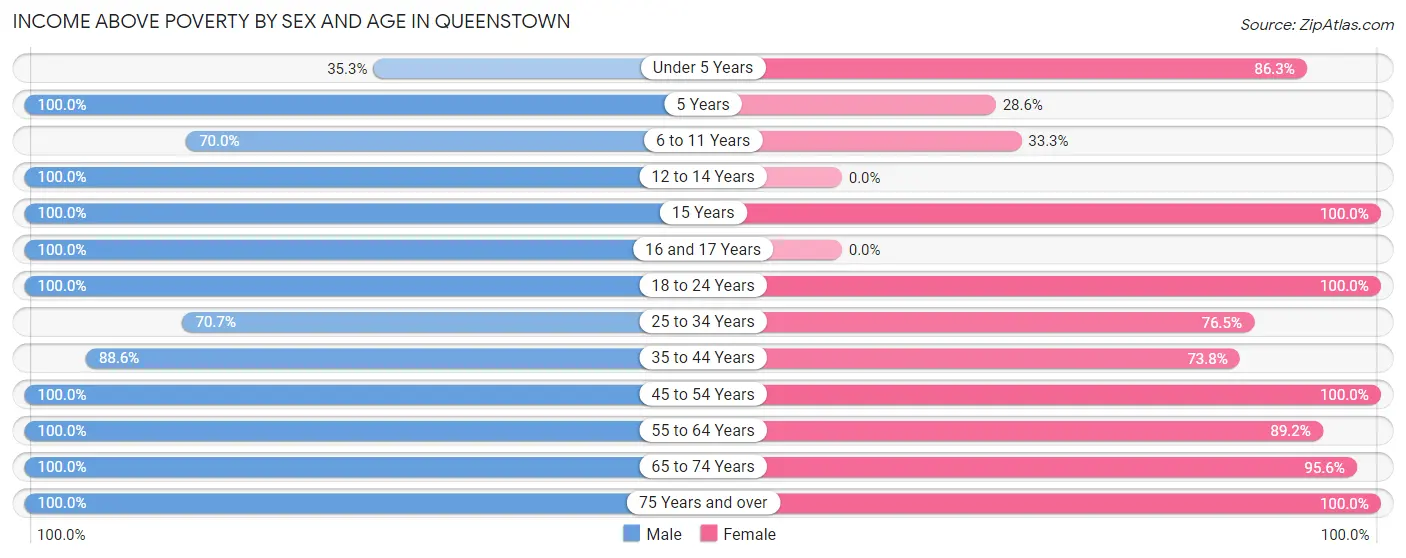
| Age Bracket | Male | Female |
| Under 5 Years | 6 (35.3%) | 69 (86.3%) |
| 5 Years | 7 (100.0%) | 2 (28.6%) |
| 6 to 11 Years | 14 (70.0%) | 13 (33.3%) |
| 12 to 14 Years | 9 (100.0%) | 0 (0.0%) |
| 15 Years | 4 (100.0%) | 6 (100.0%) |
| 16 and 17 Years | 7 (100.0%) | 0 (0.0%) |
| 18 to 24 Years | 23 (100.0%) | 4 (100.0%) |
| 25 to 34 Years | 41 (70.7%) | 52 (76.5%) |
| 35 to 44 Years | 70 (88.6%) | 31 (73.8%) |
| 45 to 54 Years | 31 (100.0%) | 36 (100.0%) |
| 55 to 64 Years | 55 (100.0%) | 58 (89.2%) |
| 65 to 74 Years | 13 (100.0%) | 43 (95.6%) |
| 75 Years and over | 22 (100.0%) | 27 (100.0%) |
| Total | 302 (87.5%) | 341 (74.3%) |
Income Below Poverty Among Married-Couple Families in Queenstown
The poverty statistics for married-couple families in Queenstown show that 9.5% or 13 of the total 137 families live below the poverty line. Families with 3 or 4 children have the highest poverty rate of 92.3%, comprising of 12 families. On the other hand, families with 1 or 2 children have the lowest poverty rate of 0.0%, which includes 0 families.
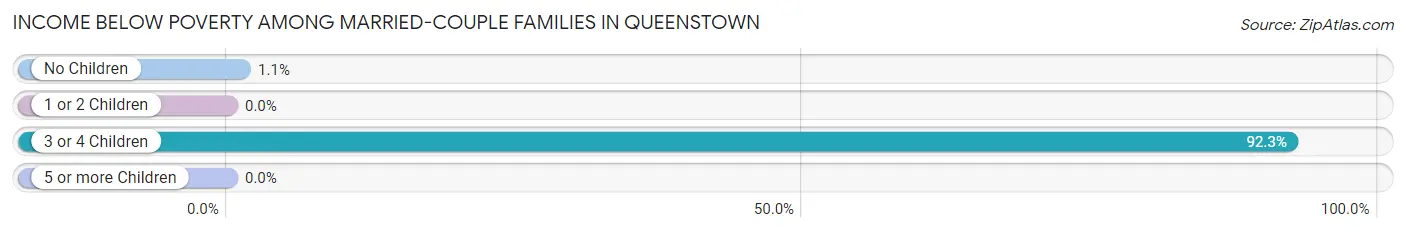
| Children | Above Poverty | Below Poverty |
| No Children | 87 (98.9%) | 1 (1.1%) |
| 1 or 2 Children | 36 (100.0%) | 0 (0.0%) |
| 3 or 4 Children | 1 (7.7%) | 12 (92.3%) |
| 5 or more Children | 0 (0.0%) | 0 (0.0%) |
| Total | 124 (90.5%) | 13 (9.5%) |
Income Below Poverty Among Single-Parent Households in Queenstown
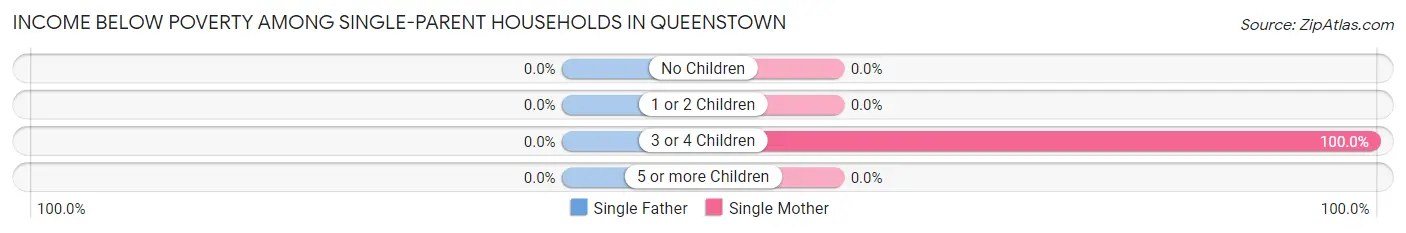
| Children | Single Father | Single Mother |
| No Children | 0 (0.0%) | 0 (0.0%) |
| 1 or 2 Children | 0 (0.0%) | 0 (0.0%) |
| 3 or 4 Children | 0 (0.0%) | 7 (100.0%) |
| 5 or more Children | 0 (0.0%) | 0 (0.0%) |
| Total | 0 (0.0%) | 7 (53.8%) |
Income Below Poverty Among Married-Couple vs Single-Parent Households in Queenstown
The poverty data for Queenstown shows that 13 of the married-couple family households (9.5%) and 7 of the single-parent households (15.2%) are living below the poverty level. Within the married-couple family households, those with 3 or 4 children have the highest poverty rate, with 12 households (92.3%) falling below the poverty line. Among the single-parent households, those with 3 or 4 children have the highest poverty rate, with 7 household (100.0%) living below poverty.
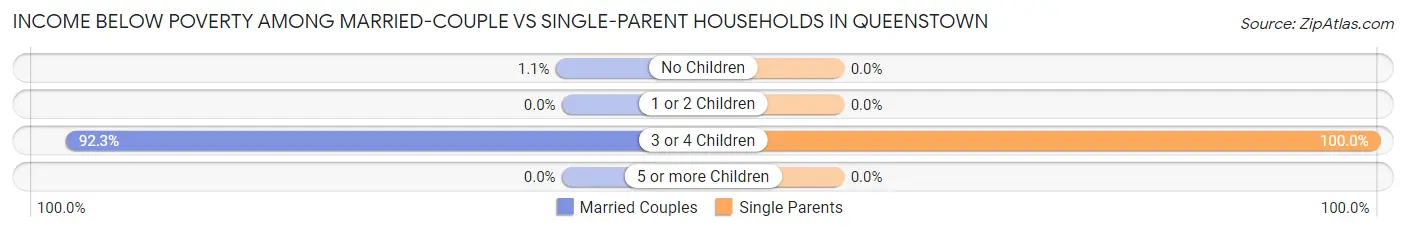
| Children | Married-Couple Families | Single-Parent Households |
| No Children | 1 (1.1%) | 0 (0.0%) |
| 1 or 2 Children | 0 (0.0%) | 0 (0.0%) |
| 3 or 4 Children | 12 (92.3%) | 7 (100.0%) |
| 5 or more Children | 0 (0.0%) | 0 (0.0%) |
| Total | 13 (9.5%) | 7 (15.2%) |
Race in Queenstown
The most populous races in Queenstown are White / Caucasian (460 | 56.4%), Hispanic or Latino (250 | 30.7%), and Two or more Races (158 | 19.4%).
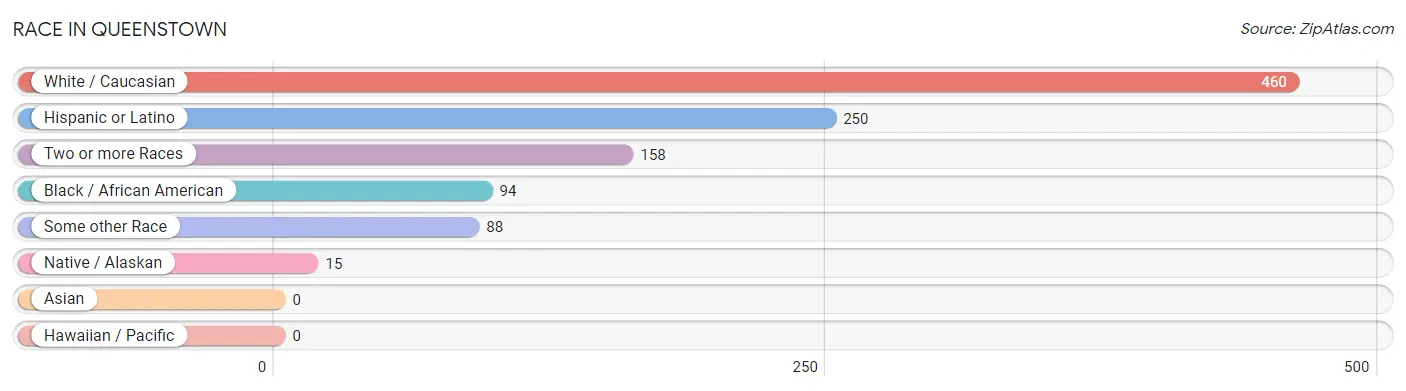
| Race | # Population | % Population |
| Asian | 0 | 0.0% |
| Black / African American | 94 | 11.5% |
| Hawaiian / Pacific | 0 | 0.0% |
| Hispanic or Latino | 250 | 30.7% |
| Native / Alaskan | 15 | 1.8% |
| White / Caucasian | 460 | 56.4% |
| Two or more Races | 158 | 19.4% |
| Some other Race | 88 | 10.8% |
| Total | 815 | 100.0% |
Ancestry in Queenstown
The most populous ancestries reported in Queenstown are Irish (151 | 18.5%), South American (126 | 15.5%), Peruvian (119 | 14.6%), Central American (97 | 11.9%), and Guatemalan (97 | 11.9%), together accounting for 72.4% of all Queenstown residents.
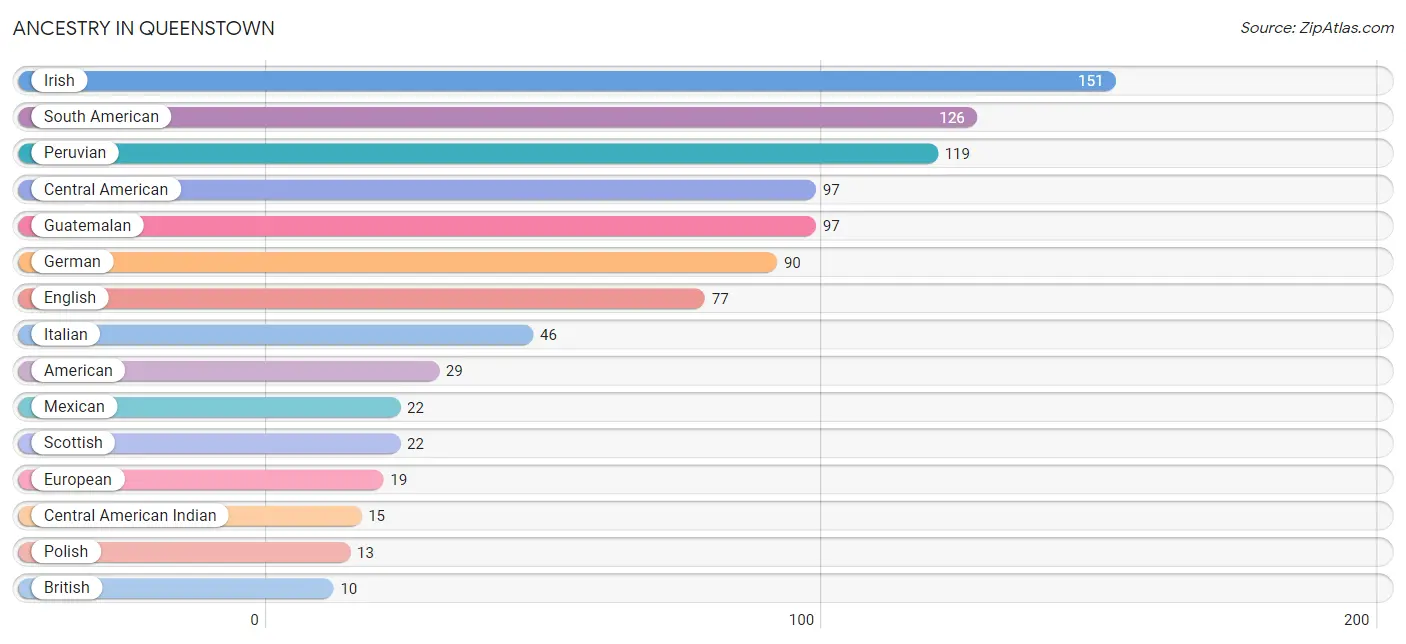
| Ancestry | # Population | % Population |
| American | 29 | 3.6% |
| British | 10 | 1.2% |
| Central American | 97 | 11.9% |
| Central American Indian | 15 | 1.8% |
| Chilean | 4 | 0.5% |
| Colombian | 3 | 0.4% |
| Dutch | 9 | 1.1% |
| Eastern European | 2 | 0.3% |
| English | 77 | 9.5% |
| European | 19 | 2.3% |
| French | 8 | 1.0% |
| German | 90 | 11.0% |
| Greek | 6 | 0.7% |
| Guatemalan | 97 | 11.9% |
| Hungarian | 6 | 0.7% |
| Irish | 151 | 18.5% |
| Italian | 46 | 5.6% |
| Korean | 8 | 1.0% |
| Latvian | 2 | 0.3% |
| Mexican | 22 | 2.7% |
| Northern European | 6 | 0.7% |
| Norwegian | 3 | 0.4% |
| Peruvian | 119 | 14.6% |
| Polish | 13 | 1.6% |
| Puerto Rican | 5 | 0.6% |
| Scandinavian | 3 | 0.4% |
| Scotch-Irish | 6 | 0.7% |
| Scottish | 22 | 2.7% |
| South American | 126 | 15.5% |
| Swiss | 5 | 0.6% |
| Ukrainian | 3 | 0.4% |
| Welsh | 1 | 0.1% | View All 32 Rows |
Immigrants in Queenstown
The most numerous immigrant groups reported in Queenstown came from Latin America (85 | 10.4%), Central America (54 | 6.6%), Guatemala (40 | 4.9%), South America (31 | 3.8%), and Peru (24 | 2.9%), together accounting for 28.7% of all Queenstown residents.
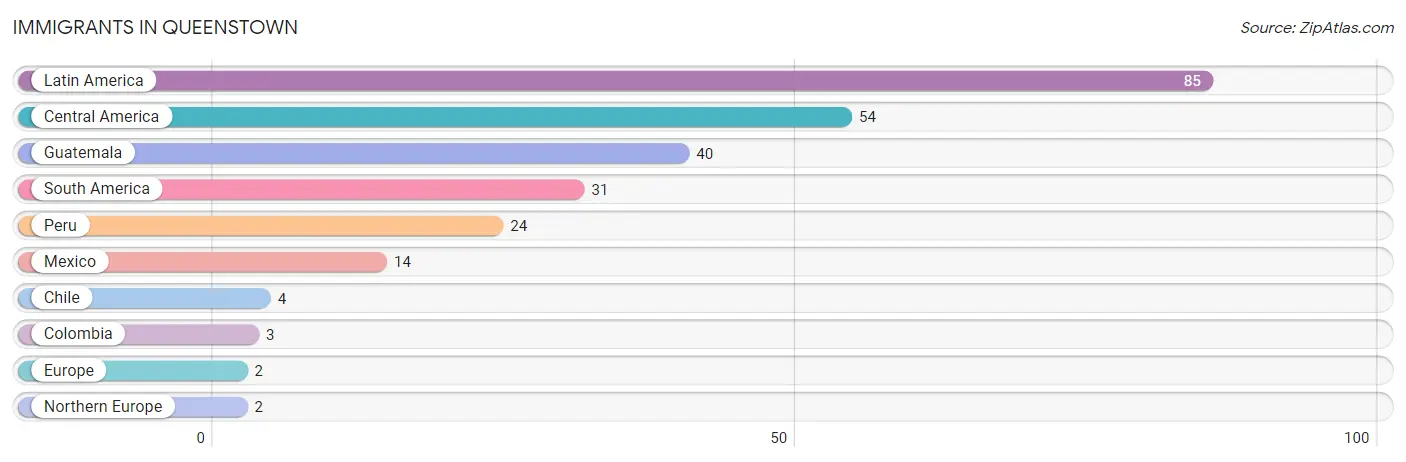
| Immigration Origin | # Population | % Population |
| Central America | 54 | 6.6% |
| Chile | 4 | 0.5% |
| Colombia | 3 | 0.4% |
| Europe | 2 | 0.3% |
| Guatemala | 40 | 4.9% |
| Latin America | 85 | 10.4% |
| Mexico | 14 | 1.7% |
| Northern Europe | 2 | 0.3% |
| Peru | 24 | 2.9% |
| South America | 31 | 3.8% | View All 10 Rows |
Sex and Age in Queenstown
Sex and Age in Queenstown
The most populous age groups in Queenstown are 35 to 39 Years (76 | 21.6%) for men and Under 5 Years (85 | 18.3%) for women.
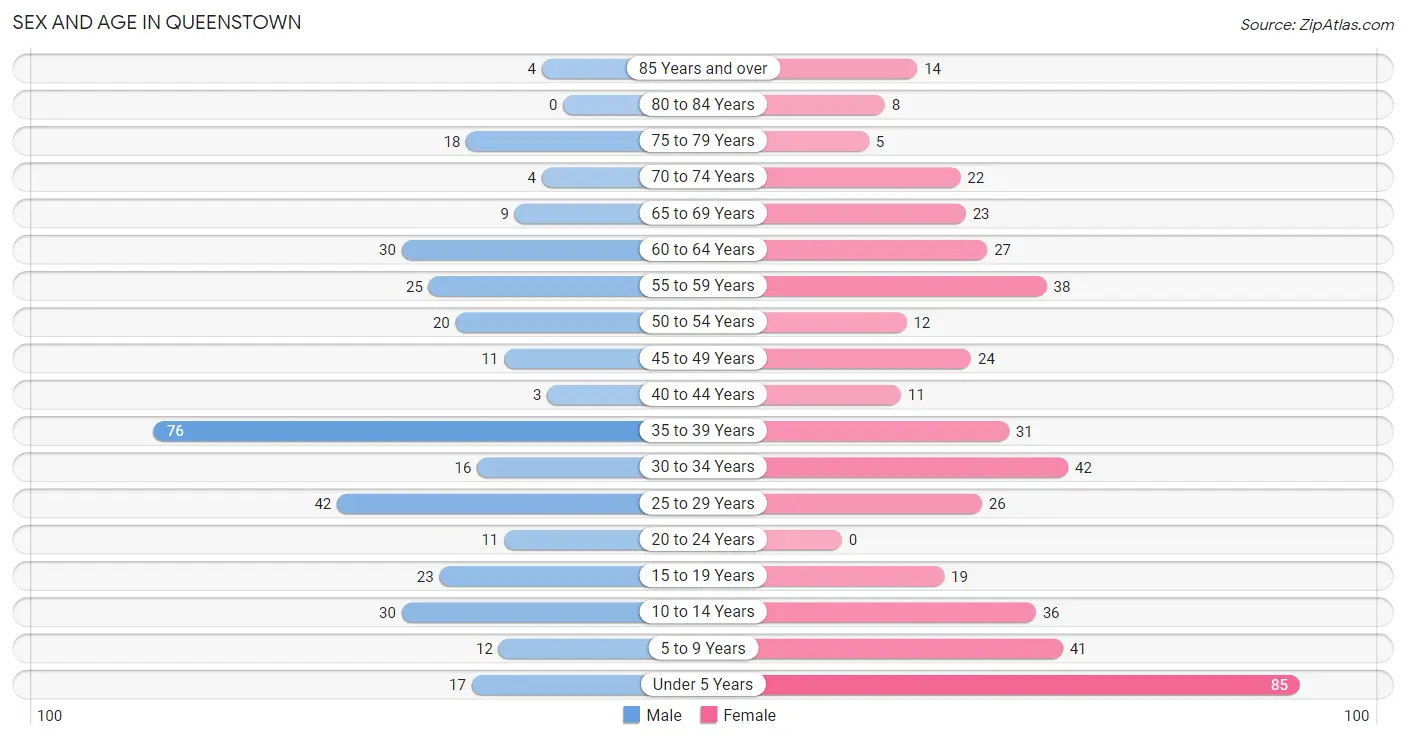
| Age Bracket | Male | Female |
| Under 5 Years | 17 (4.8%) | 85 (18.3%) |
| 5 to 9 Years | 12 (3.4%) | 41 (8.8%) |
| 10 to 14 Years | 30 (8.6%) | 36 (7.8%) |
| 15 to 19 Years | 23 (6.6%) | 19 (4.1%) |
| 20 to 24 Years | 11 (3.1%) | 0 (0.0%) |
| 25 to 29 Years | 42 (12.0%) | 26 (5.6%) |
| 30 to 34 Years | 16 (4.6%) | 42 (9.0%) |
| 35 to 39 Years | 76 (21.6%) | 31 (6.7%) |
| 40 to 44 Years | 3 (0.9%) | 11 (2.4%) |
| 45 to 49 Years | 11 (3.1%) | 24 (5.2%) |
| 50 to 54 Years | 20 (5.7%) | 12 (2.6%) |
| 55 to 59 Years | 25 (7.1%) | 38 (8.2%) |
| 60 to 64 Years | 30 (8.6%) | 27 (5.8%) |
| 65 to 69 Years | 9 (2.6%) | 23 (5.0%) |
| 70 to 74 Years | 4 (1.1%) | 22 (4.7%) |
| 75 to 79 Years | 18 (5.1%) | 5 (1.1%) |
| 80 to 84 Years | 0 (0.0%) | 8 (1.7%) |
| 85 Years and over | 4 (1.1%) | 14 (3.0%) |
| Total | 351 (100.0%) | 464 (100.0%) |
Families and Households in Queenstown
Median Family Size in Queenstown
The median family size in Queenstown is 3.50 persons per family, with single female/mother families (13 | 7.1%) accounting for the largest median family size of 6.23 persons per family. On the other hand, married-couple families (137 | 74.9%) represent the smallest median family size with 3.28 persons per family.
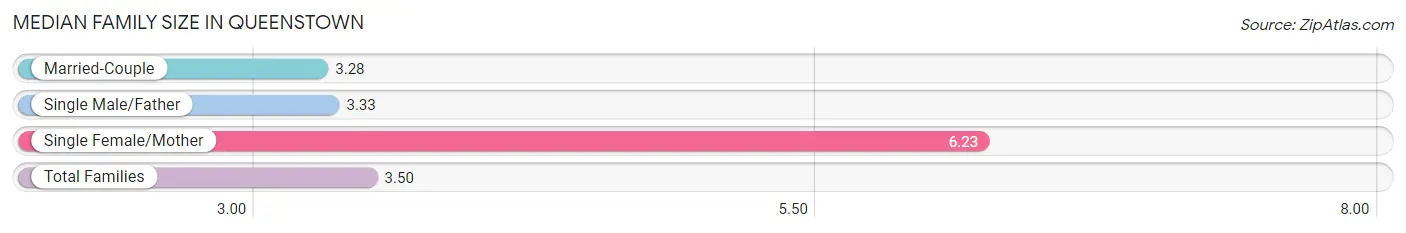
| Family Type | # Families | Family Size |
| Married-Couple | 137 (74.9%) | 3.28 |
| Single Male/Father | 33 (18.0%) | 3.33 |
| Single Female/Mother | 13 (7.1%) | 6.23 |
| Total Families | 183 (100.0%) | 3.50 |
Median Household Size in Queenstown
The median household size in Queenstown is 2.99 persons per household, with single female/mother households (13 | 4.8%) accounting for the largest median household size of 6.46 persons per household. non-family households (90 | 33.0%) represent the smallest median household size with 1.44 persons per household.
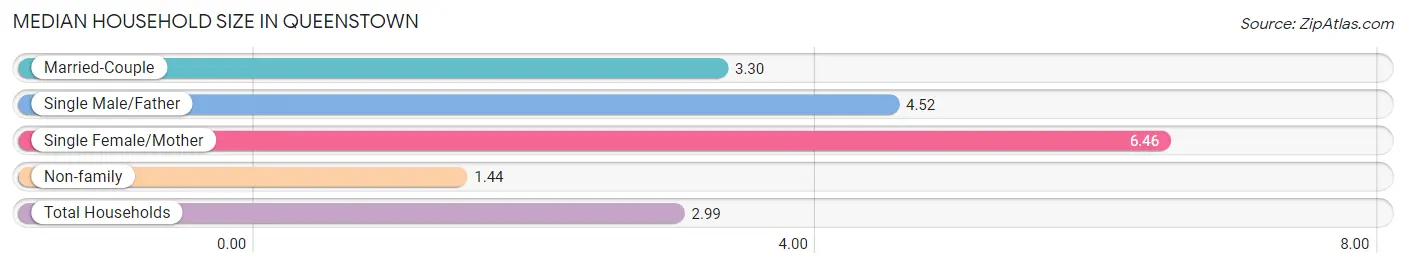
| Household Type | # Households | Household Size |
| Married-Couple | 137 (50.2%) | 3.30 |
| Single Male/Father | 33 (12.1%) | 4.52 |
| Single Female/Mother | 13 (4.8%) | 6.46 |
| Non-family | 90 (33.0%) | 1.44 |
| Total Households | 273 (100.0%) | 2.99 |
Household Size by Marriage Status in Queenstown
Out of a total of 273 households in Queenstown, 183 (67.0%) are family households, while 90 (33.0%) are nonfamily households. The most numerous type of family households are 2-person households, comprising 80, and the most common type of nonfamily households are 1-person households, comprising 68.
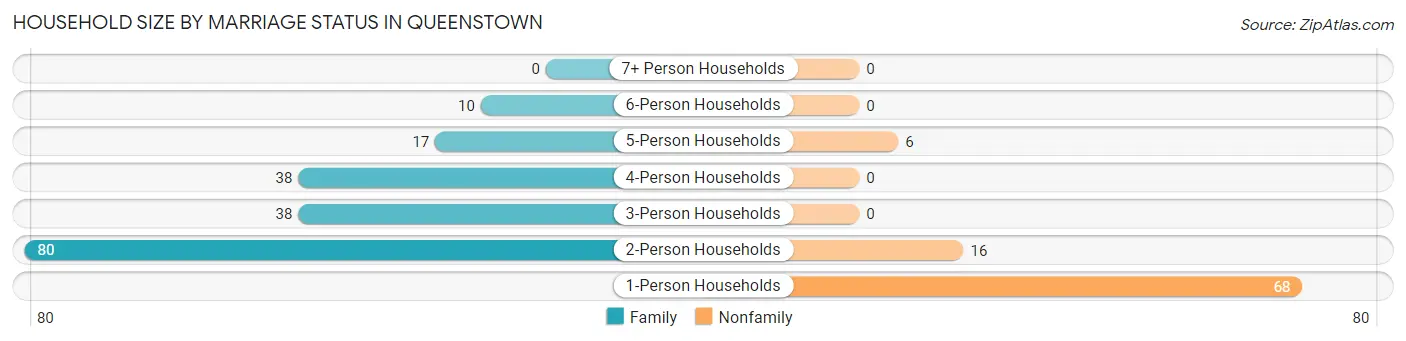
| Household Size | Family Households | Nonfamily Households |
| 1-Person Households | - | 68 (24.9%) |
| 2-Person Households | 80 (29.3%) | 16 (5.9%) |
| 3-Person Households | 38 (13.9%) | 0 (0.0%) |
| 4-Person Households | 38 (13.9%) | 0 (0.0%) |
| 5-Person Households | 17 (6.2%) | 6 (2.2%) |
| 6-Person Households | 10 (3.7%) | 0 (0.0%) |
| 7+ Person Households | 0 (0.0%) | 0 (0.0%) |
| Total | 183 (67.0%) | 90 (33.0%) |
Female Fertility in Queenstown
Fertility by Age in Queenstown
Average fertility rate in Queenstown is 39.0 births per 1,000 women. Women in the age bracket of 20 to 34 years have the highest fertility rate with 88.0 births per 1,000 women. Women in the age bracket of 20 to 34 years acount for 100.0% of all women with births.
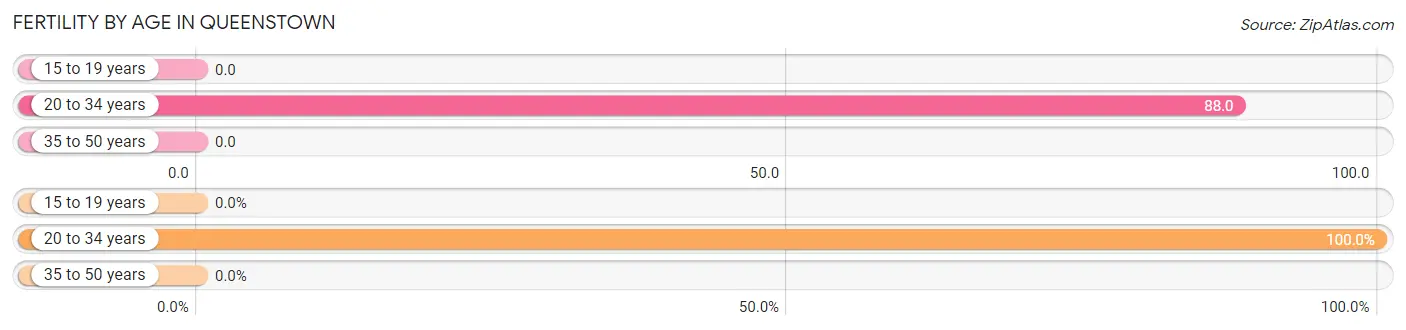
| Age Bracket | Women with Births | Births / 1,000 Women |
| 15 to 19 years | 0 (0.0%) | 0.0 |
| 20 to 34 years | 6 (100.0%) | 88.0 |
| 35 to 50 years | 0 (0.0%) | 0.0 |
| Total | 6 (100.0%) | 39.0 |
Fertility by Age by Marriage Status in Queenstown
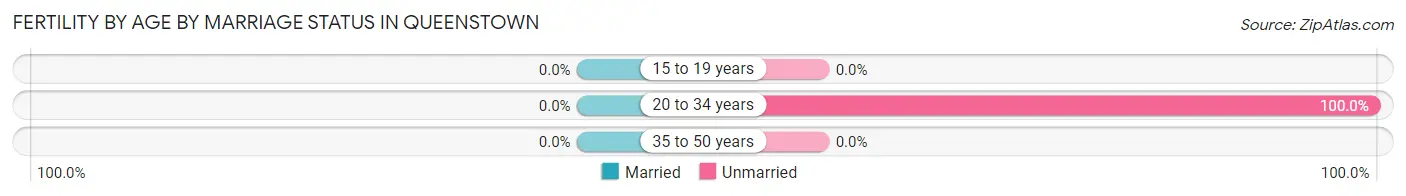
| Age Bracket | Married | Unmarried |
| 15 to 19 years | 0 (0.0%) | 0 (0.0%) |
| 20 to 34 years | 0 (0.0%) | 6 (100.0%) |
| 35 to 50 years | 0 (0.0%) | 0 (0.0%) |
| Total | 0 (0.0%) | 6 (100.0%) |
Fertility by Education in Queenstown
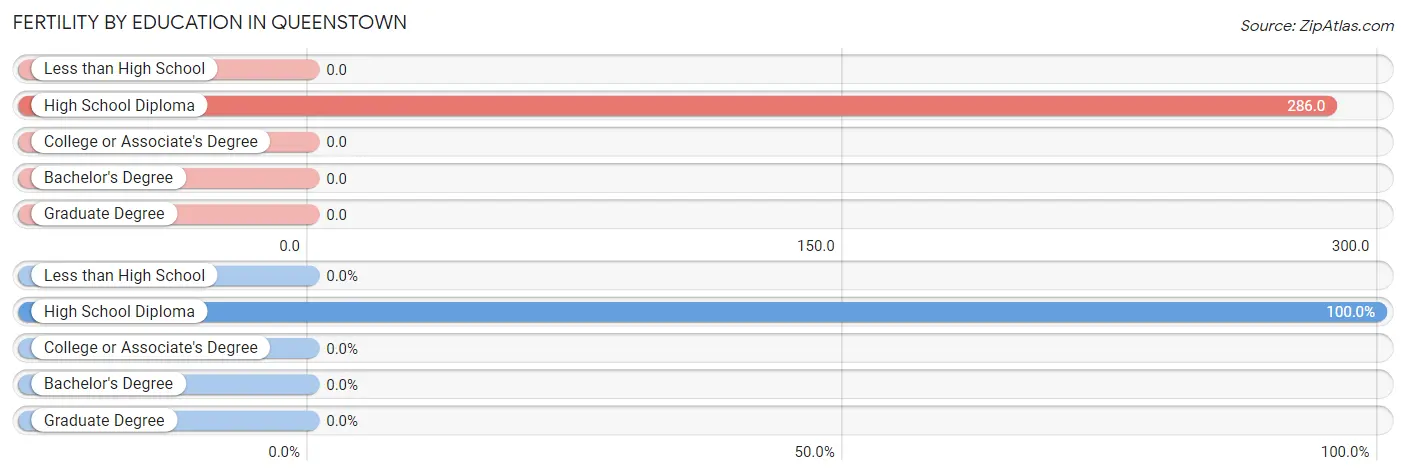
| Educational Attainment | Women with Births | Births / 1,000 Women |
| Less than High School | 0 (0.0%) | 0.0 |
| High School Diploma | 6 (100.0%) | 286.0 |
| College or Associate's Degree | 0 (0.0%) | 0.0 |
| Bachelor's Degree | 0 (0.0%) | 0.0 |
| Graduate Degree | 0 (0.0%) | 0.0 |
| Total | 6 (100.0%) | 39.0 |
Fertility by Education by Marriage Status in Queenstown
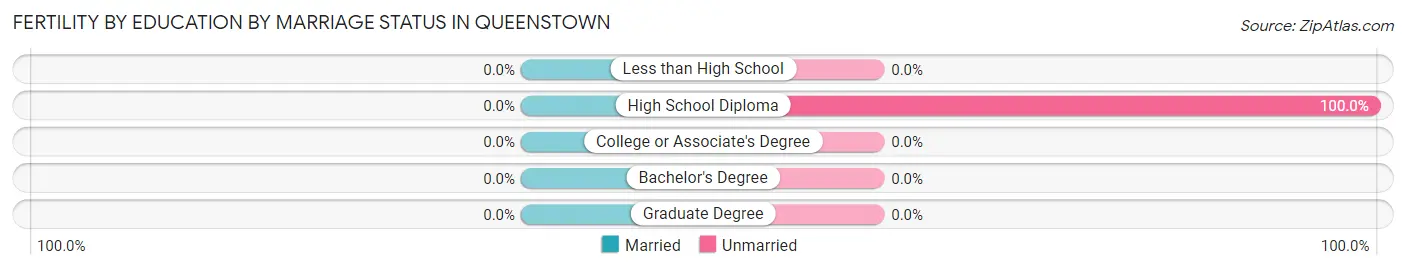
| Educational Attainment | Married | Unmarried |
| Less than High School | 0 (0.0%) | 0 (0.0%) |
| High School Diploma | 0 (0.0%) | 6 (100.0%) |
| College or Associate's Degree | 0 (0.0%) | 0 (0.0%) |
| Bachelor's Degree | 0 (0.0%) | 0 (0.0%) |
| Graduate Degree | 0 (0.0%) | 0 (0.0%) |
| Total | 0 (0.0%) | 6 (100.0%) |
Employment Characteristics in Queenstown
Employment by Class of Employer in Queenstown
Among the 334 employed individuals in Queenstown, private company employees (182 | 54.5%), self-employed (not incorporated) (42 | 12.6%), and local government employees (32 | 9.6%) make up the most common classes of employment.
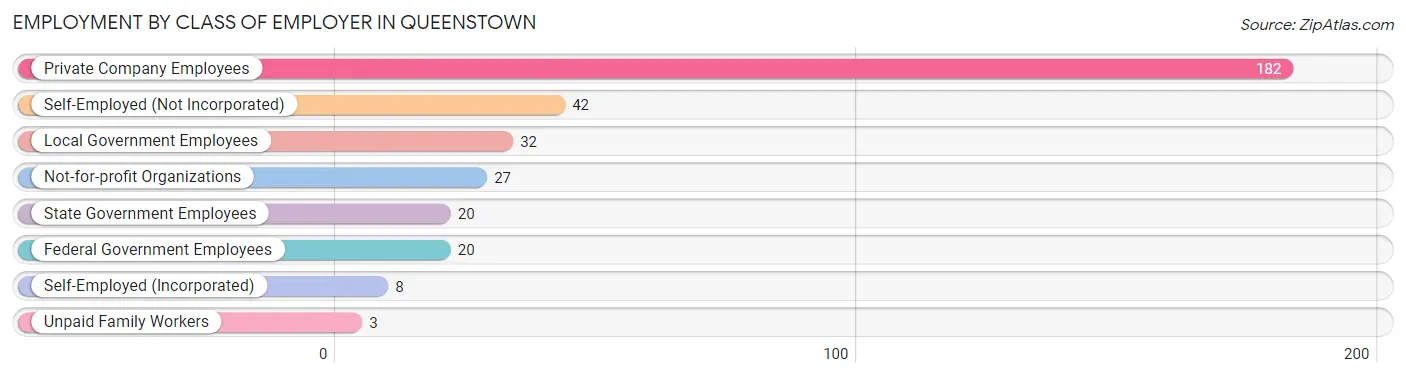
| Employer Class | # Employees | % Employees |
| Private Company Employees | 182 | 54.5% |
| Self-Employed (Incorporated) | 8 | 2.4% |
| Self-Employed (Not Incorporated) | 42 | 12.6% |
| Not-for-profit Organizations | 27 | 8.1% |
| Local Government Employees | 32 | 9.6% |
| State Government Employees | 20 | 6.0% |
| Federal Government Employees | 20 | 6.0% |
| Unpaid Family Workers | 3 | 0.9% |
| Total | 334 | 100.0% |
Employment Status by Age in Queenstown
According to the labor force statistics for Queenstown, out of the total population over 16 years of age (584), 69.3% or 405 individuals are in the labor force, with 4.2% or 17 of them unemployed. The age group with the highest labor force participation rate is 20 to 24 years, with 100.0% or 11 individuals in the labor force. Within the labor force, the 20 to 24 years age range has the highest percentage of unemployed individuals, with 81.8% or 9 of them being unemployed.
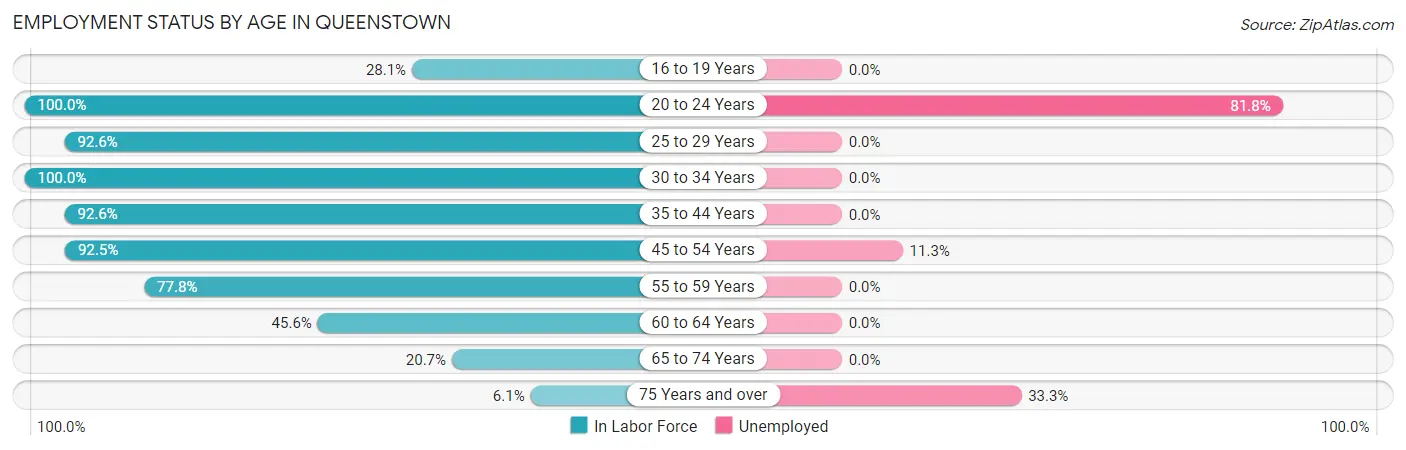
| Age Bracket | In Labor Force | Unemployed |
| 16 to 19 Years | 9 (28.1%) | 0 (0.0%) |
| 20 to 24 Years | 11 (100.0%) | 9 (81.8%) |
| 25 to 29 Years | 63 (92.6%) | 0 (0.0%) |
| 30 to 34 Years | 58 (100.0%) | 0 (0.0%) |
| 35 to 44 Years | 112 (92.6%) | 0 (0.0%) |
| 45 to 54 Years | 62 (92.5%) | 7 (11.3%) |
| 55 to 59 Years | 49 (77.8%) | 0 (0.0%) |
| 60 to 64 Years | 26 (45.6%) | 0 (0.0%) |
| 65 to 74 Years | 12 (20.7%) | 0 (0.0%) |
| 75 Years and over | 3 (6.1%) | 1 (33.3%) |
| Total | 405 (69.3%) | 17 (4.2%) |
Employment Status by Educational Attainment in Queenstown
According to labor force statistics for Queenstown, 85.3% of individuals (370) out of the total population between 25 and 64 years of age (434) are in the labor force, with 1.9% or 7 of them being unemployed. The group with the highest labor force participation rate are those with the educational attainment of bachelor's degree or higher, with 92.8% or 155 individuals in the labor force. Within the labor force, individuals with bachelor's degree or higher education have the highest percentage of unemployment, with 4.5% or 7 of them being unemployed.
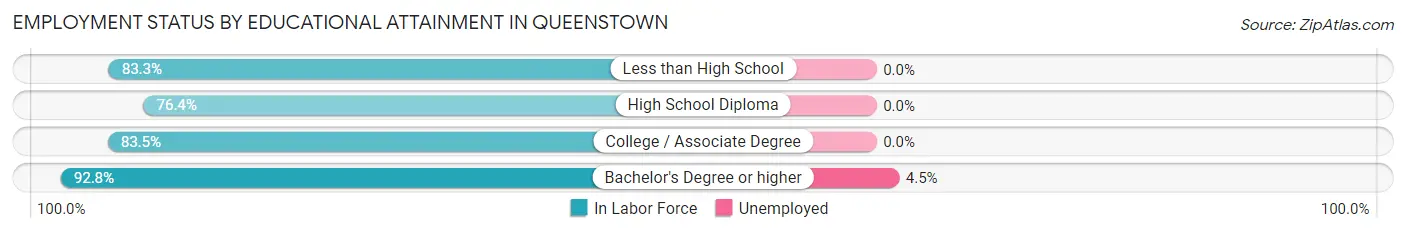
| Educational Attainment | In Labor Force | Unemployed |
| Less than High School | 40 (83.3%) | 0 (0.0%) |
| High School Diploma | 84 (76.4%) | 0 (0.0%) |
| College / Associate Degree | 91 (83.5%) | 0 (0.0%) |
| Bachelor's Degree or higher | 155 (92.8%) | 8 (4.5%) |
| Total | 370 (85.3%) | 8 (1.9%) |
Employment Occupations by Sex in Queenstown
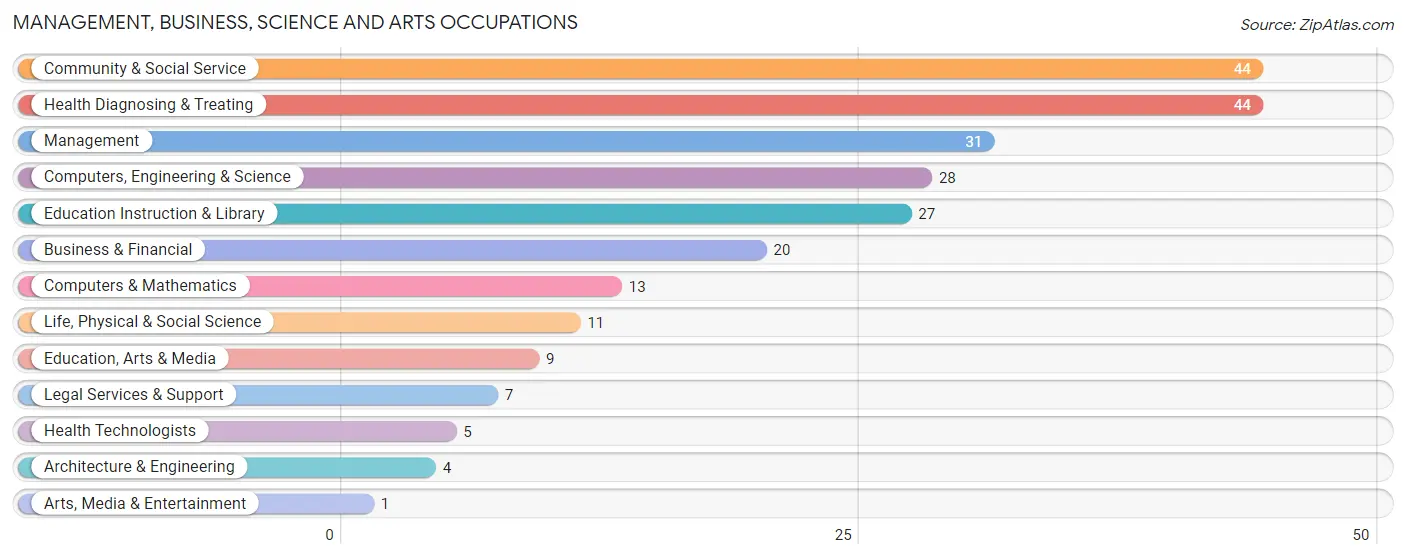
Management, Business, Science and Arts Occupations
The most common Management, Business, Science and Arts occupations in Queenstown are Community & Social Service (44 | 11.3%), Health Diagnosing & Treating (44 | 11.3%), Management (31 | 8.0%), Computers, Engineering & Science (28 | 7.2%), and Education Instruction & Library (27 | 7.0%).
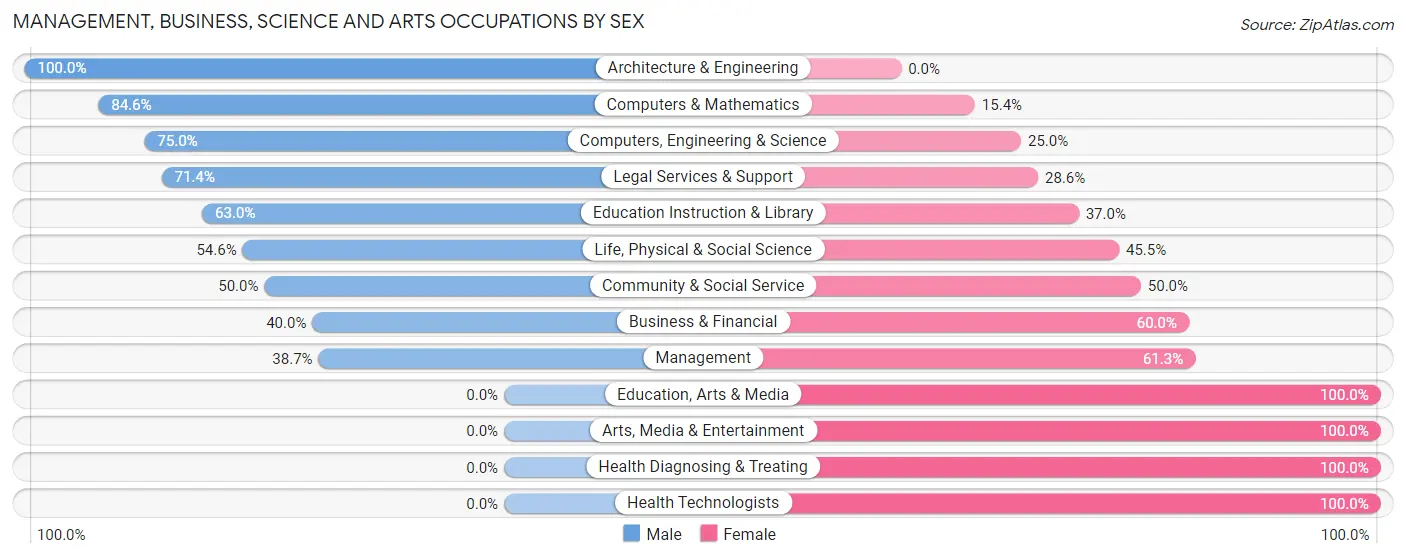
Management, Business, Science and Arts Occupations by Sex
Within the Management, Business, Science and Arts occupations in Queenstown, the most male-oriented occupations are Architecture & Engineering (100.0%), Computers & Mathematics (84.6%), and Computers, Engineering & Science (75.0%), while the most female-oriented occupations are Education, Arts & Media (100.0%), Arts, Media & Entertainment (100.0%), and Health Diagnosing & Treating (100.0%).
| Occupation | Male | Female |
| Management | 12 (38.7%) | 19 (61.3%) |
| Business & Financial | 8 (40.0%) | 12 (60.0%) |
| Computers, Engineering & Science | 21 (75.0%) | 7 (25.0%) |
| Computers & Mathematics | 11 (84.6%) | 2 (15.4%) |
| Architecture & Engineering | 4 (100.0%) | 0 (0.0%) |
| Life, Physical & Social Science | 6 (54.5%) | 5 (45.5%) |
| Community & Social Service | 22 (50.0%) | 22 (50.0%) |
| Education, Arts & Media | 0 (0.0%) | 9 (100.0%) |
| Legal Services & Support | 5 (71.4%) | 2 (28.6%) |
| Education Instruction & Library | 17 (63.0%) | 10 (37.0%) |
| Arts, Media & Entertainment | 0 (0.0%) | 1 (100.0%) |
| Health Diagnosing & Treating | 0 (0.0%) | 44 (100.0%) |
| Health Technologists | 0 (0.0%) | 5 (100.0%) |
| Total (Category) | 63 (37.7%) | 104 (62.3%) |
| Total (Overall) | 215 (55.4%) | 173 (44.6%) |
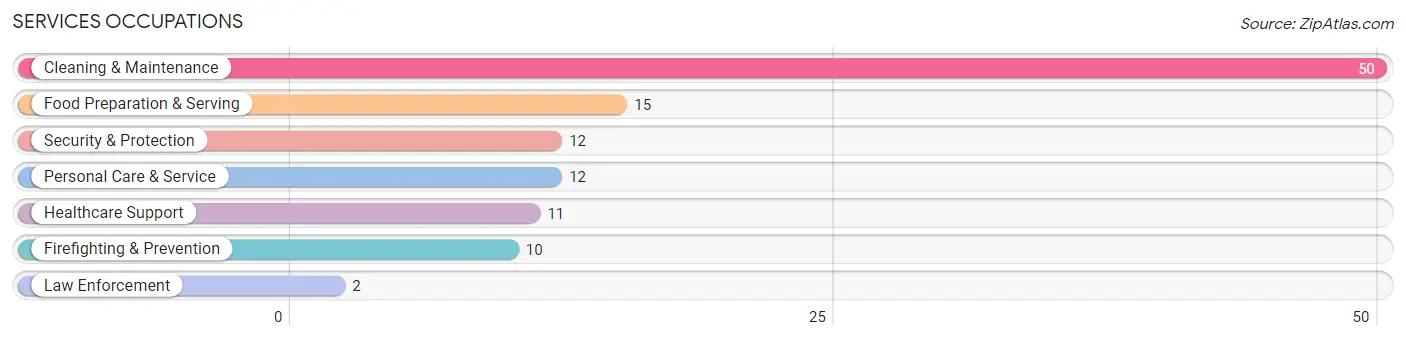
Services Occupations
The most common Services occupations in Queenstown are Cleaning & Maintenance (50 | 12.9%), Food Preparation & Serving (15 | 3.9%), Security & Protection (12 | 3.1%), Personal Care & Service (12 | 3.1%), and Healthcare Support (11 | 2.8%).
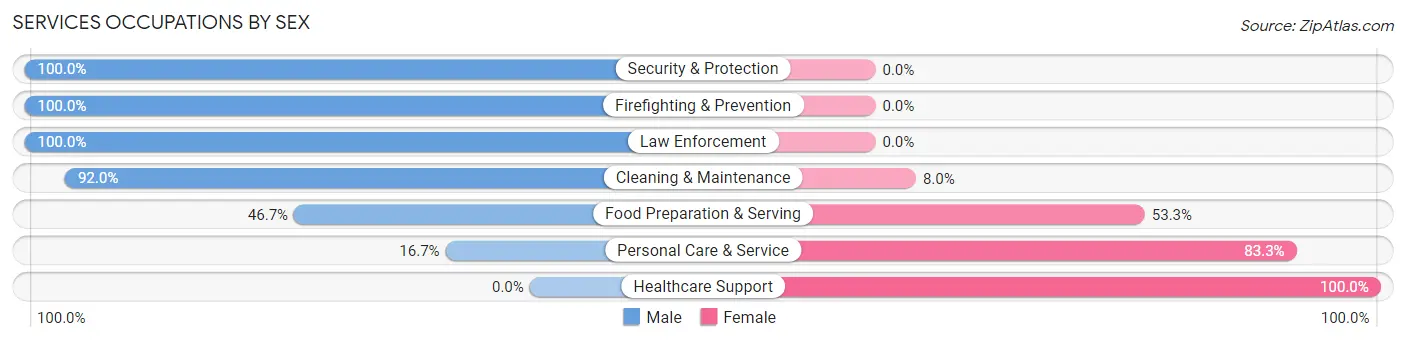
Services Occupations by Sex
Within the Services occupations in Queenstown, the most male-oriented occupations are Security & Protection (100.0%), Firefighting & Prevention (100.0%), and Law Enforcement (100.0%), while the most female-oriented occupations are Healthcare Support (100.0%), Personal Care & Service (83.3%), and Food Preparation & Serving (53.3%).
| Occupation | Male | Female |
| Healthcare Support | 0 (0.0%) | 11 (100.0%) |
| Security & Protection | 12 (100.0%) | 0 (0.0%) |
| Firefighting & Prevention | 10 (100.0%) | 0 (0.0%) |
| Law Enforcement | 2 (100.0%) | 0 (0.0%) |
| Food Preparation & Serving | 7 (46.7%) | 8 (53.3%) |
| Cleaning & Maintenance | 46 (92.0%) | 4 (8.0%) |
| Personal Care & Service | 2 (16.7%) | 10 (83.3%) |
| Total (Category) | 67 (67.0%) | 33 (33.0%) |
| Total (Overall) | 215 (55.4%) | 173 (44.6%) |
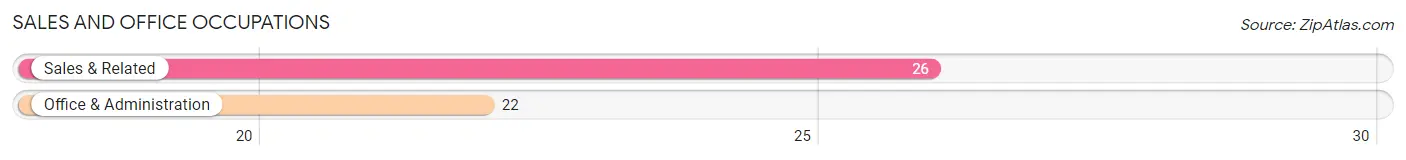
Sales and Office Occupations
The most common Sales and Office occupations in Queenstown are Sales & Related (26 | 6.7%), and Office & Administration (22 | 5.7%).
Sales and Office Occupations by Sex
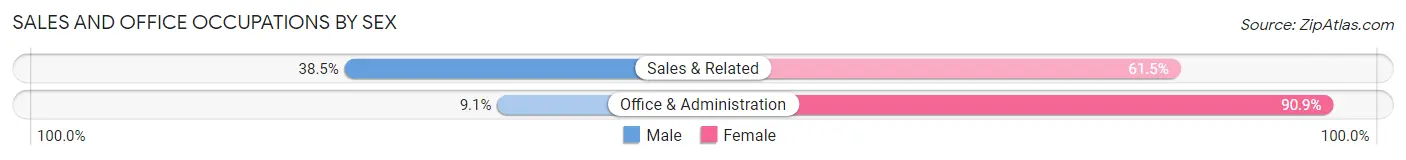
| Occupation | Male | Female |
| Sales & Related | 10 (38.5%) | 16 (61.5%) |
| Office & Administration | 2 (9.1%) | 20 (90.9%) |
| Total (Category) | 12 (25.0%) | 36 (75.0%) |
| Total (Overall) | 215 (55.4%) | 173 (44.6%) |
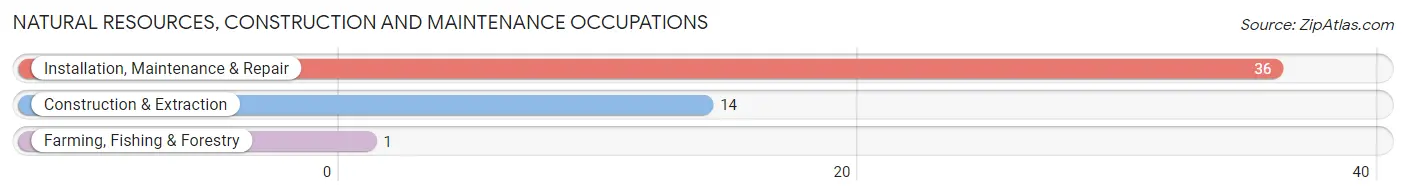
Natural Resources, Construction and Maintenance Occupations
The most common Natural Resources, Construction and Maintenance occupations in Queenstown are Installation, Maintenance & Repair (36 | 9.3%), Construction & Extraction (14 | 3.6%), and Farming, Fishing & Forestry (1 | 0.3%).
Natural Resources, Construction and Maintenance Occupations by Sex
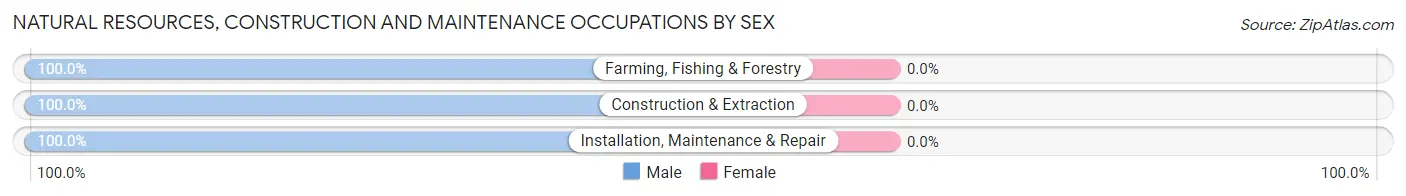
| Occupation | Male | Female |
| Farming, Fishing & Forestry | 1 (100.0%) | 0 (0.0%) |
| Construction & Extraction | 14 (100.0%) | 0 (0.0%) |
| Installation, Maintenance & Repair | 36 (100.0%) | 0 (0.0%) |
| Total (Category) | 51 (100.0%) | 0 (0.0%) |
| Total (Overall) | 215 (55.4%) | 173 (44.6%) |
Production, Transportation and Moving Occupations
The most common Production, Transportation and Moving occupations in Queenstown are Transportation (12 | 3.1%), Production (7 | 1.8%), and Material Moving (3 | 0.8%).
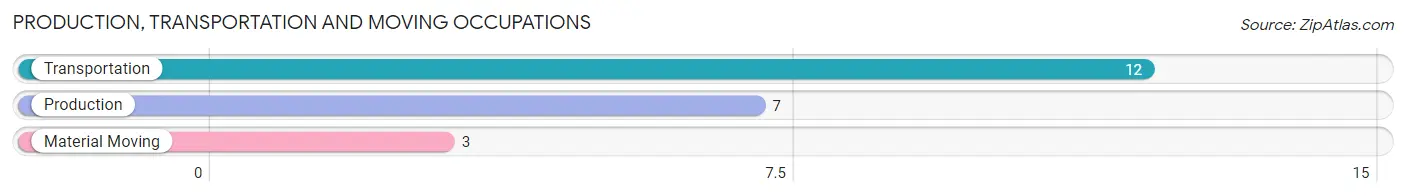
Production, Transportation and Moving Occupations by Sex
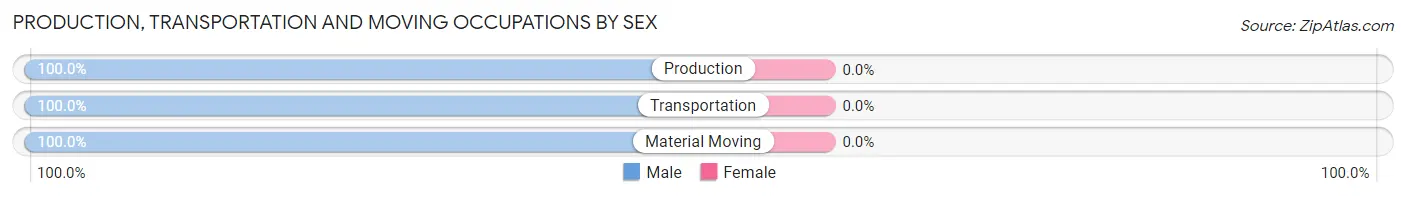
| Occupation | Male | Female |
| Production | 7 (100.0%) | 0 (0.0%) |
| Transportation | 12 (100.0%) | 0 (0.0%) |
| Material Moving | 3 (100.0%) | 0 (0.0%) |
| Total (Category) | 22 (100.0%) | 0 (0.0%) |
| Total (Overall) | 215 (55.4%) | 173 (44.6%) |
Employment Industries by Sex in Queenstown
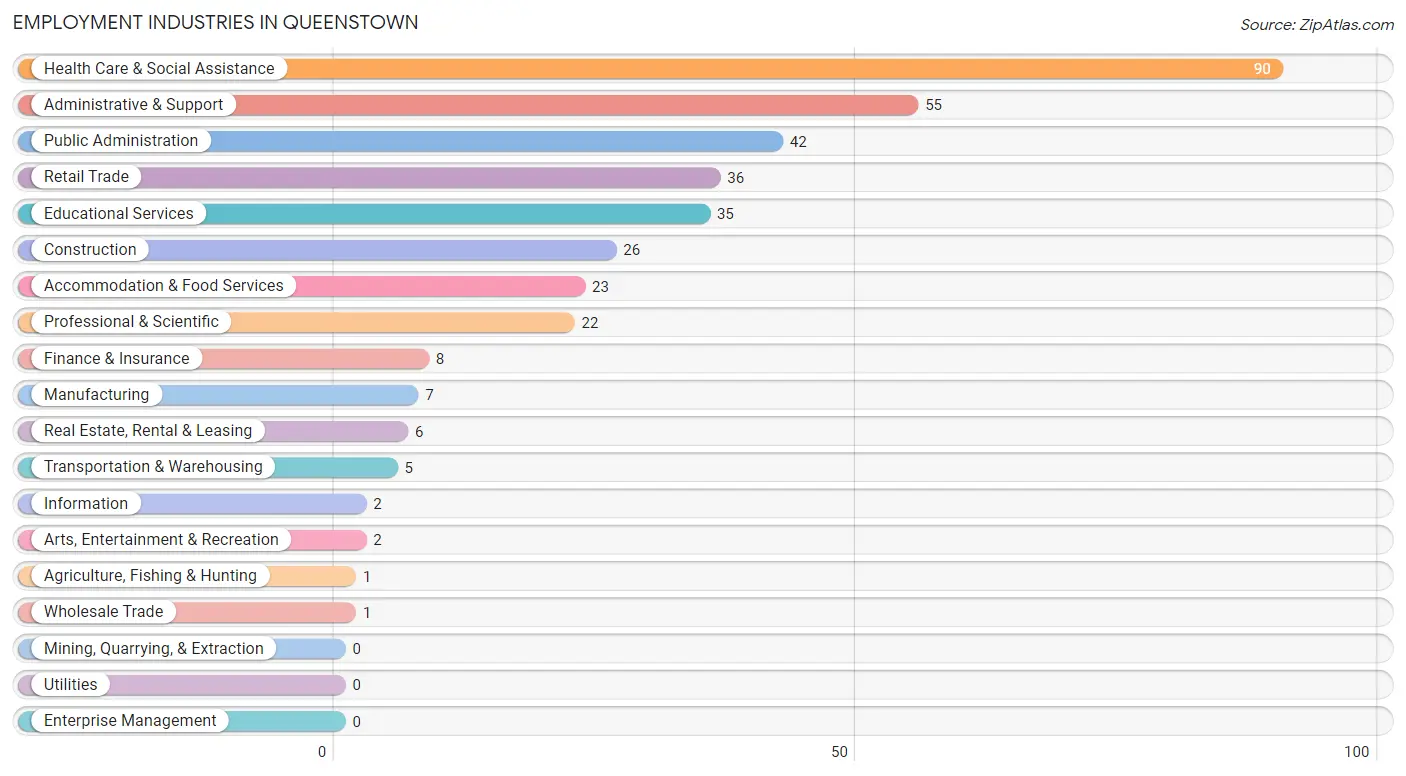
Employment Industries in Queenstown
The major employment industries in Queenstown include Health Care & Social Assistance (90 | 23.2%), Administrative & Support (55 | 14.2%), Public Administration (42 | 10.8%), Retail Trade (36 | 9.3%), and Educational Services (35 | 9.0%).
Employment Industries by Sex in Queenstown
The Queenstown industries that see more men than women are Agriculture, Fishing & Hunting (100.0%), Manufacturing (100.0%), and Wholesale Trade (100.0%), whereas the industries that tend to have a higher number of women are Arts, Entertainment & Recreation (100.0%), Health Care & Social Assistance (70.0%), and Accommodation & Food Services (60.9%).
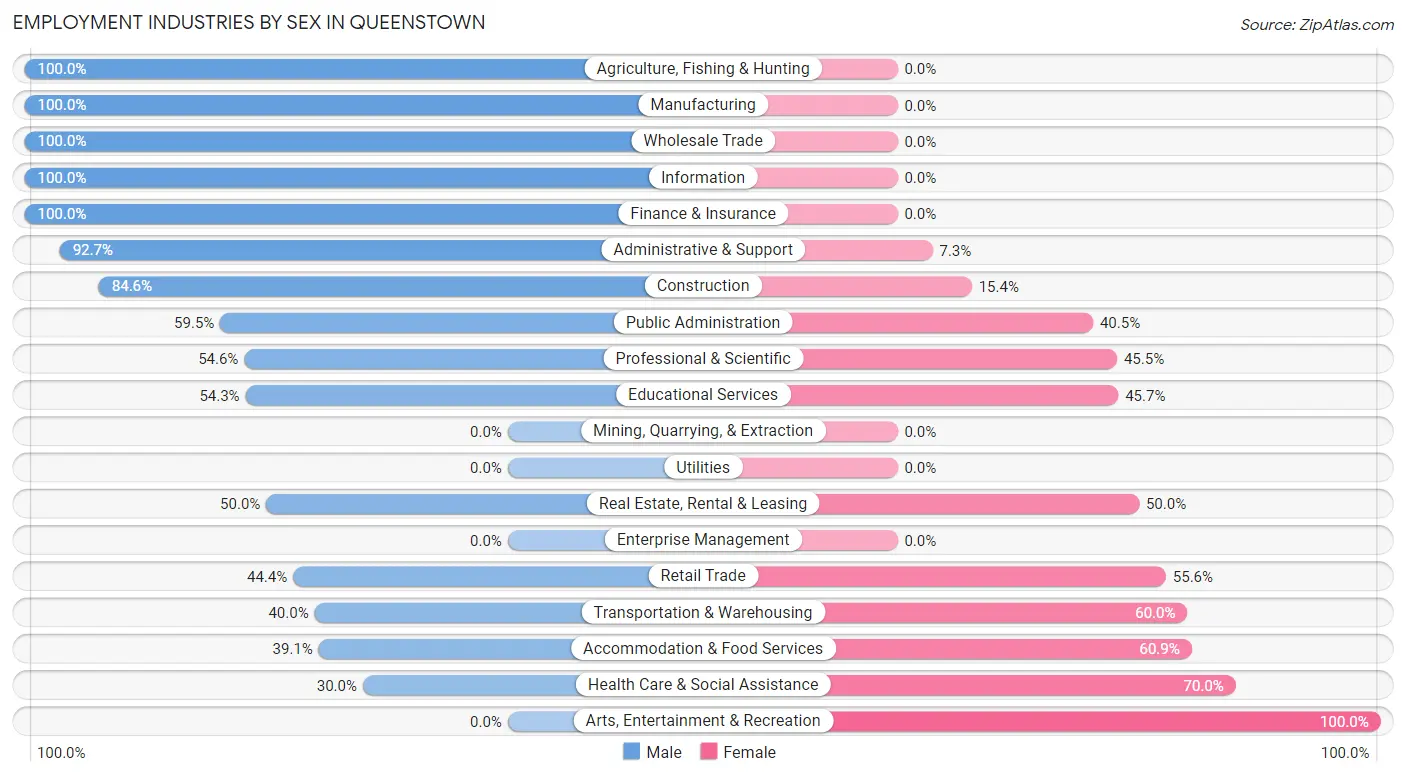
| Industry | Male | Female |
| Agriculture, Fishing & Hunting | 1 (100.0%) | 0 (0.0%) |
| Mining, Quarrying, & Extraction | 0 (0.0%) | 0 (0.0%) |
| Construction | 22 (84.6%) | 4 (15.4%) |
| Manufacturing | 7 (100.0%) | 0 (0.0%) |
| Wholesale Trade | 1 (100.0%) | 0 (0.0%) |
| Retail Trade | 16 (44.4%) | 20 (55.6%) |
| Transportation & Warehousing | 2 (40.0%) | 3 (60.0%) |
| Utilities | 0 (0.0%) | 0 (0.0%) |
| Information | 2 (100.0%) | 0 (0.0%) |
| Finance & Insurance | 8 (100.0%) | 0 (0.0%) |
| Real Estate, Rental & Leasing | 3 (50.0%) | 3 (50.0%) |
| Professional & Scientific | 12 (54.5%) | 10 (45.5%) |
| Enterprise Management | 0 (0.0%) | 0 (0.0%) |
| Administrative & Support | 51 (92.7%) | 4 (7.3%) |
| Educational Services | 19 (54.3%) | 16 (45.7%) |
| Health Care & Social Assistance | 27 (30.0%) | 63 (70.0%) |
| Arts, Entertainment & Recreation | 0 (0.0%) | 2 (100.0%) |
| Accommodation & Food Services | 9 (39.1%) | 14 (60.9%) |
| Public Administration | 25 (59.5%) | 17 (40.5%) |
| Total | 215 (55.4%) | 173 (44.6%) |
Education in Queenstown
School Enrollment in Queenstown
The most common levels of schooling among the 174 students in Queenstown are middle school (58 | 33.3%), elementary school (43 | 24.7%), and high school (26 | 14.9%).
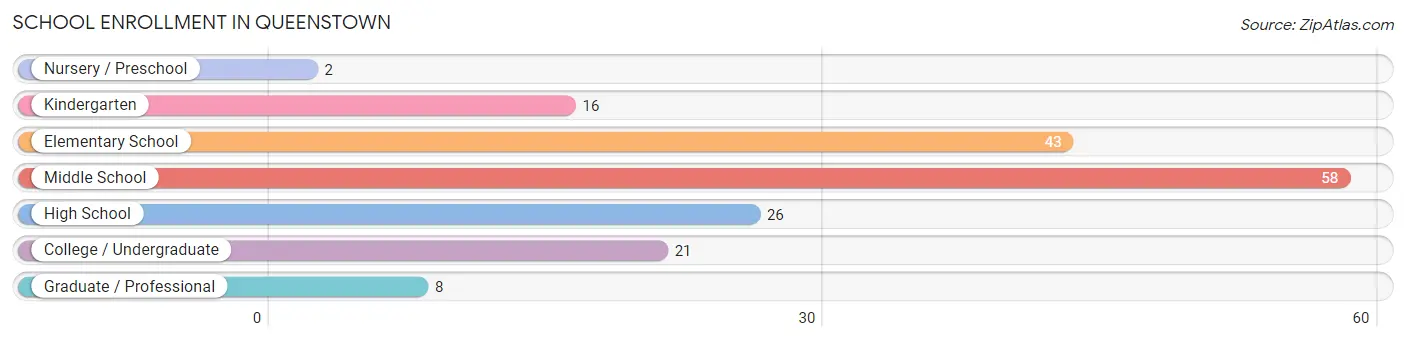
| School Level | # Students | % Students |
| Nursery / Preschool | 2 | 1.1% |
| Kindergarten | 16 | 9.2% |
| Elementary School | 43 | 24.7% |
| Middle School | 58 | 33.3% |
| High School | 26 | 14.9% |
| College / Undergraduate | 21 | 12.1% |
| Graduate / Professional | 8 | 4.6% |
| Total | 174 | 100.0% |
School Enrollment by Age by Funding Source in Queenstown
Out of a total of 174 students who are enrolled in schools in Queenstown, 31 (17.8%) attend a private institution, while the remaining 143 (82.2%) are enrolled in public schools. The age group of 3 to 4 year olds has the highest likelihood of being enrolled in private schools, with 2 (100.0% in the age bracket) enrolled. Conversely, the age group of 18 to 19 year olds has the lowest likelihood of being enrolled in a private school, with 12 (100.0% in the age bracket) attending a public institution.
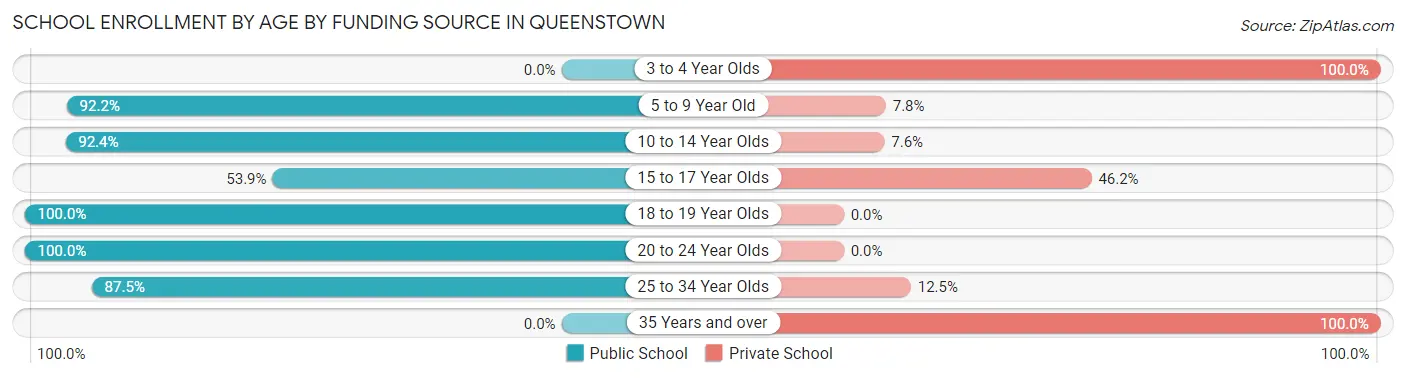
| Age Bracket | Public School | Private School |
| 3 to 4 Year Olds | 0 (0.0%) | 2 (100.0%) |
| 5 to 9 Year Old | 47 (92.2%) | 4 (7.8%) |
| 10 to 14 Year Olds | 61 (92.4%) | 5 (7.6%) |
| 15 to 17 Year Olds | 14 (53.8%) | 12 (46.2%) |
| 18 to 19 Year Olds | 12 (100.0%) | 0 (0.0%) |
| 20 to 24 Year Olds | 2 (100.0%) | 0 (0.0%) |
| 25 to 34 Year Olds | 7 (87.5%) | 1 (12.5%) |
| 35 Years and over | 0 (0.0%) | 7 (100.0%) |
| Total | 143 (82.2%) | 31 (17.8%) |
Educational Attainment by Field of Study in Queenstown
Bio, nature & agricultural (31 | 13.8%), business (31 | 13.8%), computers & mathematics (29 | 12.9%), education (29 | 12.9%), and social sciences (20 | 8.9%) are the most common fields of study among 225 individuals in Queenstown who have obtained a bachelor's degree or higher.
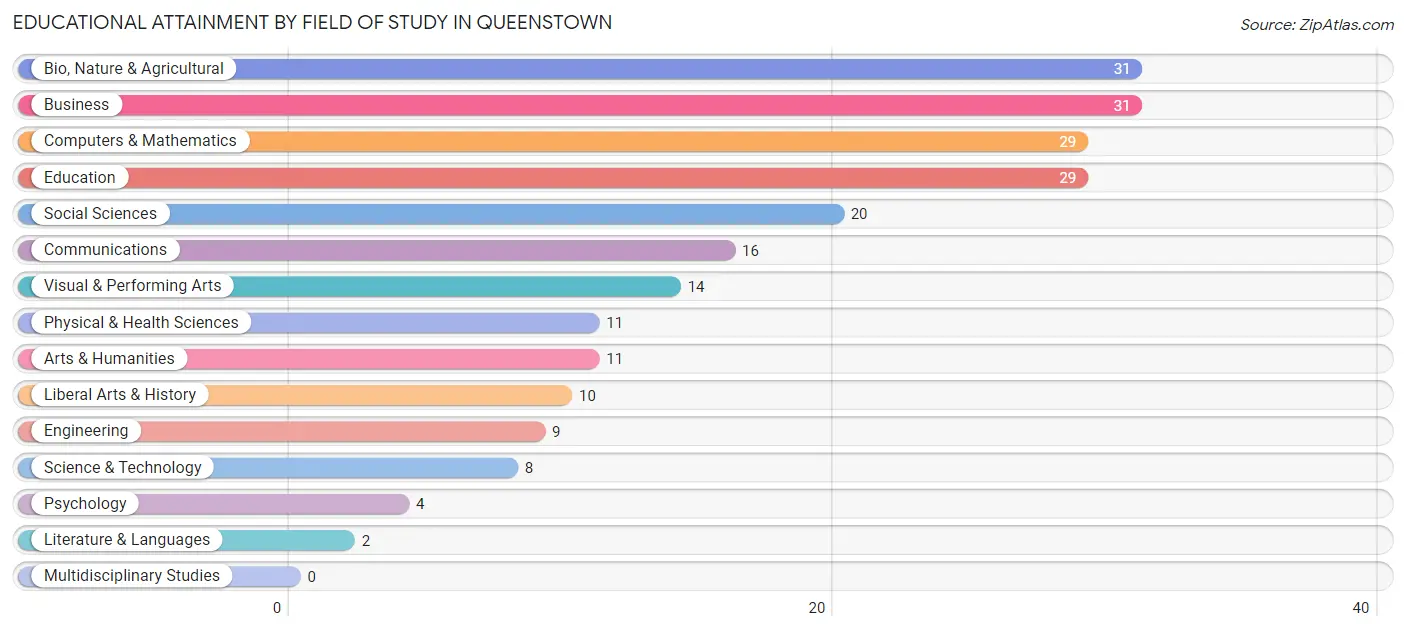
| Field of Study | # Graduates | % Graduates |
| Computers & Mathematics | 29 | 12.9% |
| Bio, Nature & Agricultural | 31 | 13.8% |
| Physical & Health Sciences | 11 | 4.9% |
| Psychology | 4 | 1.8% |
| Social Sciences | 20 | 8.9% |
| Engineering | 9 | 4.0% |
| Multidisciplinary Studies | 0 | 0.0% |
| Science & Technology | 8 | 3.6% |
| Business | 31 | 13.8% |
| Education | 29 | 12.9% |
| Literature & Languages | 2 | 0.9% |
| Liberal Arts & History | 10 | 4.4% |
| Visual & Performing Arts | 14 | 6.2% |
| Communications | 16 | 7.1% |
| Arts & Humanities | 11 | 4.9% |
| Total | 225 | 100.0% |
Transportation & Commute in Queenstown
Vehicle Availability by Sex in Queenstown
The most prevalent vehicle ownership categories in Queenstown are males with 2 vehicles (110, accounting for 55.6%) and females with 2 vehicles (68, making up 80.9%).
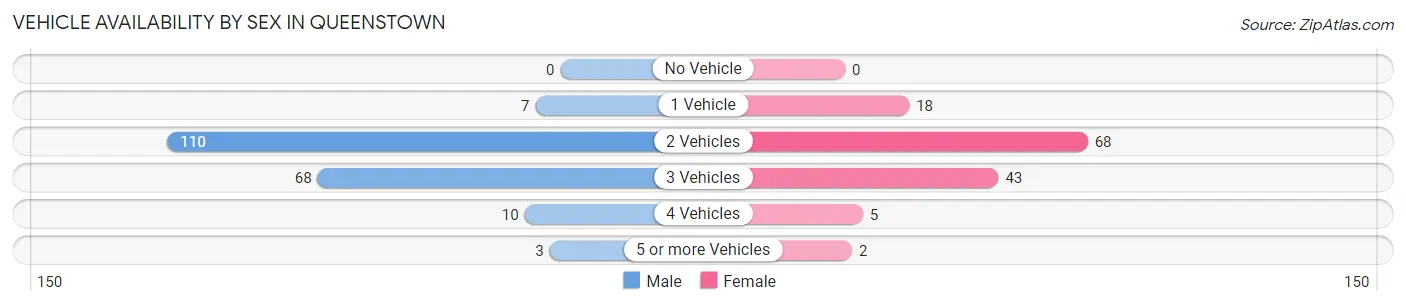
| Vehicles Available | Male | Female |
| No Vehicle | 0 (0.0%) | 0 (0.0%) |
| 1 Vehicle | 7 (3.5%) | 18 (13.2%) |
| 2 Vehicles | 110 (55.6%) | 68 (50.0%) |
| 3 Vehicles | 68 (34.3%) | 43 (31.6%) |
| 4 Vehicles | 10 (5.1%) | 5 (3.7%) |
| 5 or more Vehicles | 3 (1.5%) | 2 (1.5%) |
| Total | 198 (100.0%) | 136 (100.0%) |
Commute Time in Queenstown
The most frequently occuring commute durations in Queenstown are 25 to 29 minutes (56 commuters, 18.2%), 15 to 19 minutes (44 commuters, 14.3%), and 30 to 34 minutes (40 commuters, 13.0%).
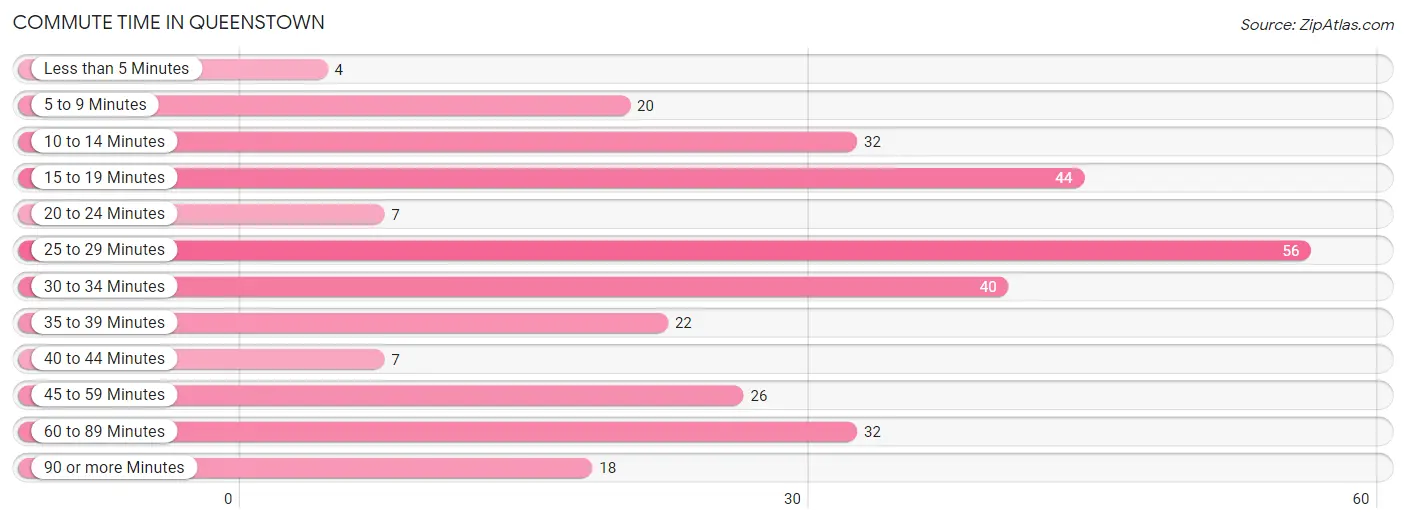
| Commute Time | # Commuters | % Commuters |
| Less than 5 Minutes | 4 | 1.3% |
| 5 to 9 Minutes | 20 | 6.5% |
| 10 to 14 Minutes | 32 | 10.4% |
| 15 to 19 Minutes | 44 | 14.3% |
| 20 to 24 Minutes | 7 | 2.3% |
| 25 to 29 Minutes | 56 | 18.2% |
| 30 to 34 Minutes | 40 | 13.0% |
| 35 to 39 Minutes | 22 | 7.1% |
| 40 to 44 Minutes | 7 | 2.3% |
| 45 to 59 Minutes | 26 | 8.4% |
| 60 to 89 Minutes | 32 | 10.4% |
| 90 or more Minutes | 18 | 5.8% |
Commute Time by Sex in Queenstown
The most common commute times in Queenstown are 25 to 29 minutes (41 commuters, 21.1%) for males and 15 to 19 minutes (18 commuters, 15.8%) for females.
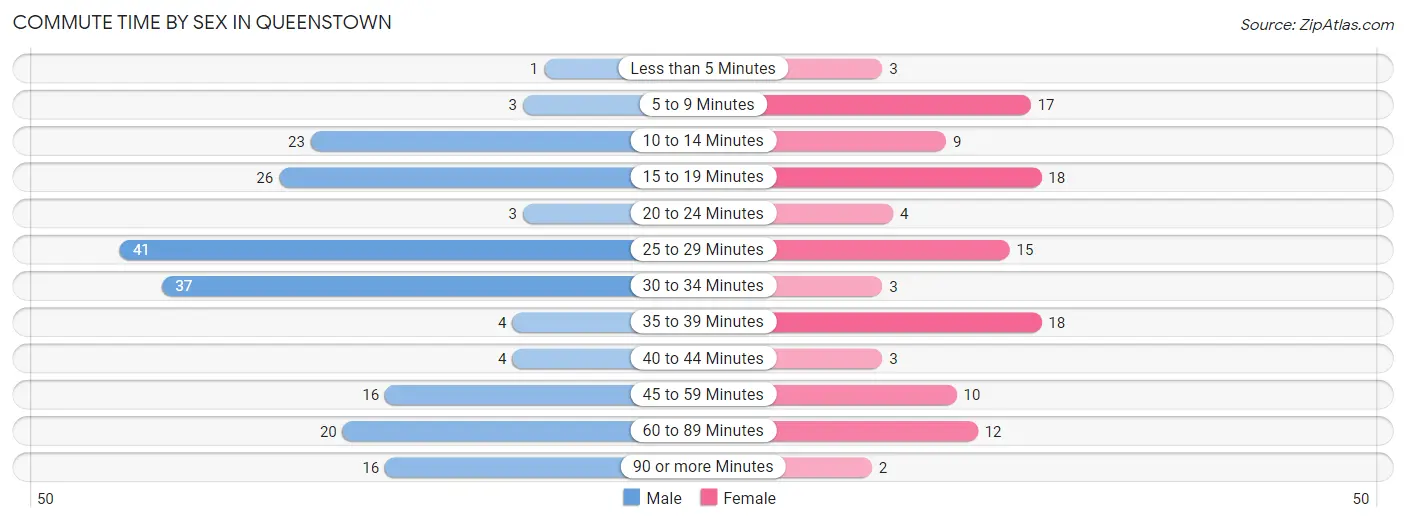
| Commute Time | Male | Female |
| Less than 5 Minutes | 1 (0.5%) | 3 (2.6%) |
| 5 to 9 Minutes | 3 (1.5%) | 17 (14.9%) |
| 10 to 14 Minutes | 23 (11.9%) | 9 (7.9%) |
| 15 to 19 Minutes | 26 (13.4%) | 18 (15.8%) |
| 20 to 24 Minutes | 3 (1.5%) | 4 (3.5%) |
| 25 to 29 Minutes | 41 (21.1%) | 15 (13.2%) |
| 30 to 34 Minutes | 37 (19.1%) | 3 (2.6%) |
| 35 to 39 Minutes | 4 (2.1%) | 18 (15.8%) |
| 40 to 44 Minutes | 4 (2.1%) | 3 (2.6%) |
| 45 to 59 Minutes | 16 (8.3%) | 10 (8.8%) |
| 60 to 89 Minutes | 20 (10.3%) | 12 (10.5%) |
| 90 or more Minutes | 16 (8.3%) | 2 (1.8%) |
Time of Departure to Work by Sex in Queenstown
The most frequent times of departure to work in Queenstown are 7:30 AM to 7:59 AM (46, 23.7%) for males and 8:00 AM to 8:29 AM (22, 19.3%) for females.
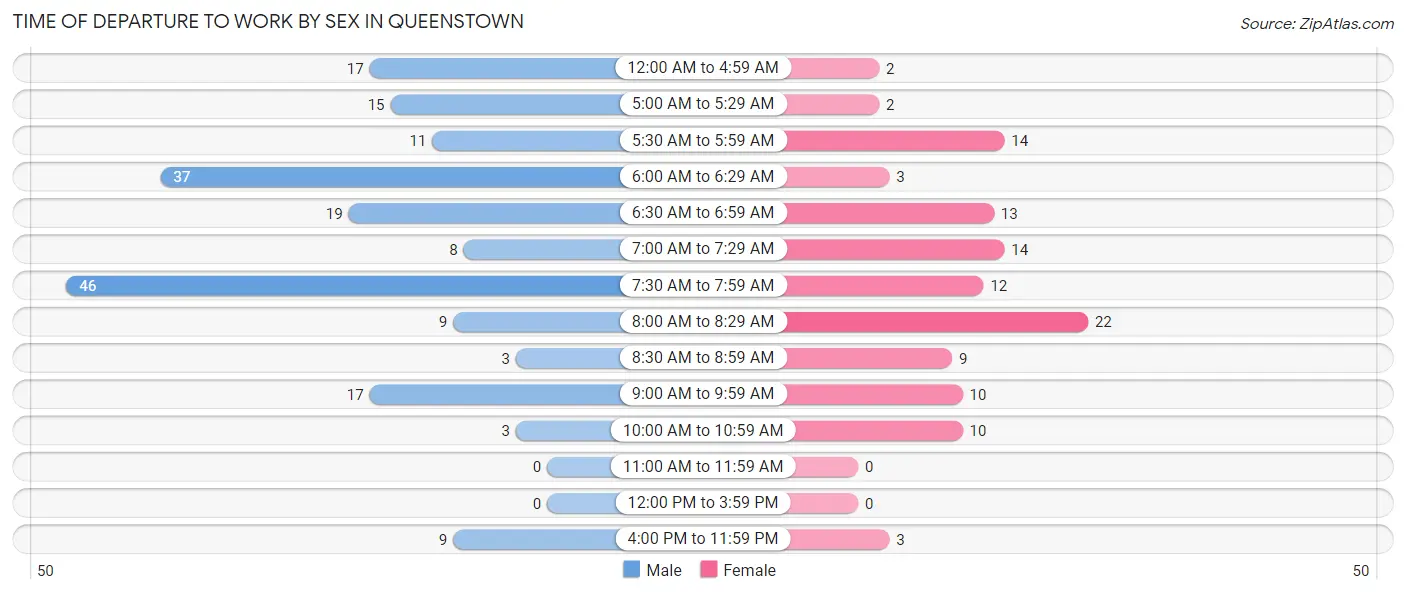
| Time of Departure | Male | Female |
| 12:00 AM to 4:59 AM | 17 (8.8%) | 2 (1.8%) |
| 5:00 AM to 5:29 AM | 15 (7.7%) | 2 (1.8%) |
| 5:30 AM to 5:59 AM | 11 (5.7%) | 14 (12.3%) |
| 6:00 AM to 6:29 AM | 37 (19.1%) | 3 (2.6%) |
| 6:30 AM to 6:59 AM | 19 (9.8%) | 13 (11.4%) |
| 7:00 AM to 7:29 AM | 8 (4.1%) | 14 (12.3%) |
| 7:30 AM to 7:59 AM | 46 (23.7%) | 12 (10.5%) |
| 8:00 AM to 8:29 AM | 9 (4.6%) | 22 (19.3%) |
| 8:30 AM to 8:59 AM | 3 (1.5%) | 9 (7.9%) |
| 9:00 AM to 9:59 AM | 17 (8.8%) | 10 (8.8%) |
| 10:00 AM to 10:59 AM | 3 (1.5%) | 10 (8.8%) |
| 11:00 AM to 11:59 AM | 0 (0.0%) | 0 (0.0%) |
| 12:00 PM to 3:59 PM | 0 (0.0%) | 0 (0.0%) |
| 4:00 PM to 11:59 PM | 9 (4.6%) | 3 (2.6%) |
| Total | 194 (100.0%) | 114 (100.0%) |
Housing Occupancy in Queenstown
Occupancy by Ownership in Queenstown
Of the total 273 dwellings in Queenstown, owner-occupied units account for 194 (71.1%), while renter-occupied units make up 79 (28.9%).
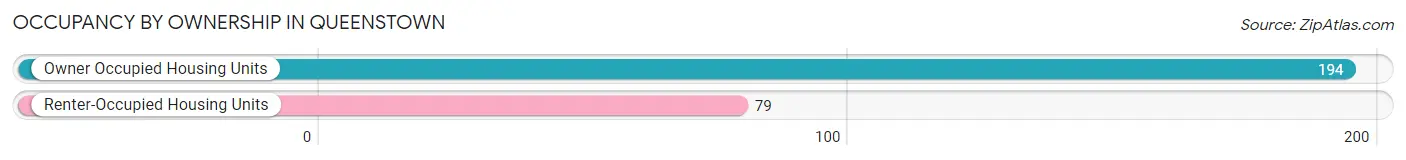
| Occupancy | # Housing Units | % Housing Units |
| Owner Occupied Housing Units | 194 | 71.1% |
| Renter-Occupied Housing Units | 79 | 28.9% |
| Total Occupied Housing Units | 273 | 100.0% |
Occupancy by Household Size in Queenstown
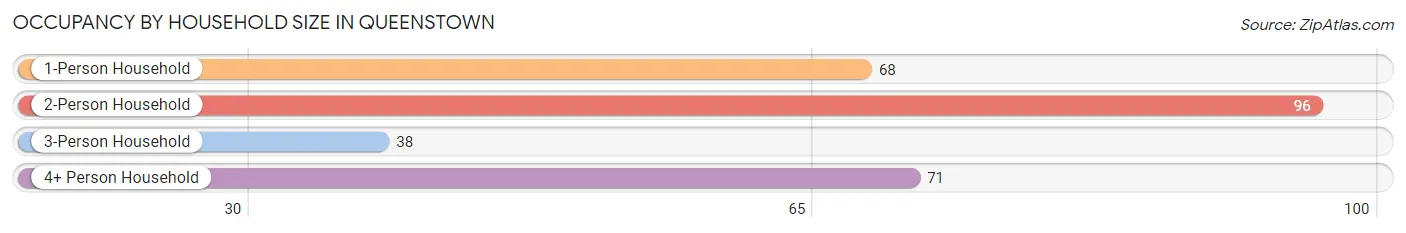
| Household Size | # Housing Units | % Housing Units |
| 1-Person Household | 68 | 24.9% |
| 2-Person Household | 96 | 35.2% |
| 3-Person Household | 38 | 13.9% |
| 4+ Person Household | 71 | 26.0% |
| Total Housing Units | 273 | 100.0% |
Occupancy by Ownership by Household Size in Queenstown
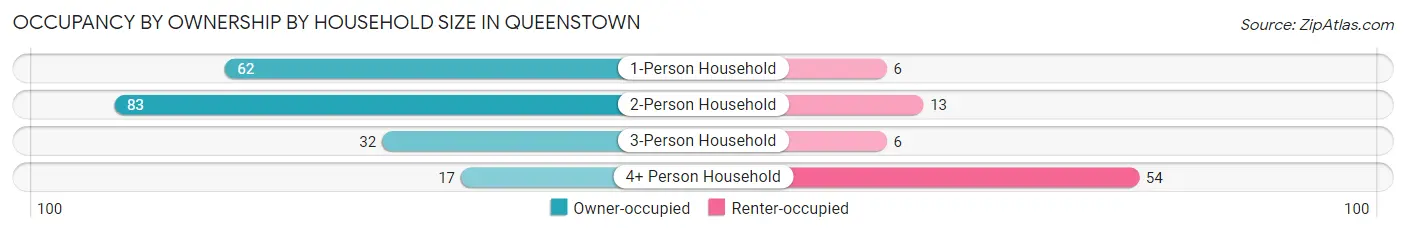
| Household Size | Owner-occupied | Renter-occupied |
| 1-Person Household | 62 (91.2%) | 6 (8.8%) |
| 2-Person Household | 83 (86.5%) | 13 (13.5%) |
| 3-Person Household | 32 (84.2%) | 6 (15.8%) |
| 4+ Person Household | 17 (23.9%) | 54 (76.1%) |
| Total Housing Units | 194 (71.1%) | 79 (28.9%) |
Occupancy by Educational Attainment in Queenstown
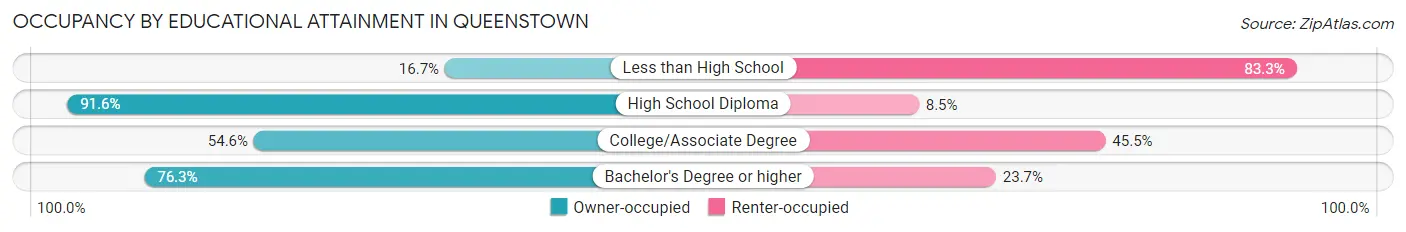
| Household Size | Owner-occupied | Renter-occupied |
| Less than High School | 3 (16.7%) | 15 (83.3%) |
| High School Diploma | 65 (91.5%) | 6 (8.5%) |
| College/Associate Degree | 36 (54.5%) | 30 (45.5%) |
| Bachelor's Degree or higher | 90 (76.3%) | 28 (23.7%) |
Occupancy by Age of Householder in Queenstown
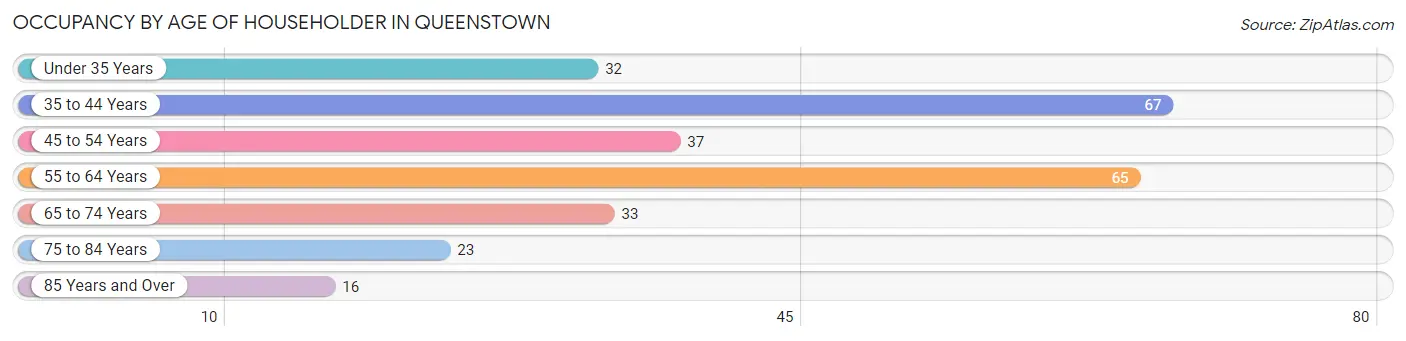
| Age Bracket | # Households | % Households |
| Under 35 Years | 32 | 11.7% |
| 35 to 44 Years | 67 | 24.5% |
| 45 to 54 Years | 37 | 13.6% |
| 55 to 64 Years | 65 | 23.8% |
| 65 to 74 Years | 33 | 12.1% |
| 75 to 84 Years | 23 | 8.4% |
| 85 Years and Over | 16 | 5.9% |
| Total | 273 | 100.0% |
Housing Finances in Queenstown
Median Income by Occupancy in Queenstown
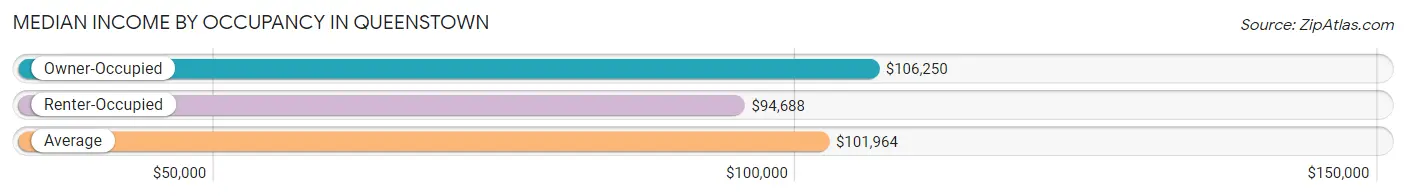
| Occupancy Type | # Households | Median Income |
| Owner-Occupied | 194 (71.1%) | $106,250 |
| Renter-Occupied | 79 (28.9%) | $94,688 |
| Average | 273 (100.0%) | $101,964 |
Occupancy by Householder Income Bracket in Queenstown
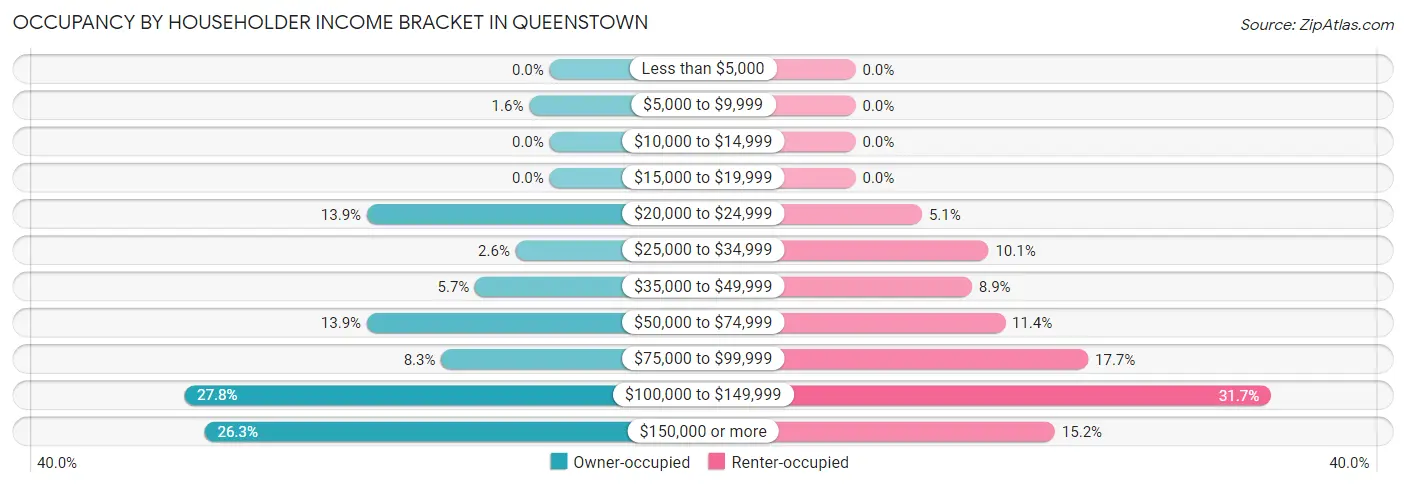
| Income Bracket | Owner-occupied | Renter-occupied |
| Less than $5,000 | 0 (0.0%) | 0 (0.0%) |
| $5,000 to $9,999 | 3 (1.5%) | 0 (0.0%) |
| $10,000 to $14,999 | 0 (0.0%) | 0 (0.0%) |
| $15,000 to $19,999 | 0 (0.0%) | 0 (0.0%) |
| $20,000 to $24,999 | 27 (13.9%) | 4 (5.1%) |
| $25,000 to $34,999 | 5 (2.6%) | 8 (10.1%) |
| $35,000 to $49,999 | 11 (5.7%) | 7 (8.9%) |
| $50,000 to $74,999 | 27 (13.9%) | 9 (11.4%) |
| $75,000 to $99,999 | 16 (8.3%) | 14 (17.7%) |
| $100,000 to $149,999 | 54 (27.8%) | 25 (31.7%) |
| $150,000 or more | 51 (26.3%) | 12 (15.2%) |
| Total | 194 (100.0%) | 79 (100.0%) |
Monthly Housing Cost Tiers in Queenstown
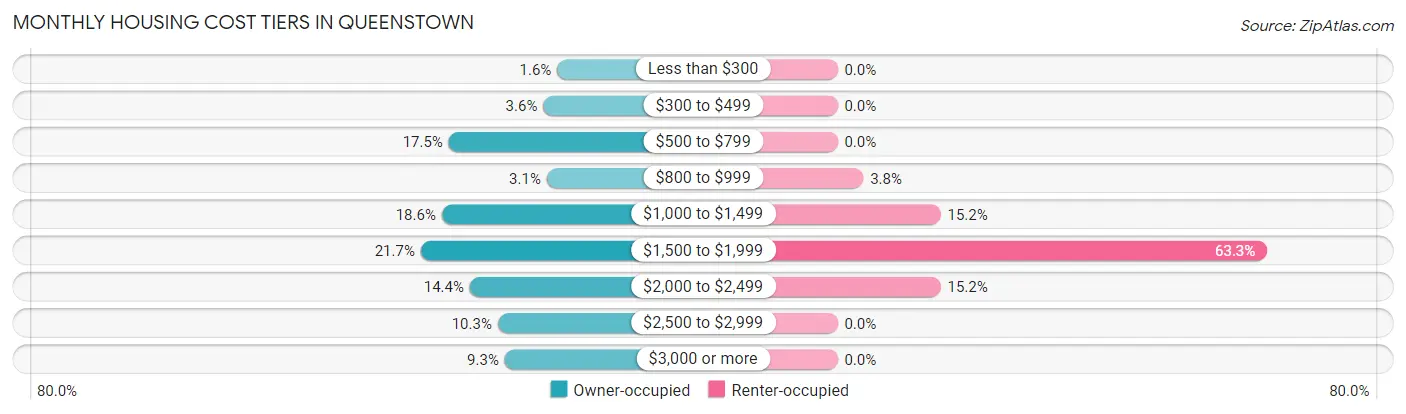
| Monthly Cost | Owner-occupied | Renter-occupied |
| Less than $300 | 3 (1.5%) | 0 (0.0%) |
| $300 to $499 | 7 (3.6%) | 0 (0.0%) |
| $500 to $799 | 34 (17.5%) | 0 (0.0%) |
| $800 to $999 | 6 (3.1%) | 3 (3.8%) |
| $1,000 to $1,499 | 36 (18.6%) | 12 (15.2%) |
| $1,500 to $1,999 | 42 (21.6%) | 50 (63.3%) |
| $2,000 to $2,499 | 28 (14.4%) | 12 (15.2%) |
| $2,500 to $2,999 | 20 (10.3%) | 0 (0.0%) |
| $3,000 or more | 18 (9.3%) | 0 (0.0%) |
| Total | 194 (100.0%) | 79 (100.0%) |
Physical Housing Characteristics in Queenstown
Housing Structures in Queenstown
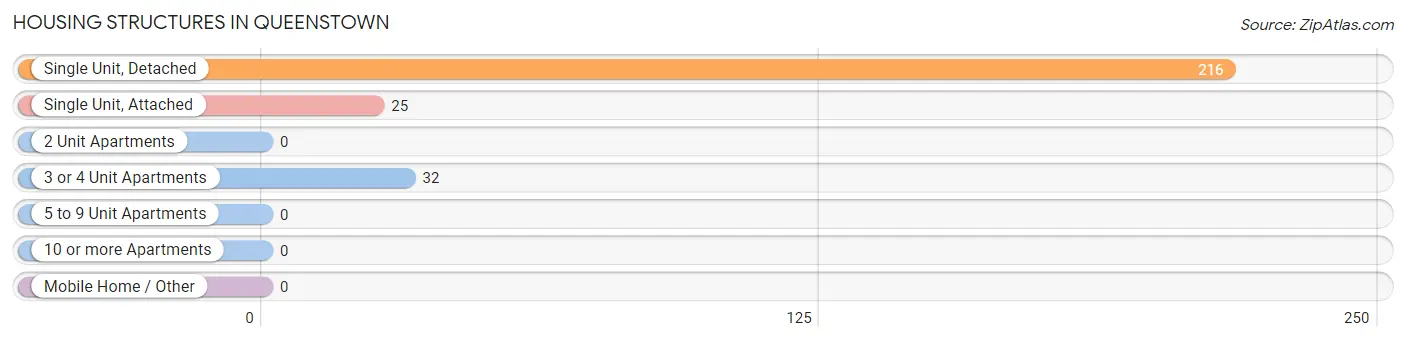
| Structure Type | # Housing Units | % Housing Units |
| Single Unit, Detached | 216 | 79.1% |
| Single Unit, Attached | 25 | 9.2% |
| 2 Unit Apartments | 0 | 0.0% |
| 3 or 4 Unit Apartments | 32 | 11.7% |
| 5 to 9 Unit Apartments | 0 | 0.0% |
| 10 or more Apartments | 0 | 0.0% |
| Mobile Home / Other | 0 | 0.0% |
| Total | 273 | 100.0% |
Housing Structures by Occupancy in Queenstown
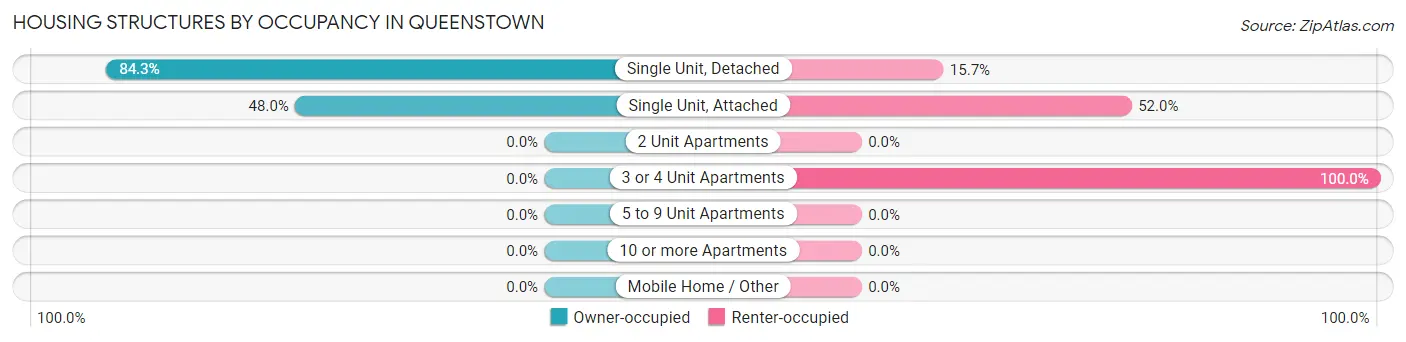
| Structure Type | Owner-occupied | Renter-occupied |
| Single Unit, Detached | 182 (84.3%) | 34 (15.7%) |
| Single Unit, Attached | 12 (48.0%) | 13 (52.0%) |
| 2 Unit Apartments | 0 (0.0%) | 0 (0.0%) |
| 3 or 4 Unit Apartments | 0 (0.0%) | 32 (100.0%) |
| 5 to 9 Unit Apartments | 0 (0.0%) | 0 (0.0%) |
| 10 or more Apartments | 0 (0.0%) | 0 (0.0%) |
| Mobile Home / Other | 0 (0.0%) | 0 (0.0%) |
| Total | 194 (71.1%) | 79 (28.9%) |
Housing Structures by Number of Rooms in Queenstown
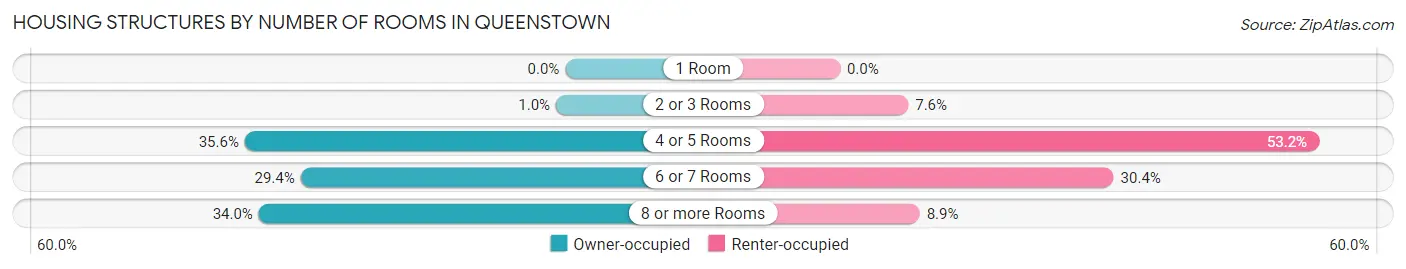
| Number of Rooms | Owner-occupied | Renter-occupied |
| 1 Room | 0 (0.0%) | 0 (0.0%) |
| 2 or 3 Rooms | 2 (1.0%) | 6 (7.6%) |
| 4 or 5 Rooms | 69 (35.6%) | 42 (53.2%) |
| 6 or 7 Rooms | 57 (29.4%) | 24 (30.4%) |
| 8 or more Rooms | 66 (34.0%) | 7 (8.9%) |
| Total | 194 (100.0%) | 79 (100.0%) |
Housing Structure by Heating Type in Queenstown
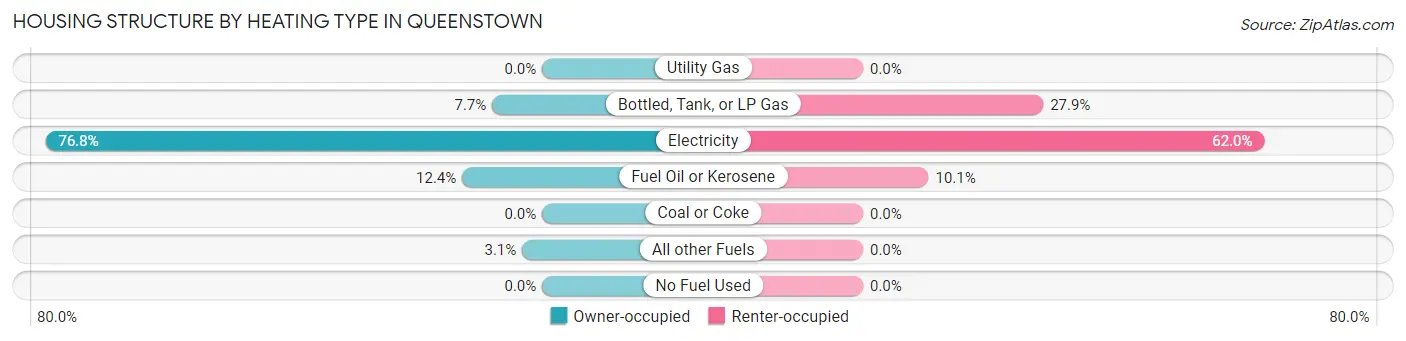
| Heating Type | Owner-occupied | Renter-occupied |
| Utility Gas | 0 (0.0%) | 0 (0.0%) |
| Bottled, Tank, or LP Gas | 15 (7.7%) | 22 (27.9%) |
| Electricity | 149 (76.8%) | 49 (62.0%) |
| Fuel Oil or Kerosene | 24 (12.4%) | 8 (10.1%) |
| Coal or Coke | 0 (0.0%) | 0 (0.0%) |
| All other Fuels | 6 (3.1%) | 0 (0.0%) |
| No Fuel Used | 0 (0.0%) | 0 (0.0%) |
| Total | 194 (100.0%) | 79 (100.0%) |
Household Vehicle Usage in Queenstown
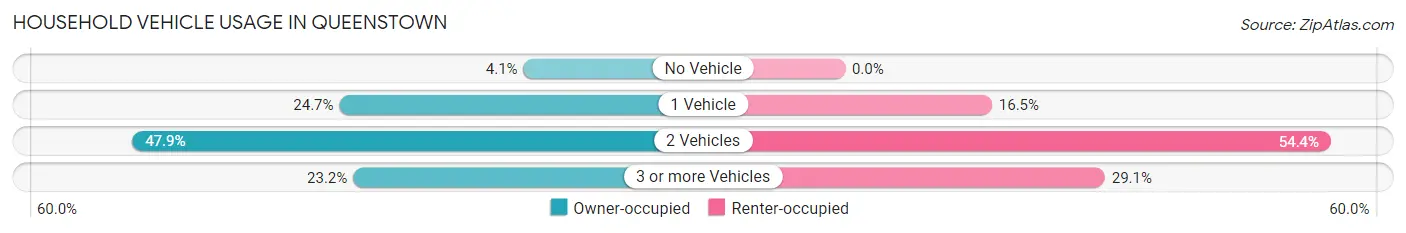
| Vehicles per Household | Owner-occupied | Renter-occupied |
| No Vehicle | 8 (4.1%) | 0 (0.0%) |
| 1 Vehicle | 48 (24.7%) | 13 (16.5%) |
| 2 Vehicles | 93 (47.9%) | 43 (54.4%) |
| 3 or more Vehicles | 45 (23.2%) | 23 (29.1%) |
| Total | 194 (100.0%) | 79 (100.0%) |
Real Estate & Mortgages in Queenstown
Real Estate and Mortgage Overview in Queenstown
| Characteristic | Without Mortgage | With Mortgage |
| Housing Units | 63 | 131 |
| Median Property Value | $298,400 | $347,400 |
| Median Household Income | $69,531 | $47 |
| Monthly Housing Costs | $725 | $18 |
| Real Estate Taxes | $3,000 | $0 |
Property Value by Mortgage Status in Queenstown
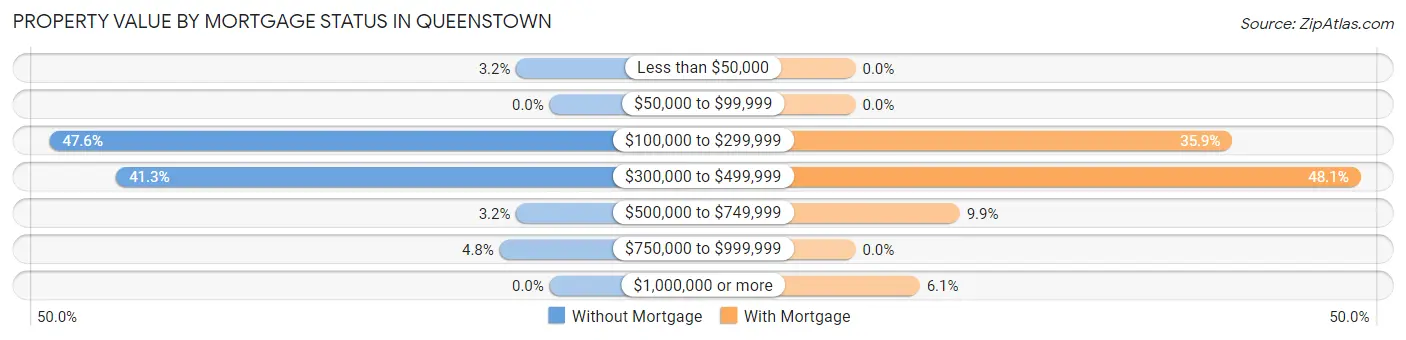
| Property Value | Without Mortgage | With Mortgage |
| Less than $50,000 | 2 (3.2%) | 0 (0.0%) |
| $50,000 to $99,999 | 0 (0.0%) | 0 (0.0%) |
| $100,000 to $299,999 | 30 (47.6%) | 47 (35.9%) |
| $300,000 to $499,999 | 26 (41.3%) | 63 (48.1%) |
| $500,000 to $749,999 | 2 (3.2%) | 13 (9.9%) |
| $750,000 to $999,999 | 3 (4.8%) | 0 (0.0%) |
| $1,000,000 or more | 0 (0.0%) | 8 (6.1%) |
| Total | 63 (100.0%) | 131 (100.0%) |
Household Income by Mortgage Status in Queenstown
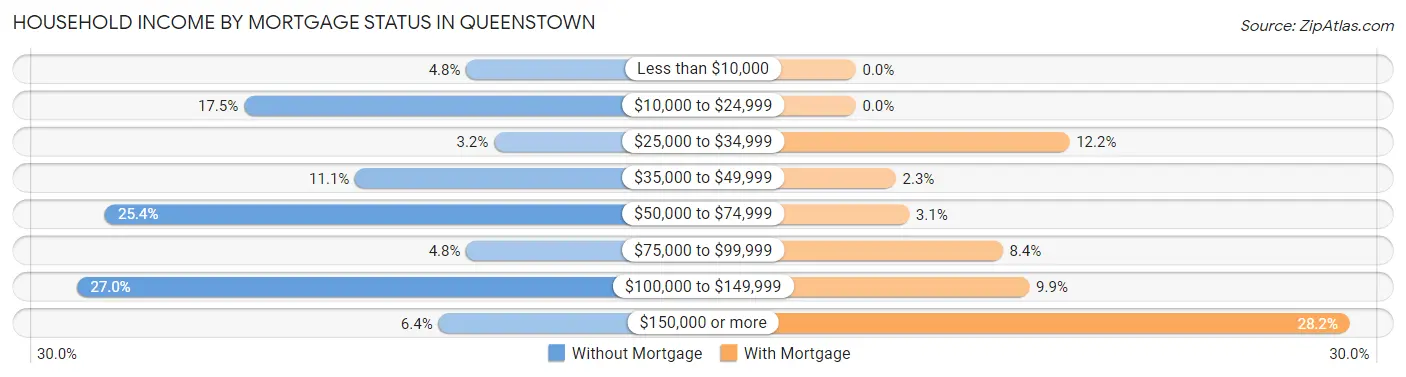
| Household Income | Without Mortgage | With Mortgage |
| Less than $10,000 | 3 (4.8%) | 0 (0.0%) |
| $10,000 to $24,999 | 11 (17.5%) | 0 (0.0%) |
| $25,000 to $34,999 | 2 (3.2%) | 16 (12.2%) |
| $35,000 to $49,999 | 7 (11.1%) | 3 (2.3%) |
| $50,000 to $74,999 | 16 (25.4%) | 4 (3.0%) |
| $75,000 to $99,999 | 3 (4.8%) | 11 (8.4%) |
| $100,000 to $149,999 | 17 (27.0%) | 13 (9.9%) |
| $150,000 or more | 4 (6.4%) | 37 (28.2%) |
| Total | 63 (100.0%) | 131 (100.0%) |
Property Value to Household Income Ratio in Queenstown
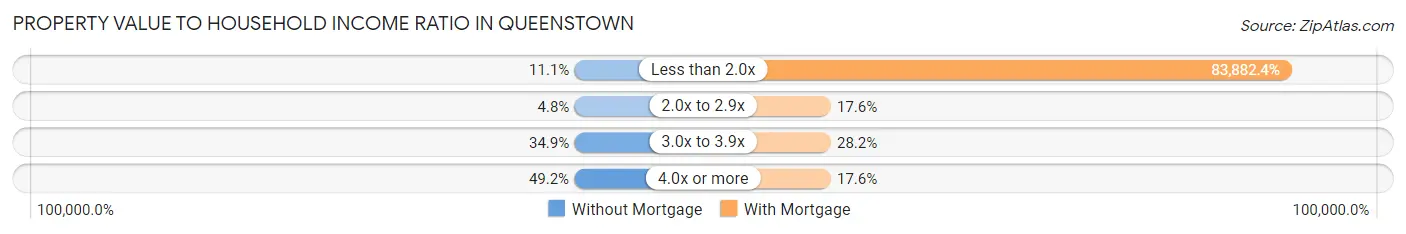
| Value-to-Income Ratio | Without Mortgage | With Mortgage |
| Less than 2.0x | 7 (11.1%) | 109,886 (83,882.4%) |
| 2.0x to 2.9x | 3 (4.8%) | 23 (17.6%) |
| 3.0x to 3.9x | 22 (34.9%) | 37 (28.2%) |
| 4.0x or more | 31 (49.2%) | 23 (17.6%) |
| Total | 63 (100.0%) | 131 (100.0%) |
Real Estate Taxes by Mortgage Status in Queenstown
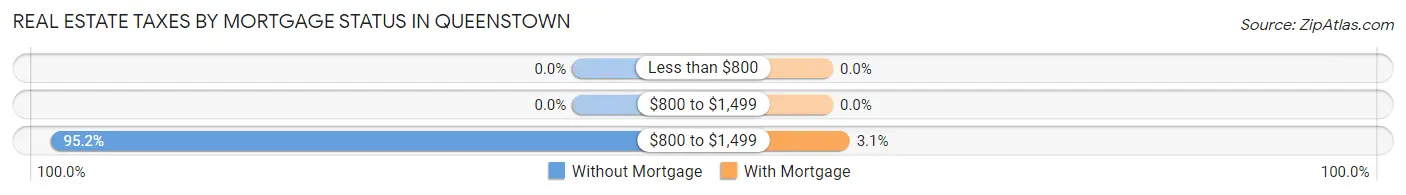
| Property Taxes | Without Mortgage | With Mortgage |
| Less than $800 | 0 (0.0%) | 0 (0.0%) |
| $800 to $1,499 | 0 (0.0%) | 0 (0.0%) |
| $800 to $1,499 | 60 (95.2%) | 4 (3.0%) |
| Total | 63 (100.0%) | 131 (100.0%) |
Health & Disability in Queenstown
Health Insurance Coverage by Age in Queenstown
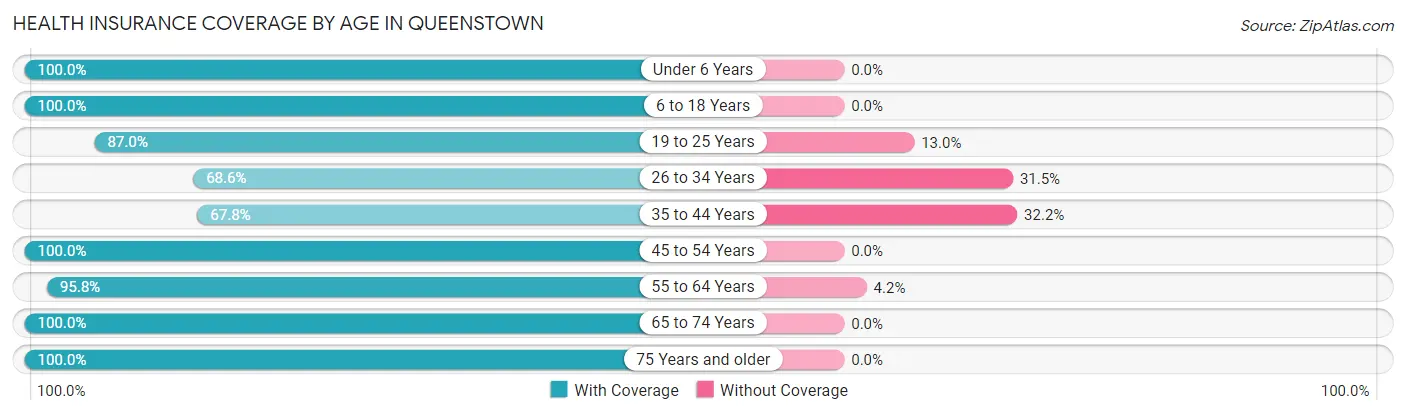
| Age Bracket | With Coverage | Without Coverage |
| Under 6 Years | 116 (100.0%) | 0 (0.0%) |
| 6 to 18 Years | 137 (100.0%) | 0 (0.0%) |
| 19 to 25 Years | 20 (87.0%) | 3 (13.0%) |
| 26 to 34 Years | 85 (68.5%) | 39 (31.5%) |
| 35 to 44 Years | 82 (67.8%) | 39 (32.2%) |
| 45 to 54 Years | 67 (100.0%) | 0 (0.0%) |
| 55 to 64 Years | 115 (95.8%) | 5 (4.2%) |
| 65 to 74 Years | 58 (100.0%) | 0 (0.0%) |
| 75 Years and older | 49 (100.0%) | 0 (0.0%) |
| Total | 729 (89.4%) | 86 (10.5%) |
Health Insurance Coverage by Citizenship Status in Queenstown
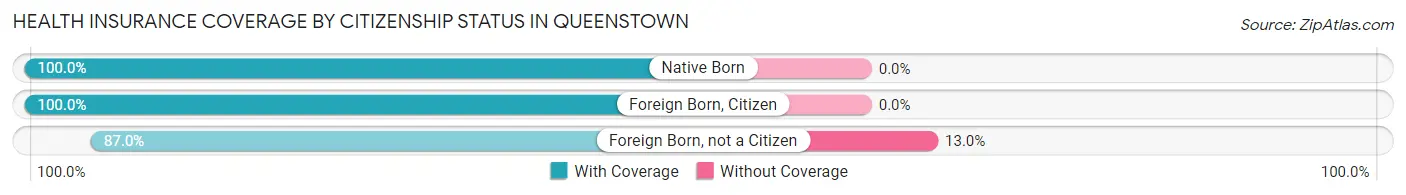
| Citizenship Status | With Coverage | Without Coverage |
| Native Born | 116 (100.0%) | 0 (0.0%) |
| Foreign Born, Citizen | 137 (100.0%) | 0 (0.0%) |
| Foreign Born, not a Citizen | 20 (87.0%) | 3 (13.0%) |
Health Insurance Coverage by Household Income in Queenstown
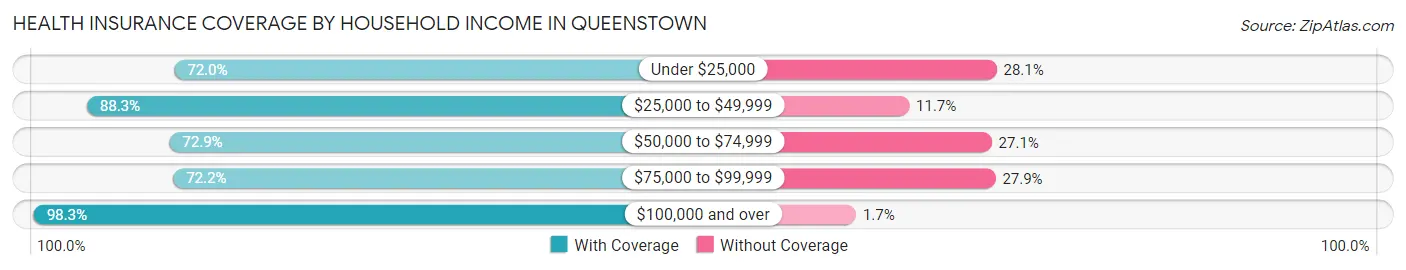
| Household Income | With Coverage | Without Coverage |
| Under $25,000 | 59 (72.0%) | 23 (28.1%) |
| $25,000 to $49,999 | 106 (88.3%) | 14 (11.7%) |
| $50,000 to $74,999 | 51 (72.9%) | 19 (27.1%) |
| $75,000 to $99,999 | 57 (72.2%) | 22 (27.9%) |
| $100,000 and over | 456 (98.3%) | 8 (1.7%) |
Public vs Private Health Insurance Coverage by Age in Queenstown
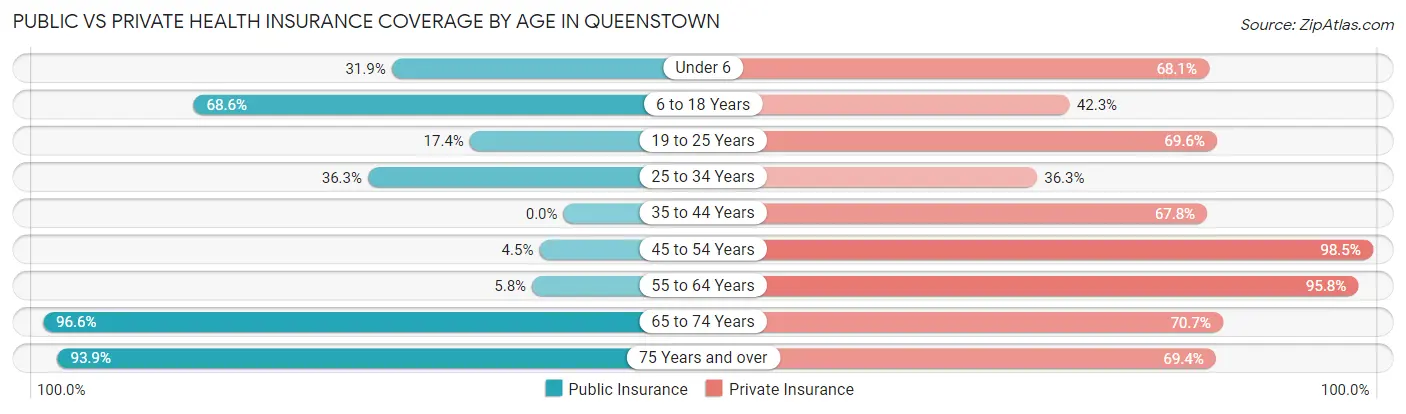
| Age Bracket | Public Insurance | Private Insurance |
| Under 6 | 37 (31.9%) | 79 (68.1%) |
| 6 to 18 Years | 94 (68.6%) | 58 (42.3%) |
| 19 to 25 Years | 4 (17.4%) | 16 (69.6%) |
| 25 to 34 Years | 45 (36.3%) | 45 (36.3%) |
| 35 to 44 Years | 0 (0.0%) | 82 (67.8%) |
| 45 to 54 Years | 3 (4.5%) | 66 (98.5%) |
| 55 to 64 Years | 7 (5.8%) | 115 (95.8%) |
| 65 to 74 Years | 56 (96.6%) | 41 (70.7%) |
| 75 Years and over | 46 (93.9%) | 34 (69.4%) |
| Total | 292 (35.8%) | 536 (65.8%) |
Disability Status by Sex by Age in Queenstown
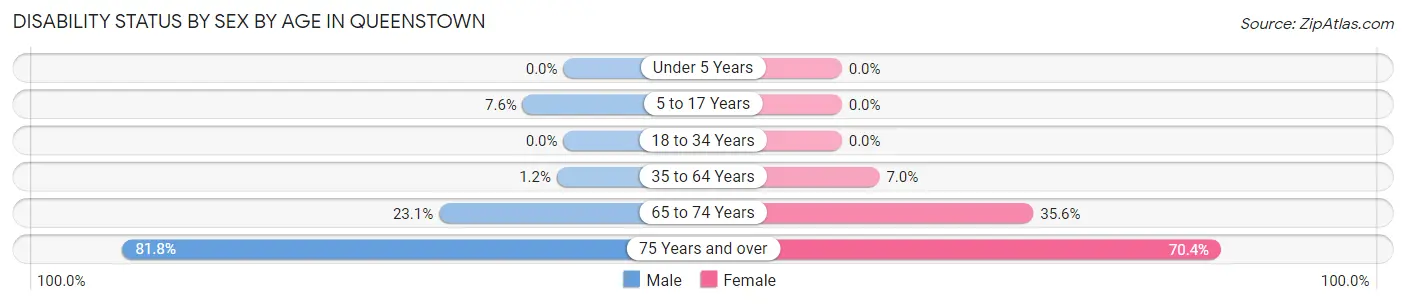
| Age Bracket | Male | Female |
| Under 5 Years | 0 (0.0%) | 0 (0.0%) |
| 5 to 17 Years | 4 (7.5%) | 0 (0.0%) |
| 18 to 34 Years | 0 (0.0%) | 0 (0.0%) |
| 35 to 64 Years | 2 (1.2%) | 10 (7.0%) |
| 65 to 74 Years | 3 (23.1%) | 16 (35.6%) |
| 75 Years and over | 18 (81.8%) | 19 (70.4%) |
Disability Class by Sex by Age in Queenstown
Disability Class: Hearing Difficulty
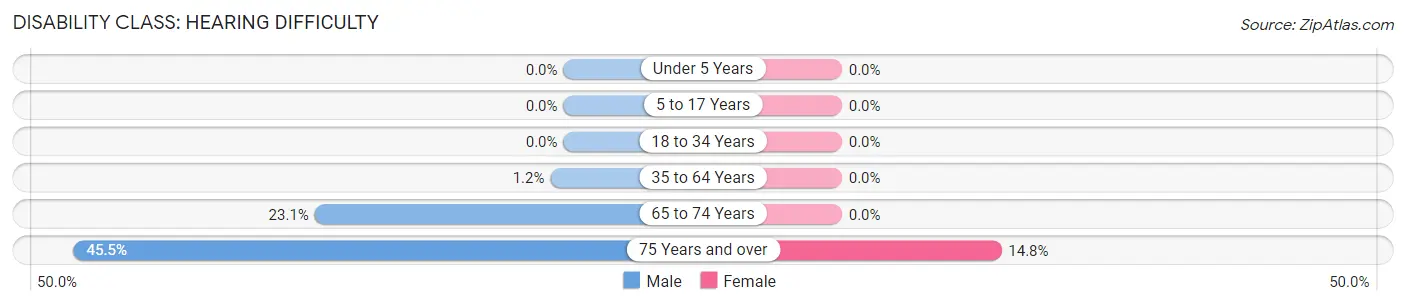
| Age Bracket | Male | Female |
| Under 5 Years | 0 (0.0%) | 0 (0.0%) |
| 5 to 17 Years | 0 (0.0%) | 0 (0.0%) |
| 18 to 34 Years | 0 (0.0%) | 0 (0.0%) |
| 35 to 64 Years | 2 (1.2%) | 0 (0.0%) |
| 65 to 74 Years | 3 (23.1%) | 0 (0.0%) |
| 75 Years and over | 10 (45.5%) | 4 (14.8%) |
Disability Class: Vision Difficulty
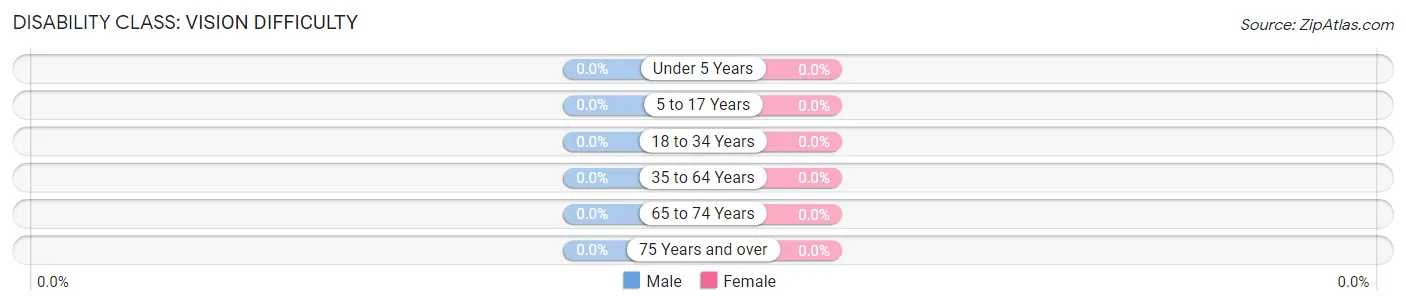
| Age Bracket | Male | Female |
| Under 5 Years | 0 (0.0%) | 0 (0.0%) |
| 5 to 17 Years | 0 (0.0%) | 0 (0.0%) |
| 18 to 34 Years | 0 (0.0%) | 0 (0.0%) |
| 35 to 64 Years | 0 (0.0%) | 0 (0.0%) |
| 65 to 74 Years | 0 (0.0%) | 0 (0.0%) |
| 75 Years and over | 0 (0.0%) | 0 (0.0%) |
Disability Class: Cognitive Difficulty
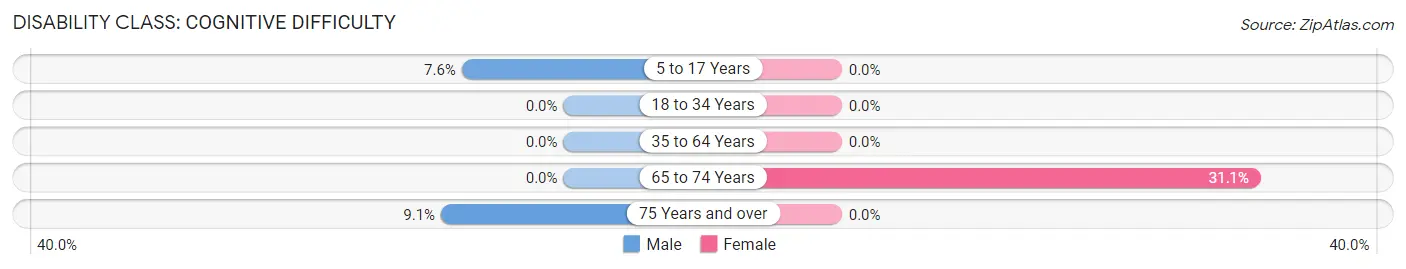
| Age Bracket | Male | Female |
| 5 to 17 Years | 4 (7.5%) | 0 (0.0%) |
| 18 to 34 Years | 0 (0.0%) | 0 (0.0%) |
| 35 to 64 Years | 0 (0.0%) | 0 (0.0%) |
| 65 to 74 Years | 0 (0.0%) | 14 (31.1%) |
| 75 Years and over | 2 (9.1%) | 0 (0.0%) |
Disability Class: Ambulatory Difficulty
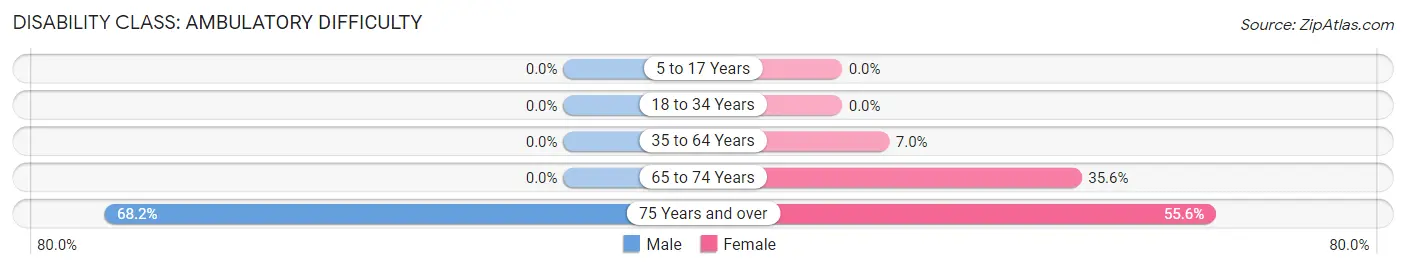
| Age Bracket | Male | Female |
| 5 to 17 Years | 0 (0.0%) | 0 (0.0%) |
| 18 to 34 Years | 0 (0.0%) | 0 (0.0%) |
| 35 to 64 Years | 0 (0.0%) | 10 (7.0%) |
| 65 to 74 Years | 0 (0.0%) | 16 (35.6%) |
| 75 Years and over | 15 (68.2%) | 15 (55.6%) |
Disability Class: Self-Care Difficulty
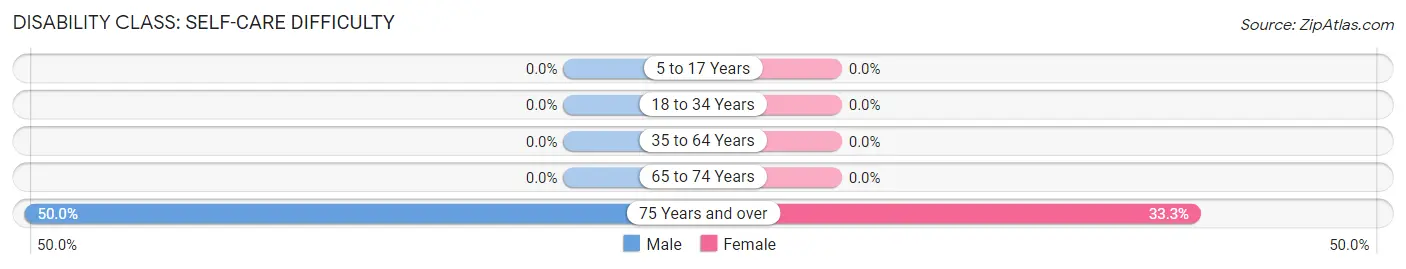
| Age Bracket | Male | Female |
| 5 to 17 Years | 0 (0.0%) | 0 (0.0%) |
| 18 to 34 Years | 0 (0.0%) | 0 (0.0%) |
| 35 to 64 Years | 0 (0.0%) | 0 (0.0%) |
| 65 to 74 Years | 0 (0.0%) | 0 (0.0%) |
| 75 Years and over | 11 (50.0%) | 9 (33.3%) |
Technology Access in Queenstown
Computing Device Access in Queenstown
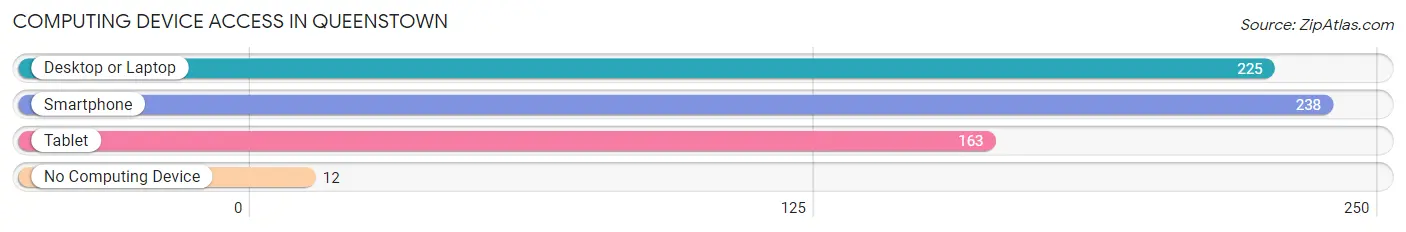
| Device Type | # Households | % Households |
| Desktop or Laptop | 225 | 82.4% |
| Smartphone | 238 | 87.2% |
| Tablet | 163 | 59.7% |
| No Computing Device | 12 | 4.4% |
| Total | 273 | 100.0% |
Internet Access in Queenstown
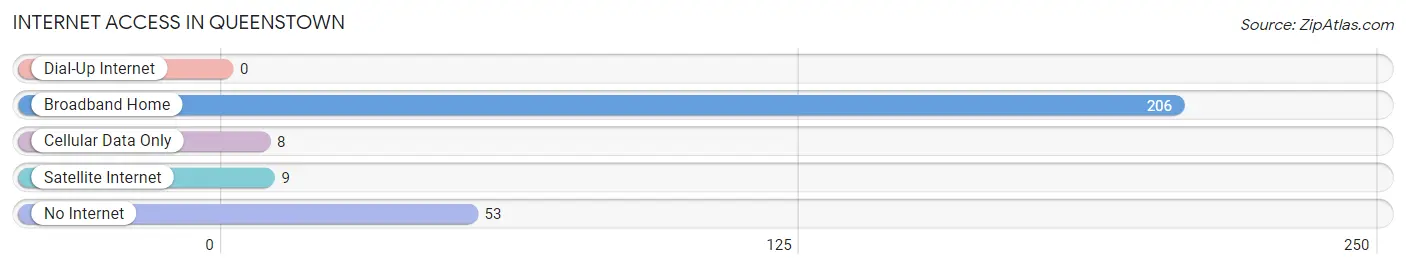
| Internet Type | # Households | % Households |
| Dial-Up Internet | 0 | 0.0% |
| Broadband Home | 206 | 75.5% |
| Cellular Data Only | 8 | 2.9% |
| Satellite Internet | 9 | 3.3% |
| No Internet | 53 | 19.4% |
| Total | 273 | 100.0% |
Queenstown Summary
Queenstown is a small town located in Queen Anne’s County, Maryland. It is situated on the Eastern Shore of the Chesapeake Bay, approximately 25 miles south of Annapolis and 40 miles east of Baltimore. The town has a population of 1,845 as of the 2010 census, making it the second smallest incorporated town in the state of Maryland.
History
Queenstown was founded in 1706 by William and Mary Queen, who were granted a patent for the land by the colonial government of Maryland. The town was originally known as Queen’s Town, but the name was changed to Queenstown in 1812. The town was incorporated in 1867.
Queenstown was a major port of entry for immigrants coming to the United States in the late 19th and early 20th centuries. Many of the immigrants were from Eastern Europe, and they settled in the area to work in the local fishing and oyster industries.
Geography
Queenstown is located in Queen Anne’s County, Maryland, on the Eastern Shore of the Chesapeake Bay. The town is situated on the western shore of the Chester River, which flows into the bay. The town is bordered by the towns of Grasonville to the north, Stevensville to the east, and Centreville to the south.
The town has a total area of 1.2 square miles, all of which is land. The terrain is mostly flat, with some rolling hills. The climate is humid subtropical, with hot, humid summers and mild winters.
Economy
Queenstown’s economy is largely based on tourism and the service industry. The town is home to several marinas, which attract visitors from all over the region. The town also has a number of restaurants, shops, and other businesses that cater to tourists.
The town is also home to several manufacturing companies, including a boat building company and a seafood processing plant. The town is also home to a number of farms, which produce a variety of crops, including corn, soybeans, and wheat.
Demographics
As of the 2010 census, Queenstown had a population of 1,845. The racial makeup of the town was 87.3% White, 8.2% African American, 0.7% Native American, 0.7% Asian, 0.1% Pacific Islander, and 2.2% from two or more races. Hispanic or Latino of any race were 1.7% of the population.
The median income for a household in the town was $50,938, and the median income for a family was $60,000. The per capita income for the town was $25,938. About 8.2% of families and 10.2% of the population were below the poverty line, including 14.3% of those under age 18 and 6.2% of those age 65 or over.
Common Questions
What is Per Capita Income in Queenstown?
Per Capita income in Queenstown is $40,979.
What is the Median Family Income in Queenstown?
Median Family Income in Queenstown is $109,375.
What is the Median Household income in Queenstown?
Median Household Income in Queenstown is $101,964.
What is Income or Wage Gap in Queenstown?
Income or Wage Gap in Queenstown is 2.2%.
Women in Queenstown earn 97.8 cents for every dollar earned by a man.
What is Inequality or Gini Index in Queenstown?
Inequality or Gini Index in Queenstown is 0.39.
What is the Total Population of Queenstown?
Total Population of Queenstown is 815.
What is the Total Male Population of Queenstown?
Total Male Population of Queenstown is 351.
What is the Total Female Population of Queenstown?
Total Female Population of Queenstown is 464.
What is the Ratio of Males per 100 Females in Queenstown?
There are 75.65 Males per 100 Females in Queenstown.
What is the Ratio of Females per 100 Males in Queenstown?
There are 132.19 Females per 100 Males in Queenstown.
What is the Median Population Age in Queenstown?
Median Population Age in Queenstown is 35.3 Years.
What is the Average Family Size in Queenstown
Average Family Size in Queenstown is 3.5 People.
What is the Average Household Size in Queenstown
Average Household Size in Queenstown is 3.0 People.
How Large is the Labor Force in Queenstown?
There are 405 People in the Labor Forcein in Queenstown.
What is the Percentage of People in the Labor Force in Queenstown?
69.3% of People are in the Labor Force in Queenstown.
What is the Unemployment Rate in Queenstown?
Unemployment Rate in Queenstown is 4.2%.