Barclay, MD Map & Demographics
Barclay Map
Barclay Overview
$31,282
PER CAPITA INCOME
$54,375
AVG FAMILY INCOME
$54,276
AVG HOUSEHOLD INCOME
0.30
INEQUALITY / GINI INDEX
175
TOTAL POPULATION
79
MALE POPULATION
96
FEMALE POPULATION
82.29
MALES / 100 FEMALES
121.52
FEMALES / 100 MALES
23.0
MEDIAN AGE
2.5
AVG FAMILY SIZE
2.3
AVG HOUSEHOLD SIZE
101
LABOR FORCE [ PEOPLE ]
70.6%
PERCENT IN LABOR FORCE
Barclay Zip Codes
Barclay Area Codes
Income in Barclay
Income Overview in Barclay
Per Capita Income in Barclay is $31,282, while median incomes of families and households are $54,375 and $54,276 respectively.
| Characteristic | Number | Measure |
| Per Capita Income | 175 | $31,282 |
| Median Family Income | 61 | $54,375 |
| Mean Family Income | 61 | $78,300 |
| Median Household Income | 76 | $54,276 |
| Mean Household Income | 76 | $73,758 |
| Income Deficit | 61 | $0 |
| Wage / Income Gap (%) | 175 | 0.00% |
| Wage / Income Gap ($) | 175 | 100.00¢ per $1 |
| Gini / Inequality Index | 175 | 0.30 |
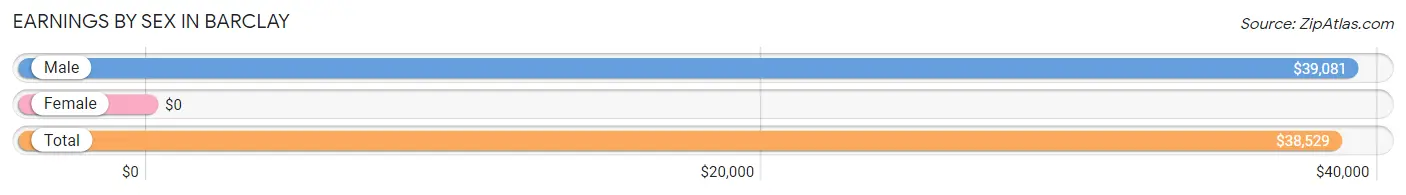
Earnings by Sex in Barclay
| Sex | Number | Average Earnings |
| Male | 61 (58.7%) | $39,081 |
| Female | 43 (41.3%) | $0 |
| Total | 104 (100.0%) | $38,529 |
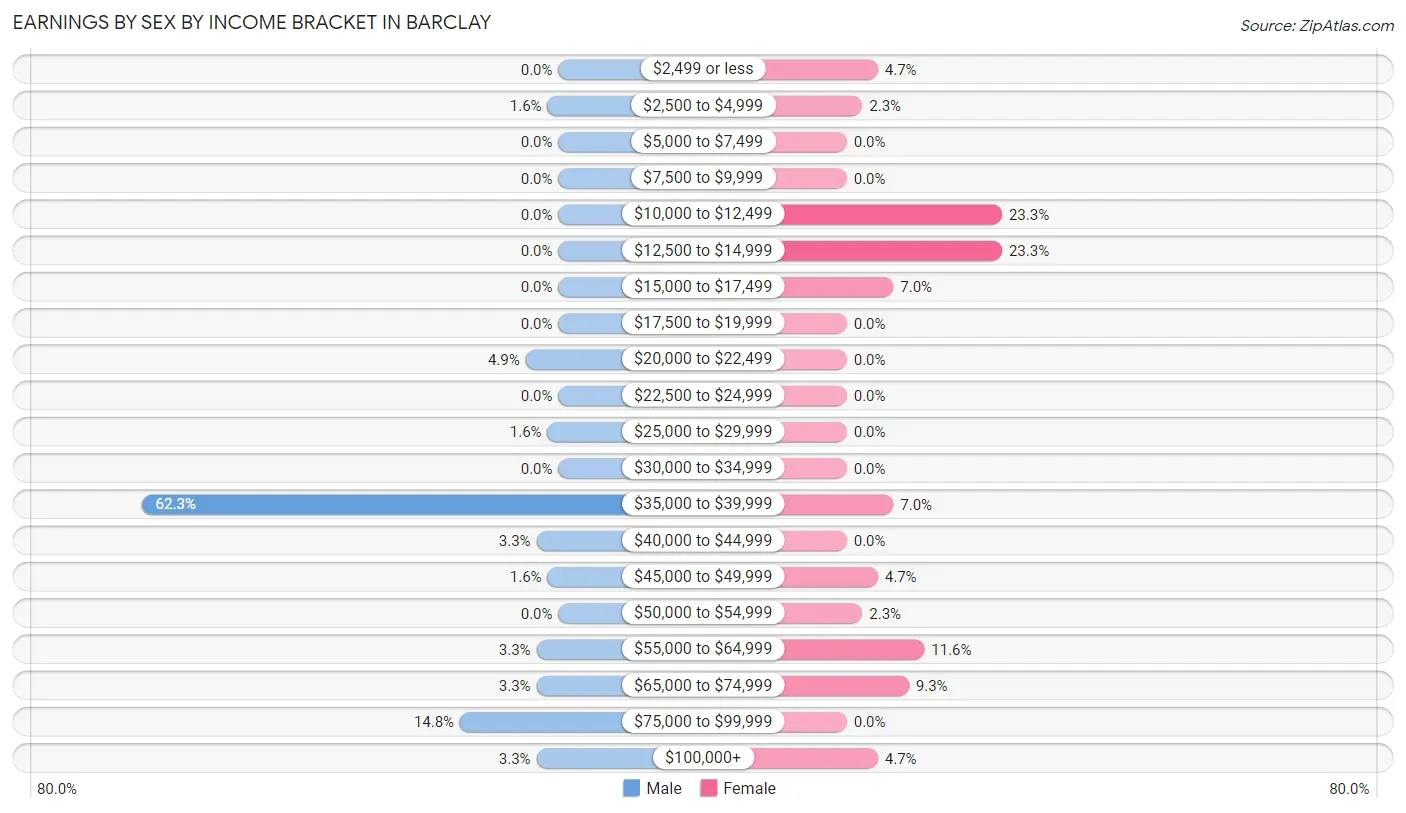
Earnings by Sex by Income Bracket in Barclay
The most common earnings brackets in Barclay are $35,000 to $39,999 for men (38 | 62.3%) and $10,000 to $12,499 for women (10 | 23.3%).
| Income | Male | Female |
| $2,499 or less | 0 (0.0%) | 2 (4.6%) |
| $2,500 to $4,999 | 1 (1.6%) | 1 (2.3%) |
| $5,000 to $7,499 | 0 (0.0%) | 0 (0.0%) |
| $7,500 to $9,999 | 0 (0.0%) | 0 (0.0%) |
| $10,000 to $12,499 | 0 (0.0%) | 10 (23.3%) |
| $12,500 to $14,999 | 0 (0.0%) | 10 (23.3%) |
| $15,000 to $17,499 | 0 (0.0%) | 3 (7.0%) |
| $17,500 to $19,999 | 0 (0.0%) | 0 (0.0%) |
| $20,000 to $22,499 | 3 (4.9%) | 0 (0.0%) |
| $22,500 to $24,999 | 0 (0.0%) | 0 (0.0%) |
| $25,000 to $29,999 | 1 (1.6%) | 0 (0.0%) |
| $30,000 to $34,999 | 0 (0.0%) | 0 (0.0%) |
| $35,000 to $39,999 | 38 (62.3%) | 3 (7.0%) |
| $40,000 to $44,999 | 2 (3.3%) | 0 (0.0%) |
| $45,000 to $49,999 | 1 (1.6%) | 2 (4.6%) |
| $50,000 to $54,999 | 0 (0.0%) | 1 (2.3%) |
| $55,000 to $64,999 | 2 (3.3%) | 5 (11.6%) |
| $65,000 to $74,999 | 2 (3.3%) | 4 (9.3%) |
| $75,000 to $99,999 | 9 (14.7%) | 0 (0.0%) |
| $100,000+ | 2 (3.3%) | 2 (4.6%) |
| Total | 61 (100.0%) | 43 (100.0%) |
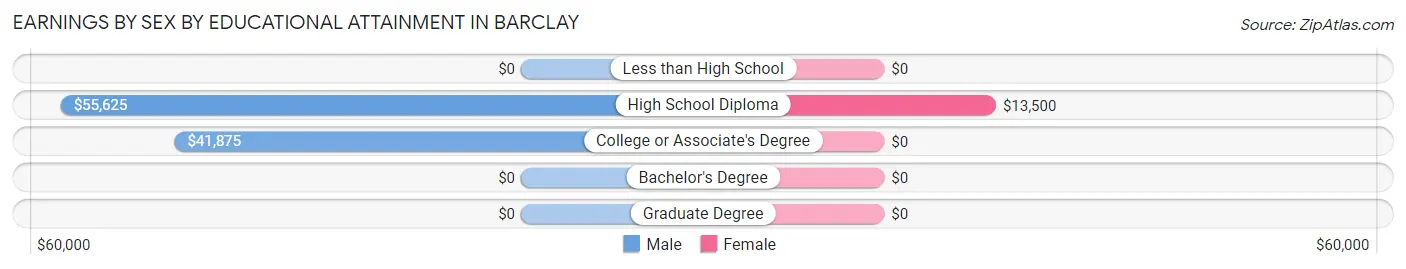
Earnings by Sex by Educational Attainment in Barclay
| Educational Attainment | Male Income | Female Income |
| Less than High School | - | - |
| High School Diploma | $55,625 | $13,500 |
| College or Associate's Degree | $41,875 | $0 |
| Bachelor's Degree | - | - |
| Graduate Degree | - | - |
| Total | $56,875 | $0 |
Family Income in Barclay
Family Income Brackets in Barclay
According to the Barclay family income data, there are 42 families falling into the $50,000 to $74,999 income range, which is the most common income bracket and makes up 68.9% of all families.
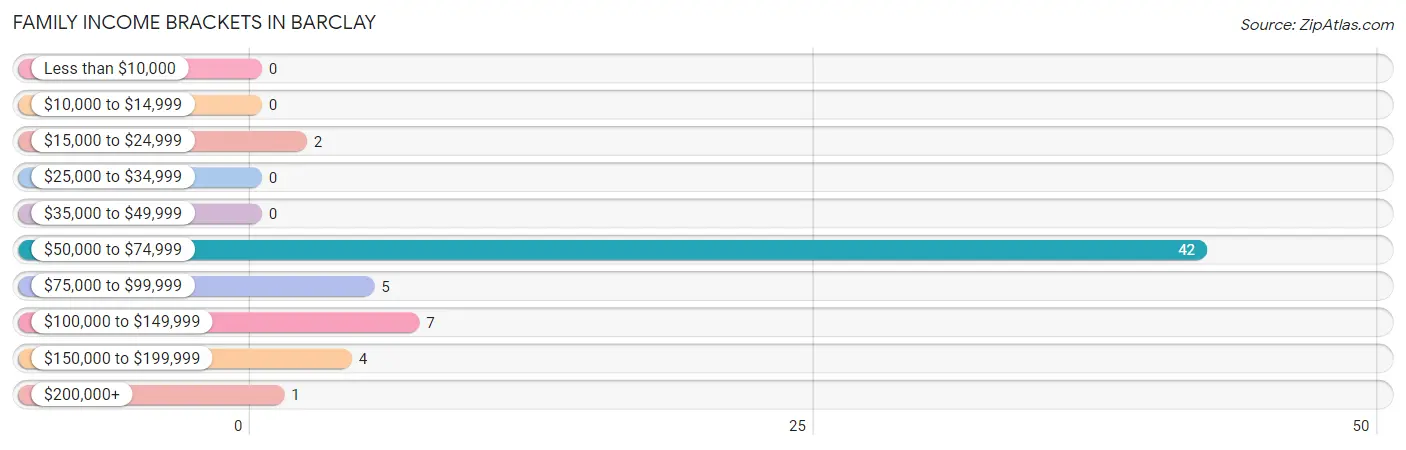
| Income Bracket | # Families | % Families |
| Less than $10,000 | 0 | 0.0% |
| $10,000 to $14,999 | 0 | 0.0% |
| $15,000 to $24,999 | 2 | 3.3% |
| $25,000 to $34,999 | 0 | 0.0% |
| $35,000 to $49,999 | 0 | 0.0% |
| $50,000 to $74,999 | 42 | 68.9% |
| $75,000 to $99,999 | 5 | 8.2% |
| $100,000 to $149,999 | 7 | 11.5% |
| $150,000 to $199,999 | 4 | 6.6% |
| $200,000+ | 1 | 1.6% |
Family Income by Famaliy Size in Barclay
4-person families (6 | 9.8%) account for the highest median family income in Barclay with $133,750 per family, while 2-person families (19 | 31.1%) have the highest median income of $46,458 per family member.
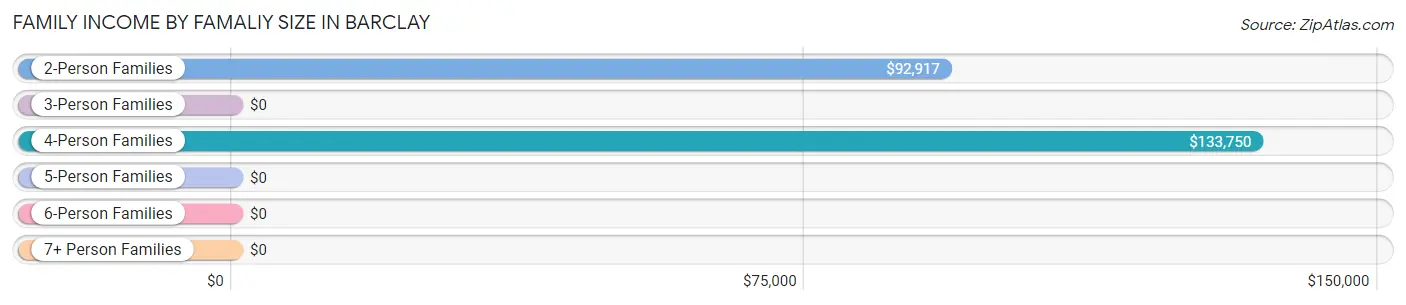
| Income Bracket | # Families | Median Income |
| 2-Person Families | 19 (31.1%) | $92,917 |
| 3-Person Families | 1 (1.6%) | $0 |
| 4-Person Families | 6 (9.8%) | $133,750 |
| 5-Person Families | 34 (55.7%) | $0 |
| 6-Person Families | 0 (0.0%) | $0 |
| 7+ Person Families | 1 (1.6%) | $0 |
| Total | 61 (100.0%) | $54,375 |
Family Income by Number of Earners in Barclay
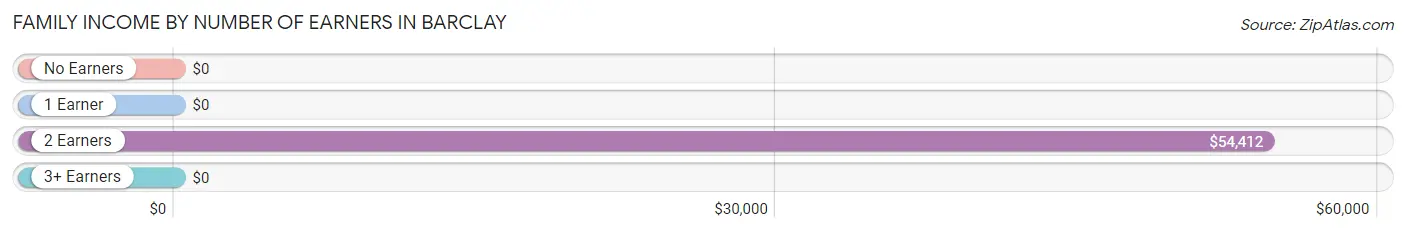
| Number of Earners | # Families | Median Income |
| No Earners | 4 (6.6%) | $0 |
| 1 Earner | 4 (6.6%) | $0 |
| 2 Earners | 52 (85.3%) | $54,412 |
| 3+ Earners | 1 (1.6%) | $0 |
| Total | 61 (100.0%) | $54,375 |
Household Income in Barclay
Household Income Brackets in Barclay
With 45 households falling in the category, the $50,000 to $74,999 income range is the most frequent in Barclay, accounting for 59.2% of all households.
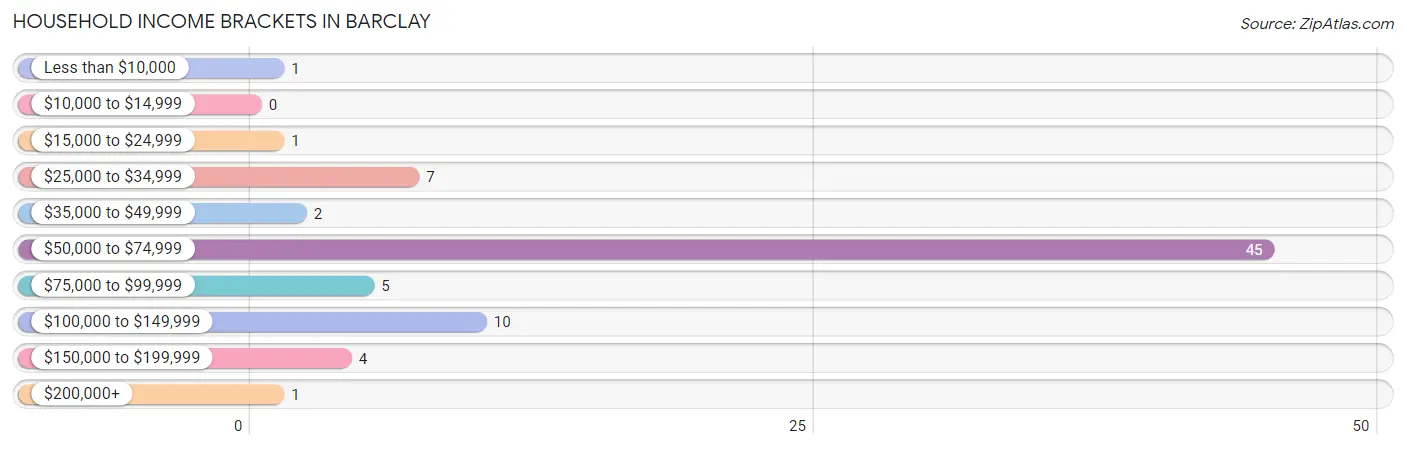
| Income Bracket | # Households | % Households |
| Less than $10,000 | 1 | 1.3% |
| $10,000 to $14,999 | 0 | 0.0% |
| $15,000 to $24,999 | 1 | 1.3% |
| $25,000 to $34,999 | 7 | 9.2% |
| $35,000 to $49,999 | 2 | 2.6% |
| $50,000 to $74,999 | 45 | 59.2% |
| $75,000 to $99,999 | 5 | 6.6% |
| $100,000 to $149,999 | 10 | 13.2% |
| $150,000 to $199,999 | 4 | 5.3% |
| $200,000+ | 1 | 1.3% |
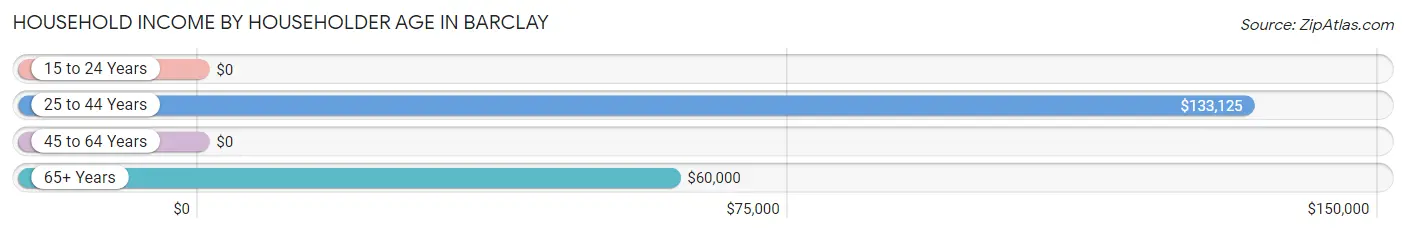
Household Income by Householder Age in Barclay
The median household income in Barclay is $54,276, with the highest median household income of $133,125 found in the 25 to 44 years age bracket for the primary householder. A total of 11 households (14.5%) fall into this category. Meanwhile, the 15 to 24 years age bracket for the primary householder has the lowest median household income of $0, with 34 households (44.7%) in this group.
| Income Bracket | # Households | Median Income |
| 15 to 24 Years | 34 (44.7%) | $0 |
| 25 to 44 Years | 11 (14.5%) | $133,125 |
| 45 to 64 Years | 21 (27.6%) | $0 |
| 65+ Years | 10 (13.2%) | $60,000 |
| Total | 76 (100.0%) | $54,276 |
Poverty in Barclay
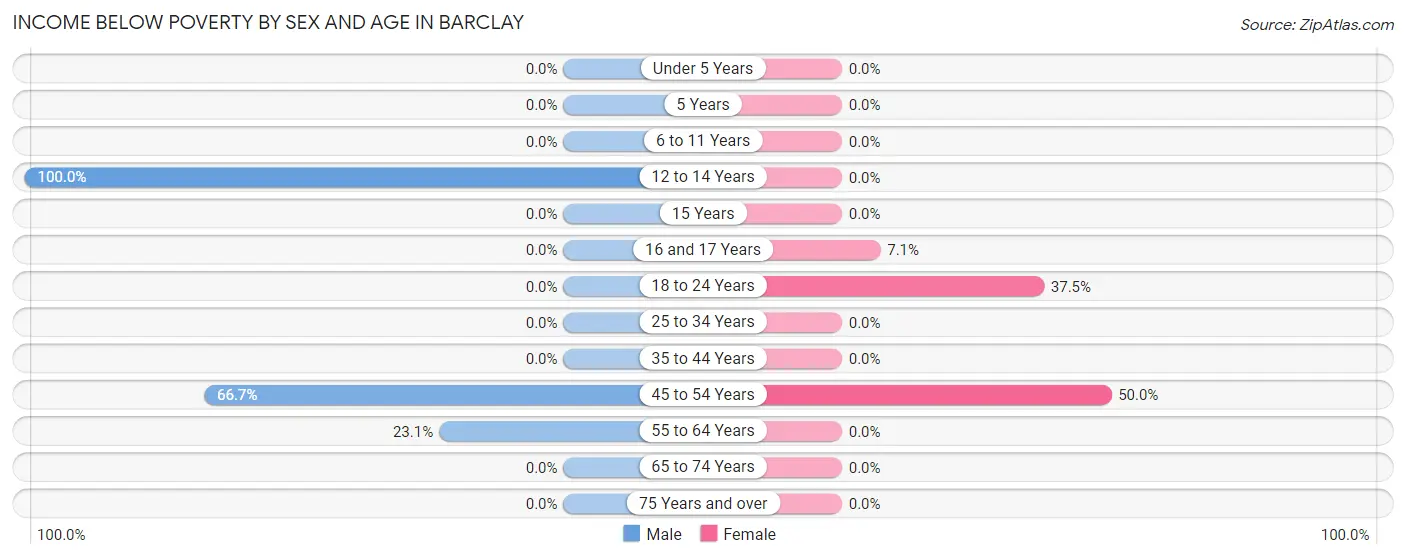
Income Below Poverty by Sex and Age in Barclay
With 12.7% poverty level for males and 10.4% for females among the residents of Barclay, 12 to 14 year old males and 45 to 54 year old females are the most vulnerable to poverty, with 1 males (100.0%) and 6 females (50.0%) in their respective age groups living below the poverty level.
| Age Bracket | Male | Female |
| Under 5 Years | 0 (0.0%) | 0 (0.0%) |
| 5 Years | 0 (0.0%) | 0 (0.0%) |
| 6 to 11 Years | 0 (0.0%) | 0 (0.0%) |
| 12 to 14 Years | 1 (100.0%) | 0 (0.0%) |
| 15 Years | 0 (0.0%) | 0 (0.0%) |
| 16 and 17 Years | 0 (0.0%) | 1 (7.1%) |
| 18 to 24 Years | 0 (0.0%) | 3 (37.5%) |
| 25 to 34 Years | 0 (0.0%) | 0 (0.0%) |
| 35 to 44 Years | 0 (0.0%) | 0 (0.0%) |
| 45 to 54 Years | 6 (66.7%) | 6 (50.0%) |
| 55 to 64 Years | 3 (23.1%) | 0 (0.0%) |
| 65 to 74 Years | 0 (0.0%) | 0 (0.0%) |
| 75 Years and over | 0 (0.0%) | 0 (0.0%) |
| Total | 10 (12.7%) | 10 (10.4%) |
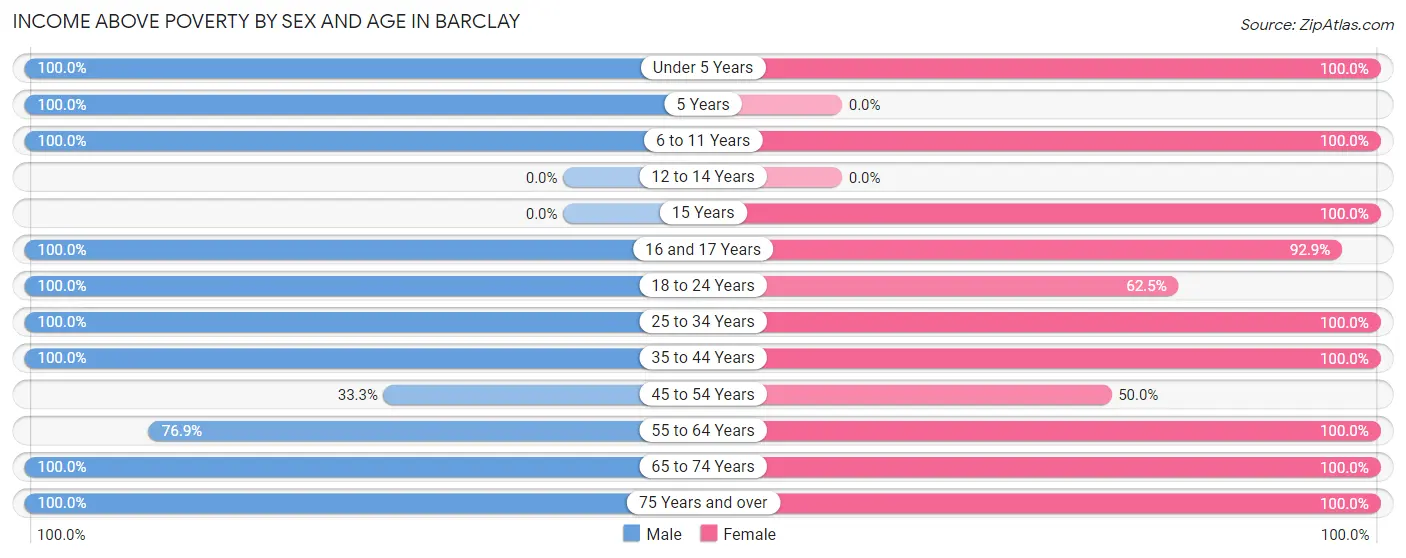
Income Above Poverty by Sex and Age in Barclay
According to the poverty statistics in Barclay, males aged under 5 years and females aged under 5 years are the age groups that are most secure financially, with 100.0% of males and 100.0% of females in these age groups living above the poverty line.
| Age Bracket | Male | Female |
| Under 5 Years | 2 (100.0%) | 11 (100.0%) |
| 5 Years | 1 (100.0%) | 0 (0.0%) |
| 6 to 11 Years | 2 (100.0%) | 13 (100.0%) |
| 12 to 14 Years | 0 (0.0%) | 0 (0.0%) |
| 15 Years | 0 (0.0%) | 2 (100.0%) |
| 16 and 17 Years | 1 (100.0%) | 13 (92.9%) |
| 18 to 24 Years | 34 (100.0%) | 5 (62.5%) |
| 25 to 34 Years | 6 (100.0%) | 4 (100.0%) |
| 35 to 44 Years | 4 (100.0%) | 15 (100.0%) |
| 45 to 54 Years | 3 (33.3%) | 6 (50.0%) |
| 55 to 64 Years | 10 (76.9%) | 7 (100.0%) |
| 65 to 74 Years | 2 (100.0%) | 2 (100.0%) |
| 75 Years and over | 4 (100.0%) | 8 (100.0%) |
| Total | 69 (87.3%) | 86 (89.6%) |
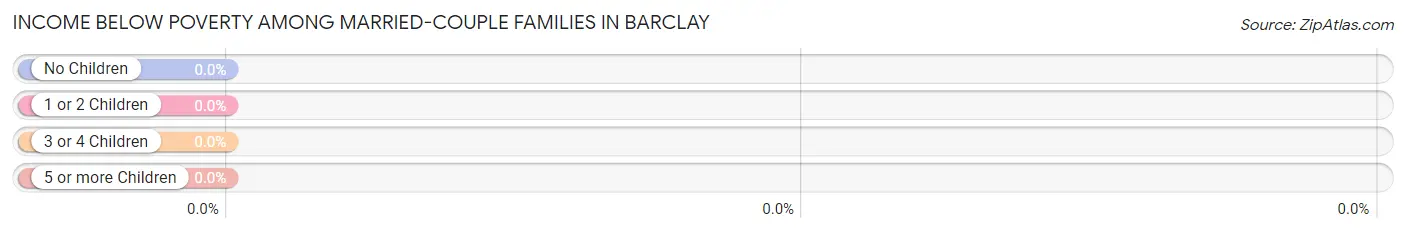
Income Below Poverty Among Married-Couple Families in Barclay
| Children | Above Poverty | Below Poverty |
| No Children | 20 (100.0%) | 0 (0.0%) |
| 1 or 2 Children | 4 (100.0%) | 0 (0.0%) |
| 3 or 4 Children | 1 (100.0%) | 0 (0.0%) |
| 5 or more Children | 0 (0.0%) | 0 (0.0%) |
| Total | 25 (100.0%) | 0 (0.0%) |
Income Below Poverty Among Single-Parent Households in Barclay
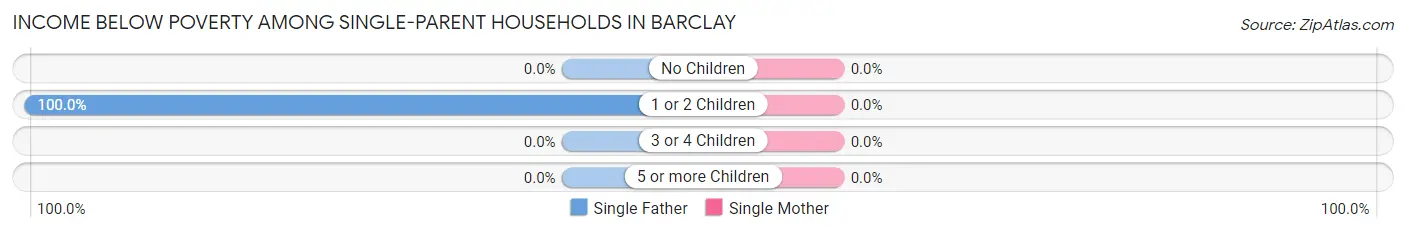
| Children | Single Father | Single Mother |
| No Children | 0 (0.0%) | 0 (0.0%) |
| 1 or 2 Children | 2 (100.0%) | 0 (0.0%) |
| 3 or 4 Children | 0 (0.0%) | 0 (0.0%) |
| 5 or more Children | 0 (0.0%) | 0 (0.0%) |
| Total | 2 (5.6%) | 0 (0.0%) |
Income Below Poverty Among Married-Couple vs Single-Parent Households in Barclay
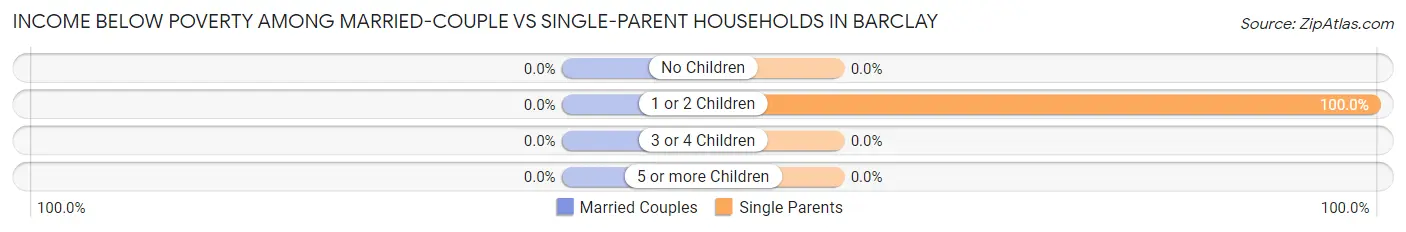
| Children | Married-Couple Families | Single-Parent Households |
| No Children | 0 (0.0%) | 0 (0.0%) |
| 1 or 2 Children | 0 (0.0%) | 2 (100.0%) |
| 3 or 4 Children | 0 (0.0%) | 0 (0.0%) |
| 5 or more Children | 0 (0.0%) | 0 (0.0%) |
| Total | 0 (0.0%) | 2 (5.6%) |
Race in Barclay
The most populous races in Barclay are Hispanic or Latino (90 | 51.4%), Some other Race (87 | 49.7%), and White / Caucasian (75 | 42.9%).
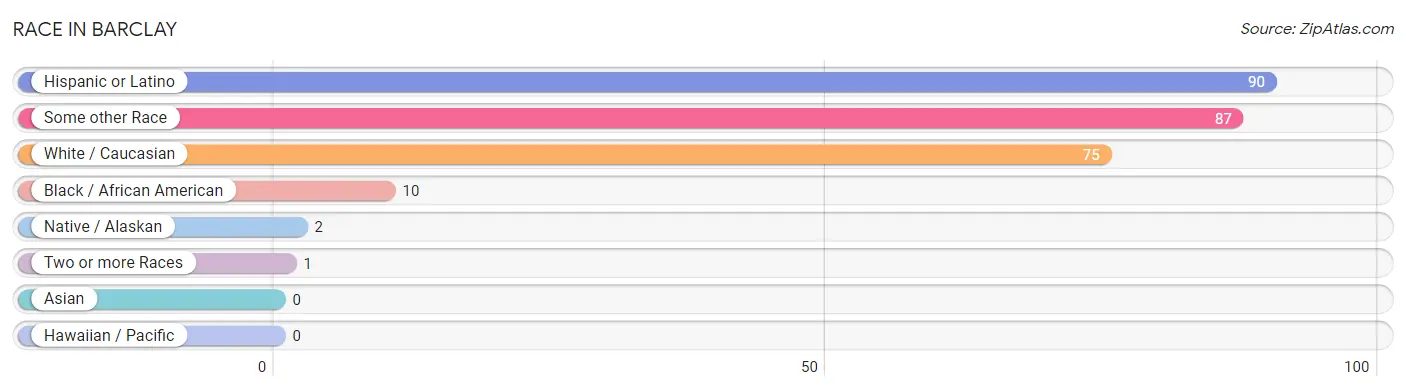
| Race | # Population | % Population |
| Asian | 0 | 0.0% |
| Black / African American | 10 | 5.7% |
| Hawaiian / Pacific | 0 | 0.0% |
| Hispanic or Latino | 90 | 51.4% |
| Native / Alaskan | 2 | 1.1% |
| White / Caucasian | 75 | 42.9% |
| Two or more Races | 1 | 0.6% |
| Some other Race | 87 | 49.7% |
| Total | 175 | 100.0% |
Ancestry in Barclay
The most populous ancestries reported in Barclay are Central American (76 | 43.4%), Guatemalan (76 | 43.4%), German (15 | 8.6%), English (14 | 8.0%), and Mexican (14 | 8.0%), together accounting for 111.4% of all Barclay residents.
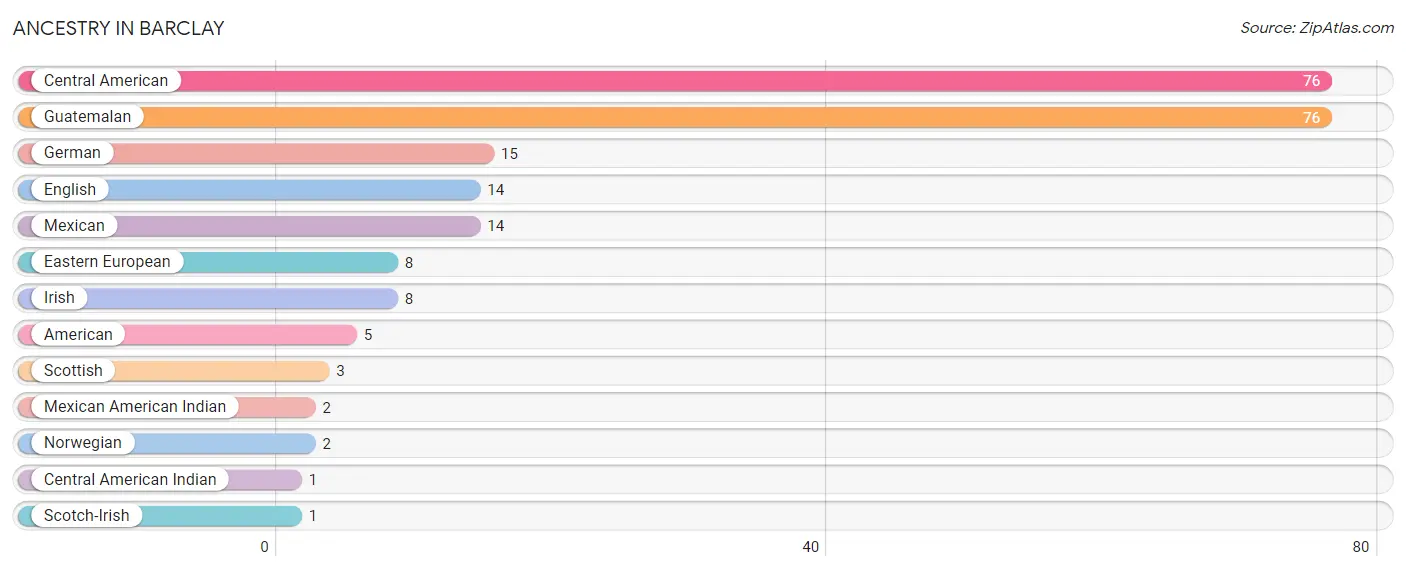
| Ancestry | # Population | % Population |
| American | 5 | 2.9% |
| Central American | 76 | 43.4% |
| Central American Indian | 1 | 0.6% |
| Eastern European | 8 | 4.6% |
| English | 14 | 8.0% |
| German | 15 | 8.6% |
| Guatemalan | 76 | 43.4% |
| Irish | 8 | 4.6% |
| Mexican | 14 | 8.0% |
| Mexican American Indian | 2 | 1.1% |
| Norwegian | 2 | 1.1% |
| Scotch-Irish | 1 | 0.6% |
| Scottish | 3 | 1.7% | View All 13 Rows |
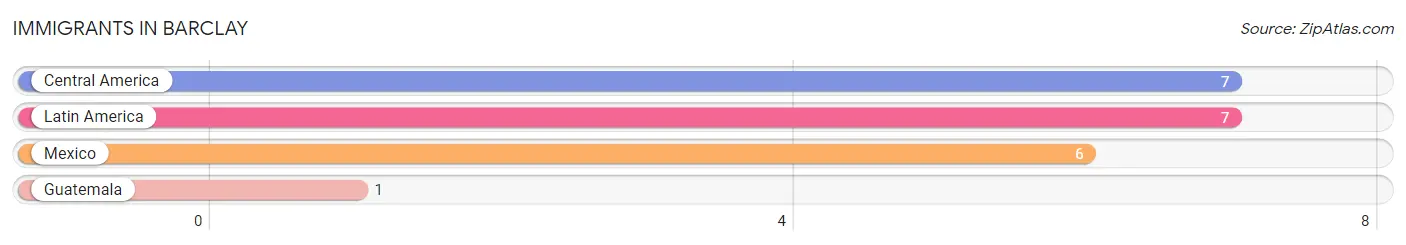
Immigrants in Barclay
The most numerous immigrant groups reported in Barclay came from Central America (7 | 4.0%), Latin America (7 | 4.0%), Mexico (6 | 3.4%), and Guatemala (1 | 0.6%), together accounting for 12.0% of all Barclay residents.
| Immigration Origin | # Population | % Population |
| Central America | 7 | 4.0% |
| Guatemala | 1 | 0.6% |
| Latin America | 7 | 4.0% |
| Mexico | 6 | 3.4% | View All 4 Rows |
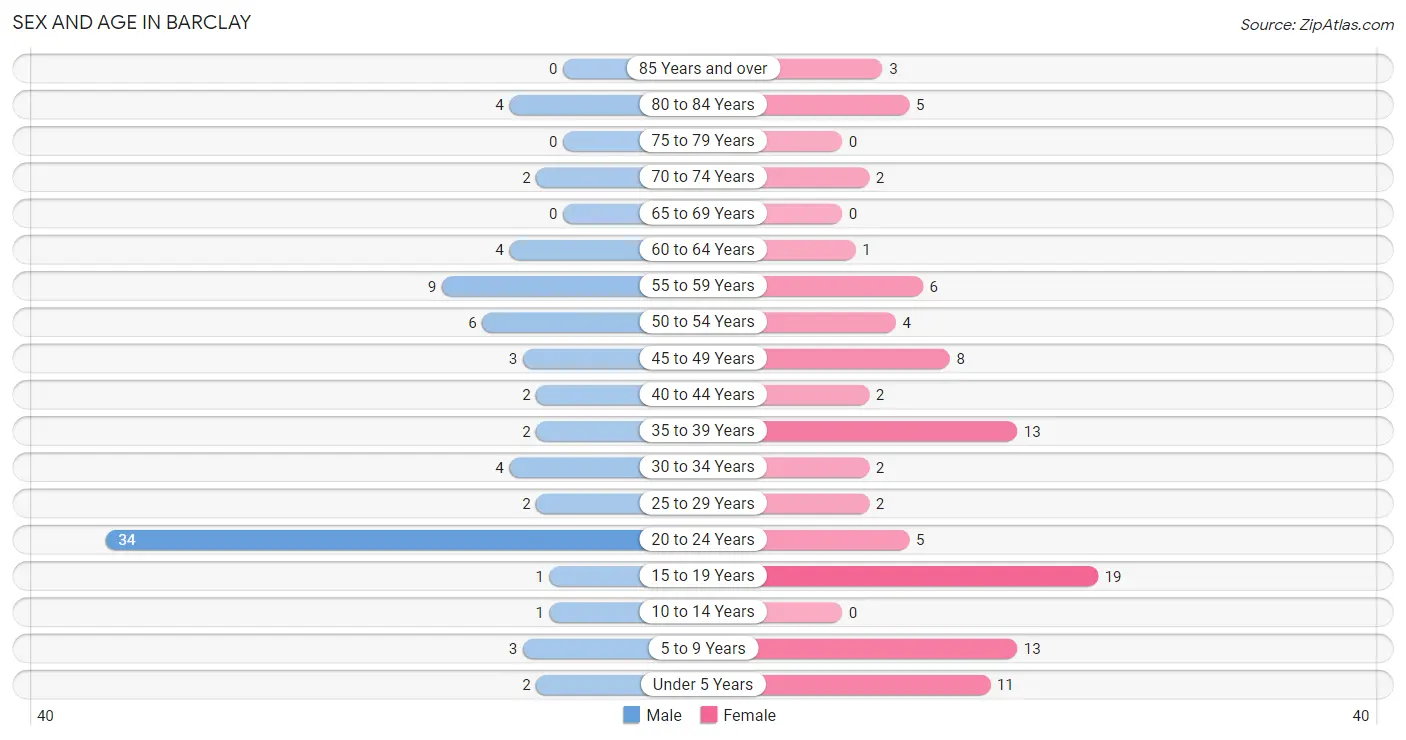
Sex and Age in Barclay
Sex and Age in Barclay
The most populous age groups in Barclay are 20 to 24 Years (34 | 43.0%) for men and 15 to 19 Years (19 | 19.8%) for women.
| Age Bracket | Male | Female |
| Under 5 Years | 2 (2.5%) | 11 (11.5%) |
| 5 to 9 Years | 3 (3.8%) | 13 (13.5%) |
| 10 to 14 Years | 1 (1.3%) | 0 (0.0%) |
| 15 to 19 Years | 1 (1.3%) | 19 (19.8%) |
| 20 to 24 Years | 34 (43.0%) | 5 (5.2%) |
| 25 to 29 Years | 2 (2.5%) | 2 (2.1%) |
| 30 to 34 Years | 4 (5.1%) | 2 (2.1%) |
| 35 to 39 Years | 2 (2.5%) | 13 (13.5%) |
| 40 to 44 Years | 2 (2.5%) | 2 (2.1%) |
| 45 to 49 Years | 3 (3.8%) | 8 (8.3%) |
| 50 to 54 Years | 6 (7.6%) | 4 (4.2%) |
| 55 to 59 Years | 9 (11.4%) | 6 (6.2%) |
| 60 to 64 Years | 4 (5.1%) | 1 (1.0%) |
| 65 to 69 Years | 0 (0.0%) | 0 (0.0%) |
| 70 to 74 Years | 2 (2.5%) | 2 (2.1%) |
| 75 to 79 Years | 0 (0.0%) | 0 (0.0%) |
| 80 to 84 Years | 4 (5.1%) | 5 (5.2%) |
| 85 Years and over | 0 (0.0%) | 3 (3.1%) |
| Total | 79 (100.0%) | 96 (100.0%) |
Families and Households in Barclay
Median Family Size in Barclay
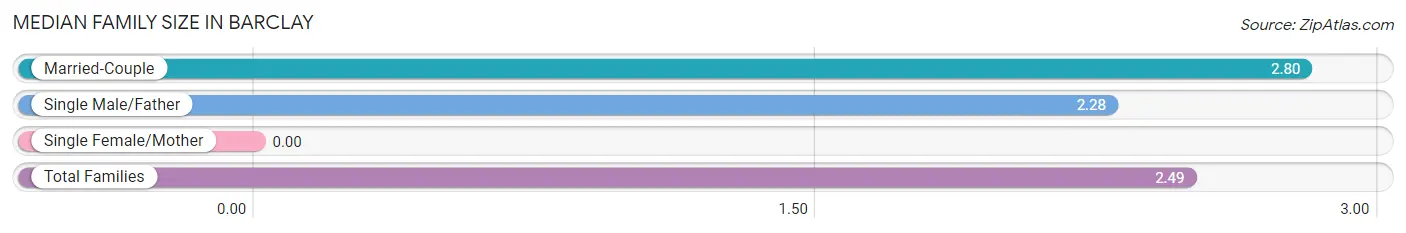
| Family Type | # Families | Family Size |
| Married-Couple | 25 (41.0%) | 2.80 |
| Single Male/Father | 36 (59.0%) | 2.28 |
| Single Female/Mother | 0 (0.0%) | - |
| Total Families | 61 (100.0%) | 2.49 |
Median Household Size in Barclay
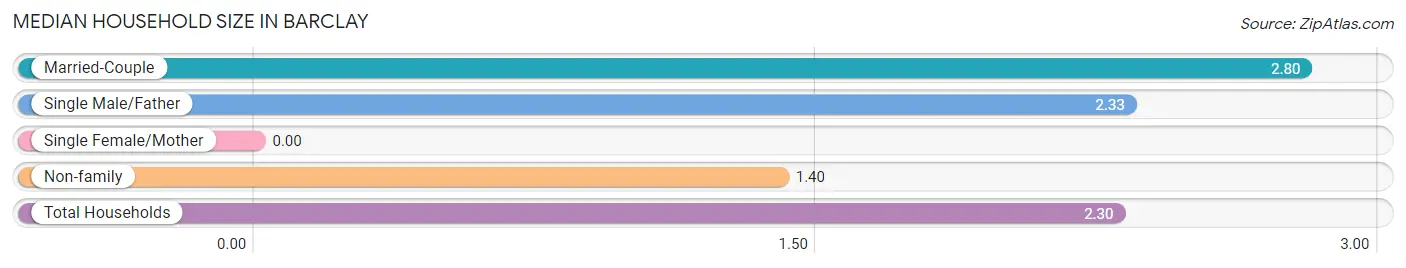
| Household Type | # Households | Household Size |
| Married-Couple | 25 (32.9%) | 2.80 |
| Single Male/Father | 36 (47.4%) | 2.33 |
| Single Female/Mother | 0 (0.0%) | - |
| Non-family | 15 (19.7%) | 1.40 |
| Total Households | 76 (100.0%) | 2.30 |
Household Size by Marriage Status in Barclay
Out of a total of 76 households in Barclay, 61 (80.3%) are family households, while 15 (19.7%) are nonfamily households. The most numerous type of family households are 5-person households, comprising 36, and the most common type of nonfamily households are 1-person households, comprising 9.
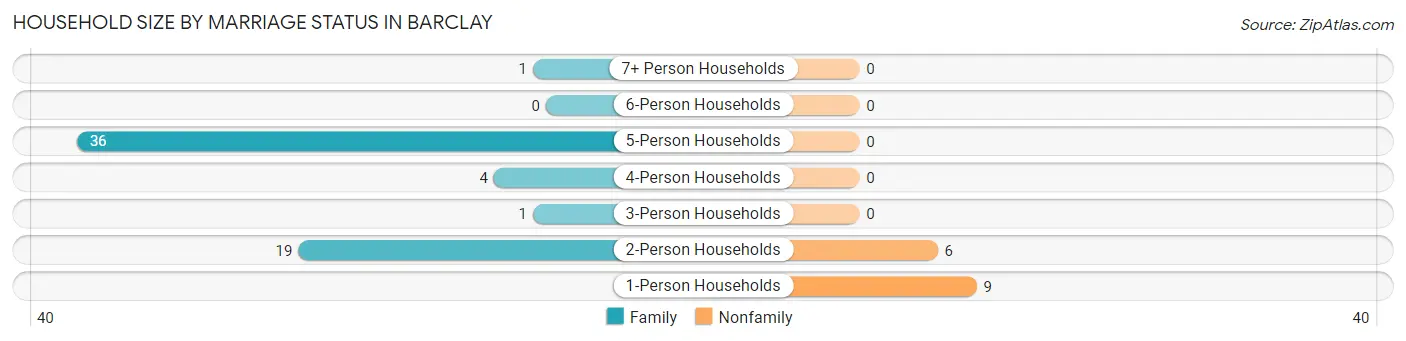
| Household Size | Family Households | Nonfamily Households |
| 1-Person Households | - | 9 (11.8%) |
| 2-Person Households | 19 (25.0%) | 6 (7.9%) |
| 3-Person Households | 1 (1.3%) | 0 (0.0%) |
| 4-Person Households | 4 (5.3%) | 0 (0.0%) |
| 5-Person Households | 36 (47.4%) | 0 (0.0%) |
| 6-Person Households | 0 (0.0%) | 0 (0.0%) |
| 7+ Person Households | 1 (1.3%) | 0 (0.0%) |
| Total | 61 (80.3%) | 15 (19.7%) |
Female Fertility in Barclay
Fertility by Age in Barclay
| Age Bracket | Women with Births | Births / 1,000 Women |
| 15 to 19 years | 0 (0.0%) | 0.0 |
| 20 to 34 years | 0 (0.0%) | 0.0 |
| 35 to 50 years | 0 (0.0%) | 0.0 |
| Total | 0 (0.0%) | 0.0 |
Fertility by Age by Marriage Status in Barclay
| Age Bracket | Married | Unmarried |
| 15 to 19 years | 0 (0.0%) | 0 (0.0%) |
| 20 to 34 years | 0 (0.0%) | 0 (0.0%) |
| 35 to 50 years | 0 (0.0%) | 0 (0.0%) |
| Total | 0 (0.0%) | 0 (0.0%) |
Fertility by Education in Barclay
| Educational Attainment | Women with Births | Births / 1,000 Women |
| Less than High School | 0 (0.0%) | 0.0 |
| High School Diploma | 0 (0.0%) | 0.0 |
| College or Associate's Degree | 0 (0.0%) | 0.0 |
| Bachelor's Degree | 0 (0.0%) | 0.0 |
| Graduate Degree | 0 (0.0%) | 0.0 |
| Total | 0 (0.0%) | 0.0 |
Fertility by Education by Marriage Status in Barclay
| Educational Attainment | Married | Unmarried |
| Less than High School | 0 (0.0%) | 0 (0.0%) |
| High School Diploma | 0 (0.0%) | 0 (0.0%) |
| College or Associate's Degree | 0 (0.0%) | 0 (0.0%) |
| Bachelor's Degree | 0 (0.0%) | 0 (0.0%) |
| Graduate Degree | 0 (0.0%) | 0 (0.0%) |
| Total | 0 (0.0%) | 0 (0.0%) |
Employment Characteristics in Barclay
Employment by Class of Employer in Barclay
Among the 101 employed individuals in Barclay, private company employees (82 | 81.2%), not-for-profit organizations (12 | 11.9%), and local government employees (3 | 3.0%) make up the most common classes of employment.
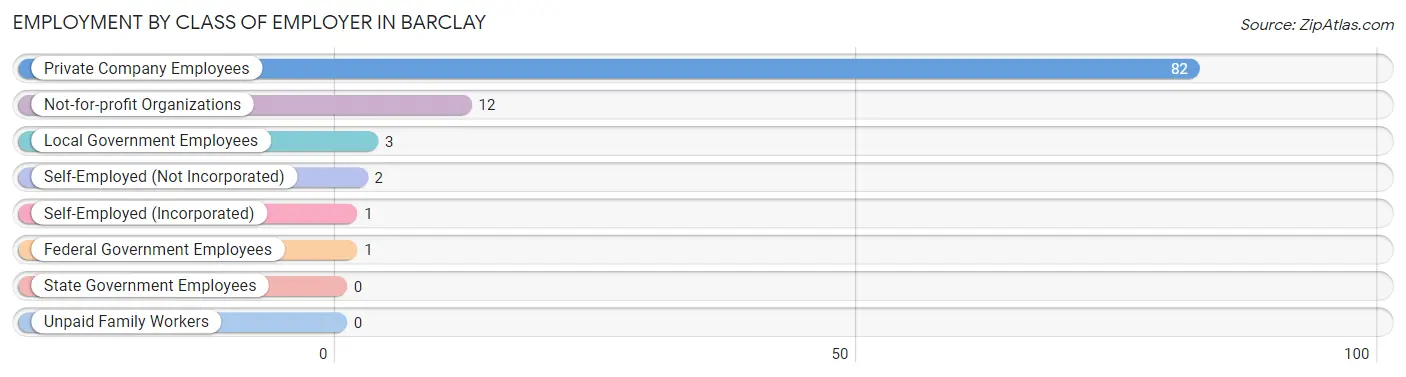
| Employer Class | # Employees | % Employees |
| Private Company Employees | 82 | 81.2% |
| Self-Employed (Incorporated) | 1 | 1.0% |
| Self-Employed (Not Incorporated) | 2 | 2.0% |
| Not-for-profit Organizations | 12 | 11.9% |
| Local Government Employees | 3 | 3.0% |
| State Government Employees | 0 | 0.0% |
| Federal Government Employees | 1 | 1.0% |
| Unpaid Family Workers | 0 | 0.0% |
| Total | 101 | 100.0% |
Employment Status by Age in Barclay
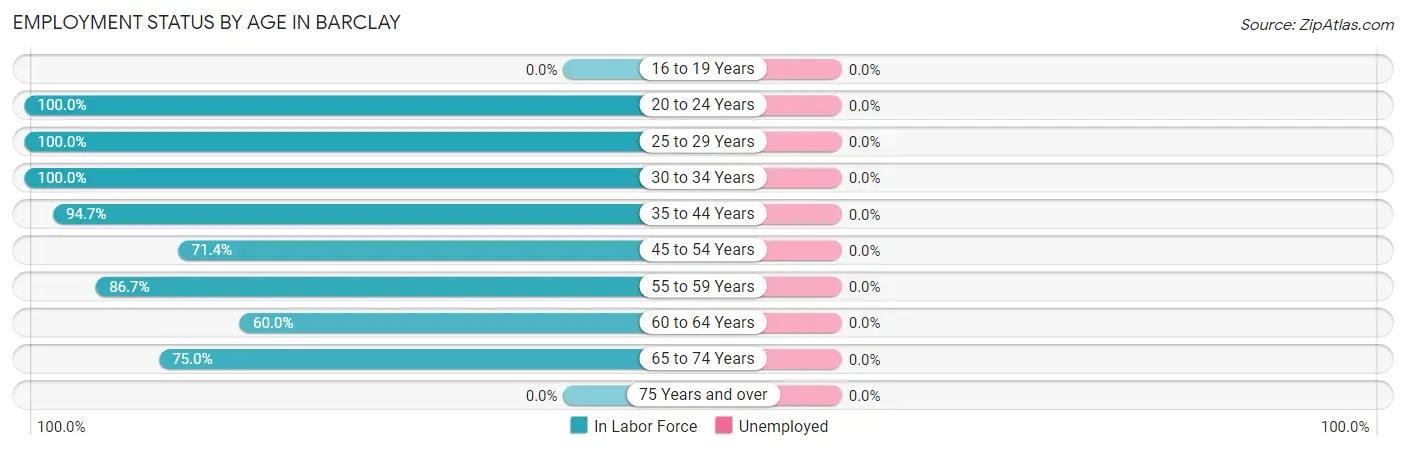
| Age Bracket | In Labor Force | Unemployed |
| 16 to 19 Years | 0 (0.0%) | 0 (0.0%) |
| 20 to 24 Years | 39 (100.0%) | 0 (0.0%) |
| 25 to 29 Years | 4 (100.0%) | 0 (0.0%) |
| 30 to 34 Years | 6 (100.0%) | 0 (0.0%) |
| 35 to 44 Years | 18 (94.7%) | 0 (0.0%) |
| 45 to 54 Years | 15 (71.4%) | 0 (0.0%) |
| 55 to 59 Years | 13 (86.7%) | 0 (0.0%) |
| 60 to 64 Years | 3 (60.0%) | 0 (0.0%) |
| 65 to 74 Years | 3 (75.0%) | 0 (0.0%) |
| 75 Years and over | 0 (0.0%) | 0 (0.0%) |
| Total | 101 (70.6%) | 0 (0.0%) |
Employment Status by Educational Attainment in Barclay
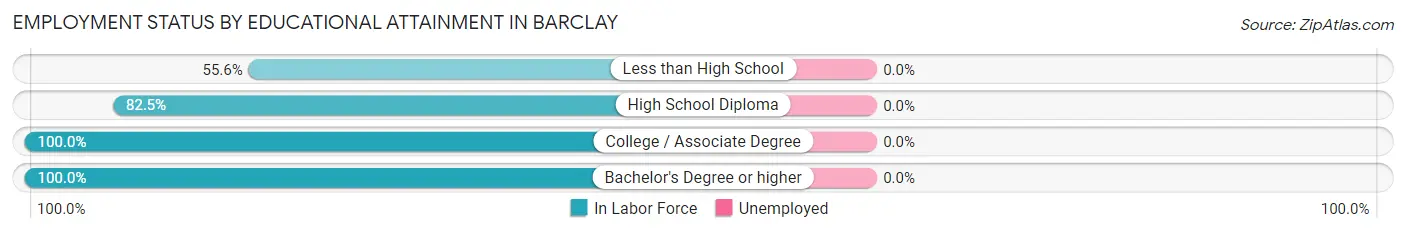
| Educational Attainment | In Labor Force | Unemployed |
| Less than High School | 5 (55.6%) | 0 (0.0%) |
| High School Diploma | 33 (82.5%) | 0 (0.0%) |
| College / Associate Degree | 12 (100.0%) | 0 (0.0%) |
| Bachelor's Degree or higher | 9 (100.0%) | 0 (0.0%) |
| Total | 59 (84.3%) | 0 (0.0%) |
Employment Occupations by Sex in Barclay
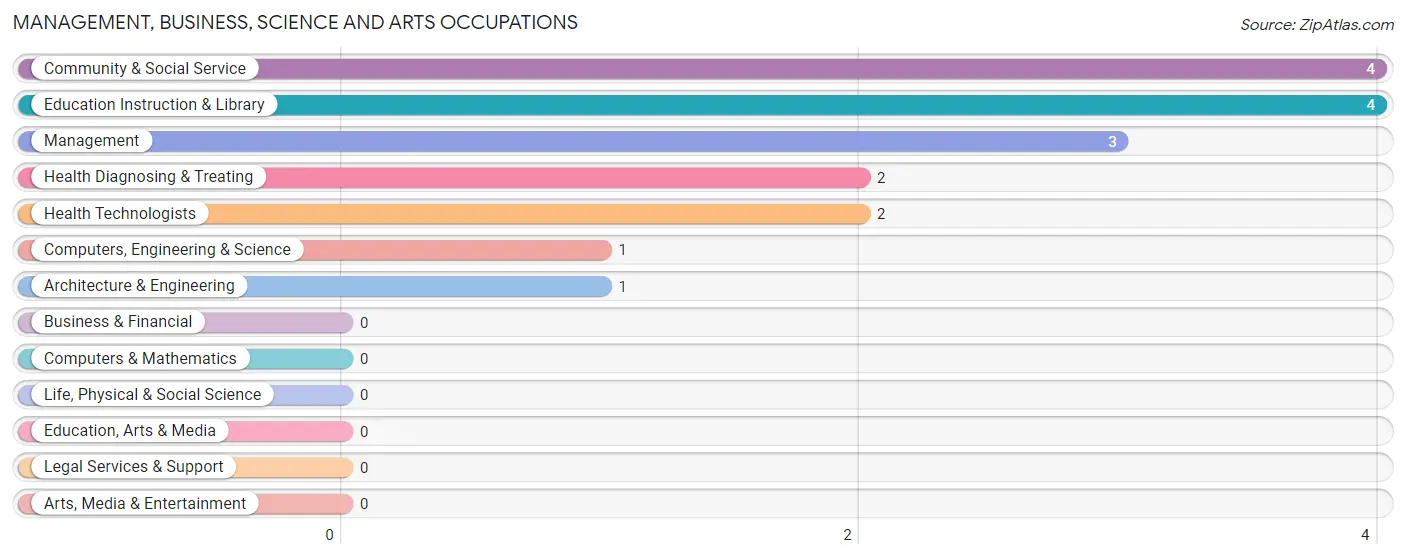
Management, Business, Science and Arts Occupations
The most common Management, Business, Science and Arts occupations in Barclay are Community & Social Service (4 | 4.0%), Education Instruction & Library (4 | 4.0%), Management (3 | 3.0%), Health Diagnosing & Treating (2 | 2.0%), and Health Technologists (2 | 2.0%).
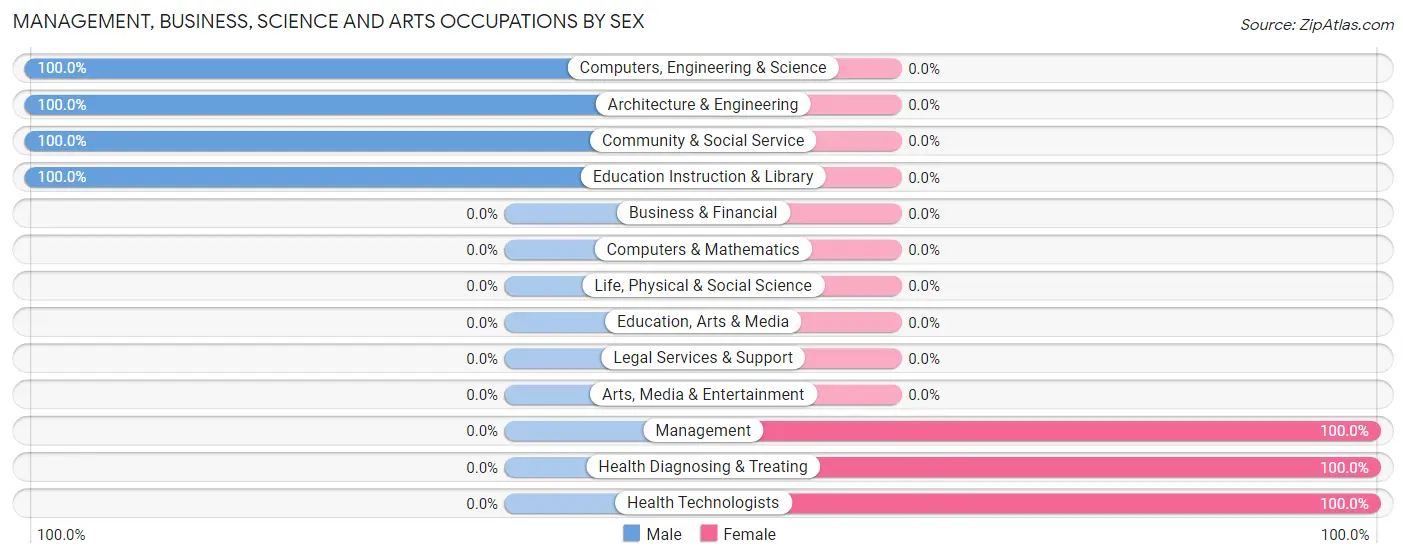
Management, Business, Science and Arts Occupations by Sex
Within the Management, Business, Science and Arts occupations in Barclay, the most male-oriented occupations are Computers, Engineering & Science (100.0%), Architecture & Engineering (100.0%), and Community & Social Service (100.0%), while the most female-oriented occupations are Management (100.0%), Health Diagnosing & Treating (100.0%), and Health Technologists (100.0%).
| Occupation | Male | Female |
| Management | 0 (0.0%) | 3 (100.0%) |
| Business & Financial | 0 (0.0%) | 0 (0.0%) |
| Computers, Engineering & Science | 1 (100.0%) | 0 (0.0%) |
| Computers & Mathematics | 0 (0.0%) | 0 (0.0%) |
| Architecture & Engineering | 1 (100.0%) | 0 (0.0%) |
| Life, Physical & Social Science | 0 (0.0%) | 0 (0.0%) |
| Community & Social Service | 4 (100.0%) | 0 (0.0%) |
| Education, Arts & Media | 0 (0.0%) | 0 (0.0%) |
| Legal Services & Support | 0 (0.0%) | 0 (0.0%) |
| Education Instruction & Library | 4 (100.0%) | 0 (0.0%) |
| Arts, Media & Entertainment | 0 (0.0%) | 0 (0.0%) |
| Health Diagnosing & Treating | 0 (0.0%) | 2 (100.0%) |
| Health Technologists | 0 (0.0%) | 2 (100.0%) |
| Total (Category) | 5 (50.0%) | 5 (50.0%) |
| Total (Overall) | 58 (57.4%) | 43 (42.6%) |
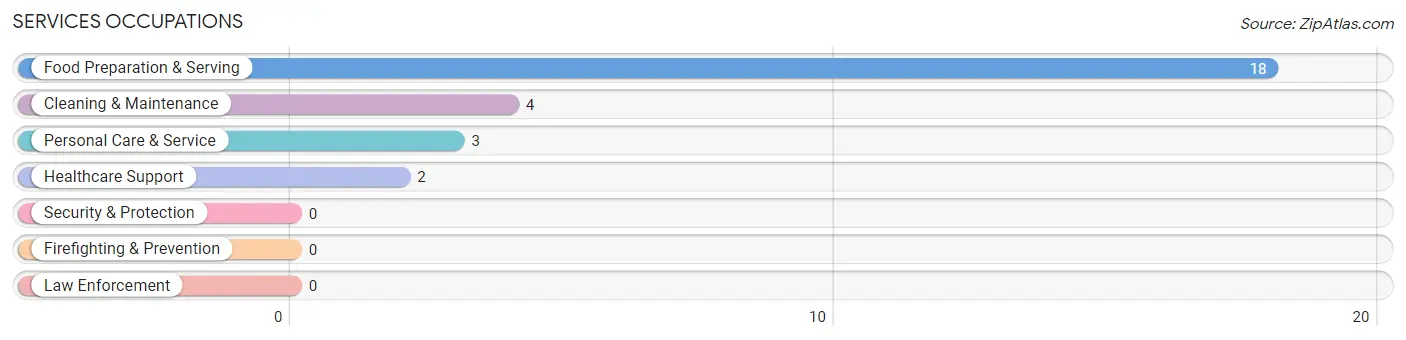
Services Occupations
The most common Services occupations in Barclay are Food Preparation & Serving (18 | 17.8%), Cleaning & Maintenance (4 | 4.0%), Personal Care & Service (3 | 3.0%), and Healthcare Support (2 | 2.0%).
Services Occupations by Sex
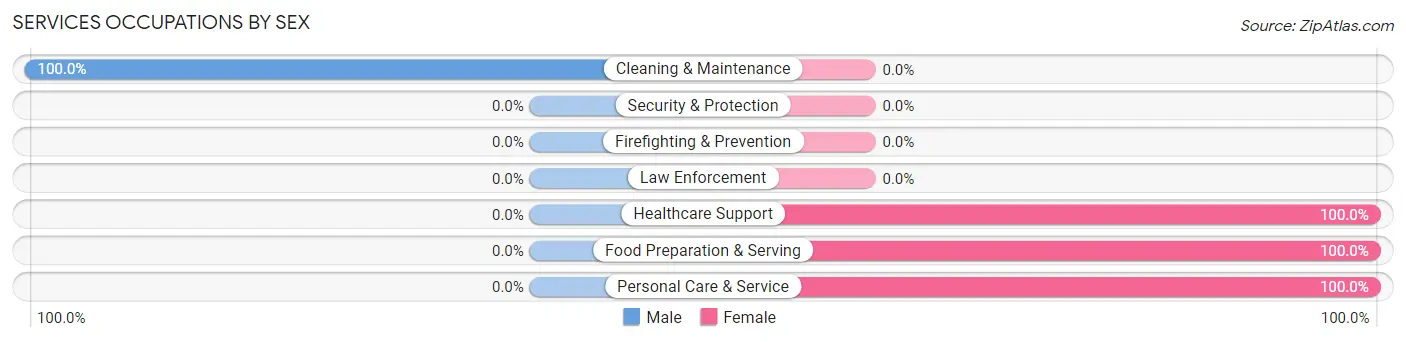
| Occupation | Male | Female |
| Healthcare Support | 0 (0.0%) | 2 (100.0%) |
| Security & Protection | 0 (0.0%) | 0 (0.0%) |
| Firefighting & Prevention | 0 (0.0%) | 0 (0.0%) |
| Law Enforcement | 0 (0.0%) | 0 (0.0%) |
| Food Preparation & Serving | 0 (0.0%) | 18 (100.0%) |
| Cleaning & Maintenance | 4 (100.0%) | 0 (0.0%) |
| Personal Care & Service | 0 (0.0%) | 3 (100.0%) |
| Total (Category) | 4 (14.8%) | 23 (85.2%) |
| Total (Overall) | 58 (57.4%) | 43 (42.6%) |
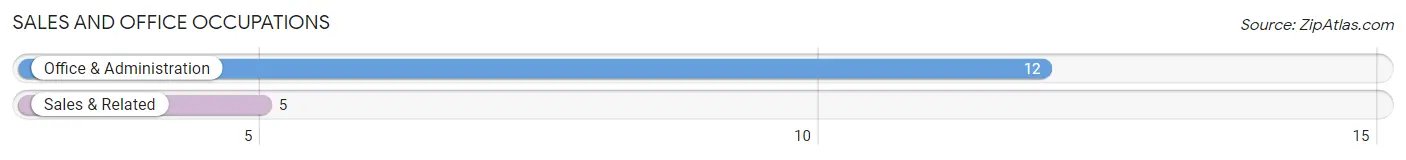
Sales and Office Occupations
The most common Sales and Office occupations in Barclay are Office & Administration (12 | 11.9%), and Sales & Related (5 | 5.0%).
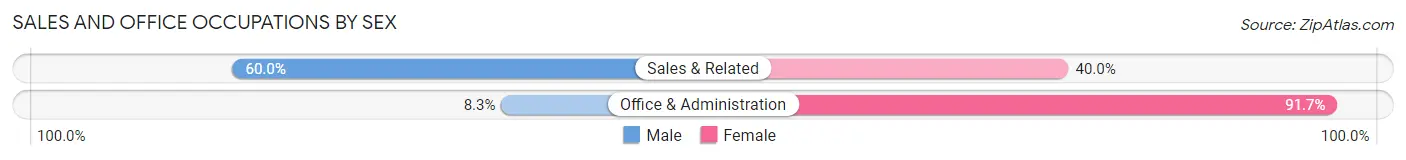
Sales and Office Occupations by Sex
| Occupation | Male | Female |
| Sales & Related | 3 (60.0%) | 2 (40.0%) |
| Office & Administration | 1 (8.3%) | 11 (91.7%) |
| Total (Category) | 4 (23.5%) | 13 (76.5%) |
| Total (Overall) | 58 (57.4%) | 43 (42.6%) |
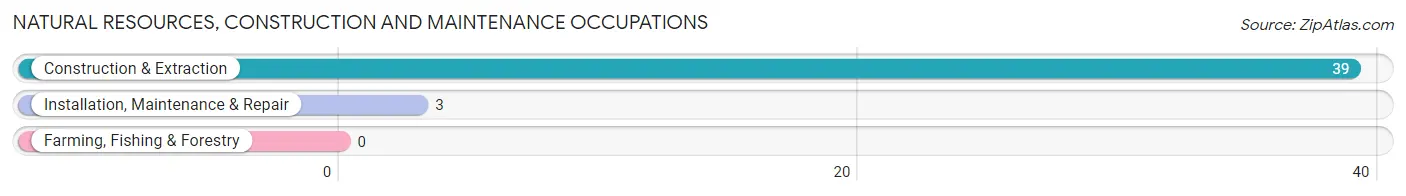
Natural Resources, Construction and Maintenance Occupations
The most common Natural Resources, Construction and Maintenance occupations in Barclay are Construction & Extraction (39 | 38.6%), and Installation, Maintenance & Repair (3 | 3.0%).
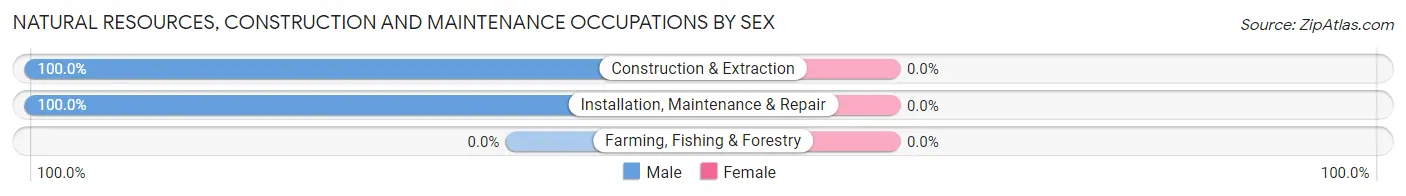
Natural Resources, Construction and Maintenance Occupations by Sex
| Occupation | Male | Female |
| Farming, Fishing & Forestry | 0 (0.0%) | 0 (0.0%) |
| Construction & Extraction | 39 (100.0%) | 0 (0.0%) |
| Installation, Maintenance & Repair | 3 (100.0%) | 0 (0.0%) |
| Total (Category) | 42 (100.0%) | 0 (0.0%) |
| Total (Overall) | 58 (57.4%) | 43 (42.6%) |
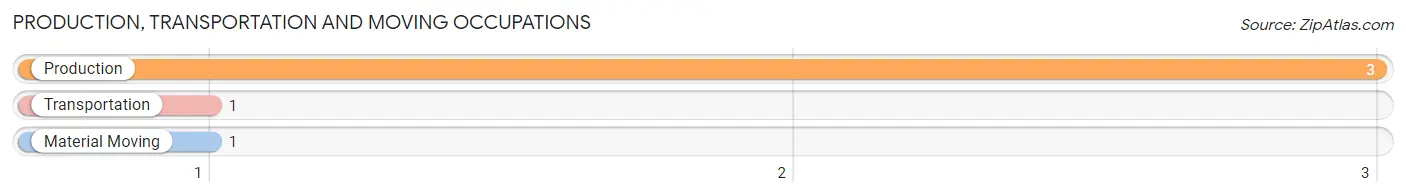
Production, Transportation and Moving Occupations
The most common Production, Transportation and Moving occupations in Barclay are Production (3 | 3.0%), Transportation (1 | 1.0%), and Material Moving (1 | 1.0%).
Production, Transportation and Moving Occupations by Sex
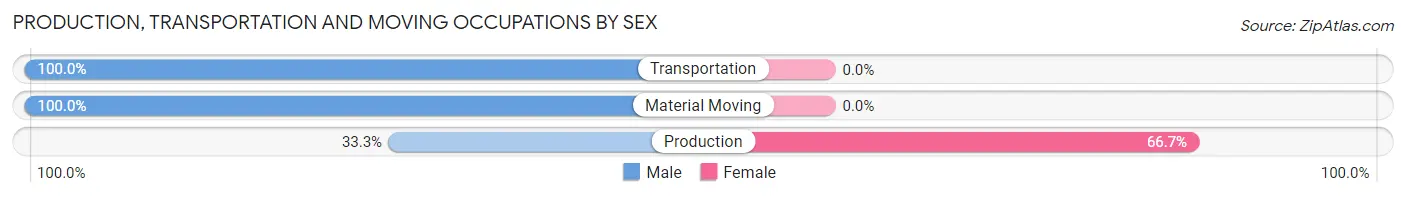
| Occupation | Male | Female |
| Production | 1 (33.3%) | 2 (66.7%) |
| Transportation | 1 (100.0%) | 0 (0.0%) |
| Material Moving | 1 (100.0%) | 0 (0.0%) |
| Total (Category) | 3 (60.0%) | 2 (40.0%) |
| Total (Overall) | 58 (57.4%) | 43 (42.6%) |
Employment Industries by Sex in Barclay
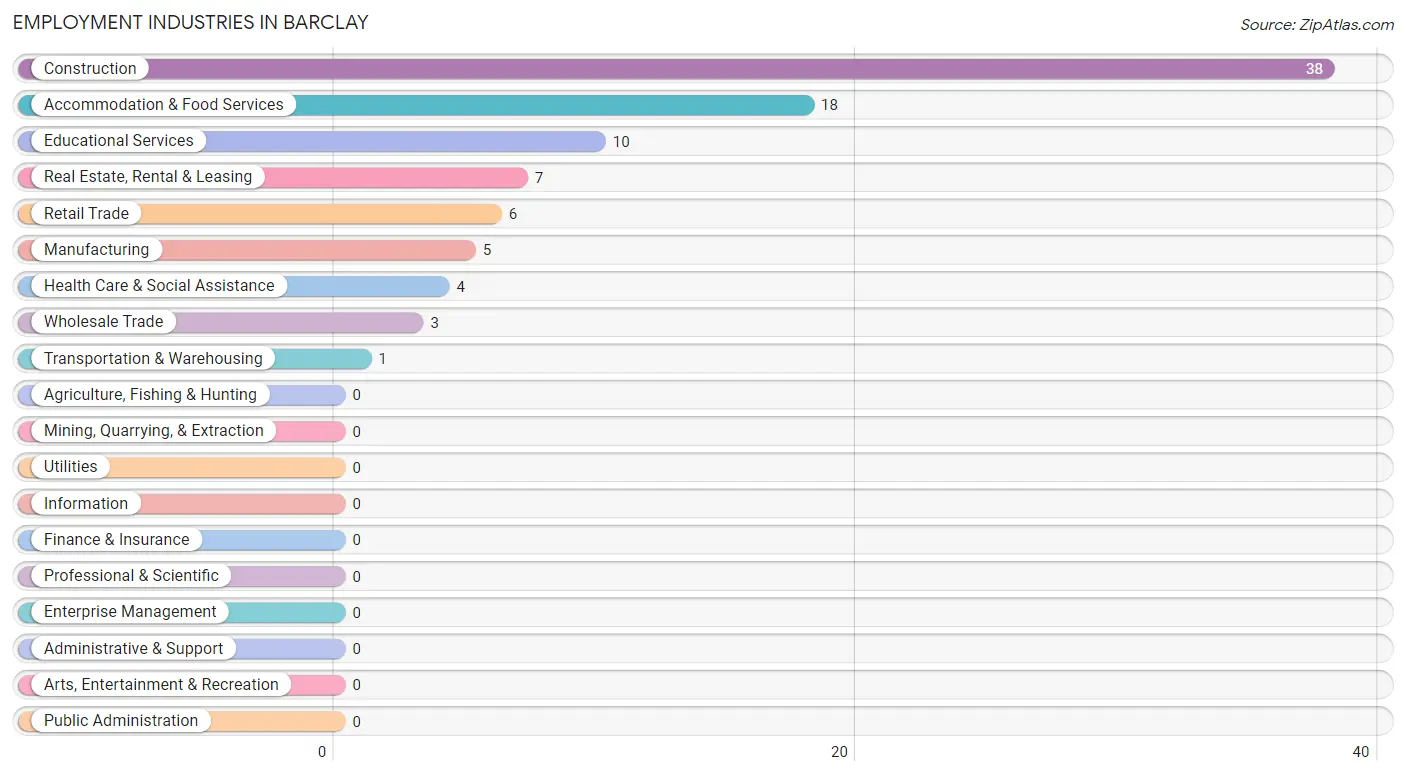
Employment Industries in Barclay
The major employment industries in Barclay include Construction (38 | 37.6%), Accommodation & Food Services (18 | 17.8%), Educational Services (10 | 9.9%), Real Estate, Rental & Leasing (7 | 6.9%), and Retail Trade (6 | 5.9%).
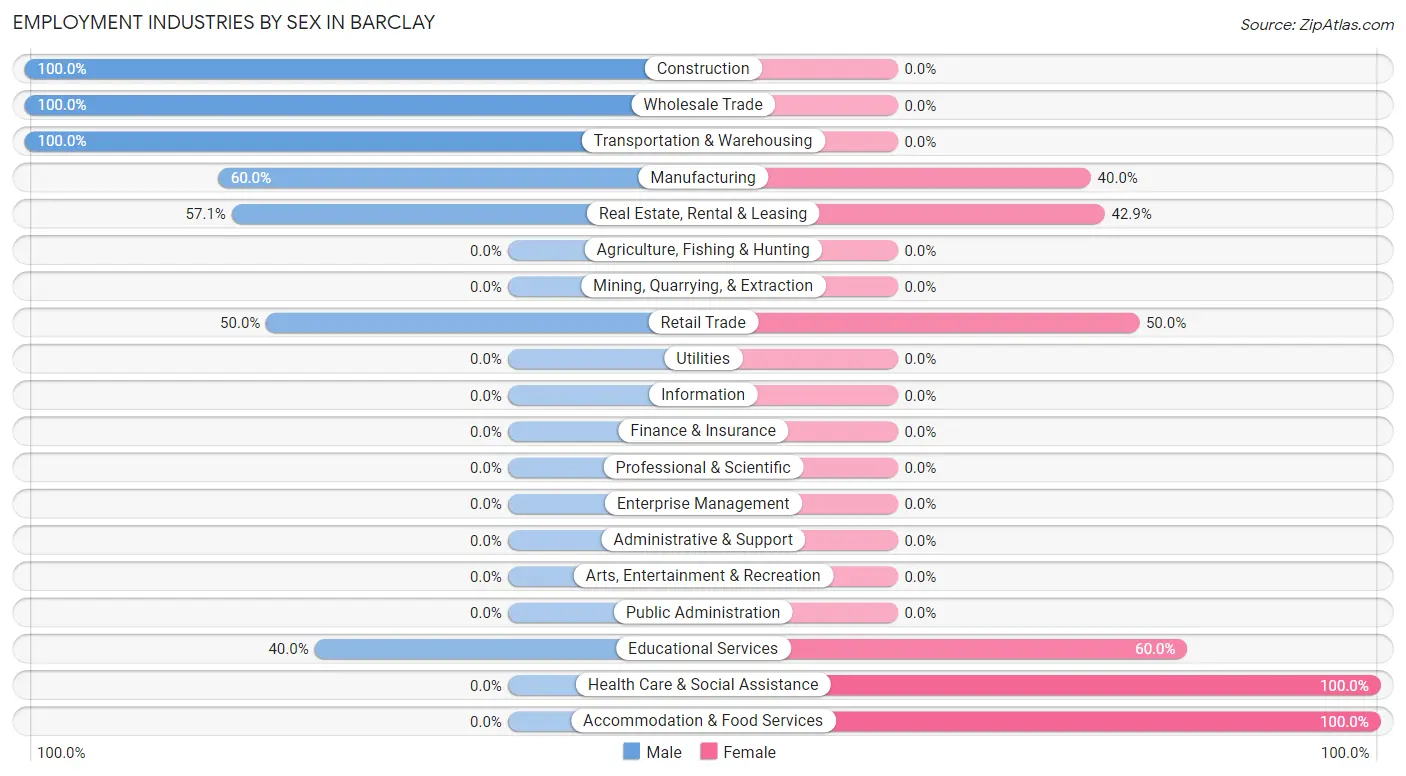
Employment Industries by Sex in Barclay
The Barclay industries that see more men than women are Construction (100.0%), Wholesale Trade (100.0%), and Transportation & Warehousing (100.0%), whereas the industries that tend to have a higher number of women are Health Care & Social Assistance (100.0%), Accommodation & Food Services (100.0%), and Educational Services (60.0%).
| Industry | Male | Female |
| Agriculture, Fishing & Hunting | 0 (0.0%) | 0 (0.0%) |
| Mining, Quarrying, & Extraction | 0 (0.0%) | 0 (0.0%) |
| Construction | 38 (100.0%) | 0 (0.0%) |
| Manufacturing | 3 (60.0%) | 2 (40.0%) |
| Wholesale Trade | 3 (100.0%) | 0 (0.0%) |
| Retail Trade | 3 (50.0%) | 3 (50.0%) |
| Transportation & Warehousing | 1 (100.0%) | 0 (0.0%) |
| Utilities | 0 (0.0%) | 0 (0.0%) |
| Information | 0 (0.0%) | 0 (0.0%) |
| Finance & Insurance | 0 (0.0%) | 0 (0.0%) |
| Real Estate, Rental & Leasing | 4 (57.1%) | 3 (42.9%) |
| Professional & Scientific | 0 (0.0%) | 0 (0.0%) |
| Enterprise Management | 0 (0.0%) | 0 (0.0%) |
| Administrative & Support | 0 (0.0%) | 0 (0.0%) |
| Educational Services | 4 (40.0%) | 6 (60.0%) |
| Health Care & Social Assistance | 0 (0.0%) | 4 (100.0%) |
| Arts, Entertainment & Recreation | 0 (0.0%) | 0 (0.0%) |
| Accommodation & Food Services | 0 (0.0%) | 18 (100.0%) |
| Public Administration | 0 (0.0%) | 0 (0.0%) |
| Total | 58 (57.4%) | 43 (42.6%) |
Education in Barclay
School Enrollment in Barclay
The most common levels of schooling among the 36 students in Barclay are high school (18 | 50.0%), elementary school (14 | 38.9%), and kindergarten (2 | 5.6%).
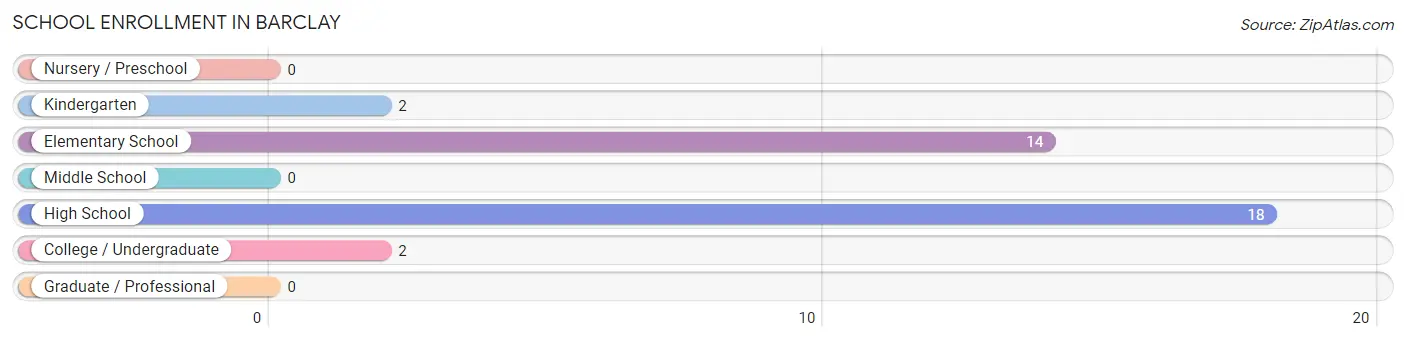
| School Level | # Students | % Students |
| Nursery / Preschool | 0 | 0.0% |
| Kindergarten | 2 | 5.6% |
| Elementary School | 14 | 38.9% |
| Middle School | 0 | 0.0% |
| High School | 18 | 50.0% |
| College / Undergraduate | 2 | 5.6% |
| Graduate / Professional | 0 | 0.0% |
| Total | 36 | 100.0% |
School Enrollment by Age by Funding Source in Barclay
Out of a total of 36 students who are enrolled in schools in Barclay, 2 (5.6%) attend a private institution, while the remaining 34 (94.4%) are enrolled in public schools. The age group of 10 to 14 year olds has the highest likelihood of being enrolled in private schools, with 1 (100.0% in the age bracket) enrolled. Conversely, the age group of 5 to 9 year old has the lowest likelihood of being enrolled in a private school, with 16 (100.0% in the age bracket) attending a public institution.
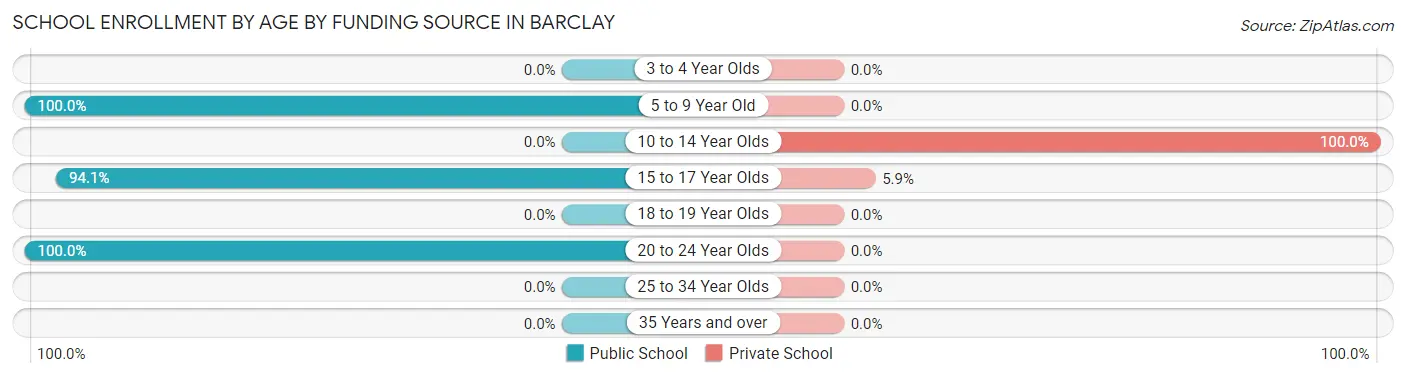
| Age Bracket | Public School | Private School |
| 3 to 4 Year Olds | 0 (0.0%) | 0 (0.0%) |
| 5 to 9 Year Old | 16 (100.0%) | 0 (0.0%) |
| 10 to 14 Year Olds | 0 (0.0%) | 1 (100.0%) |
| 15 to 17 Year Olds | 16 (94.1%) | 1 (5.9%) |
| 18 to 19 Year Olds | 0 (0.0%) | 0 (0.0%) |
| 20 to 24 Year Olds | 2 (100.0%) | 0 (0.0%) |
| 25 to 34 Year Olds | 0 (0.0%) | 0 (0.0%) |
| 35 Years and over | 0 (0.0%) | 0 (0.0%) |
| Total | 34 (94.4%) | 2 (5.6%) |
Educational Attainment by Field of Study in Barclay
Arts & humanities (3 | 27.3%), engineering (2 | 18.2%), science & technology (2 | 18.2%), education (2 | 18.2%), and liberal arts & history (2 | 18.2%) are the most common fields of study among 11 individuals in Barclay who have obtained a bachelor's degree or higher.
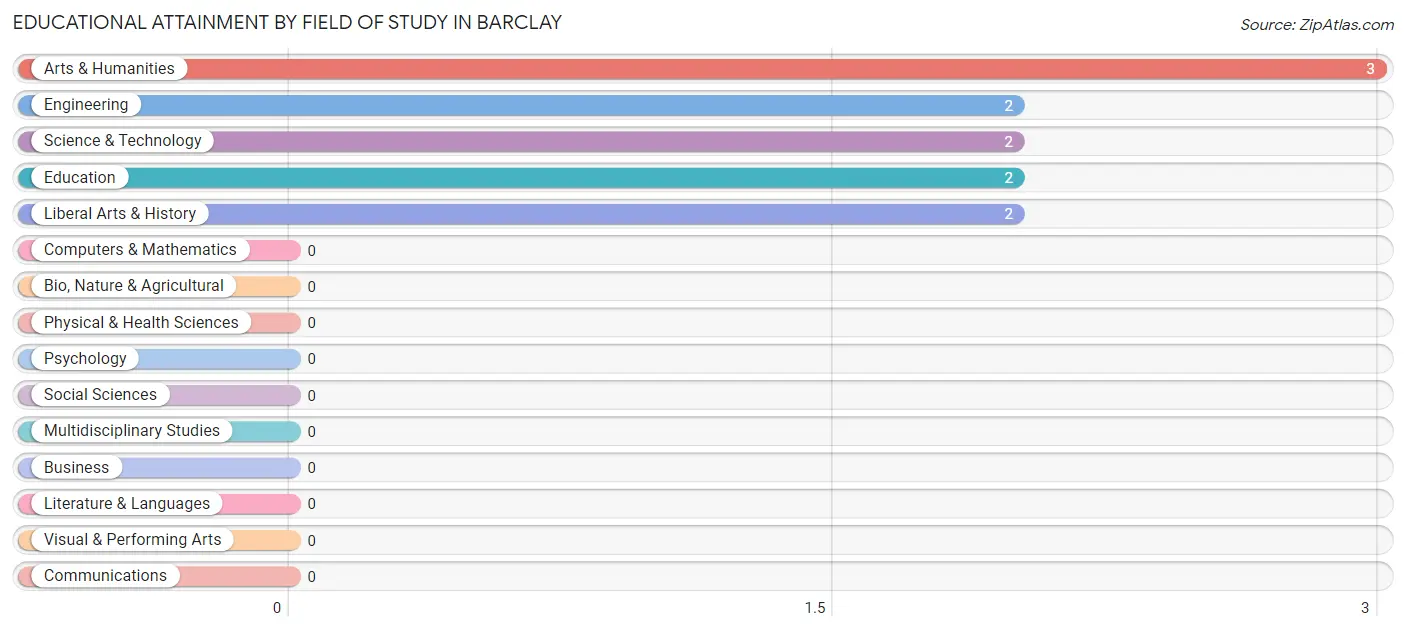
| Field of Study | # Graduates | % Graduates |
| Computers & Mathematics | 0 | 0.0% |
| Bio, Nature & Agricultural | 0 | 0.0% |
| Physical & Health Sciences | 0 | 0.0% |
| Psychology | 0 | 0.0% |
| Social Sciences | 0 | 0.0% |
| Engineering | 2 | 18.2% |
| Multidisciplinary Studies | 0 | 0.0% |
| Science & Technology | 2 | 18.2% |
| Business | 0 | 0.0% |
| Education | 2 | 18.2% |
| Literature & Languages | 0 | 0.0% |
| Liberal Arts & History | 2 | 18.2% |
| Visual & Performing Arts | 0 | 0.0% |
| Communications | 0 | 0.0% |
| Arts & Humanities | 3 | 27.3% |
| Total | 11 | 100.0% |
Transportation & Commute in Barclay
Vehicle Availability by Sex in Barclay
The most prevalent vehicle ownership categories in Barclay are males with 3 vehicles (39, accounting for 67.2%) and females with 3 vehicles (12, making up 90.7%).
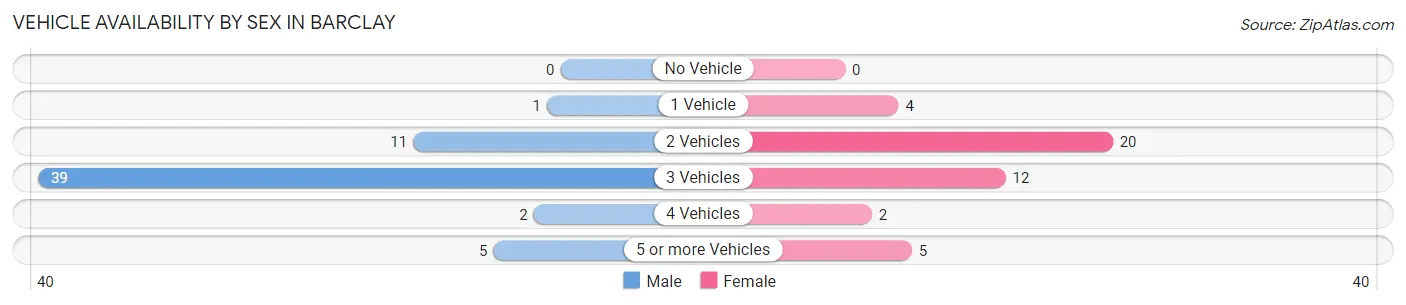
| Vehicles Available | Male | Female |
| No Vehicle | 0 (0.0%) | 0 (0.0%) |
| 1 Vehicle | 1 (1.7%) | 4 (9.3%) |
| 2 Vehicles | 11 (19.0%) | 20 (46.5%) |
| 3 Vehicles | 39 (67.2%) | 12 (27.9%) |
| 4 Vehicles | 2 (3.5%) | 2 (4.6%) |
| 5 or more Vehicles | 5 (8.6%) | 5 (11.6%) |
| Total | 58 (100.0%) | 43 (100.0%) |
Commute Time in Barclay
The most frequently occuring commute durations in Barclay are 15 to 19 minutes (48 commuters, 47.5%), 40 to 44 minutes (10 commuters, 9.9%), and 20 to 24 minutes (7 commuters, 6.9%).
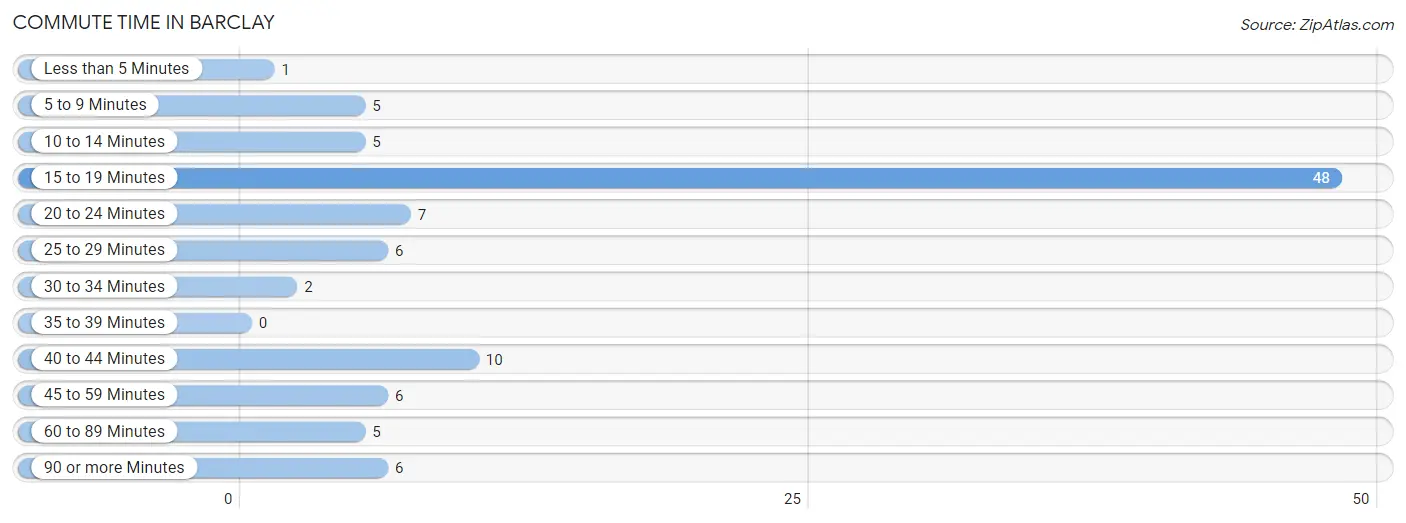
| Commute Time | # Commuters | % Commuters |
| Less than 5 Minutes | 1 | 1.0% |
| 5 to 9 Minutes | 5 | 5.0% |
| 10 to 14 Minutes | 5 | 5.0% |
| 15 to 19 Minutes | 48 | 47.5% |
| 20 to 24 Minutes | 7 | 6.9% |
| 25 to 29 Minutes | 6 | 5.9% |
| 30 to 34 Minutes | 2 | 2.0% |
| 35 to 39 Minutes | 0 | 0.0% |
| 40 to 44 Minutes | 10 | 9.9% |
| 45 to 59 Minutes | 6 | 5.9% |
| 60 to 89 Minutes | 5 | 5.0% |
| 90 or more Minutes | 6 | 5.9% |
Commute Time by Sex in Barclay
The most common commute times in Barclay are 15 to 19 minutes (37 commuters, 63.8%) for males and 15 to 19 minutes (11 commuters, 25.6%) for females.
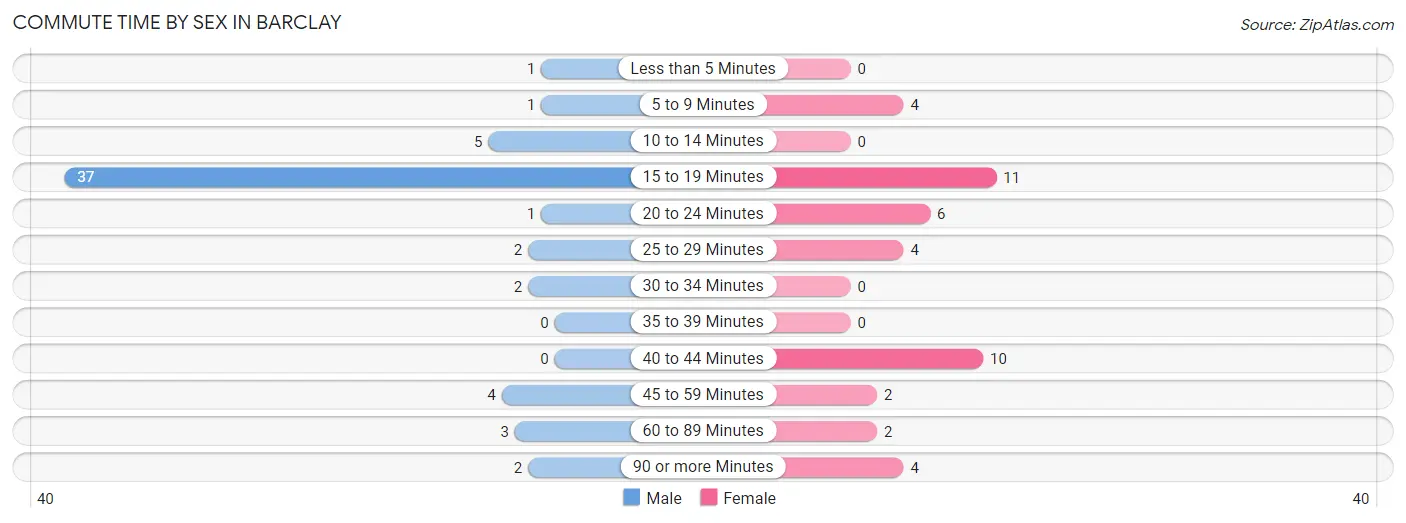
| Commute Time | Male | Female |
| Less than 5 Minutes | 1 (1.7%) | 0 (0.0%) |
| 5 to 9 Minutes | 1 (1.7%) | 4 (9.3%) |
| 10 to 14 Minutes | 5 (8.6%) | 0 (0.0%) |
| 15 to 19 Minutes | 37 (63.8%) | 11 (25.6%) |
| 20 to 24 Minutes | 1 (1.7%) | 6 (14.0%) |
| 25 to 29 Minutes | 2 (3.5%) | 4 (9.3%) |
| 30 to 34 Minutes | 2 (3.5%) | 0 (0.0%) |
| 35 to 39 Minutes | 0 (0.0%) | 0 (0.0%) |
| 40 to 44 Minutes | 0 (0.0%) | 10 (23.3%) |
| 45 to 59 Minutes | 4 (6.9%) | 2 (4.6%) |
| 60 to 89 Minutes | 3 (5.2%) | 2 (4.6%) |
| 90 or more Minutes | 2 (3.5%) | 4 (9.3%) |
Time of Departure to Work by Sex in Barclay
The most frequent times of departure to work in Barclay are 4:00 PM to 11:59 PM (34, 58.6%) for males and 5:00 AM to 5:29 AM (10, 23.3%) for females.
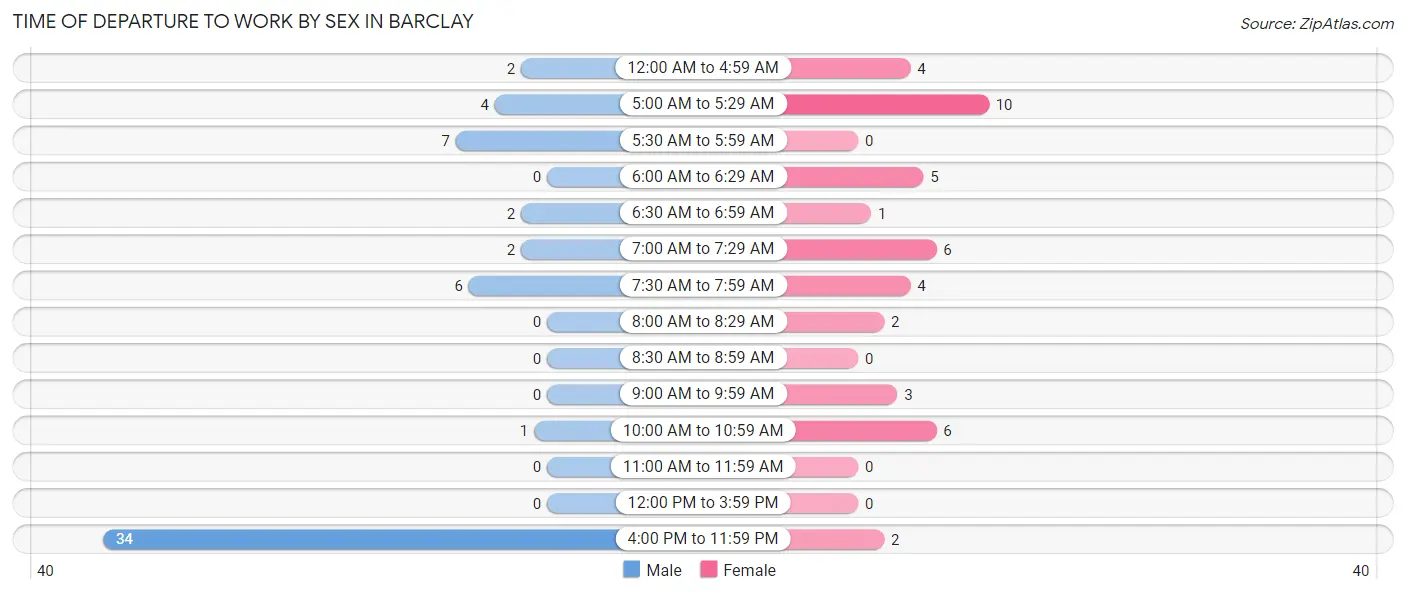
| Time of Departure | Male | Female |
| 12:00 AM to 4:59 AM | 2 (3.5%) | 4 (9.3%) |
| 5:00 AM to 5:29 AM | 4 (6.9%) | 10 (23.3%) |
| 5:30 AM to 5:59 AM | 7 (12.1%) | 0 (0.0%) |
| 6:00 AM to 6:29 AM | 0 (0.0%) | 5 (11.6%) |
| 6:30 AM to 6:59 AM | 2 (3.5%) | 1 (2.3%) |
| 7:00 AM to 7:29 AM | 2 (3.5%) | 6 (14.0%) |
| 7:30 AM to 7:59 AM | 6 (10.3%) | 4 (9.3%) |
| 8:00 AM to 8:29 AM | 0 (0.0%) | 2 (4.6%) |
| 8:30 AM to 8:59 AM | 0 (0.0%) | 0 (0.0%) |
| 9:00 AM to 9:59 AM | 0 (0.0%) | 3 (7.0%) |
| 10:00 AM to 10:59 AM | 1 (1.7%) | 6 (14.0%) |
| 11:00 AM to 11:59 AM | 0 (0.0%) | 0 (0.0%) |
| 12:00 PM to 3:59 PM | 0 (0.0%) | 0 (0.0%) |
| 4:00 PM to 11:59 PM | 34 (58.6%) | 2 (4.6%) |
| Total | 58 (100.0%) | 43 (100.0%) |
Housing Occupancy in Barclay
Occupancy by Ownership in Barclay
Of the total 76 dwellings in Barclay, owner-occupied units account for 35 (46.1%), while renter-occupied units make up 41 (53.9%).
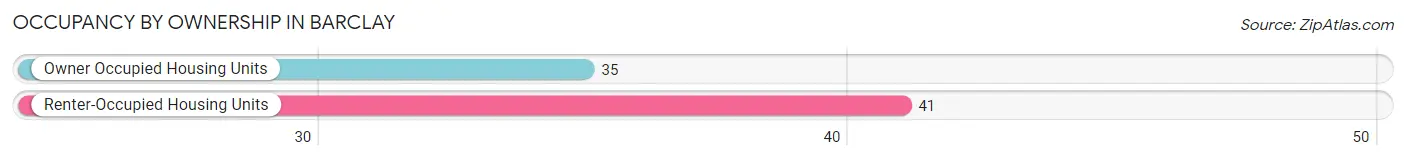
| Occupancy | # Housing Units | % Housing Units |
| Owner Occupied Housing Units | 35 | 46.1% |
| Renter-Occupied Housing Units | 41 | 53.9% |
| Total Occupied Housing Units | 76 | 100.0% |
Occupancy by Household Size in Barclay
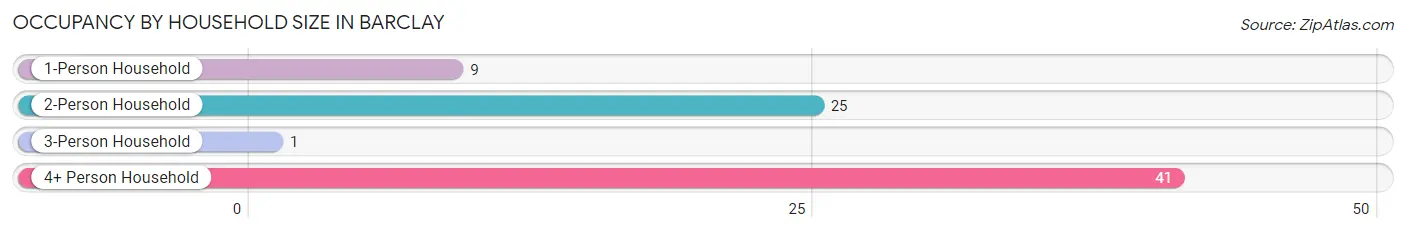
| Household Size | # Housing Units | % Housing Units |
| 1-Person Household | 9 | 11.8% |
| 2-Person Household | 25 | 32.9% |
| 3-Person Household | 1 | 1.3% |
| 4+ Person Household | 41 | 53.9% |
| Total Housing Units | 76 | 100.0% |
Occupancy by Ownership by Household Size in Barclay
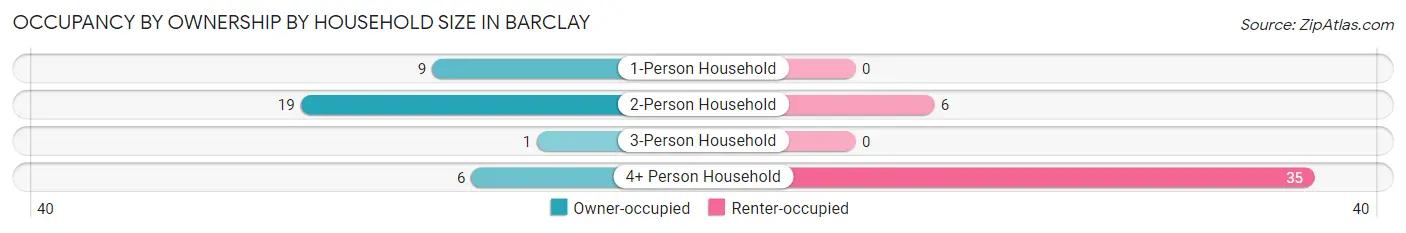
| Household Size | Owner-occupied | Renter-occupied |
| 1-Person Household | 9 (100.0%) | 0 (0.0%) |
| 2-Person Household | 19 (76.0%) | 6 (24.0%) |
| 3-Person Household | 1 (100.0%) | 0 (0.0%) |
| 4+ Person Household | 6 (14.6%) | 35 (85.4%) |
| Total Housing Units | 35 (46.1%) | 41 (53.9%) |
Occupancy by Educational Attainment in Barclay
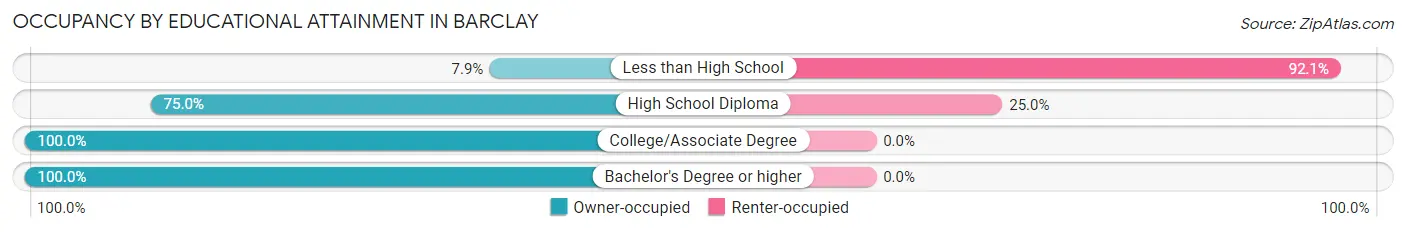
| Household Size | Owner-occupied | Renter-occupied |
| Less than High School | 3 (7.9%) | 35 (92.1%) |
| High School Diploma | 18 (75.0%) | 6 (25.0%) |
| College/Associate Degree | 8 (100.0%) | 0 (0.0%) |
| Bachelor's Degree or higher | 6 (100.0%) | 0 (0.0%) |
Occupancy by Age of Householder in Barclay
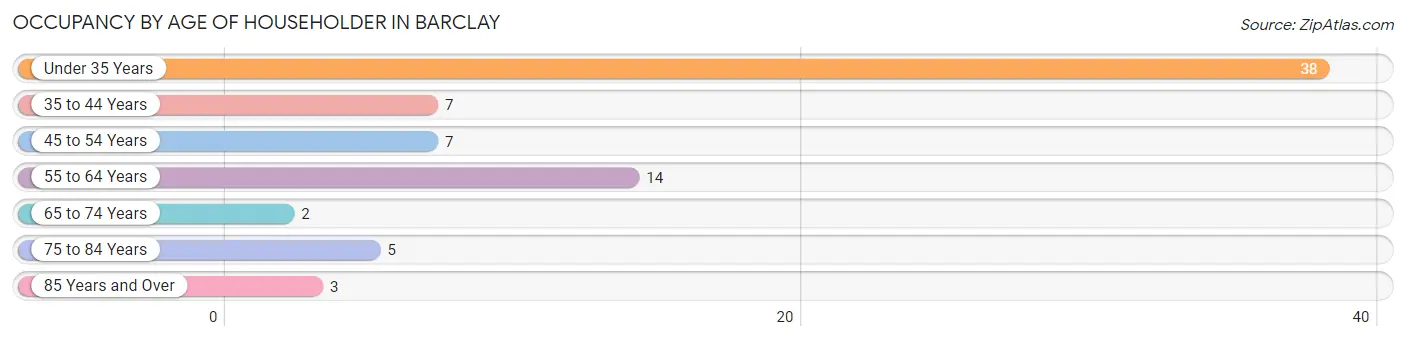
| Age Bracket | # Households | % Households |
| Under 35 Years | 38 | 50.0% |
| 35 to 44 Years | 7 | 9.2% |
| 45 to 54 Years | 7 | 9.2% |
| 55 to 64 Years | 14 | 18.4% |
| 65 to 74 Years | 2 | 2.6% |
| 75 to 84 Years | 5 | 6.6% |
| 85 Years and Over | 3 | 4.0% |
| Total | 76 | 100.0% |
Housing Finances in Barclay
Median Income by Occupancy in Barclay
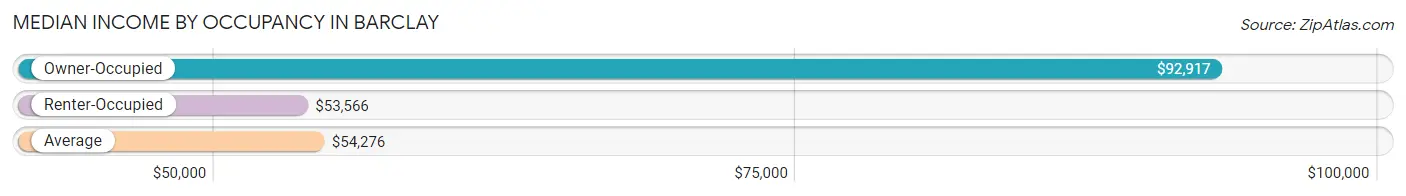
| Occupancy Type | # Households | Median Income |
| Owner-Occupied | 35 (46.1%) | $92,917 |
| Renter-Occupied | 41 (53.9%) | $53,566 |
| Average | 76 (100.0%) | $54,276 |
Occupancy by Householder Income Bracket in Barclay
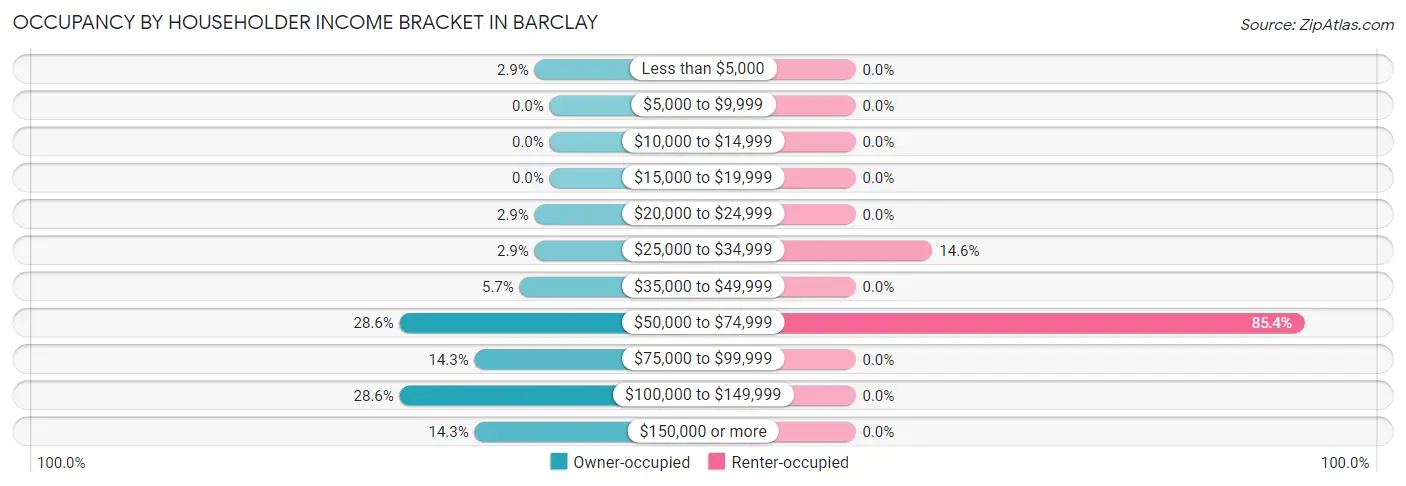
| Income Bracket | Owner-occupied | Renter-occupied |
| Less than $5,000 | 1 (2.9%) | 0 (0.0%) |
| $5,000 to $9,999 | 0 (0.0%) | 0 (0.0%) |
| $10,000 to $14,999 | 0 (0.0%) | 0 (0.0%) |
| $15,000 to $19,999 | 0 (0.0%) | 0 (0.0%) |
| $20,000 to $24,999 | 1 (2.9%) | 0 (0.0%) |
| $25,000 to $34,999 | 1 (2.9%) | 6 (14.6%) |
| $35,000 to $49,999 | 2 (5.7%) | 0 (0.0%) |
| $50,000 to $74,999 | 10 (28.6%) | 35 (85.4%) |
| $75,000 to $99,999 | 5 (14.3%) | 0 (0.0%) |
| $100,000 to $149,999 | 10 (28.6%) | 0 (0.0%) |
| $150,000 or more | 5 (14.3%) | 0 (0.0%) |
| Total | 35 (100.0%) | 41 (100.0%) |
Monthly Housing Cost Tiers in Barclay
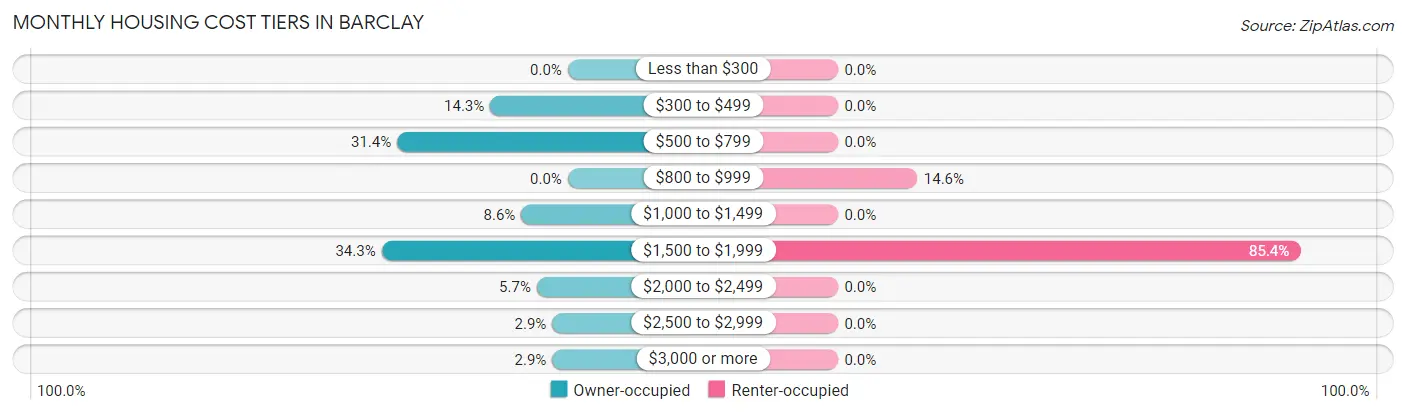
| Monthly Cost | Owner-occupied | Renter-occupied |
| Less than $300 | 0 (0.0%) | 0 (0.0%) |
| $300 to $499 | 5 (14.3%) | 0 (0.0%) |
| $500 to $799 | 11 (31.4%) | 0 (0.0%) |
| $800 to $999 | 0 (0.0%) | 6 (14.6%) |
| $1,000 to $1,499 | 3 (8.6%) | 0 (0.0%) |
| $1,500 to $1,999 | 12 (34.3%) | 35 (85.4%) |
| $2,000 to $2,499 | 2 (5.7%) | 0 (0.0%) |
| $2,500 to $2,999 | 1 (2.9%) | 0 (0.0%) |
| $3,000 or more | 1 (2.9%) | 0 (0.0%) |
| Total | 35 (100.0%) | 41 (100.0%) |
Physical Housing Characteristics in Barclay
Housing Structures in Barclay
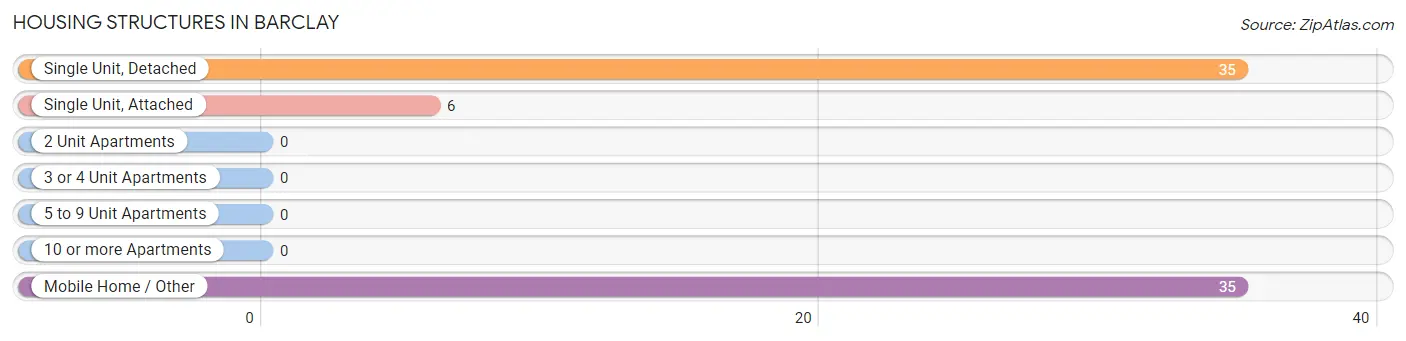
| Structure Type | # Housing Units | % Housing Units |
| Single Unit, Detached | 35 | 46.1% |
| Single Unit, Attached | 6 | 7.9% |
| 2 Unit Apartments | 0 | 0.0% |
| 3 or 4 Unit Apartments | 0 | 0.0% |
| 5 to 9 Unit Apartments | 0 | 0.0% |
| 10 or more Apartments | 0 | 0.0% |
| Mobile Home / Other | 35 | 46.1% |
| Total | 76 | 100.0% |
Housing Structures by Occupancy in Barclay
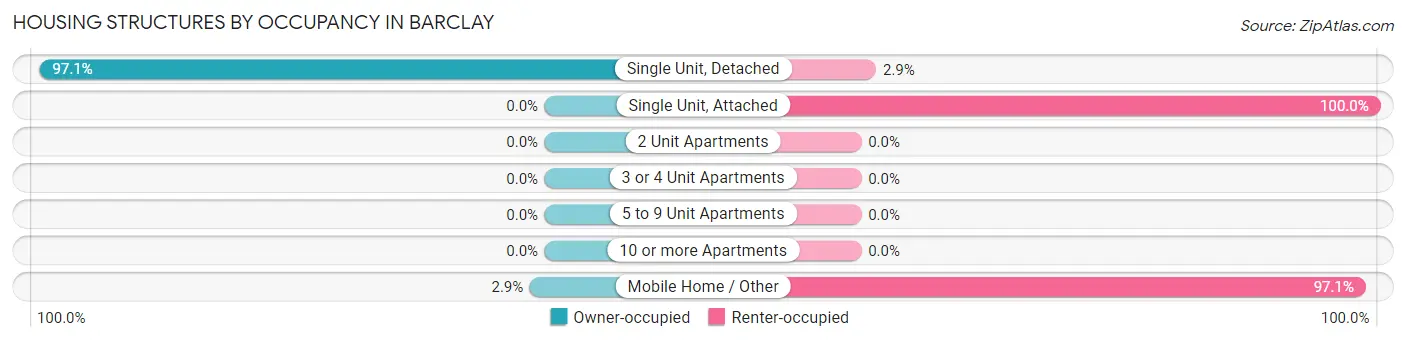
| Structure Type | Owner-occupied | Renter-occupied |
| Single Unit, Detached | 34 (97.1%) | 1 (2.9%) |
| Single Unit, Attached | 0 (0.0%) | 6 (100.0%) |
| 2 Unit Apartments | 0 (0.0%) | 0 (0.0%) |
| 3 or 4 Unit Apartments | 0 (0.0%) | 0 (0.0%) |
| 5 to 9 Unit Apartments | 0 (0.0%) | 0 (0.0%) |
| 10 or more Apartments | 0 (0.0%) | 0 (0.0%) |
| Mobile Home / Other | 1 (2.9%) | 34 (97.1%) |
| Total | 35 (46.1%) | 41 (53.9%) |
Housing Structures by Number of Rooms in Barclay
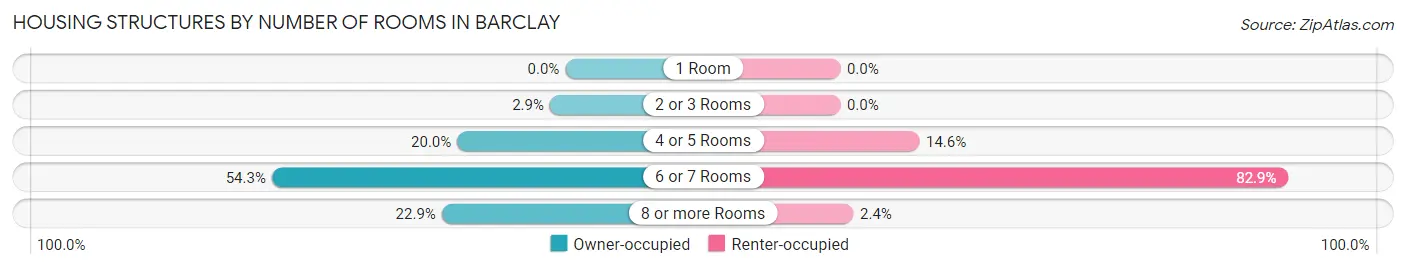
| Number of Rooms | Owner-occupied | Renter-occupied |
| 1 Room | 0 (0.0%) | 0 (0.0%) |
| 2 or 3 Rooms | 1 (2.9%) | 0 (0.0%) |
| 4 or 5 Rooms | 7 (20.0%) | 6 (14.6%) |
| 6 or 7 Rooms | 19 (54.3%) | 34 (82.9%) |
| 8 or more Rooms | 8 (22.9%) | 1 (2.4%) |
| Total | 35 (100.0%) | 41 (100.0%) |
Housing Structure by Heating Type in Barclay
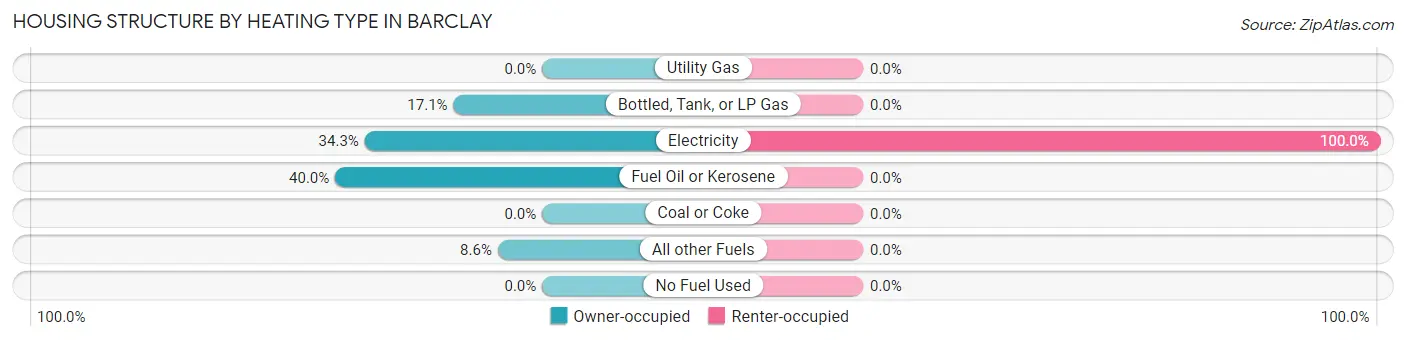
| Heating Type | Owner-occupied | Renter-occupied |
| Utility Gas | 0 (0.0%) | 0 (0.0%) |
| Bottled, Tank, or LP Gas | 6 (17.1%) | 0 (0.0%) |
| Electricity | 12 (34.3%) | 41 (100.0%) |
| Fuel Oil or Kerosene | 14 (40.0%) | 0 (0.0%) |
| Coal or Coke | 0 (0.0%) | 0 (0.0%) |
| All other Fuels | 3 (8.6%) | 0 (0.0%) |
| No Fuel Used | 0 (0.0%) | 0 (0.0%) |
| Total | 35 (100.0%) | 41 (100.0%) |
Household Vehicle Usage in Barclay
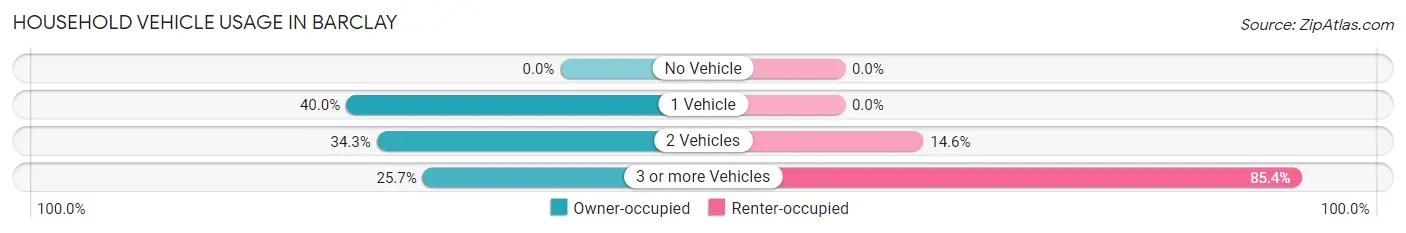
| Vehicles per Household | Owner-occupied | Renter-occupied |
| No Vehicle | 0 (0.0%) | 0 (0.0%) |
| 1 Vehicle | 14 (40.0%) | 0 (0.0%) |
| 2 Vehicles | 12 (34.3%) | 6 (14.6%) |
| 3 or more Vehicles | 9 (25.7%) | 35 (85.4%) |
| Total | 35 (100.0%) | 41 (100.0%) |
Real Estate & Mortgages in Barclay
Real Estate and Mortgage Overview in Barclay
| Characteristic | Without Mortgage | With Mortgage |
| Housing Units | 14 | 21 |
| Median Property Value | - | - |
| Median Household Income | $54,375 | $5 |
| Monthly Housing Costs | $529 | $0 |
| Real Estate Taxes | $1,688 | $0 |
Property Value by Mortgage Status in Barclay
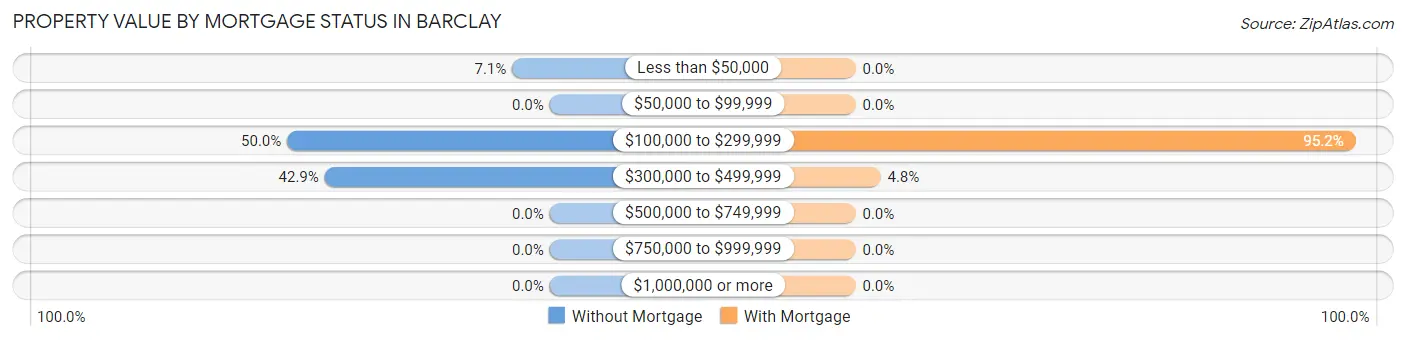
| Property Value | Without Mortgage | With Mortgage |
| Less than $50,000 | 1 (7.1%) | 0 (0.0%) |
| $50,000 to $99,999 | 0 (0.0%) | 0 (0.0%) |
| $100,000 to $299,999 | 7 (50.0%) | 20 (95.2%) |
| $300,000 to $499,999 | 6 (42.9%) | 1 (4.8%) |
| $500,000 to $749,999 | 0 (0.0%) | 0 (0.0%) |
| $750,000 to $999,999 | 0 (0.0%) | 0 (0.0%) |
| $1,000,000 or more | 0 (0.0%) | 0 (0.0%) |
| Total | 14 (100.0%) | 21 (100.0%) |
Household Income by Mortgage Status in Barclay
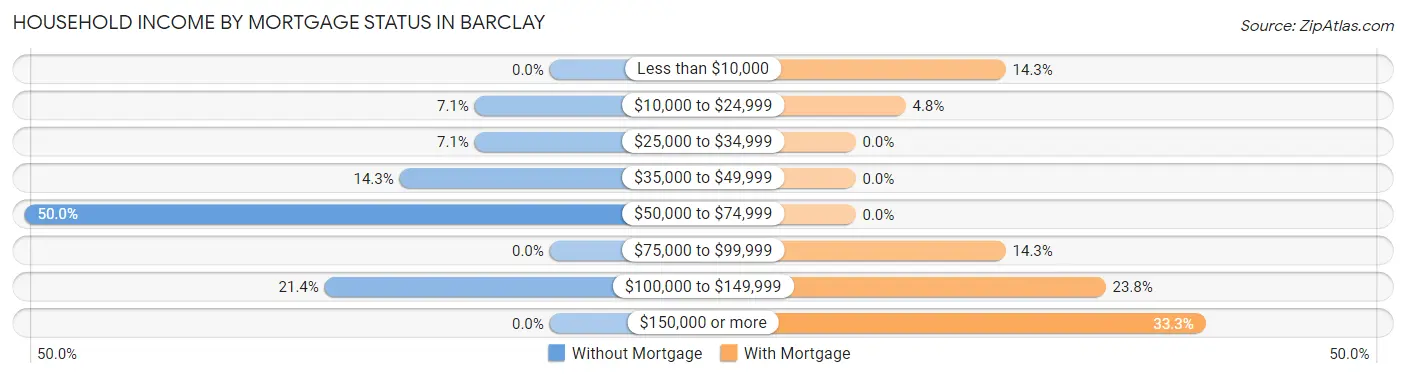
| Household Income | Without Mortgage | With Mortgage |
| Less than $10,000 | 0 (0.0%) | 3 (14.3%) |
| $10,000 to $24,999 | 1 (7.1%) | 1 (4.8%) |
| $25,000 to $34,999 | 1 (7.1%) | 0 (0.0%) |
| $35,000 to $49,999 | 2 (14.3%) | 0 (0.0%) |
| $50,000 to $74,999 | 7 (50.0%) | 0 (0.0%) |
| $75,000 to $99,999 | 0 (0.0%) | 3 (14.3%) |
| $100,000 to $149,999 | 3 (21.4%) | 5 (23.8%) |
| $150,000 or more | 0 (0.0%) | 7 (33.3%) |
| Total | 14 (100.0%) | 21 (100.0%) |
Property Value to Household Income Ratio in Barclay
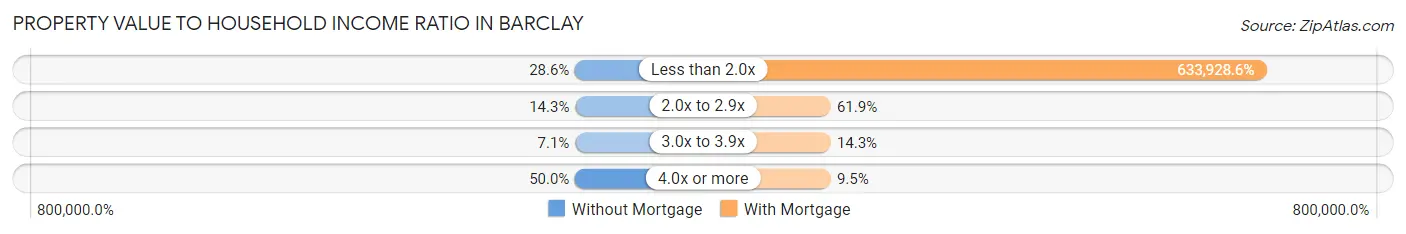
| Value-to-Income Ratio | Without Mortgage | With Mortgage |
| Less than 2.0x | 4 (28.6%) | 133,125 (633,928.6%) |
| 2.0x to 2.9x | 2 (14.3%) | 13 (61.9%) |
| 3.0x to 3.9x | 1 (7.1%) | 3 (14.3%) |
| 4.0x or more | 7 (50.0%) | 2 (9.5%) |
| Total | 14 (100.0%) | 21 (100.0%) |
Real Estate Taxes by Mortgage Status in Barclay
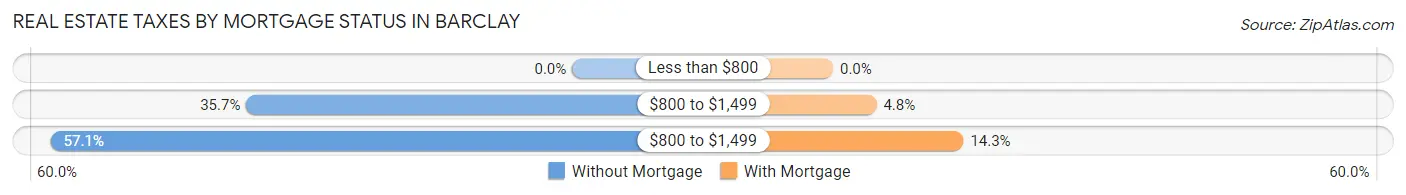
| Property Taxes | Without Mortgage | With Mortgage |
| Less than $800 | 0 (0.0%) | 0 (0.0%) |
| $800 to $1,499 | 5 (35.7%) | 1 (4.8%) |
| $800 to $1,499 | 8 (57.1%) | 3 (14.3%) |
| Total | 14 (100.0%) | 21 (100.0%) |
Health & Disability in Barclay
Health Insurance Coverage by Age in Barclay
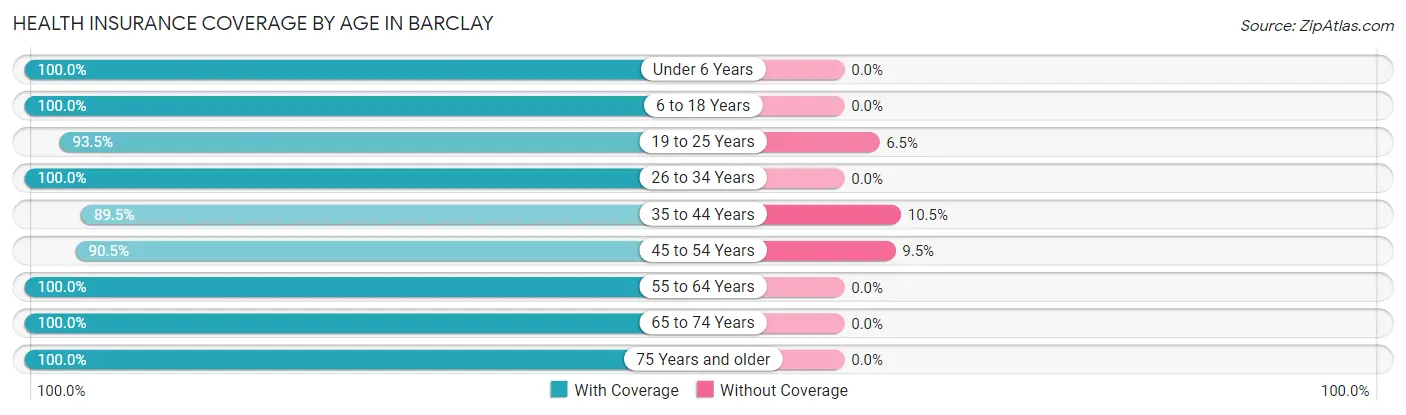
| Age Bracket | With Coverage | Without Coverage |
| Under 6 Years | 14 (100.0%) | 0 (0.0%) |
| 6 to 18 Years | 33 (100.0%) | 0 (0.0%) |
| 19 to 25 Years | 43 (93.5%) | 3 (6.5%) |
| 26 to 34 Years | 6 (100.0%) | 0 (0.0%) |
| 35 to 44 Years | 17 (89.5%) | 2 (10.5%) |
| 45 to 54 Years | 19 (90.5%) | 2 (9.5%) |
| 55 to 64 Years | 20 (100.0%) | 0 (0.0%) |
| 65 to 74 Years | 4 (100.0%) | 0 (0.0%) |
| 75 Years and older | 12 (100.0%) | 0 (0.0%) |
| Total | 168 (96.0%) | 7 (4.0%) |
Health Insurance Coverage by Citizenship Status in Barclay
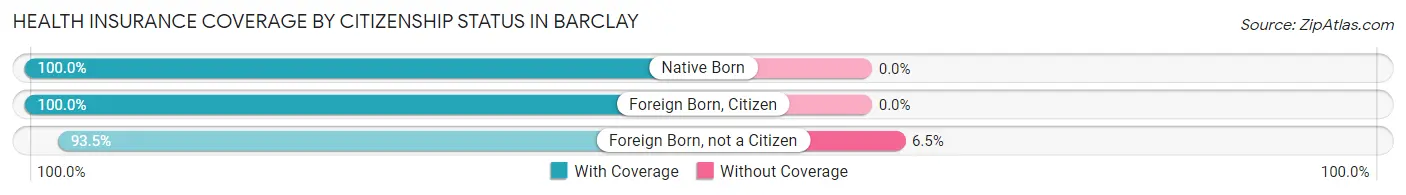
| Citizenship Status | With Coverage | Without Coverage |
| Native Born | 14 (100.0%) | 0 (0.0%) |
| Foreign Born, Citizen | 33 (100.0%) | 0 (0.0%) |
| Foreign Born, not a Citizen | 43 (93.5%) | 3 (6.5%) |
Health Insurance Coverage by Household Income in Barclay
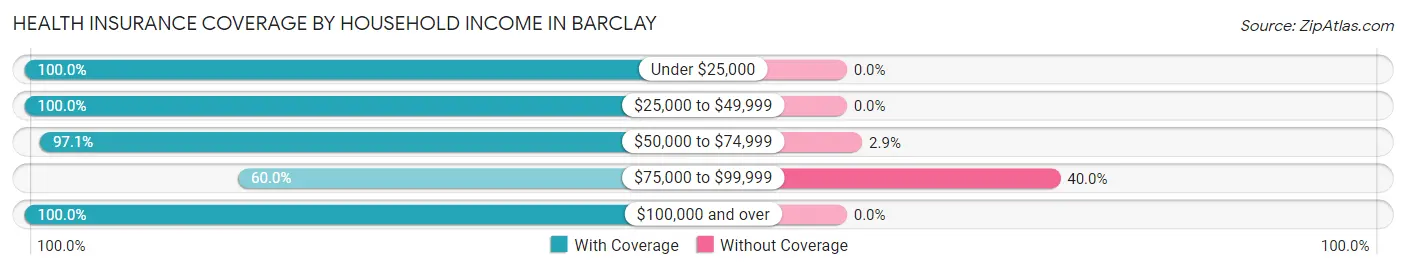
| Household Income | With Coverage | Without Coverage |
| Under $25,000 | 2 (100.0%) | 0 (0.0%) |
| $25,000 to $49,999 | 22 (100.0%) | 0 (0.0%) |
| $50,000 to $74,999 | 101 (97.1%) | 3 (2.9%) |
| $75,000 to $99,999 | 6 (60.0%) | 4 (40.0%) |
| $100,000 and over | 37 (100.0%) | 0 (0.0%) |
Public vs Private Health Insurance Coverage by Age in Barclay
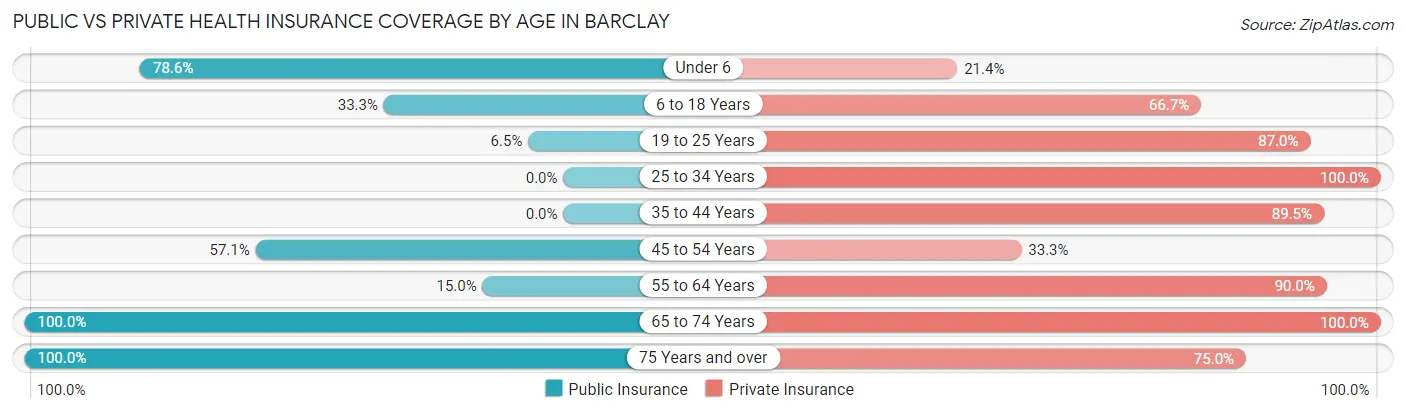
| Age Bracket | Public Insurance | Private Insurance |
| Under 6 | 11 (78.6%) | 3 (21.4%) |
| 6 to 18 Years | 11 (33.3%) | 22 (66.7%) |
| 19 to 25 Years | 3 (6.5%) | 40 (87.0%) |
| 25 to 34 Years | 0 (0.0%) | 6 (100.0%) |
| 35 to 44 Years | 0 (0.0%) | 17 (89.5%) |
| 45 to 54 Years | 12 (57.1%) | 7 (33.3%) |
| 55 to 64 Years | 3 (15.0%) | 18 (90.0%) |
| 65 to 74 Years | 4 (100.0%) | 4 (100.0%) |
| 75 Years and over | 12 (100.0%) | 9 (75.0%) |
| Total | 56 (32.0%) | 126 (72.0%) |
Disability Status by Sex by Age in Barclay
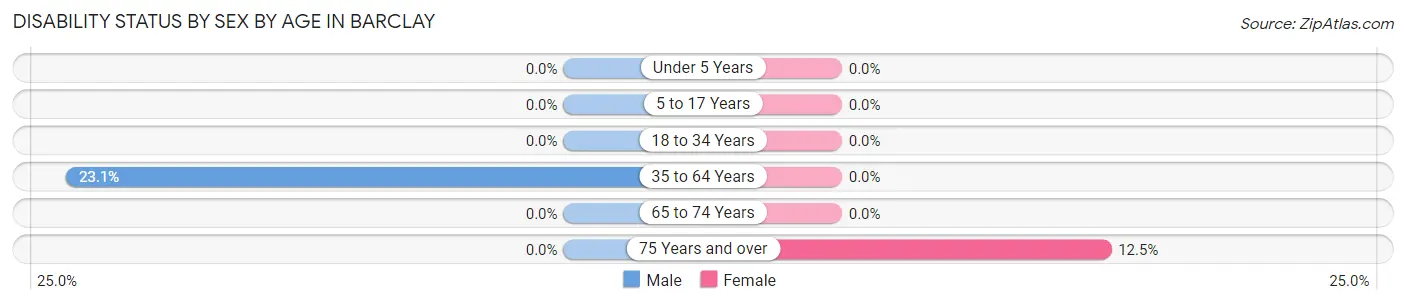
| Age Bracket | Male | Female |
| Under 5 Years | 0 (0.0%) | 0 (0.0%) |
| 5 to 17 Years | 0 (0.0%) | 0 (0.0%) |
| 18 to 34 Years | 0 (0.0%) | 0 (0.0%) |
| 35 to 64 Years | 6 (23.1%) | 0 (0.0%) |
| 65 to 74 Years | 0 (0.0%) | 0 (0.0%) |
| 75 Years and over | 0 (0.0%) | 1 (12.5%) |
Disability Class by Sex by Age in Barclay
Disability Class: Hearing Difficulty
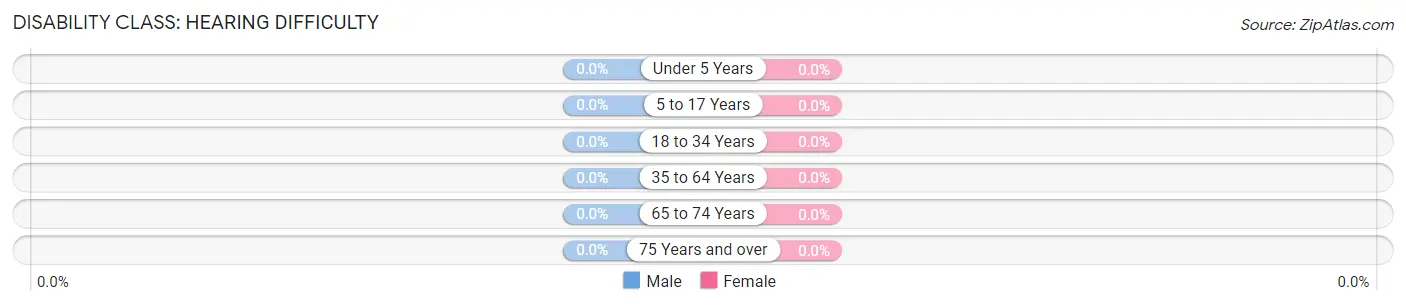
| Age Bracket | Male | Female |
| Under 5 Years | 0 (0.0%) | 0 (0.0%) |
| 5 to 17 Years | 0 (0.0%) | 0 (0.0%) |
| 18 to 34 Years | 0 (0.0%) | 0 (0.0%) |
| 35 to 64 Years | 0 (0.0%) | 0 (0.0%) |
| 65 to 74 Years | 0 (0.0%) | 0 (0.0%) |
| 75 Years and over | 0 (0.0%) | 0 (0.0%) |
Disability Class: Vision Difficulty
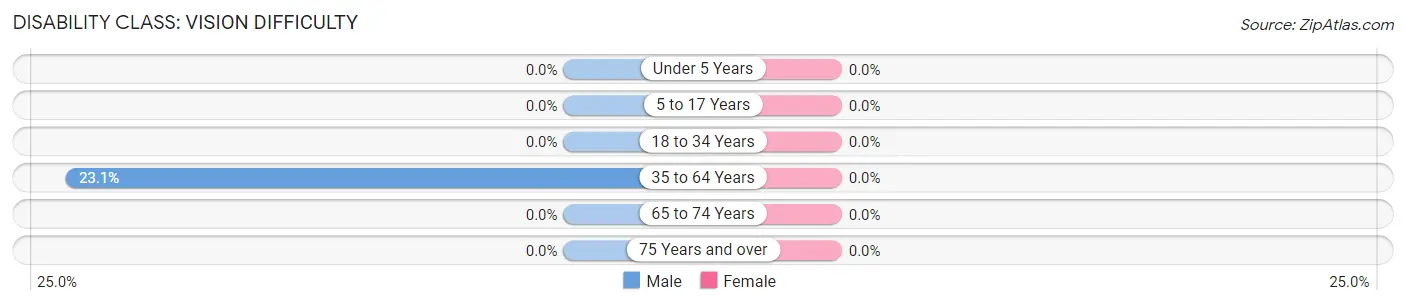
| Age Bracket | Male | Female |
| Under 5 Years | 0 (0.0%) | 0 (0.0%) |
| 5 to 17 Years | 0 (0.0%) | 0 (0.0%) |
| 18 to 34 Years | 0 (0.0%) | 0 (0.0%) |
| 35 to 64 Years | 6 (23.1%) | 0 (0.0%) |
| 65 to 74 Years | 0 (0.0%) | 0 (0.0%) |
| 75 Years and over | 0 (0.0%) | 0 (0.0%) |
Disability Class: Cognitive Difficulty
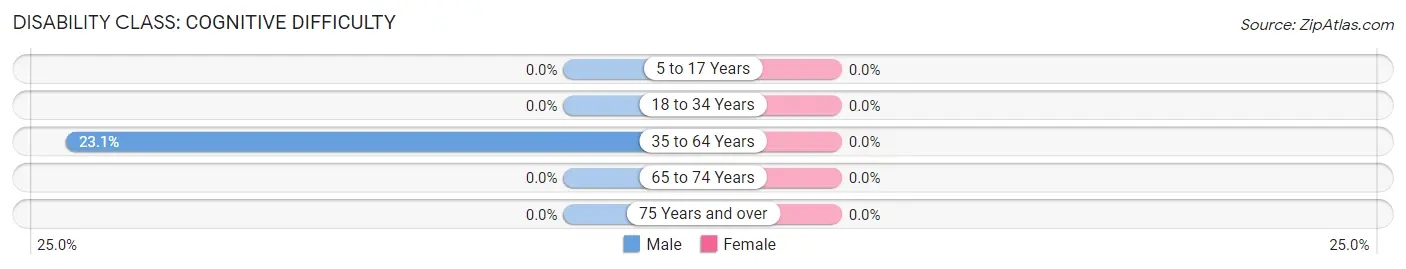
| Age Bracket | Male | Female |
| 5 to 17 Years | 0 (0.0%) | 0 (0.0%) |
| 18 to 34 Years | 0 (0.0%) | 0 (0.0%) |
| 35 to 64 Years | 6 (23.1%) | 0 (0.0%) |
| 65 to 74 Years | 0 (0.0%) | 0 (0.0%) |
| 75 Years and over | 0 (0.0%) | 0 (0.0%) |
Disability Class: Ambulatory Difficulty
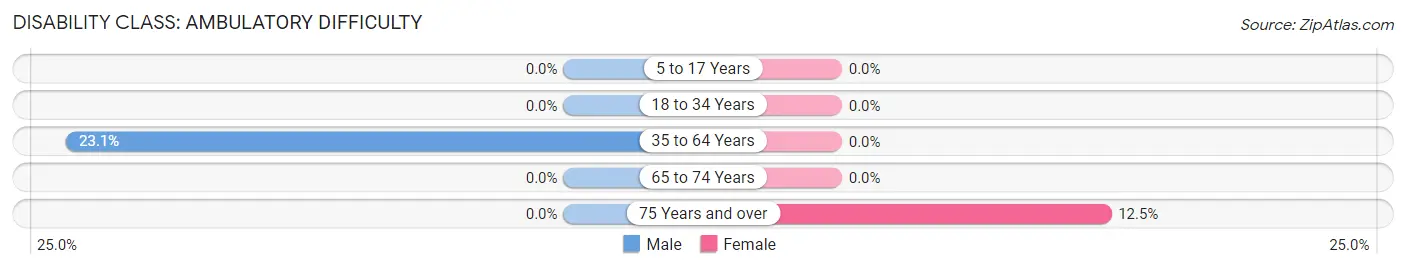
| Age Bracket | Male | Female |
| 5 to 17 Years | 0 (0.0%) | 0 (0.0%) |
| 18 to 34 Years | 0 (0.0%) | 0 (0.0%) |
| 35 to 64 Years | 6 (23.1%) | 0 (0.0%) |
| 65 to 74 Years | 0 (0.0%) | 0 (0.0%) |
| 75 Years and over | 0 (0.0%) | 1 (12.5%) |
Disability Class: Self-Care Difficulty
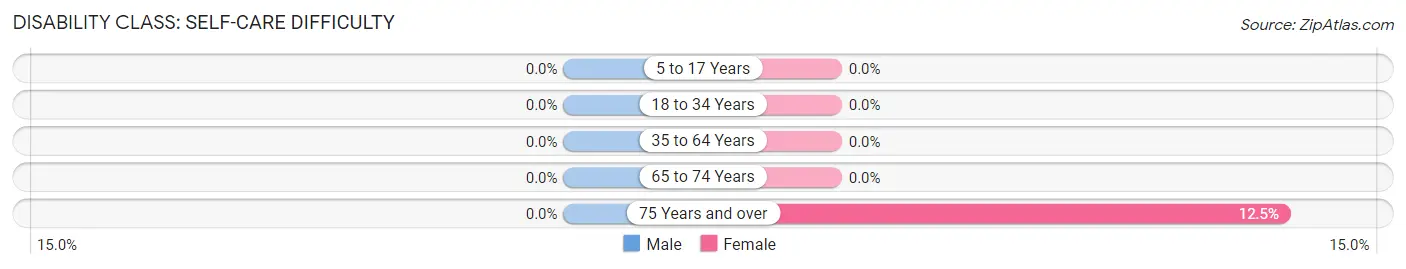
| Age Bracket | Male | Female |
| 5 to 17 Years | 0 (0.0%) | 0 (0.0%) |
| 18 to 34 Years | 0 (0.0%) | 0 (0.0%) |
| 35 to 64 Years | 0 (0.0%) | 0 (0.0%) |
| 65 to 74 Years | 0 (0.0%) | 0 (0.0%) |
| 75 Years and over | 0 (0.0%) | 1 (12.5%) |
Technology Access in Barclay
Computing Device Access in Barclay
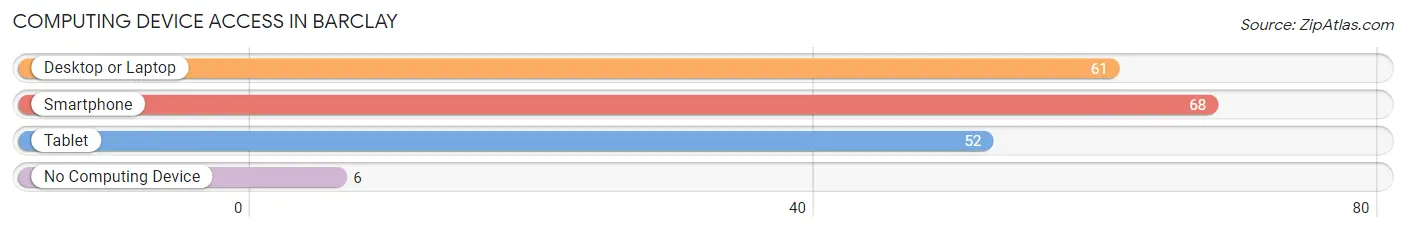
| Device Type | # Households | % Households |
| Desktop or Laptop | 61 | 80.3% |
| Smartphone | 68 | 89.5% |
| Tablet | 52 | 68.4% |
| No Computing Device | 6 | 7.9% |
| Total | 76 | 100.0% |
Internet Access in Barclay
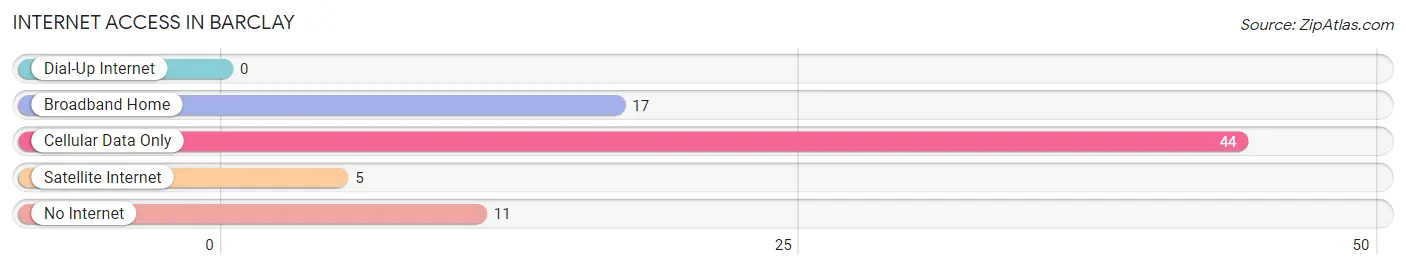
| Internet Type | # Households | % Households |
| Dial-Up Internet | 0 | 0.0% |
| Broadband Home | 17 | 22.4% |
| Cellular Data Only | 44 | 57.9% |
| Satellite Internet | 5 | 6.6% |
| No Internet | 11 | 14.5% |
| Total | 76 | 100.0% |
Barclay Summary
Maryland is a state located in the Mid-Atlantic region of the United States. It is bordered by Virginia, West Virginia, and the District of Columbia to the south and west; Pennsylvania to the north; and Delaware to the east. Maryland is the ninth smallest state in the country and the 42nd most populous. The state is home to a diverse population of over 6 million people, with a variety of ethnic backgrounds and cultures.
History
Maryland was first colonized by the English in 1634, when a group of settlers led by Lord Baltimore arrived in the area. The colony was named after Queen Henrietta Maria, the wife of King Charles I of England. Maryland was one of the original 13 colonies that declared independence from Britain in 1776. After the Revolutionary War, Maryland became the seventh state to ratify the U.S. Constitution in 1788.
During the Civil War, Maryland was a border state, with both Union and Confederate forces occupying the state. After the war, Maryland was the first state to ratify the Thirteenth Amendment, which abolished slavery.
Geography
Maryland is located in the Mid-Atlantic region of the United States. It is bordered by Virginia, West Virginia, and the District of Columbia to the south and west; Pennsylvania to the north; and Delaware to the east. Maryland is the ninth smallest state in the country and the 42nd most populous.
The state is divided into two distinct regions: the Eastern Shore and the Western Shore. The Eastern Shore is a peninsula that is bordered by the Chesapeake Bay and the Atlantic Ocean. The Western Shore is a region of rolling hills and valleys that is bordered by the Potomac River and the Appalachian Mountains.
Economy
Maryland has a diverse economy that is driven by a variety of industries. The state is home to a number of major corporations, including Lockheed Martin, Northrop Grumman, and Marriott International. The state is also a major center for biotechnology and life sciences research.
The state’s agricultural sector is also an important part of the economy. Maryland is the leading producer of blue crabs in the United States, and is also a major producer of poultry, soybeans, corn, and other crops.
Demographics
As of 2020, the population of Maryland was estimated to be 6,045,680. The state is home to a diverse population of over 6 million people, with a variety of ethnic backgrounds and cultures. The largest ethnic group in the state is African American, making up 30.2% of the population. White Americans make up 59.2% of the population, while Hispanic and Latino Americans make up 8.3%.
The median household income in Maryland is $83,242, which is higher than the national median of $61,937. The poverty rate in the state is 8.7%, which is lower than the national average of 11.8%. The unemployment rate in Maryland is 4.2%, which is lower than the national average of 6.7%.
Common Questions
What is Per Capita Income in Barclay?
Per Capita income in Barclay is $31,282.
What is the Median Family Income in Barclay?
Median Family Income in Barclay is $54,375.
What is the Median Household income in Barclay?
Median Household Income in Barclay is $54,276.
What is Inequality or Gini Index in Barclay?
Inequality or Gini Index in Barclay is 0.30.
What is the Total Population of Barclay?
Total Population of Barclay is 175.
What is the Total Male Population of Barclay?
Total Male Population of Barclay is 79.
What is the Total Female Population of Barclay?
Total Female Population of Barclay is 96.
What is the Ratio of Males per 100 Females in Barclay?
There are 82.29 Males per 100 Females in Barclay.
What is the Ratio of Females per 100 Males in Barclay?
There are 121.52 Females per 100 Males in Barclay.
What is the Median Population Age in Barclay?
Median Population Age in Barclay is 23.0 Years.
What is the Average Family Size in Barclay
Average Family Size in Barclay is 2.5 People.
What is the Average Household Size in Barclay
Average Household Size in Barclay is 2.3 People.
How Large is the Labor Force in Barclay?
There are 101 People in the Labor Forcein in Barclay.
What is the Percentage of People in the Labor Force in Barclay?
70.6% of People are in the Labor Force in Barclay.