Church Hill, MD Map & Demographics
Church Hill Map
Church Hill Overview
$33,428
PER CAPITA INCOME
$71,667
AVG FAMILY INCOME
$66,432
AVG HOUSEHOLD INCOME
17.1%
WAGE / INCOME GAP [ % ]
82.9¢/ $1
WAGE / INCOME GAP [ $ ]
0.43
INEQUALITY / GINI INDEX
1,084
TOTAL POPULATION
497
MALE POPULATION
587
FEMALE POPULATION
84.67
MALES / 100 FEMALES
118.11
FEMALES / 100 MALES
32.6
MEDIAN AGE
2.9
AVG FAMILY SIZE
2.4
AVG HOUSEHOLD SIZE
543
LABOR FORCE [ PEOPLE ]
65.9%
PERCENT IN LABOR FORCE
0.4%
UNEMPLOYMENT RATE
Church Hill Zip Codes
Church Hill Area Codes
Income in Church Hill
Income Overview in Church Hill
Per Capita Income in Church Hill is $33,428, while median incomes of families and households are $71,667 and $66,432 respectively.
| Characteristic | Number | Measure |
| Per Capita Income | 1,084 | $33,428 |
| Median Family Income | 296 | $71,667 |
| Mean Family Income | 296 | $100,303 |
| Median Household Income | 443 | $66,432 |
| Mean Household Income | 443 | $85,303 |
| Income Deficit | 296 | $0 |
| Wage / Income Gap (%) | 1,084 | 17.08% |
| Wage / Income Gap ($) | 1,084 | 82.92¢ per $1 |
| Gini / Inequality Index | 1,084 | 0.43 |
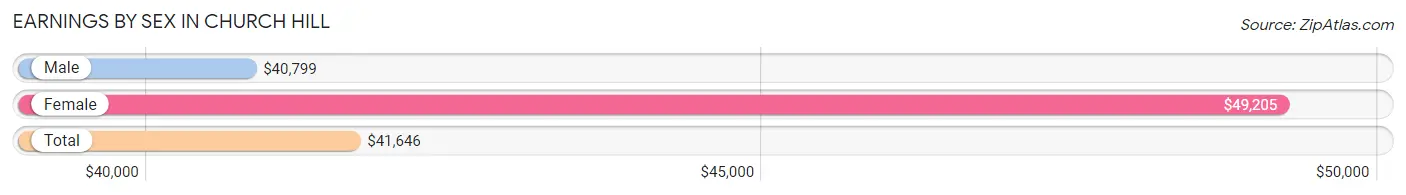
Earnings by Sex in Church Hill
Average Earnings in Church Hill are $41,646, $40,799 for men and $49,205 for women, a difference of 17.1%.
| Sex | Number | Average Earnings |
| Male | 305 (54.9%) | $40,799 |
| Female | 251 (45.1%) | $49,205 |
| Total | 556 (100.0%) | $41,646 |
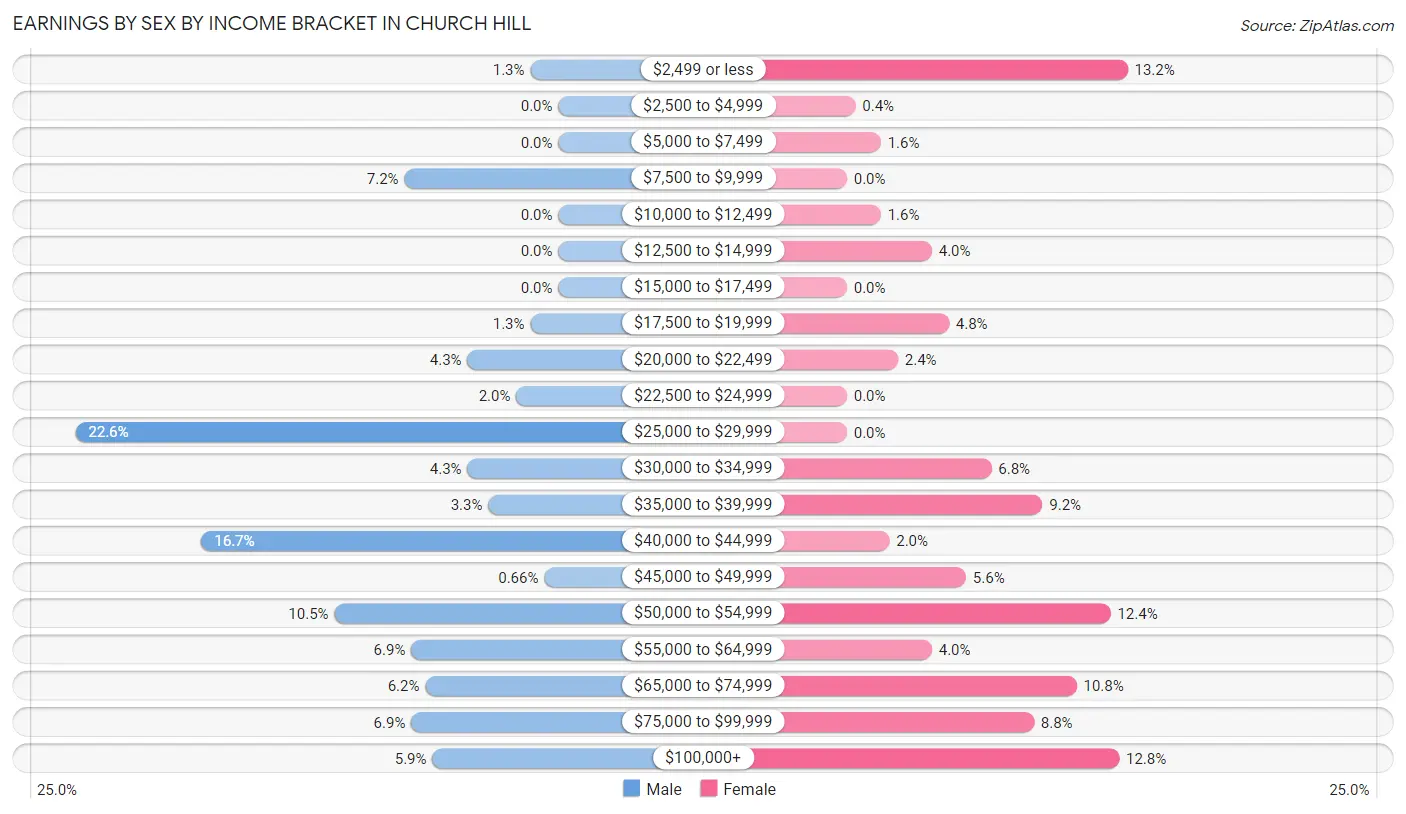
Earnings by Sex by Income Bracket in Church Hill
The most common earnings brackets in Church Hill are $25,000 to $29,999 for men (69 | 22.6%) and $2,499 or less for women (33 | 13.2%).
| Income | Male | Female |
| $2,499 or less | 4 (1.3%) | 33 (13.2%) |
| $2,500 to $4,999 | 0 (0.0%) | 1 (0.4%) |
| $5,000 to $7,499 | 0 (0.0%) | 4 (1.6%) |
| $7,500 to $9,999 | 22 (7.2%) | 0 (0.0%) |
| $10,000 to $12,499 | 0 (0.0%) | 4 (1.6%) |
| $12,500 to $14,999 | 0 (0.0%) | 10 (4.0%) |
| $15,000 to $17,499 | 0 (0.0%) | 0 (0.0%) |
| $17,500 to $19,999 | 4 (1.3%) | 12 (4.8%) |
| $20,000 to $22,499 | 13 (4.3%) | 6 (2.4%) |
| $22,500 to $24,999 | 6 (2.0%) | 0 (0.0%) |
| $25,000 to $29,999 | 69 (22.6%) | 0 (0.0%) |
| $30,000 to $34,999 | 13 (4.3%) | 17 (6.8%) |
| $35,000 to $39,999 | 10 (3.3%) | 23 (9.2%) |
| $40,000 to $44,999 | 51 (16.7%) | 5 (2.0%) |
| $45,000 to $49,999 | 2 (0.7%) | 14 (5.6%) |
| $50,000 to $54,999 | 32 (10.5%) | 31 (12.3%) |
| $55,000 to $64,999 | 21 (6.9%) | 10 (4.0%) |
| $65,000 to $74,999 | 19 (6.2%) | 27 (10.8%) |
| $75,000 to $99,999 | 21 (6.9%) | 22 (8.8%) |
| $100,000+ | 18 (5.9%) | 32 (12.8%) |
| Total | 305 (100.0%) | 251 (100.0%) |
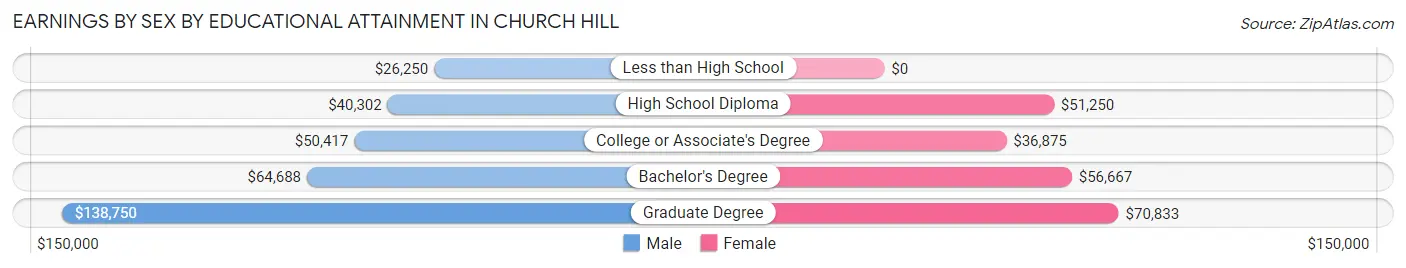
Earnings by Sex by Educational Attainment in Church Hill
Average earnings in Church Hill are $41,212 for men and $52,443 for women, a difference of 21.4%. Men with an educational attainment of graduate degree enjoy the highest average annual earnings of $138,750, while those with less than high school education earn the least with $26,250. Women with an educational attainment of graduate degree earn the most with the average annual earnings of $70,833, while those with college or associate's degree education have the smallest earnings of $36,875.
| Educational Attainment | Male Income | Female Income |
| Less than High School | $26,250 | $0 |
| High School Diploma | $40,302 | $51,250 |
| College or Associate's Degree | $50,417 | $36,875 |
| Bachelor's Degree | $64,688 | $56,667 |
| Graduate Degree | $138,750 | $70,833 |
| Total | $41,212 | $52,443 |
Family Income in Church Hill
Family Income Brackets in Church Hill
According to the Church Hill family income data, there are 78 families falling into the $50,000 to $74,999 income range, which is the most common income bracket and makes up 26.4% of all families.
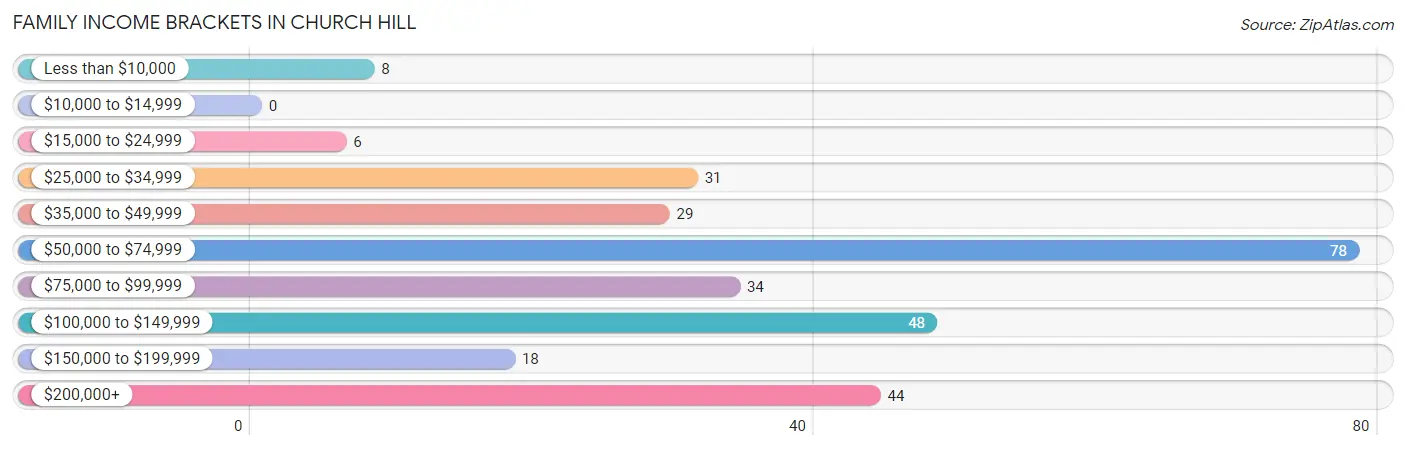
| Income Bracket | # Families | % Families |
| Less than $10,000 | 8 | 2.7% |
| $10,000 to $14,999 | 0 | 0.0% |
| $15,000 to $24,999 | 6 | 2.0% |
| $25,000 to $34,999 | 31 | 10.5% |
| $35,000 to $49,999 | 29 | 9.8% |
| $50,000 to $74,999 | 78 | 26.4% |
| $75,000 to $99,999 | 34 | 11.5% |
| $100,000 to $149,999 | 48 | 16.2% |
| $150,000 to $199,999 | 18 | 6.1% |
| $200,000+ | 44 | 14.9% |
Family Income by Famaliy Size in Church Hill
2-person families (67 | 22.6%) account for the highest median family income in Church Hill with $104,896 per family, while 2-person families (67 | 22.6%) have the highest median income of $52,448 per family member.
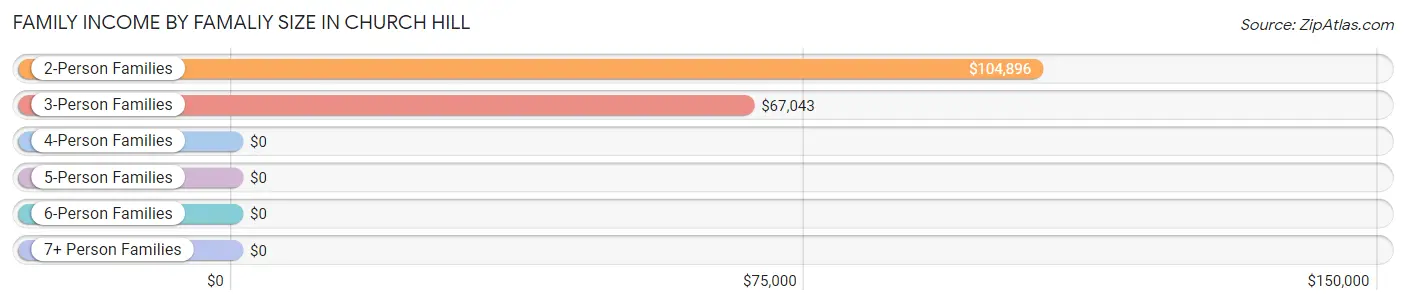
| Income Bracket | # Families | Median Income |
| 2-Person Families | 67 (22.6%) | $104,896 |
| 3-Person Families | 91 (30.7%) | $67,043 |
| 4-Person Families | 102 (34.5%) | $0 |
| 5-Person Families | 36 (12.2%) | $0 |
| 6-Person Families | 0 (0.0%) | $0 |
| 7+ Person Families | 0 (0.0%) | $0 |
| Total | 296 (100.0%) | $71,667 |
Family Income by Number of Earners in Church Hill
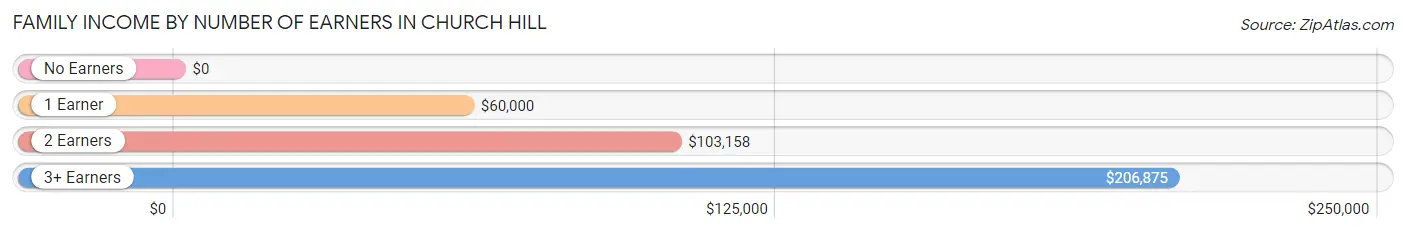
| Number of Earners | # Families | Median Income |
| No Earners | 26 (8.8%) | $0 |
| 1 Earner | 134 (45.3%) | $60,000 |
| 2 Earners | 112 (37.8%) | $103,158 |
| 3+ Earners | 24 (8.1%) | $206,875 |
| Total | 296 (100.0%) | $71,667 |
Household Income in Church Hill
Household Income Brackets in Church Hill
With 98 households falling in the category, the $50,000 to $74,999 income range is the most frequent in Church Hill, accounting for 22.1% of all households. In contrast, only 5 households (1.1%) fall into the $10,000 to $14,999 income bracket, making it the least populous group.
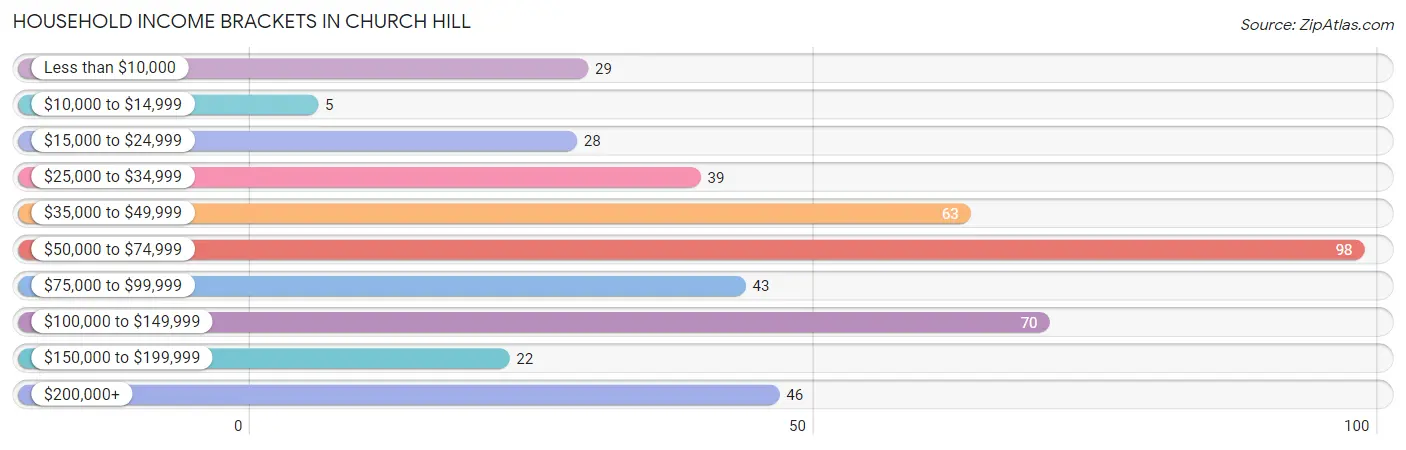
| Income Bracket | # Households | % Households |
| Less than $10,000 | 29 | 6.5% |
| $10,000 to $14,999 | 5 | 1.1% |
| $15,000 to $24,999 | 28 | 6.3% |
| $25,000 to $34,999 | 39 | 8.8% |
| $35,000 to $49,999 | 63 | 14.2% |
| $50,000 to $74,999 | 98 | 22.1% |
| $75,000 to $99,999 | 43 | 9.7% |
| $100,000 to $149,999 | 70 | 15.8% |
| $150,000 to $199,999 | 22 | 5.0% |
| $200,000+ | 46 | 10.4% |
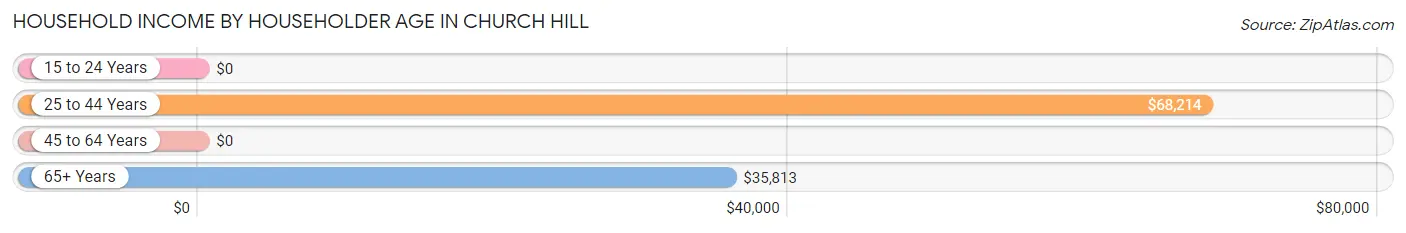
Household Income by Householder Age in Church Hill
The median household income in Church Hill is $66,432, with the highest median household income of $68,214 found in the 25 to 44 years age bracket for the primary householder. A total of 196 households (44.2%) fall into this category. Meanwhile, the 15 to 24 years age bracket for the primary householder has the lowest median household income of $0, with 15 households (3.4%) in this group.
| Income Bracket | # Households | Median Income |
| 15 to 24 Years | 15 (3.4%) | $0 |
| 25 to 44 Years | 196 (44.2%) | $68,214 |
| 45 to 64 Years | 119 (26.9%) | $0 |
| 65+ Years | 113 (25.5%) | $35,813 |
| Total | 443 (100.0%) | $66,432 |
Poverty in Church Hill
Income Below Poverty by Sex and Age in Church Hill
With 16.2% poverty level for males and 9.4% for females among the residents of Church Hill, 5 year old males and 12 to 14 year old females are the most vulnerable to poverty, with 3 males (33.3%) and 11 females (50.0%) in their respective age groups living below the poverty level.
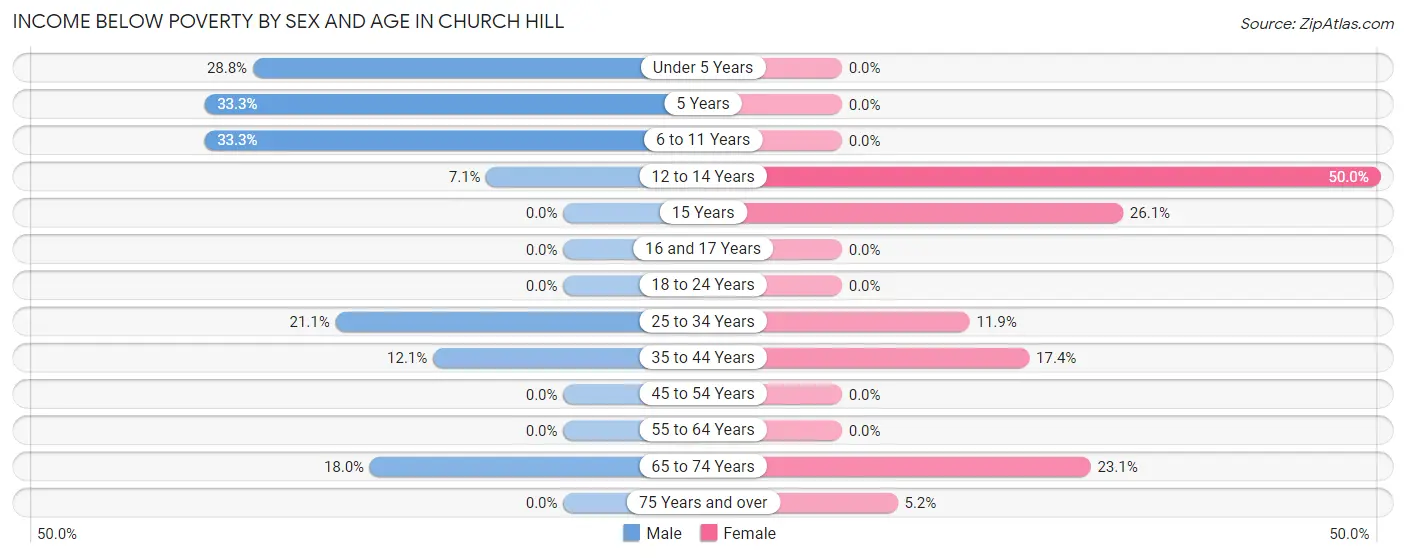
| Age Bracket | Male | Female |
| Under 5 Years | 17 (28.8%) | 0 (0.0%) |
| 5 Years | 3 (33.3%) | 0 (0.0%) |
| 6 to 11 Years | 15 (33.3%) | 0 (0.0%) |
| 12 to 14 Years | 1 (7.1%) | 11 (50.0%) |
| 15 Years | 0 (0.0%) | 6 (26.1%) |
| 16 and 17 Years | 0 (0.0%) | 0 (0.0%) |
| 18 to 24 Years | 0 (0.0%) | 0 (0.0%) |
| 25 to 34 Years | 26 (21.1%) | 14 (11.9%) |
| 35 to 44 Years | 11 (12.1%) | 12 (17.4%) |
| 45 to 54 Years | 0 (0.0%) | 0 (0.0%) |
| 55 to 64 Years | 0 (0.0%) | 0 (0.0%) |
| 65 to 74 Years | 7 (17.9%) | 9 (23.1%) |
| 75 Years and over | 0 (0.0%) | 3 (5.2%) |
| Total | 80 (16.2%) | 55 (9.4%) |
Income Above Poverty by Sex and Age in Church Hill
According to the poverty statistics in Church Hill, males aged 15 years and females aged under 5 years are the age groups that are most secure financially, with 100.0% of males and 100.0% of females in these age groups living above the poverty line.
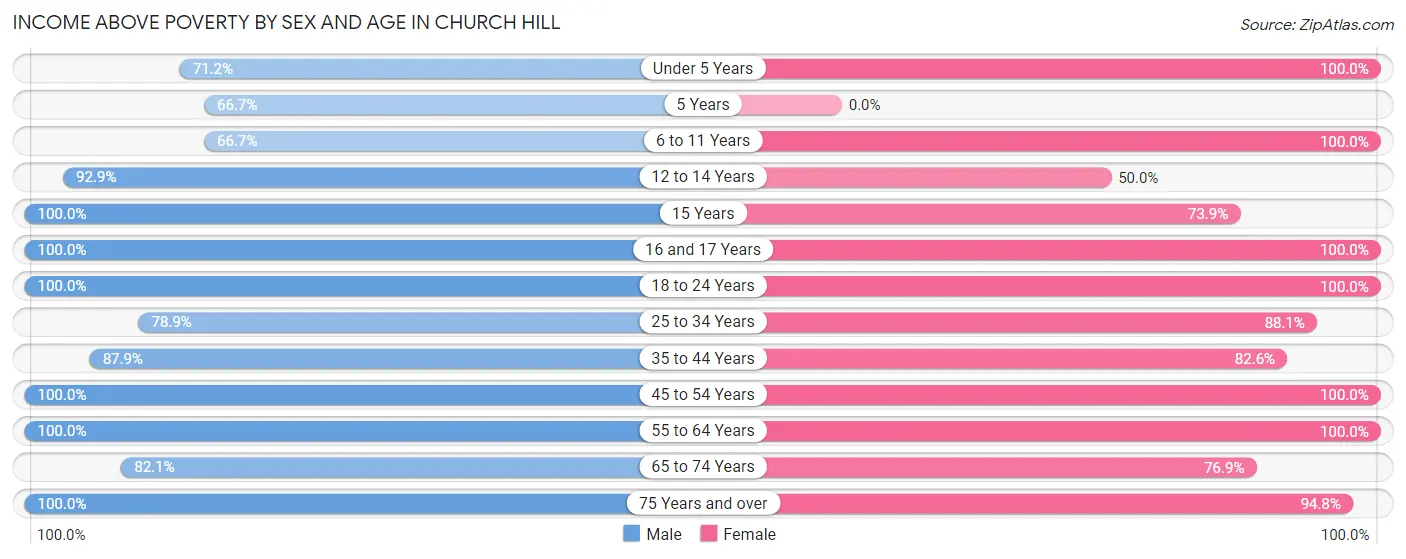
| Age Bracket | Male | Female |
| Under 5 Years | 42 (71.2%) | 47 (100.0%) |
| 5 Years | 6 (66.7%) | 0 (0.0%) |
| 6 to 11 Years | 30 (66.7%) | 29 (100.0%) |
| 12 to 14 Years | 13 (92.9%) | 11 (50.0%) |
| 15 Years | 9 (100.0%) | 17 (73.9%) |
| 16 and 17 Years | 8 (100.0%) | 37 (100.0%) |
| 18 to 24 Years | 25 (100.0%) | 21 (100.0%) |
| 25 to 34 Years | 97 (78.9%) | 104 (88.1%) |
| 35 to 44 Years | 80 (87.9%) | 57 (82.6%) |
| 45 to 54 Years | 28 (100.0%) | 31 (100.0%) |
| 55 to 64 Years | 33 (100.0%) | 93 (100.0%) |
| 65 to 74 Years | 32 (82.1%) | 30 (76.9%) |
| 75 Years and over | 11 (100.0%) | 55 (94.8%) |
| Total | 414 (83.8%) | 532 (90.6%) |
Income Below Poverty Among Married-Couple Families in Church Hill
The poverty statistics for married-couple families in Church Hill show that 12.0% or 26 of the total 216 families live below the poverty line. Families with 1 or 2 children have the highest poverty rate of 20.8%, comprising of 26 families. On the other hand, families with no children have the lowest poverty rate of 0.0%, which includes 0 families.
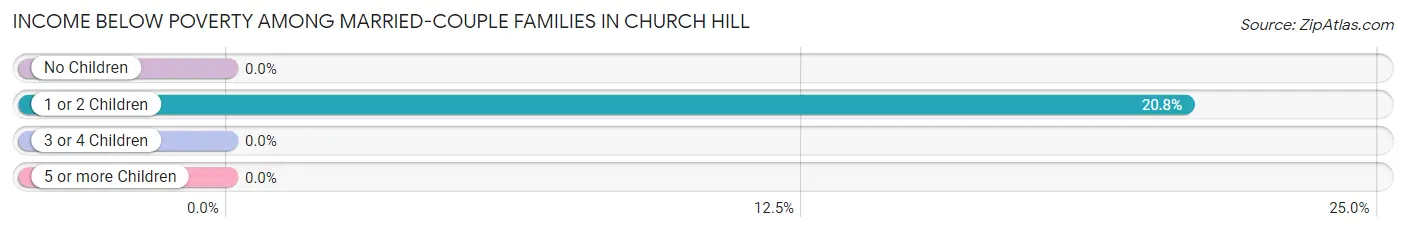
| Children | Above Poverty | Below Poverty |
| No Children | 71 (100.0%) | 0 (0.0%) |
| 1 or 2 Children | 99 (79.2%) | 26 (20.8%) |
| 3 or 4 Children | 20 (100.0%) | 0 (0.0%) |
| 5 or more Children | 0 (0.0%) | 0 (0.0%) |
| Total | 190 (88.0%) | 26 (12.0%) |
Income Below Poverty Among Single-Parent Households in Church Hill
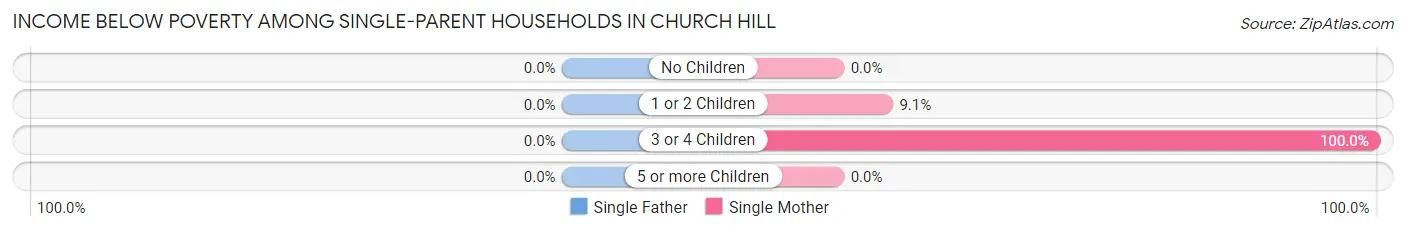
| Children | Single Father | Single Mother |
| No Children | 0 (0.0%) | 0 (0.0%) |
| 1 or 2 Children | 0 (0.0%) | 6 (9.1%) |
| 3 or 4 Children | 0 (0.0%) | 6 (100.0%) |
| 5 or more Children | 0 (0.0%) | 0 (0.0%) |
| Total | 0 (0.0%) | 12 (15.8%) |
Income Below Poverty Among Married-Couple vs Single-Parent Households in Church Hill
The poverty data for Church Hill shows that 26 of the married-couple family households (12.0%) and 12 of the single-parent households (15.0%) are living below the poverty level. Within the married-couple family households, those with 1 or 2 children have the highest poverty rate, with 26 households (20.8%) falling below the poverty line. Among the single-parent households, those with 3 or 4 children have the highest poverty rate, with 6 household (100.0%) living below poverty.
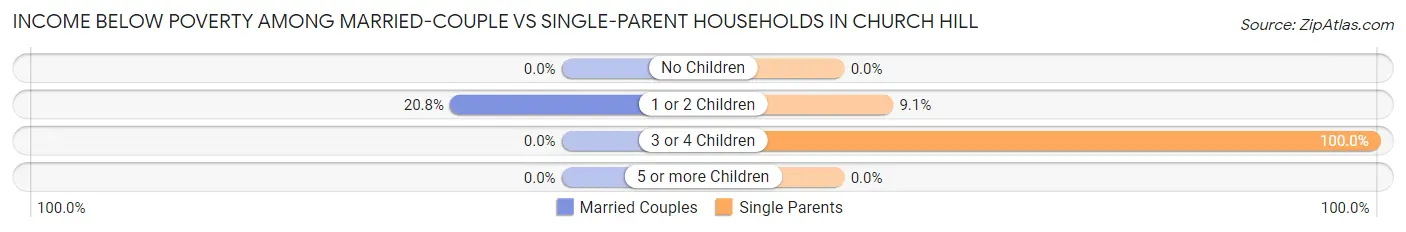
| Children | Married-Couple Families | Single-Parent Households |
| No Children | 0 (0.0%) | 0 (0.0%) |
| 1 or 2 Children | 26 (20.8%) | 6 (9.1%) |
| 3 or 4 Children | 0 (0.0%) | 6 (100.0%) |
| 5 or more Children | 0 (0.0%) | 0 (0.0%) |
| Total | 26 (12.0%) | 12 (15.0%) |
Race in Church Hill
The most populous races in Church Hill are White / Caucasian (669 | 61.7%), Hispanic or Latino (285 | 26.3%), and Some other Race (262 | 24.2%).
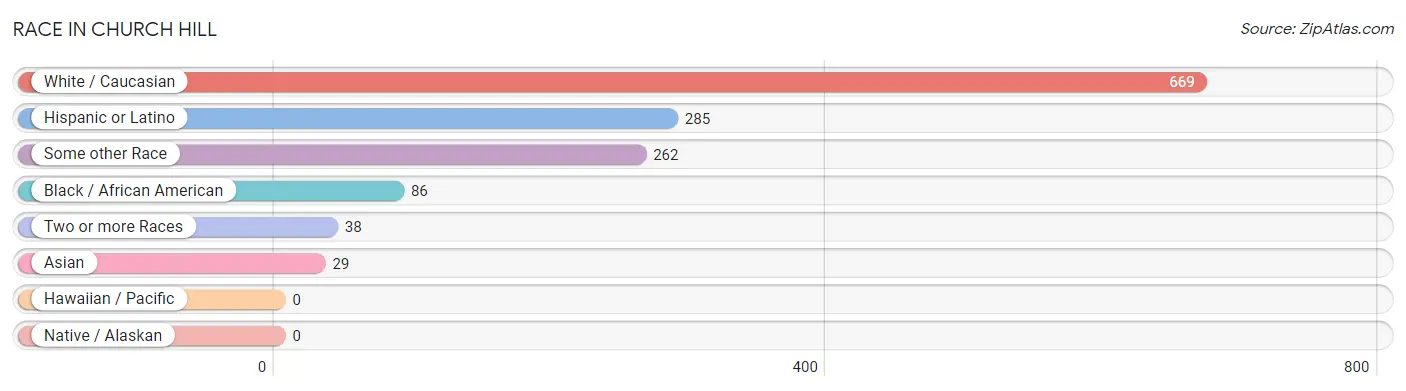
| Race | # Population | % Population |
| Asian | 29 | 2.7% |
| Black / African American | 86 | 7.9% |
| Hawaiian / Pacific | 0 | 0.0% |
| Hispanic or Latino | 285 | 26.3% |
| Native / Alaskan | 0 | 0.0% |
| White / Caucasian | 669 | 61.7% |
| Two or more Races | 38 | 3.5% |
| Some other Race | 262 | 24.2% |
| Total | 1,084 | 100.0% |
Ancestry in Church Hill
The most populous ancestries reported in Church Hill are Central American (205 | 18.9%), Guatemalan (205 | 18.9%), English (157 | 14.5%), German (116 | 10.7%), and Irish (95 | 8.8%), together accounting for 71.8% of all Church Hill residents.
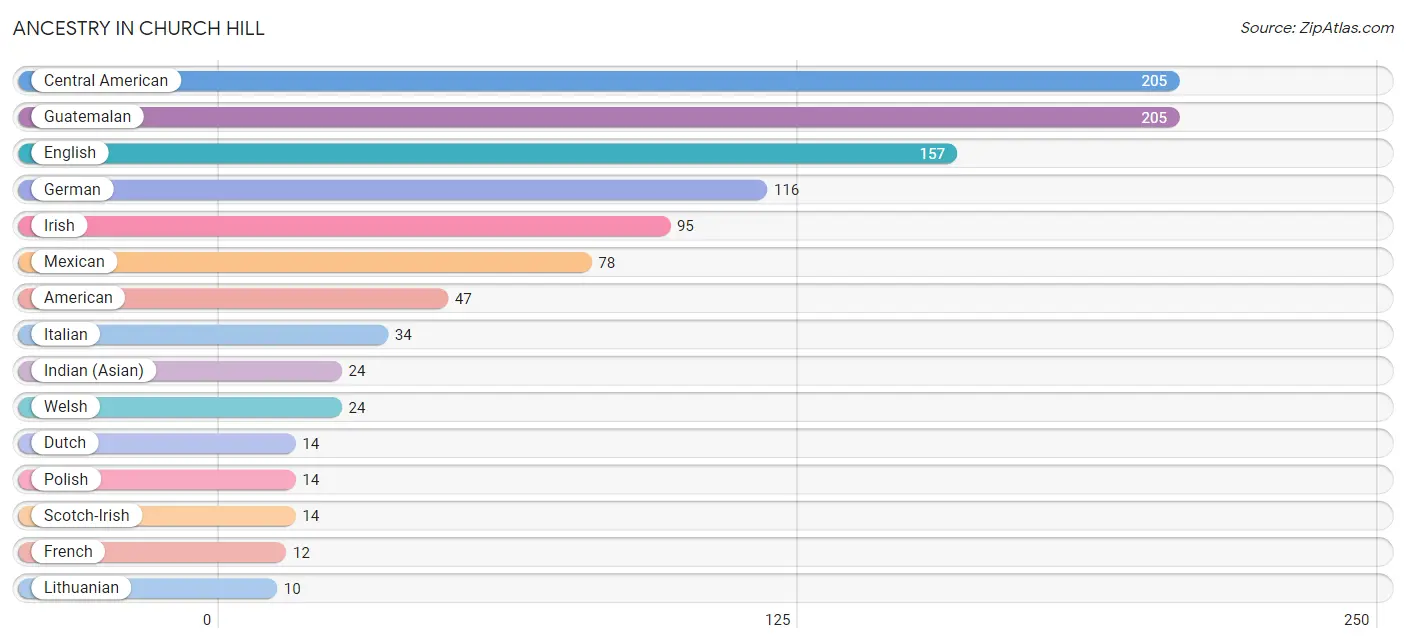
| Ancestry | # Population | % Population |
| American | 47 | 4.3% |
| Arab | 2 | 0.2% |
| British | 7 | 0.6% |
| Central American | 205 | 18.9% |
| Choctaw | 5 | 0.5% |
| Colombian | 2 | 0.2% |
| Dutch | 14 | 1.3% |
| English | 157 | 14.5% |
| European | 8 | 0.7% |
| Finnish | 3 | 0.3% |
| French | 12 | 1.1% |
| French Canadian | 2 | 0.2% |
| German | 116 | 10.7% |
| Greek | 3 | 0.3% |
| Guatemalan | 205 | 18.9% |
| Indian (Asian) | 24 | 2.2% |
| Irish | 95 | 8.8% |
| Italian | 34 | 3.1% |
| Lebanese | 2 | 0.2% |
| Lithuanian | 10 | 0.9% |
| Mexican | 78 | 7.2% |
| Polish | 14 | 1.3% |
| Russian | 2 | 0.2% |
| Scotch-Irish | 14 | 1.3% |
| Scottish | 1 | 0.1% |
| South American | 2 | 0.2% |
| Thai | 10 | 0.9% |
| Ukrainian | 3 | 0.3% |
| Welsh | 24 | 2.2% | View All 29 Rows |
Immigrants in Church Hill
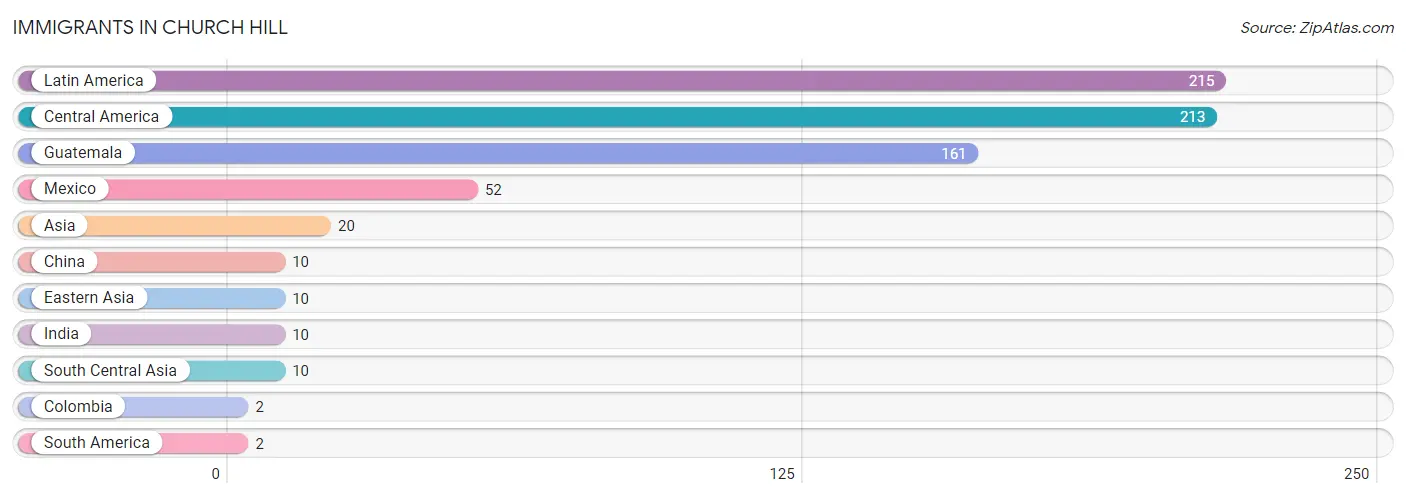
The most numerous immigrant groups reported in Church Hill came from Latin America (215 | 19.8%), Central America (213 | 19.7%), Guatemala (161 | 14.8%), Mexico (52 | 4.8%), and Asia (20 | 1.8%), together accounting for 61.0% of all Church Hill residents.
| Immigration Origin | # Population | % Population |
| Asia | 20 | 1.8% |
| Central America | 213 | 19.7% |
| China | 10 | 0.9% |
| Colombia | 2 | 0.2% |
| Eastern Asia | 10 | 0.9% |
| Guatemala | 161 | 14.8% |
| India | 10 | 0.9% |
| Latin America | 215 | 19.8% |
| Mexico | 52 | 4.8% |
| South America | 2 | 0.2% |
| South Central Asia | 10 | 0.9% | View All 11 Rows |
Sex and Age in Church Hill
Sex and Age in Church Hill
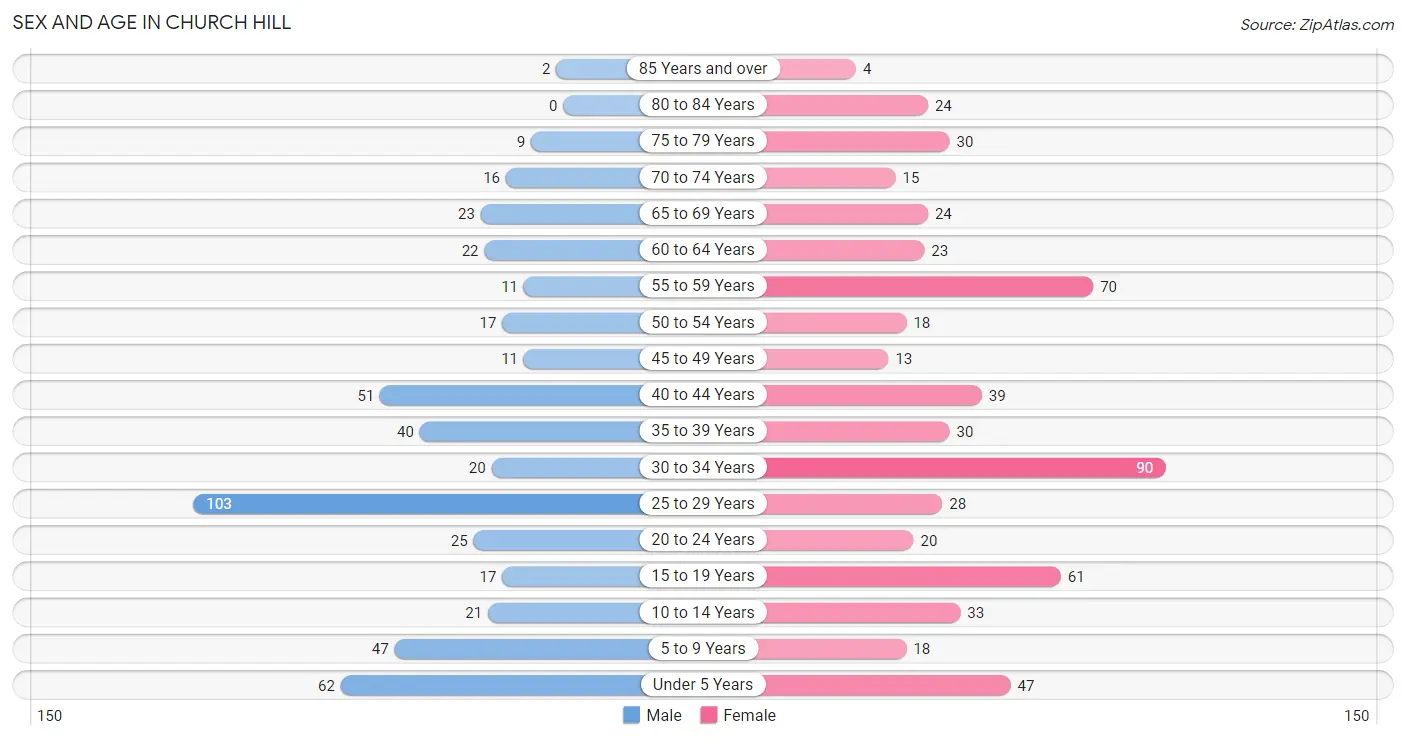
The most populous age groups in Church Hill are 25 to 29 Years (103 | 20.7%) for men and 30 to 34 Years (90 | 15.3%) for women.
| Age Bracket | Male | Female |
| Under 5 Years | 62 (12.5%) | 47 (8.0%) |
| 5 to 9 Years | 47 (9.5%) | 18 (3.1%) |
| 10 to 14 Years | 21 (4.2%) | 33 (5.6%) |
| 15 to 19 Years | 17 (3.4%) | 61 (10.4%) |
| 20 to 24 Years | 25 (5.0%) | 20 (3.4%) |
| 25 to 29 Years | 103 (20.7%) | 28 (4.8%) |
| 30 to 34 Years | 20 (4.0%) | 90 (15.3%) |
| 35 to 39 Years | 40 (8.1%) | 30 (5.1%) |
| 40 to 44 Years | 51 (10.3%) | 39 (6.6%) |
| 45 to 49 Years | 11 (2.2%) | 13 (2.2%) |
| 50 to 54 Years | 17 (3.4%) | 18 (3.1%) |
| 55 to 59 Years | 11 (2.2%) | 70 (11.9%) |
| 60 to 64 Years | 22 (4.4%) | 23 (3.9%) |
| 65 to 69 Years | 23 (4.6%) | 24 (4.1%) |
| 70 to 74 Years | 16 (3.2%) | 15 (2.6%) |
| 75 to 79 Years | 9 (1.8%) | 30 (5.1%) |
| 80 to 84 Years | 0 (0.0%) | 24 (4.1%) |
| 85 Years and over | 2 (0.4%) | 4 (0.7%) |
| Total | 497 (100.0%) | 587 (100.0%) |
Families and Households in Church Hill
Median Family Size in Church Hill
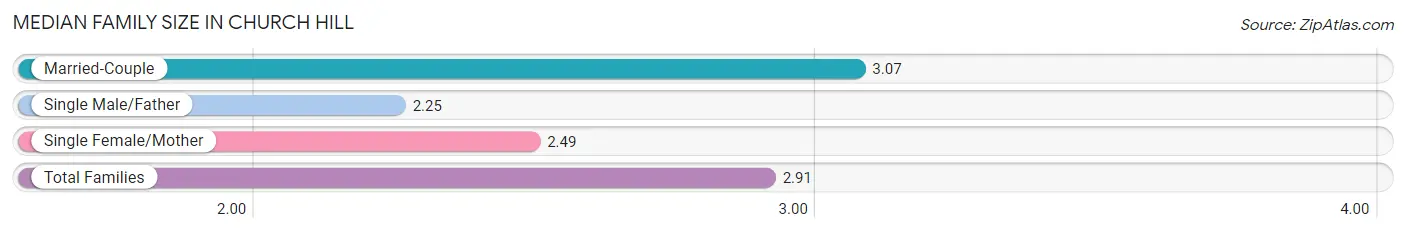
The median family size in Church Hill is 2.91 persons per family, with married-couple families (216 | 73.0%) accounting for the largest median family size of 3.07 persons per family. On the other hand, single male/father families (4 | 1.3%) represent the smallest median family size with 2.25 persons per family.
| Family Type | # Families | Family Size |
| Married-Couple | 216 (73.0%) | 3.07 |
| Single Male/Father | 4 (1.3%) | 2.25 |
| Single Female/Mother | 76 (25.7%) | 2.49 |
| Total Families | 296 (100.0%) | 2.91 |
Median Household Size in Church Hill
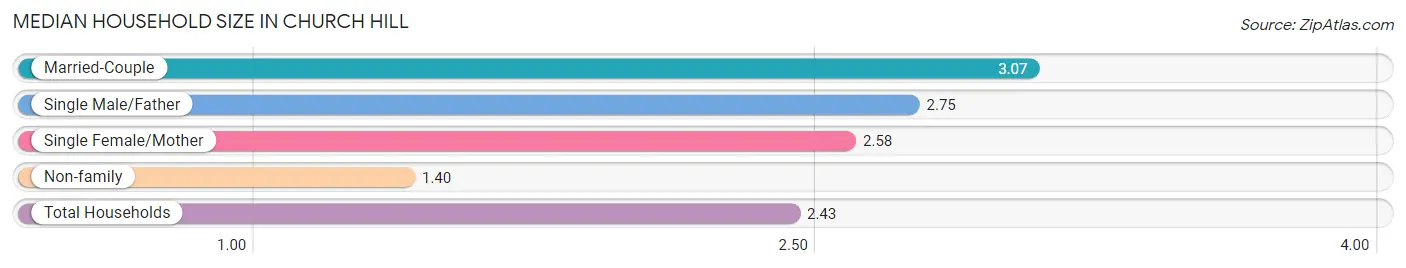
The median household size in Church Hill is 2.43 persons per household, with married-couple households (216 | 48.8%) accounting for the largest median household size of 3.07 persons per household. non-family households (147 | 33.2%) represent the smallest median household size with 1.40 persons per household.
| Household Type | # Households | Household Size |
| Married-Couple | 216 (48.8%) | 3.07 |
| Single Male/Father | 4 (0.9%) | 2.75 |
| Single Female/Mother | 76 (17.2%) | 2.58 |
| Non-family | 147 (33.2%) | 1.40 |
| Total Households | 443 (100.0%) | 2.43 |
Household Size by Marriage Status in Church Hill
Out of a total of 443 households in Church Hill, 296 (66.8%) are family households, while 147 (33.2%) are nonfamily households. The most numerous type of family households are 4-person households, comprising 100, and the most common type of nonfamily households are 1-person households, comprising 122.
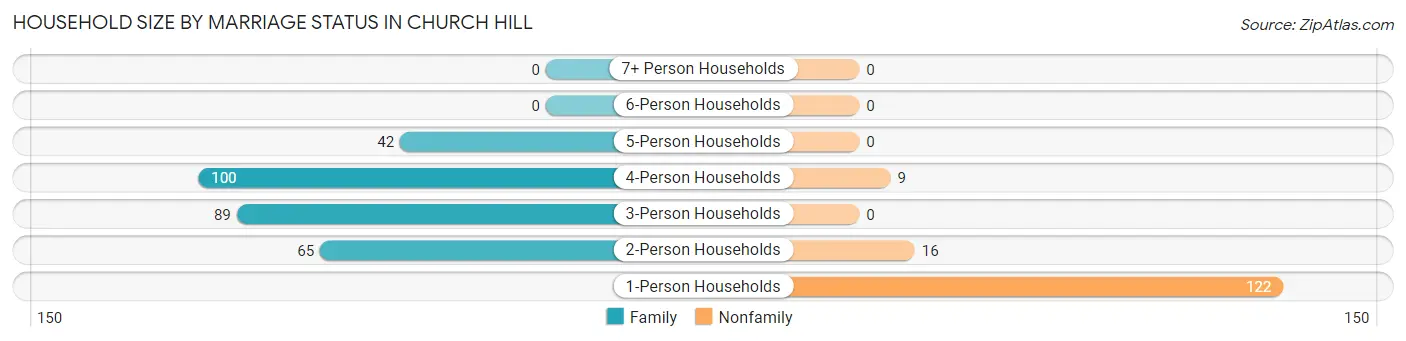
| Household Size | Family Households | Nonfamily Households |
| 1-Person Households | - | 122 (27.5%) |
| 2-Person Households | 65 (14.7%) | 16 (3.6%) |
| 3-Person Households | 89 (20.1%) | 0 (0.0%) |
| 4-Person Households | 100 (22.6%) | 9 (2.0%) |
| 5-Person Households | 42 (9.5%) | 0 (0.0%) |
| 6-Person Households | 0 (0.0%) | 0 (0.0%) |
| 7+ Person Households | 0 (0.0%) | 0 (0.0%) |
| Total | 296 (66.8%) | 147 (33.2%) |
Female Fertility in Church Hill
Fertility by Age in Church Hill
Average fertility rate in Church Hill is 56.0 births per 1,000 women. Women in the age bracket of 20 to 34 years have the highest fertility rate with 101.0 births per 1,000 women. Women in the age bracket of 20 to 34 years acount for 87.5% of all women with births.
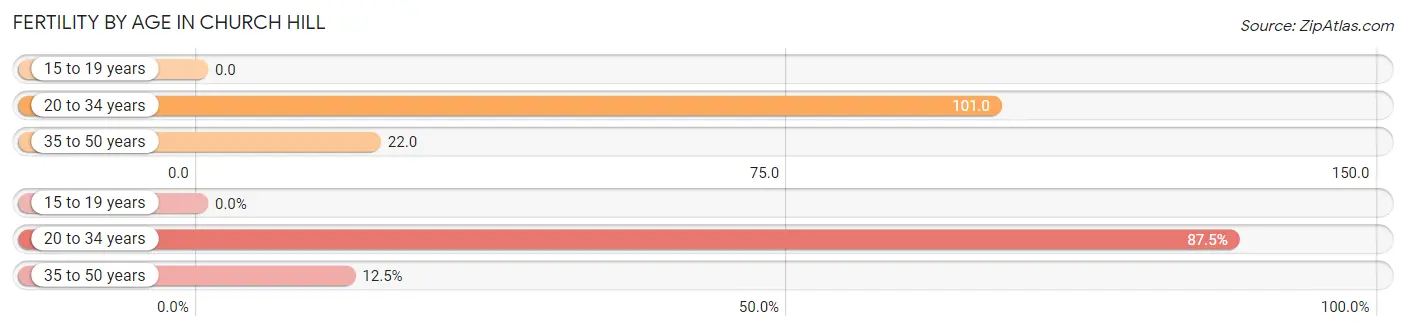
| Age Bracket | Women with Births | Births / 1,000 Women |
| 15 to 19 years | 0 (0.0%) | 0.0 |
| 20 to 34 years | 14 (87.5%) | 101.0 |
| 35 to 50 years | 2 (12.5%) | 22.0 |
| Total | 16 (100.0%) | 56.0 |
Fertility by Age by Marriage Status in Church Hill
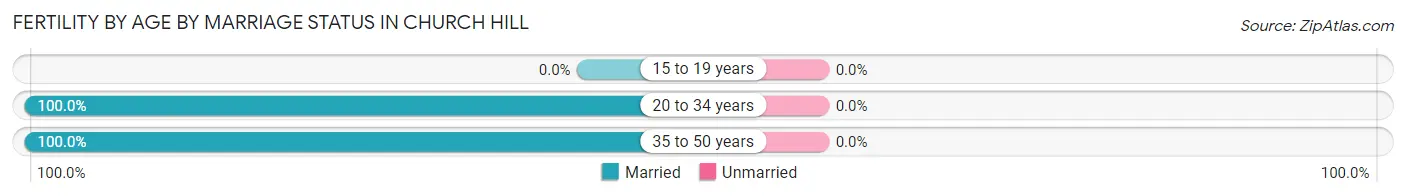
| Age Bracket | Married | Unmarried |
| 15 to 19 years | 0 (0.0%) | 0 (0.0%) |
| 20 to 34 years | 14 (100.0%) | 0 (0.0%) |
| 35 to 50 years | 2 (100.0%) | 0 (0.0%) |
| Total | 16 (100.0%) | 0 (0.0%) |
Fertility by Education in Church Hill
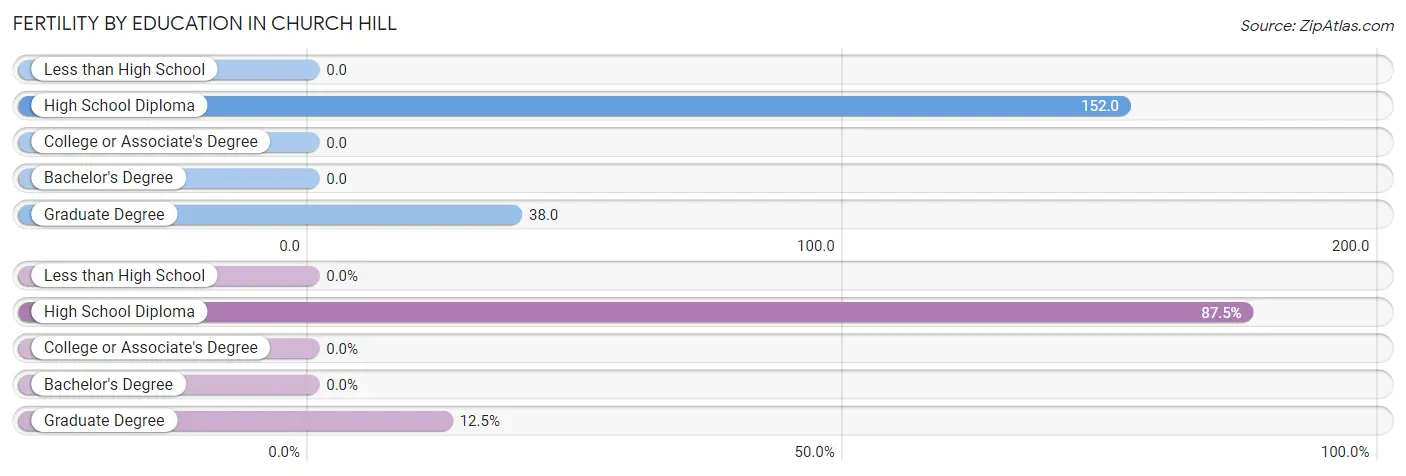
| Educational Attainment | Women with Births | Births / 1,000 Women |
| Less than High School | 0 (0.0%) | 0.0 |
| High School Diploma | 14 (87.5%) | 152.0 |
| College or Associate's Degree | 0 (0.0%) | 0.0 |
| Bachelor's Degree | 0 (0.0%) | 0.0 |
| Graduate Degree | 2 (12.5%) | 38.0 |
| Total | 16 (100.0%) | 56.0 |
Fertility by Education by Marriage Status in Church Hill
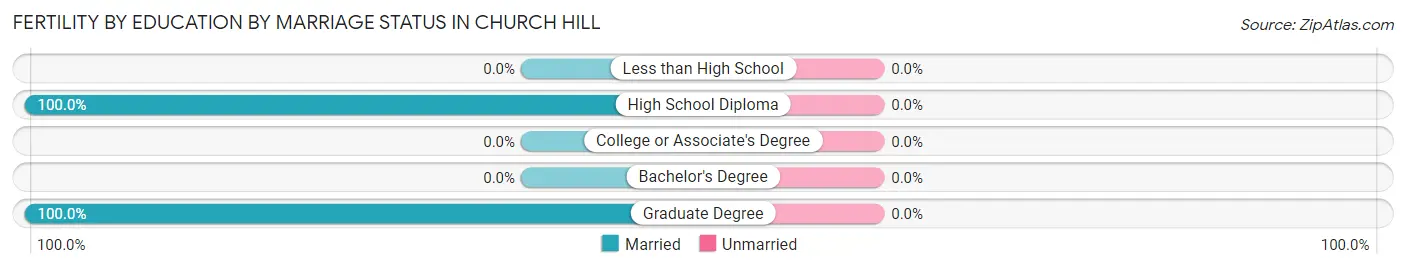
| Educational Attainment | Married | Unmarried |
| Less than High School | 0 (0.0%) | 0 (0.0%) |
| High School Diploma | 14 (100.0%) | 0 (0.0%) |
| College or Associate's Degree | 0 (0.0%) | 0 (0.0%) |
| Bachelor's Degree | 0 (0.0%) | 0 (0.0%) |
| Graduate Degree | 2 (100.0%) | 0 (0.0%) |
| Total | 16 (100.0%) | 0 (0.0%) |
Employment Characteristics in Church Hill
Employment by Class of Employer in Church Hill
Among the 541 employed individuals in Church Hill, private company employees (329 | 60.8%), local government employees (90 | 16.6%), and not-for-profit organizations (50 | 9.2%) make up the most common classes of employment.
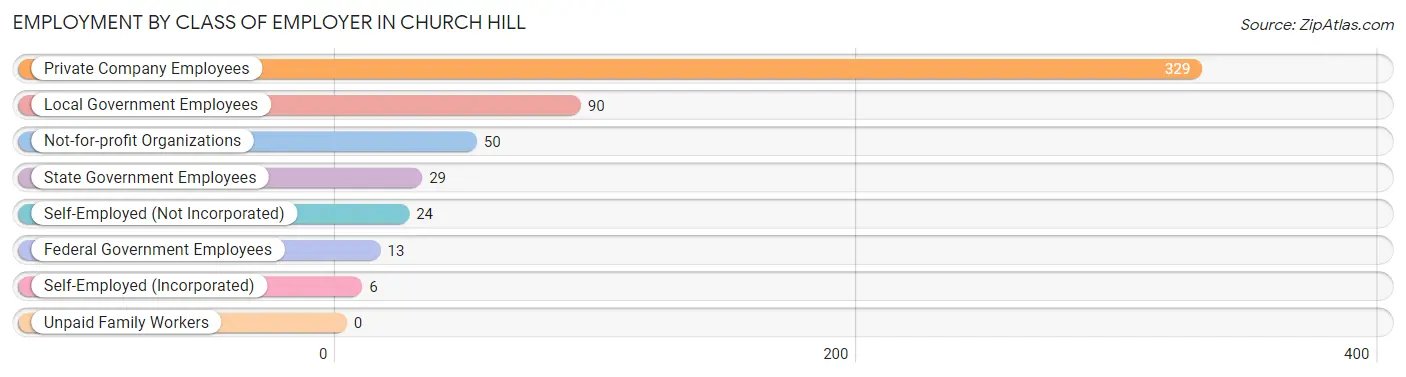
| Employer Class | # Employees | % Employees |
| Private Company Employees | 329 | 60.8% |
| Self-Employed (Incorporated) | 6 | 1.1% |
| Self-Employed (Not Incorporated) | 24 | 4.4% |
| Not-for-profit Organizations | 50 | 9.2% |
| Local Government Employees | 90 | 16.6% |
| State Government Employees | 29 | 5.4% |
| Federal Government Employees | 13 | 2.4% |
| Unpaid Family Workers | 0 | 0.0% |
| Total | 541 | 100.0% |
Employment Status by Age in Church Hill
According to the labor force statistics for Church Hill, out of the total population over 16 years of age (824), 65.9% or 543 individuals are in the labor force, with 0.4% or 2 of them unemployed. The age group with the highest labor force participation rate is 35 to 44 years, with 95.0% or 152 individuals in the labor force. Within the labor force, the 35 to 44 years age range has the highest percentage of unemployed individuals, with 1.3% or 2 of them being unemployed.
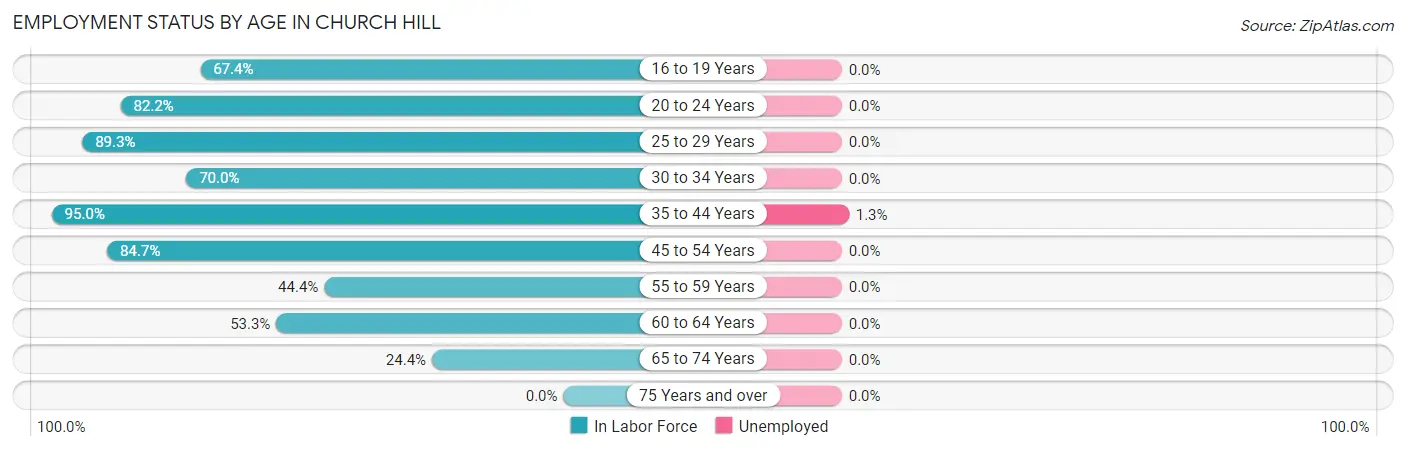
| Age Bracket | In Labor Force | Unemployed |
| 16 to 19 Years | 31 (67.4%) | 0 (0.0%) |
| 20 to 24 Years | 37 (82.2%) | 0 (0.0%) |
| 25 to 29 Years | 117 (89.3%) | 0 (0.0%) |
| 30 to 34 Years | 77 (70.0%) | 0 (0.0%) |
| 35 to 44 Years | 152 (95.0%) | 2 (1.3%) |
| 45 to 54 Years | 50 (84.7%) | 0 (0.0%) |
| 55 to 59 Years | 36 (44.4%) | 0 (0.0%) |
| 60 to 64 Years | 24 (53.3%) | 0 (0.0%) |
| 65 to 74 Years | 19 (24.4%) | 0 (0.0%) |
| 75 Years and over | 0 (0.0%) | 0 (0.0%) |
| Total | 543 (65.9%) | 2 (0.4%) |
Employment Status by Educational Attainment in Church Hill
According to labor force statistics for Church Hill, 77.8% of individuals (456) out of the total population between 25 and 64 years of age (586) are in the labor force, with 0.4% or 2 of them being unemployed. The group with the highest labor force participation rate are those with the educational attainment of bachelor's degree or higher, with 95.7% or 156 individuals in the labor force. Within the labor force, individuals with college / associate degree education have the highest percentage of unemployment, with 2.9% or 2 of them being unemployed.
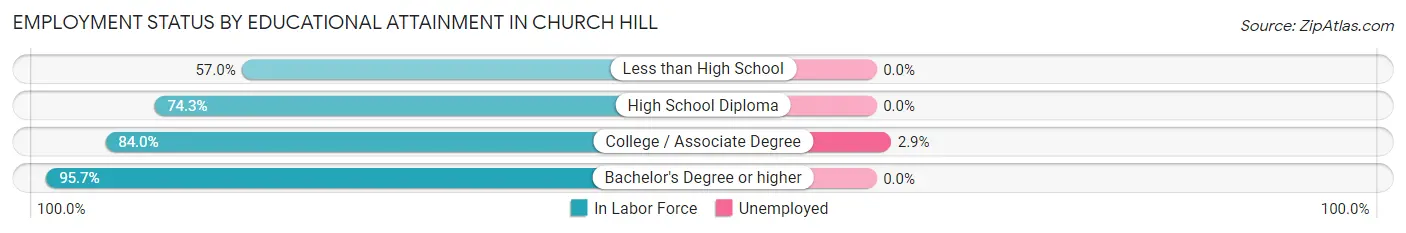
| Educational Attainment | In Labor Force | Unemployed |
| Less than High School | 73 (57.0%) | 0 (0.0%) |
| High School Diploma | 159 (74.3%) | 0 (0.0%) |
| College / Associate Degree | 68 (84.0%) | 2 (2.9%) |
| Bachelor's Degree or higher | 156 (95.7%) | 0 (0.0%) |
| Total | 456 (77.8%) | 2 (0.4%) |
Employment Occupations by Sex in Church Hill
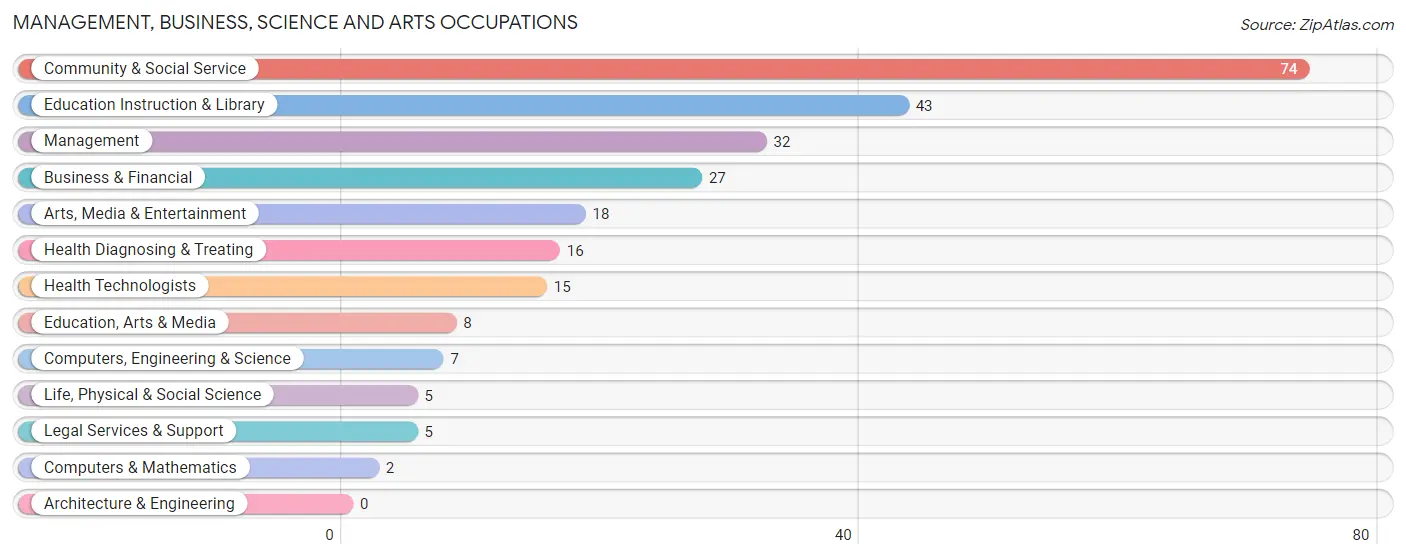
Management, Business, Science and Arts Occupations
The most common Management, Business, Science and Arts occupations in Church Hill are Community & Social Service (74 | 13.7%), Education Instruction & Library (43 | 8.0%), Management (32 | 5.9%), Business & Financial (27 | 5.0%), and Arts, Media & Entertainment (18 | 3.3%).
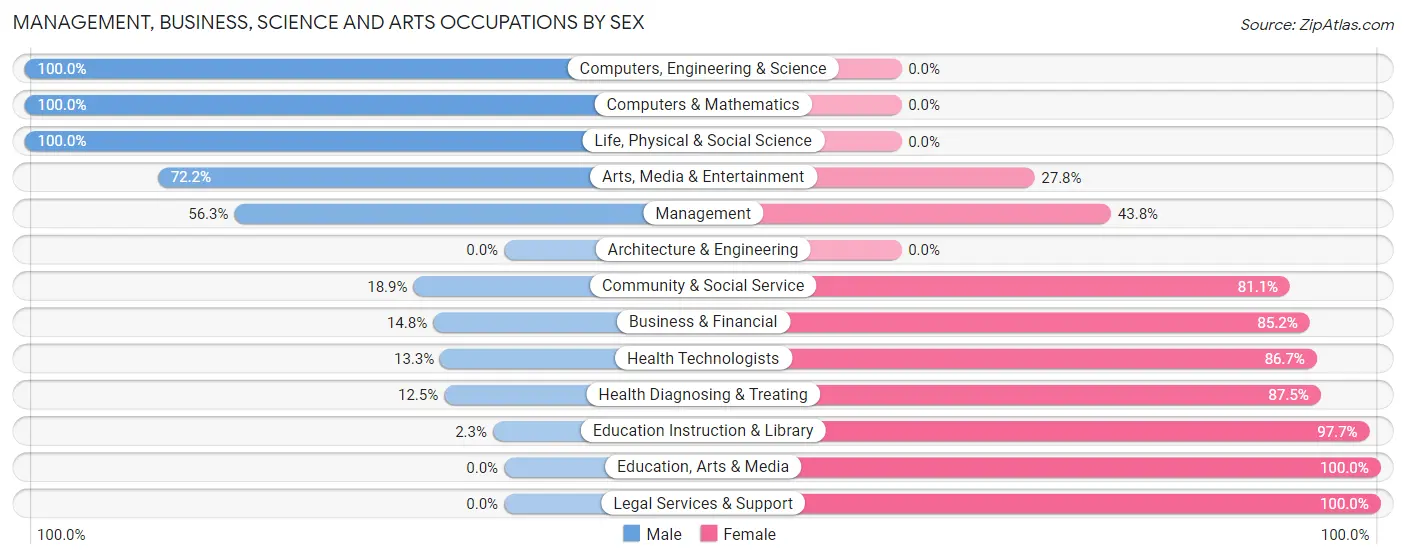
Management, Business, Science and Arts Occupations by Sex
Within the Management, Business, Science and Arts occupations in Church Hill, the most male-oriented occupations are Computers, Engineering & Science (100.0%), Computers & Mathematics (100.0%), and Life, Physical & Social Science (100.0%), while the most female-oriented occupations are Education, Arts & Media (100.0%), Legal Services & Support (100.0%), and Education Instruction & Library (97.7%).
| Occupation | Male | Female |
| Management | 18 (56.2%) | 14 (43.8%) |
| Business & Financial | 4 (14.8%) | 23 (85.2%) |
| Computers, Engineering & Science | 7 (100.0%) | 0 (0.0%) |
| Computers & Mathematics | 2 (100.0%) | 0 (0.0%) |
| Architecture & Engineering | 0 (0.0%) | 0 (0.0%) |
| Life, Physical & Social Science | 5 (100.0%) | 0 (0.0%) |
| Community & Social Service | 14 (18.9%) | 60 (81.1%) |
| Education, Arts & Media | 0 (0.0%) | 8 (100.0%) |
| Legal Services & Support | 0 (0.0%) | 5 (100.0%) |
| Education Instruction & Library | 1 (2.3%) | 42 (97.7%) |
| Arts, Media & Entertainment | 13 (72.2%) | 5 (27.8%) |
| Health Diagnosing & Treating | 2 (12.5%) | 14 (87.5%) |
| Health Technologists | 2 (13.3%) | 13 (86.7%) |
| Total (Category) | 45 (28.8%) | 111 (71.2%) |
| Total (Overall) | 305 (56.4%) | 236 (43.6%) |
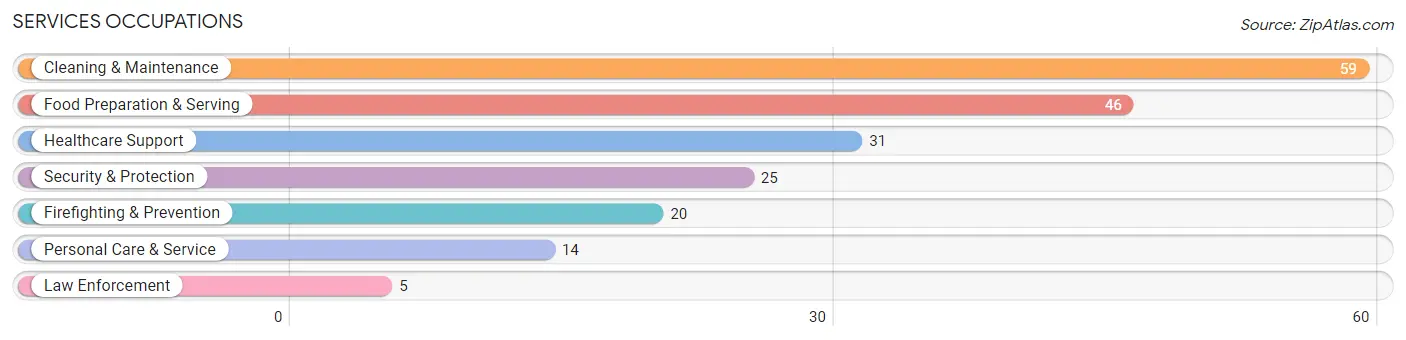
Services Occupations
The most common Services occupations in Church Hill are Cleaning & Maintenance (59 | 10.9%), Food Preparation & Serving (46 | 8.5%), Healthcare Support (31 | 5.7%), Security & Protection (25 | 4.6%), and Firefighting & Prevention (20 | 3.7%).
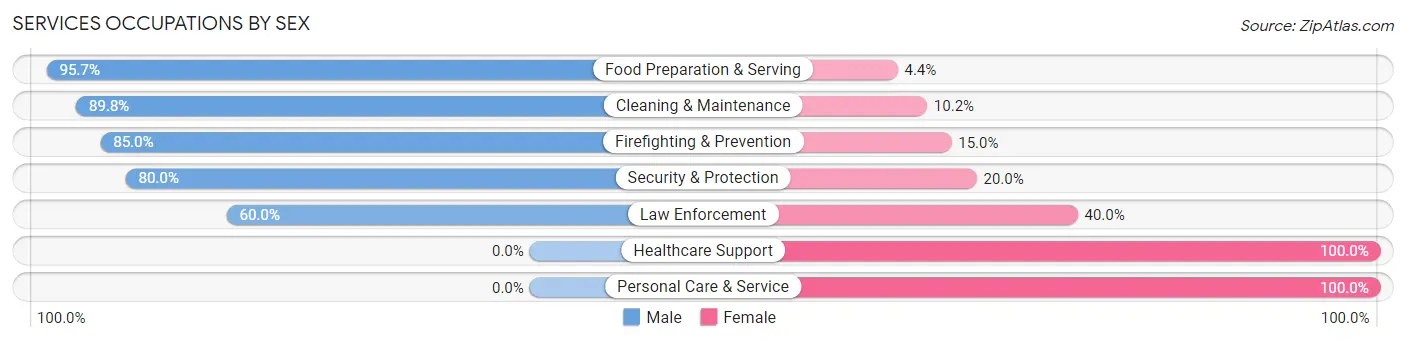
Services Occupations by Sex
Within the Services occupations in Church Hill, the most male-oriented occupations are Food Preparation & Serving (95.7%), Cleaning & Maintenance (89.8%), and Firefighting & Prevention (85.0%), while the most female-oriented occupations are Healthcare Support (100.0%), Personal Care & Service (100.0%), and Law Enforcement (40.0%).
| Occupation | Male | Female |
| Healthcare Support | 0 (0.0%) | 31 (100.0%) |
| Security & Protection | 20 (80.0%) | 5 (20.0%) |
| Firefighting & Prevention | 17 (85.0%) | 3 (15.0%) |
| Law Enforcement | 3 (60.0%) | 2 (40.0%) |
| Food Preparation & Serving | 44 (95.7%) | 2 (4.3%) |
| Cleaning & Maintenance | 53 (89.8%) | 6 (10.2%) |
| Personal Care & Service | 0 (0.0%) | 14 (100.0%) |
| Total (Category) | 117 (66.9%) | 58 (33.1%) |
| Total (Overall) | 305 (56.4%) | 236 (43.6%) |
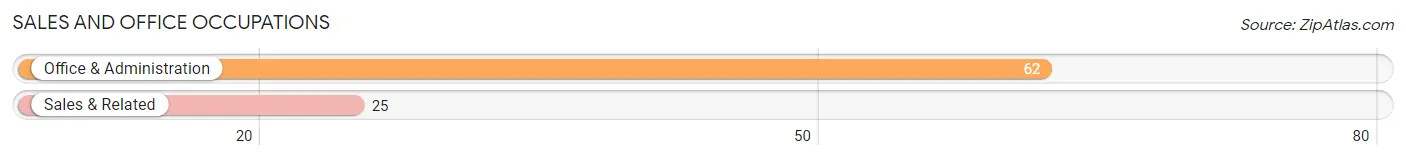
Sales and Office Occupations
The most common Sales and Office occupations in Church Hill are Office & Administration (62 | 11.5%), and Sales & Related (25 | 4.6%).
Sales and Office Occupations by Sex
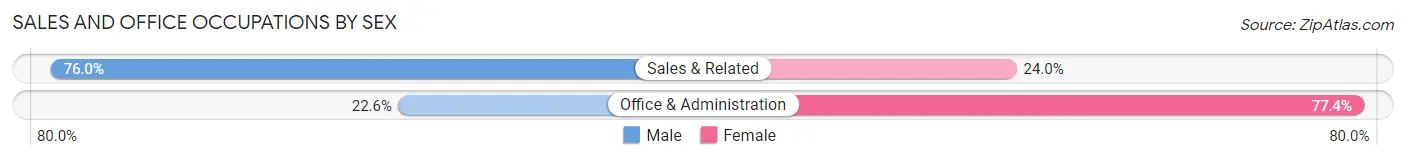
| Occupation | Male | Female |
| Sales & Related | 19 (76.0%) | 6 (24.0%) |
| Office & Administration | 14 (22.6%) | 48 (77.4%) |
| Total (Category) | 33 (37.9%) | 54 (62.1%) |
| Total (Overall) | 305 (56.4%) | 236 (43.6%) |
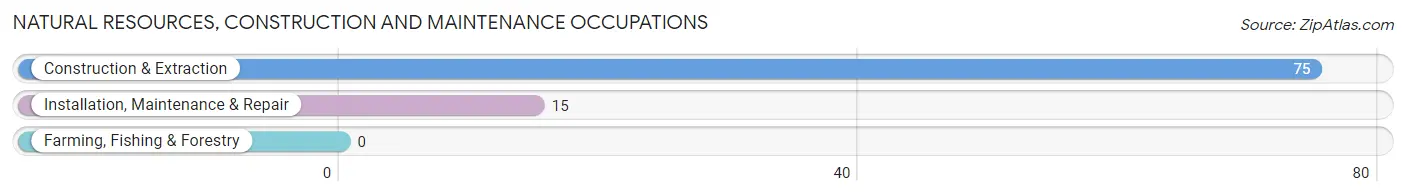
Natural Resources, Construction and Maintenance Occupations
The most common Natural Resources, Construction and Maintenance occupations in Church Hill are Construction & Extraction (75 | 13.9%), and Installation, Maintenance & Repair (15 | 2.8%).
Natural Resources, Construction and Maintenance Occupations by Sex
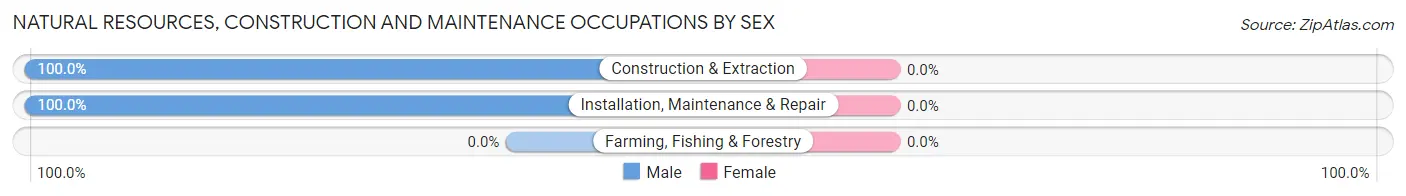
| Occupation | Male | Female |
| Farming, Fishing & Forestry | 0 (0.0%) | 0 (0.0%) |
| Construction & Extraction | 75 (100.0%) | 0 (0.0%) |
| Installation, Maintenance & Repair | 15 (100.0%) | 0 (0.0%) |
| Total (Category) | 90 (100.0%) | 0 (0.0%) |
| Total (Overall) | 305 (56.4%) | 236 (43.6%) |
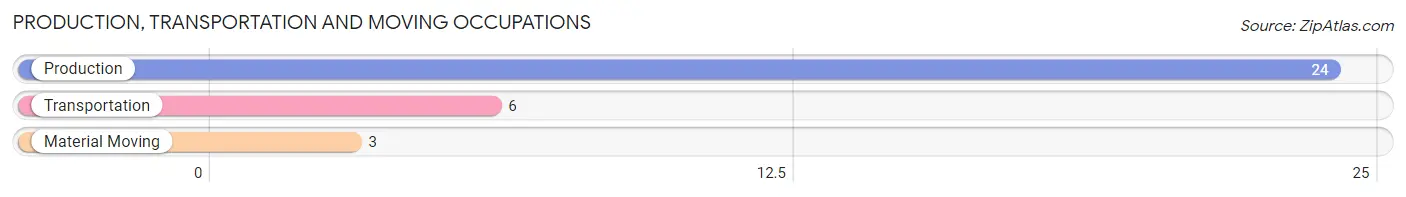
Production, Transportation and Moving Occupations
The most common Production, Transportation and Moving occupations in Church Hill are Production (24 | 4.4%), Transportation (6 | 1.1%), and Material Moving (3 | 0.5%).
Production, Transportation and Moving Occupations by Sex
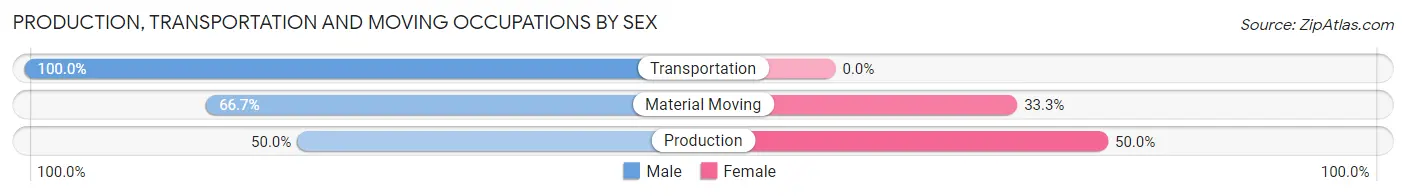
| Occupation | Male | Female |
| Production | 12 (50.0%) | 12 (50.0%) |
| Transportation | 6 (100.0%) | 0 (0.0%) |
| Material Moving | 2 (66.7%) | 1 (33.3%) |
| Total (Category) | 20 (60.6%) | 13 (39.4%) |
| Total (Overall) | 305 (56.4%) | 236 (43.6%) |
Employment Industries by Sex in Church Hill
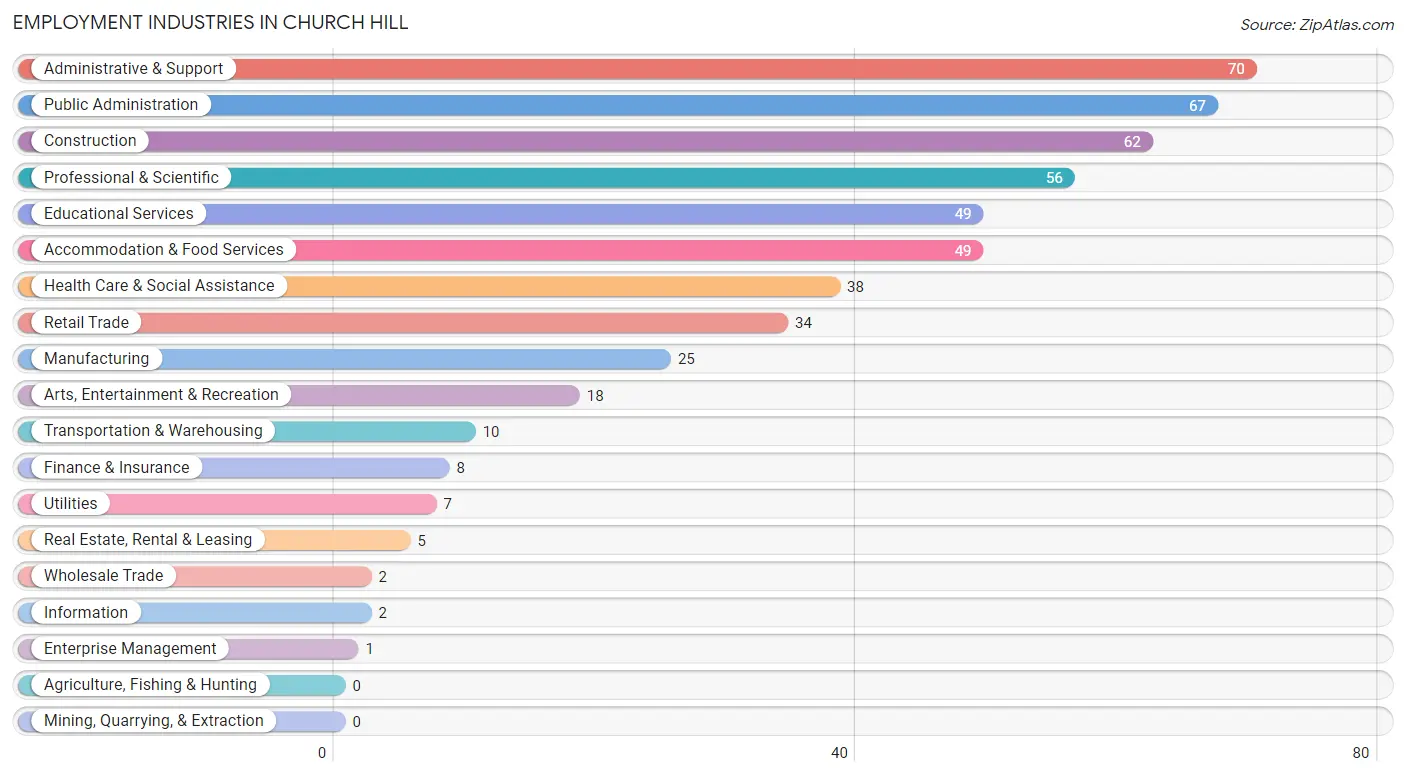
Employment Industries in Church Hill
The major employment industries in Church Hill include Administrative & Support (70 | 12.9%), Public Administration (67 | 12.4%), Construction (62 | 11.5%), Professional & Scientific (56 | 10.3%), and Educational Services (49 | 9.1%).
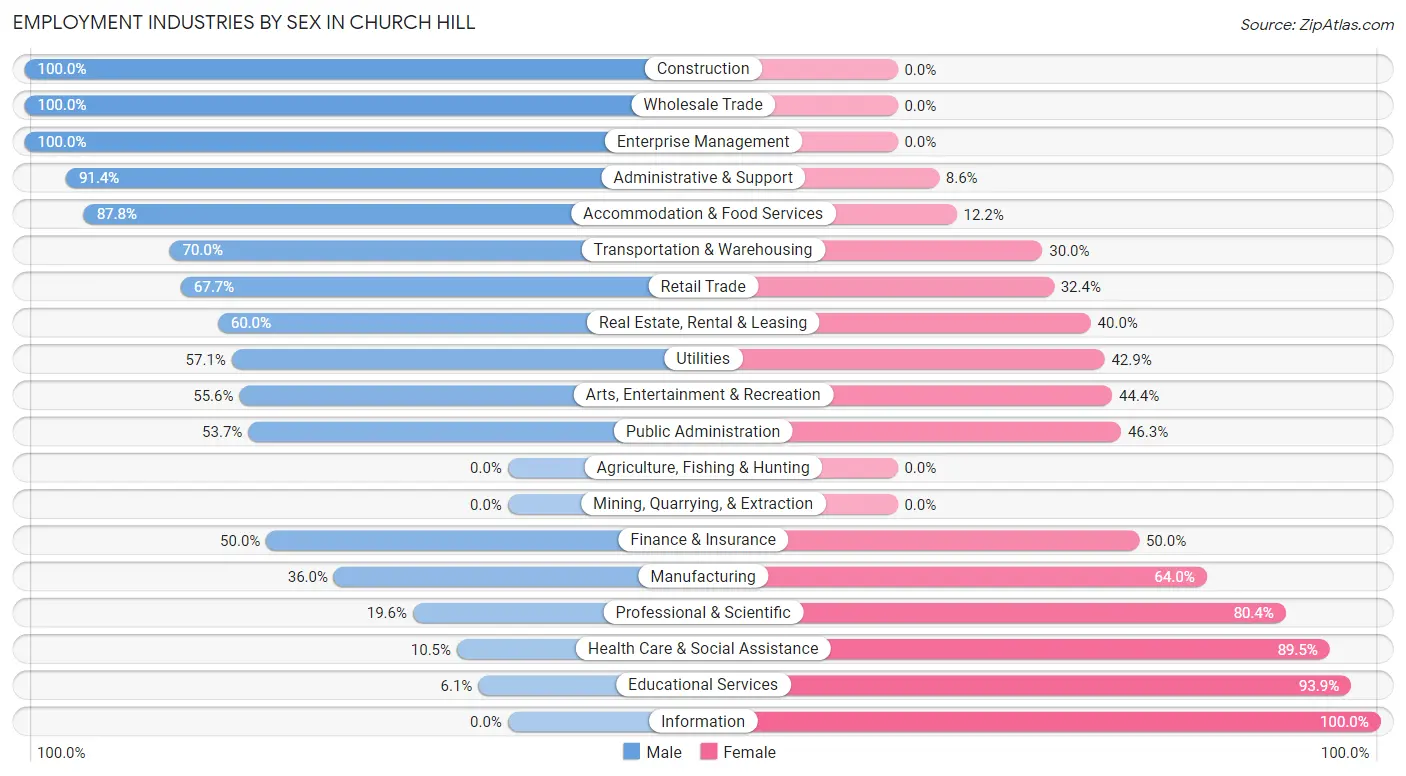
Employment Industries by Sex in Church Hill
The Church Hill industries that see more men than women are Construction (100.0%), Wholesale Trade (100.0%), and Enterprise Management (100.0%), whereas the industries that tend to have a higher number of women are Information (100.0%), Educational Services (93.9%), and Health Care & Social Assistance (89.5%).
| Industry | Male | Female |
| Agriculture, Fishing & Hunting | 0 (0.0%) | 0 (0.0%) |
| Mining, Quarrying, & Extraction | 0 (0.0%) | 0 (0.0%) |
| Construction | 62 (100.0%) | 0 (0.0%) |
| Manufacturing | 9 (36.0%) | 16 (64.0%) |
| Wholesale Trade | 2 (100.0%) | 0 (0.0%) |
| Retail Trade | 23 (67.6%) | 11 (32.4%) |
| Transportation & Warehousing | 7 (70.0%) | 3 (30.0%) |
| Utilities | 4 (57.1%) | 3 (42.9%) |
| Information | 0 (0.0%) | 2 (100.0%) |
| Finance & Insurance | 4 (50.0%) | 4 (50.0%) |
| Real Estate, Rental & Leasing | 3 (60.0%) | 2 (40.0%) |
| Professional & Scientific | 11 (19.6%) | 45 (80.4%) |
| Enterprise Management | 1 (100.0%) | 0 (0.0%) |
| Administrative & Support | 64 (91.4%) | 6 (8.6%) |
| Educational Services | 3 (6.1%) | 46 (93.9%) |
| Health Care & Social Assistance | 4 (10.5%) | 34 (89.5%) |
| Arts, Entertainment & Recreation | 10 (55.6%) | 8 (44.4%) |
| Accommodation & Food Services | 43 (87.8%) | 6 (12.2%) |
| Public Administration | 36 (53.7%) | 31 (46.3%) |
| Total | 305 (56.4%) | 236 (43.6%) |
Education in Church Hill
School Enrollment in Church Hill
The most common levels of schooling among the 228 students in Church Hill are high school (78 | 34.2%), middle school (56 | 24.6%), and elementary school (49 | 21.5%).
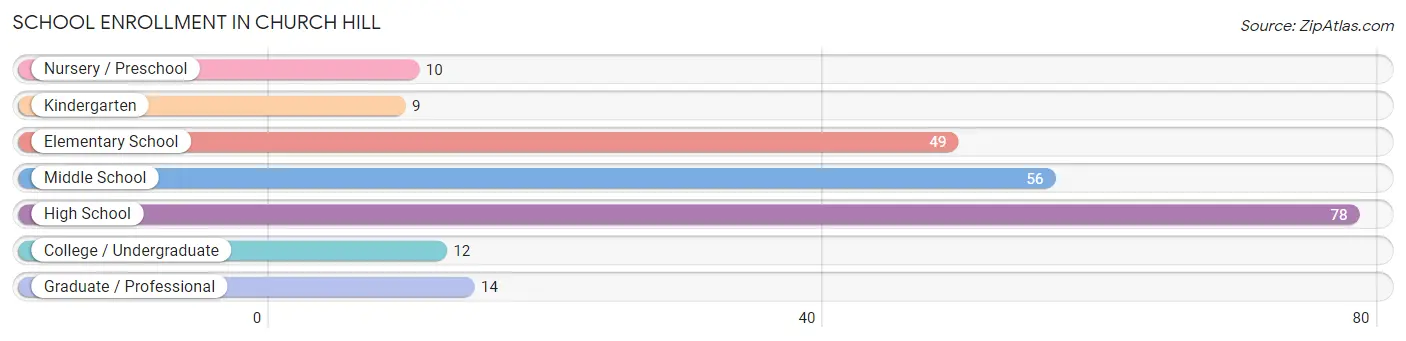
| School Level | # Students | % Students |
| Nursery / Preschool | 10 | 4.4% |
| Kindergarten | 9 | 4.0% |
| Elementary School | 49 | 21.5% |
| Middle School | 56 | 24.6% |
| High School | 78 | 34.2% |
| College / Undergraduate | 12 | 5.3% |
| Graduate / Professional | 14 | 6.1% |
| Total | 228 | 100.0% |
School Enrollment by Age by Funding Source in Church Hill
Out of a total of 228 students who are enrolled in schools in Church Hill, 30 (13.2%) attend a private institution, while the remaining 198 (86.8%) are enrolled in public schools. The age group of 25 to 34 year olds has the highest likelihood of being enrolled in private schools, with 12 (100.0% in the age bracket) enrolled. Conversely, the age group of 5 to 9 year old has the lowest likelihood of being enrolled in a private school, with 63 (100.0% in the age bracket) attending a public institution.
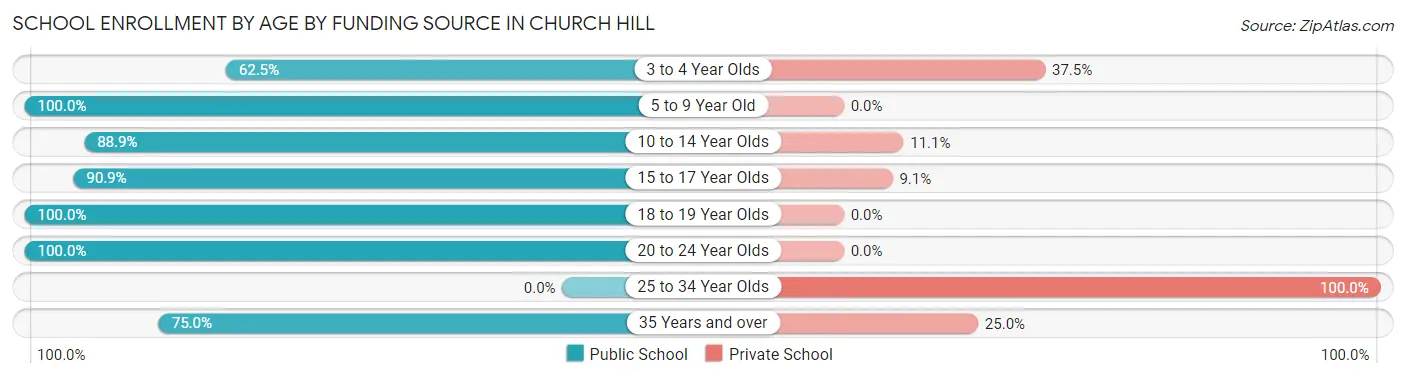
| Age Bracket | Public School | Private School |
| 3 to 4 Year Olds | 5 (62.5%) | 3 (37.5%) |
| 5 to 9 Year Old | 63 (100.0%) | 0 (0.0%) |
| 10 to 14 Year Olds | 48 (88.9%) | 6 (11.1%) |
| 15 to 17 Year Olds | 70 (90.9%) | 7 (9.1%) |
| 18 to 19 Year Olds | 1 (100.0%) | 0 (0.0%) |
| 20 to 24 Year Olds | 5 (100.0%) | 0 (0.0%) |
| 25 to 34 Year Olds | 0 (0.0%) | 12 (100.0%) |
| 35 Years and over | 6 (75.0%) | 2 (25.0%) |
| Total | 198 (86.8%) | 30 (13.2%) |
Educational Attainment by Field of Study in Church Hill
Science & technology (37 | 18.1%), business (30 | 14.7%), bio, nature & agricultural (24 | 11.8%), education (22 | 10.8%), and psychology (20 | 9.8%) are the most common fields of study among 204 individuals in Church Hill who have obtained a bachelor's degree or higher.
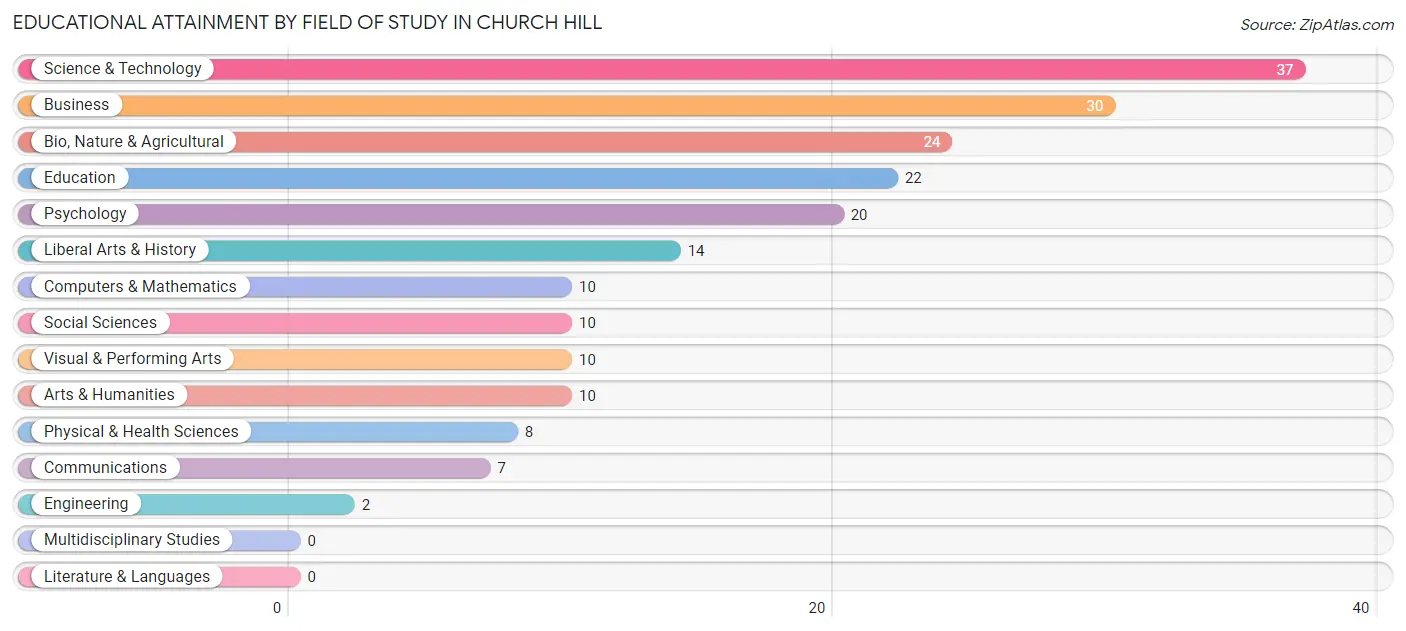
| Field of Study | # Graduates | % Graduates |
| Computers & Mathematics | 10 | 4.9% |
| Bio, Nature & Agricultural | 24 | 11.8% |
| Physical & Health Sciences | 8 | 3.9% |
| Psychology | 20 | 9.8% |
| Social Sciences | 10 | 4.9% |
| Engineering | 2 | 1.0% |
| Multidisciplinary Studies | 0 | 0.0% |
| Science & Technology | 37 | 18.1% |
| Business | 30 | 14.7% |
| Education | 22 | 10.8% |
| Literature & Languages | 0 | 0.0% |
| Liberal Arts & History | 14 | 6.9% |
| Visual & Performing Arts | 10 | 4.9% |
| Communications | 7 | 3.4% |
| Arts & Humanities | 10 | 4.9% |
| Total | 204 | 100.0% |
Transportation & Commute in Church Hill
Vehicle Availability by Sex in Church Hill
The most prevalent vehicle ownership categories in Church Hill are males with 2 vehicles (202, accounting for 66.2%) and females with 2 vehicles (143, making up 85.6%).
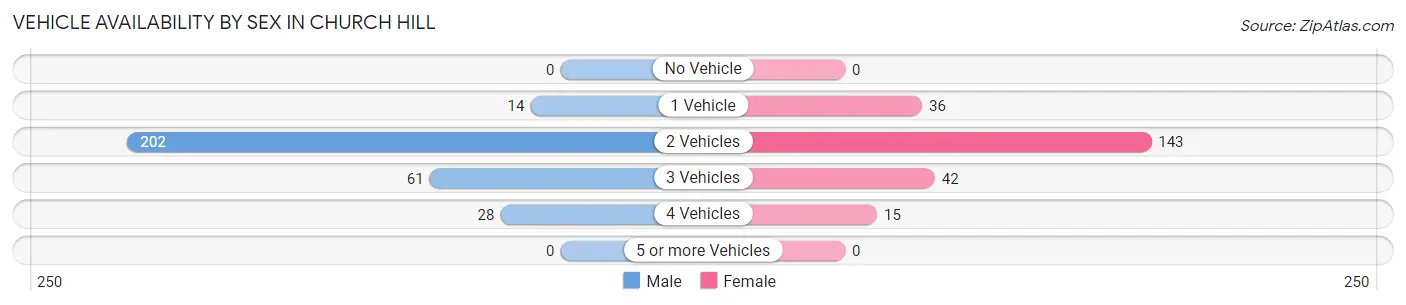
| Vehicles Available | Male | Female |
| No Vehicle | 0 (0.0%) | 0 (0.0%) |
| 1 Vehicle | 14 (4.6%) | 36 (15.2%) |
| 2 Vehicles | 202 (66.2%) | 143 (60.6%) |
| 3 Vehicles | 61 (20.0%) | 42 (17.8%) |
| 4 Vehicles | 28 (9.2%) | 15 (6.4%) |
| 5 or more Vehicles | 0 (0.0%) | 0 (0.0%) |
| Total | 305 (100.0%) | 236 (100.0%) |
Commute Time in Church Hill
The most frequently occuring commute durations in Church Hill are 15 to 19 minutes (126 commuters, 24.5%), 10 to 14 minutes (69 commuters, 13.4%), and 20 to 24 minutes (60 commuters, 11.7%).
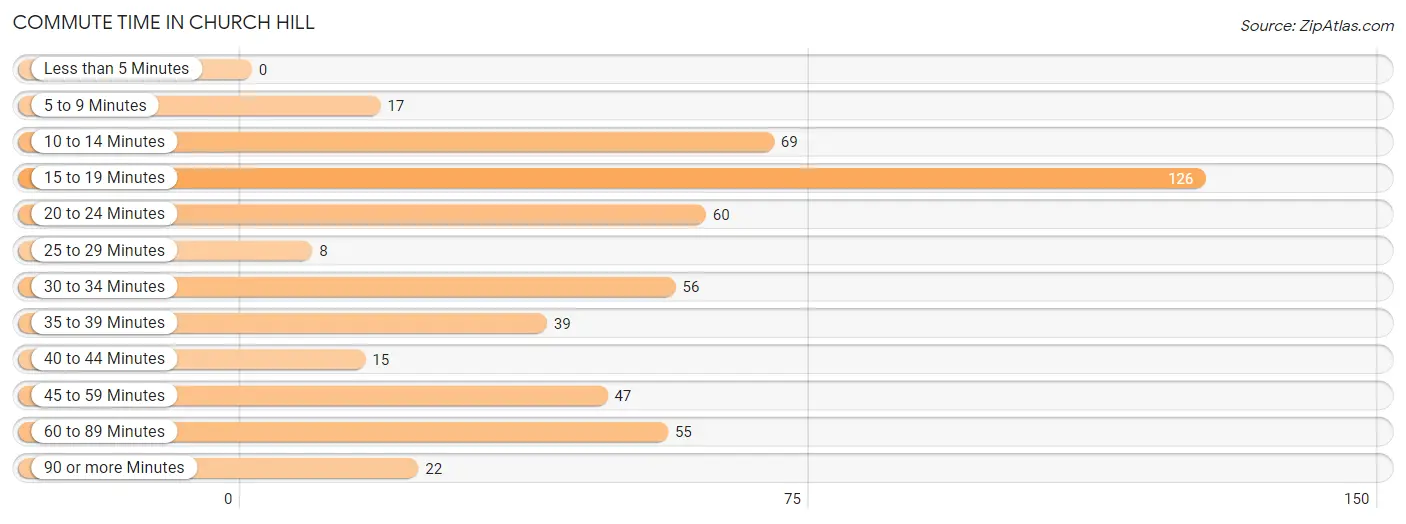
| Commute Time | # Commuters | % Commuters |
| Less than 5 Minutes | 0 | 0.0% |
| 5 to 9 Minutes | 17 | 3.3% |
| 10 to 14 Minutes | 69 | 13.4% |
| 15 to 19 Minutes | 126 | 24.5% |
| 20 to 24 Minutes | 60 | 11.7% |
| 25 to 29 Minutes | 8 | 1.6% |
| 30 to 34 Minutes | 56 | 10.9% |
| 35 to 39 Minutes | 39 | 7.6% |
| 40 to 44 Minutes | 15 | 2.9% |
| 45 to 59 Minutes | 47 | 9.1% |
| 60 to 89 Minutes | 55 | 10.7% |
| 90 or more Minutes | 22 | 4.3% |
Commute Time by Sex in Church Hill
The most common commute times in Church Hill are 15 to 19 minutes (76 commuters, 25.9%) for males and 15 to 19 minutes (50 commuters, 22.7%) for females.
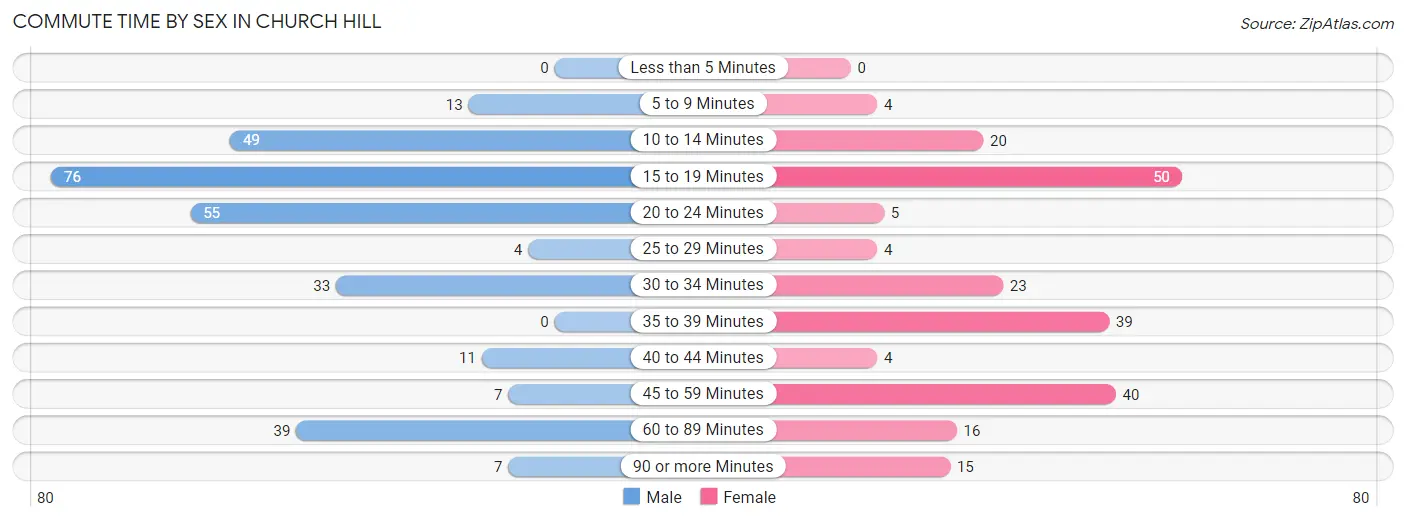
| Commute Time | Male | Female |
| Less than 5 Minutes | 0 (0.0%) | 0 (0.0%) |
| 5 to 9 Minutes | 13 (4.4%) | 4 (1.8%) |
| 10 to 14 Minutes | 49 (16.7%) | 20 (9.1%) |
| 15 to 19 Minutes | 76 (25.9%) | 50 (22.7%) |
| 20 to 24 Minutes | 55 (18.7%) | 5 (2.3%) |
| 25 to 29 Minutes | 4 (1.4%) | 4 (1.8%) |
| 30 to 34 Minutes | 33 (11.2%) | 23 (10.4%) |
| 35 to 39 Minutes | 0 (0.0%) | 39 (17.7%) |
| 40 to 44 Minutes | 11 (3.7%) | 4 (1.8%) |
| 45 to 59 Minutes | 7 (2.4%) | 40 (18.2%) |
| 60 to 89 Minutes | 39 (13.3%) | 16 (7.3%) |
| 90 or more Minutes | 7 (2.4%) | 15 (6.8%) |
Time of Departure to Work by Sex in Church Hill
The most frequent times of departure to work in Church Hill are 6:00 AM to 6:29 AM (104, 35.4%) for males and 7:00 AM to 7:29 AM (71, 32.3%) for females.
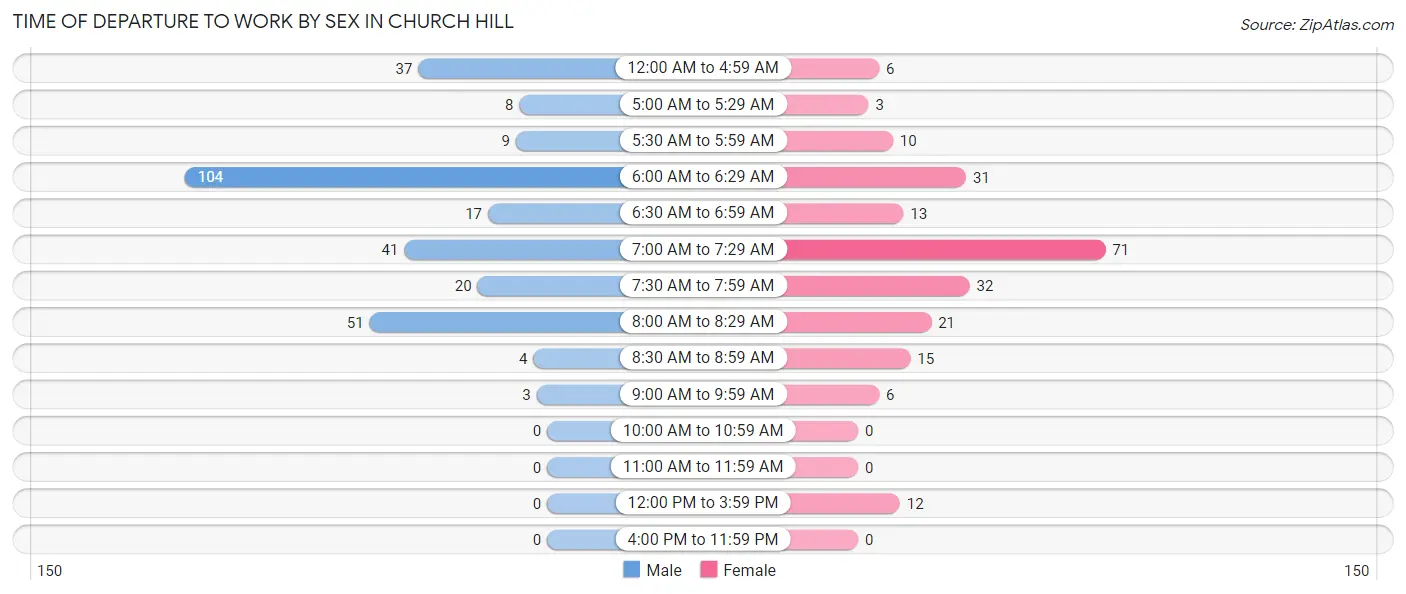
| Time of Departure | Male | Female |
| 12:00 AM to 4:59 AM | 37 (12.6%) | 6 (2.7%) |
| 5:00 AM to 5:29 AM | 8 (2.7%) | 3 (1.4%) |
| 5:30 AM to 5:59 AM | 9 (3.1%) | 10 (4.5%) |
| 6:00 AM to 6:29 AM | 104 (35.4%) | 31 (14.1%) |
| 6:30 AM to 6:59 AM | 17 (5.8%) | 13 (5.9%) |
| 7:00 AM to 7:29 AM | 41 (14.0%) | 71 (32.3%) |
| 7:30 AM to 7:59 AM | 20 (6.8%) | 32 (14.5%) |
| 8:00 AM to 8:29 AM | 51 (17.3%) | 21 (9.6%) |
| 8:30 AM to 8:59 AM | 4 (1.4%) | 15 (6.8%) |
| 9:00 AM to 9:59 AM | 3 (1.0%) | 6 (2.7%) |
| 10:00 AM to 10:59 AM | 0 (0.0%) | 0 (0.0%) |
| 11:00 AM to 11:59 AM | 0 (0.0%) | 0 (0.0%) |
| 12:00 PM to 3:59 PM | 0 (0.0%) | 12 (5.4%) |
| 4:00 PM to 11:59 PM | 0 (0.0%) | 0 (0.0%) |
| Total | 294 (100.0%) | 220 (100.0%) |
Housing Occupancy in Church Hill
Occupancy by Ownership in Church Hill
Of the total 443 dwellings in Church Hill, owner-occupied units account for 321 (72.5%), while renter-occupied units make up 122 (27.5%).
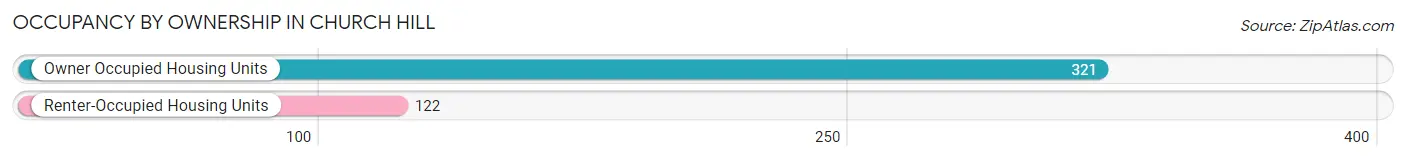
| Occupancy | # Housing Units | % Housing Units |
| Owner Occupied Housing Units | 321 | 72.5% |
| Renter-Occupied Housing Units | 122 | 27.5% |
| Total Occupied Housing Units | 443 | 100.0% |
Occupancy by Household Size in Church Hill
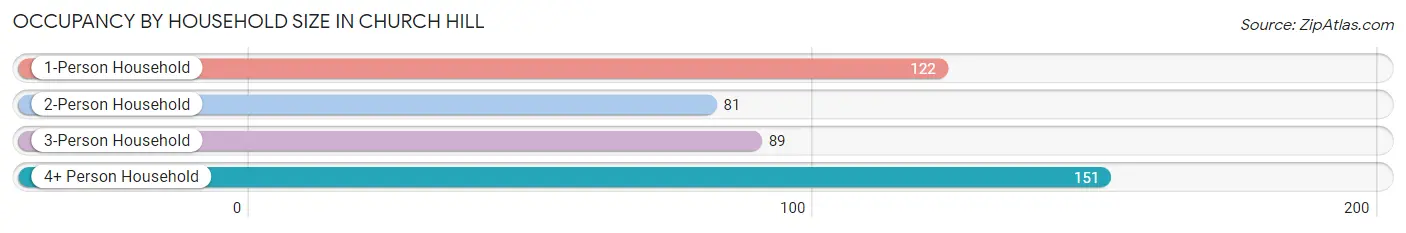
| Household Size | # Housing Units | % Housing Units |
| 1-Person Household | 122 | 27.5% |
| 2-Person Household | 81 | 18.3% |
| 3-Person Household | 89 | 20.1% |
| 4+ Person Household | 151 | 34.1% |
| Total Housing Units | 443 | 100.0% |
Occupancy by Ownership by Household Size in Church Hill
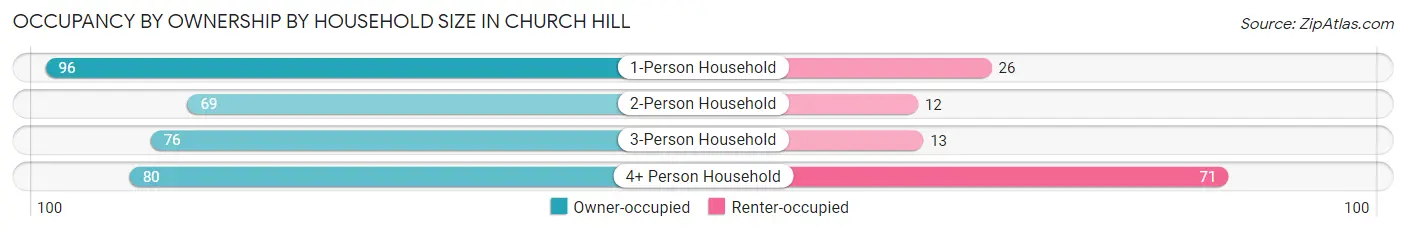
| Household Size | Owner-occupied | Renter-occupied |
| 1-Person Household | 96 (78.7%) | 26 (21.3%) |
| 2-Person Household | 69 (85.2%) | 12 (14.8%) |
| 3-Person Household | 76 (85.4%) | 13 (14.6%) |
| 4+ Person Household | 80 (53.0%) | 71 (47.0%) |
| Total Housing Units | 321 (72.5%) | 122 (27.5%) |
Occupancy by Educational Attainment in Church Hill
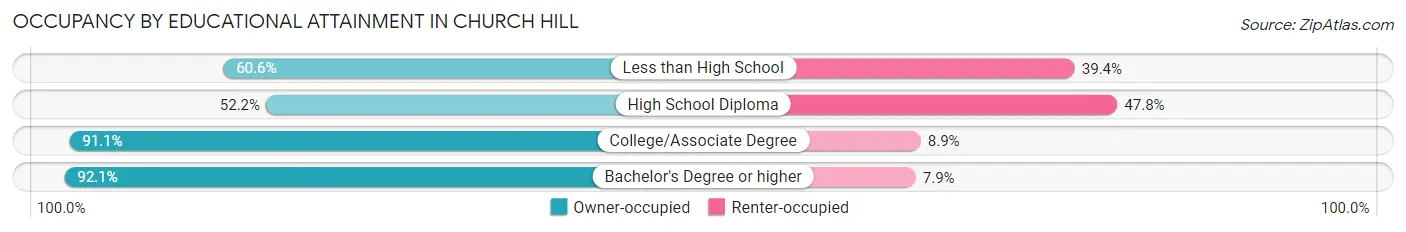
| Household Size | Owner-occupied | Renter-occupied |
| Less than High School | 60 (60.6%) | 39 (39.4%) |
| High School Diploma | 72 (52.2%) | 66 (47.8%) |
| College/Associate Degree | 72 (91.1%) | 7 (8.9%) |
| Bachelor's Degree or higher | 117 (92.1%) | 10 (7.9%) |
Occupancy by Age of Householder in Church Hill
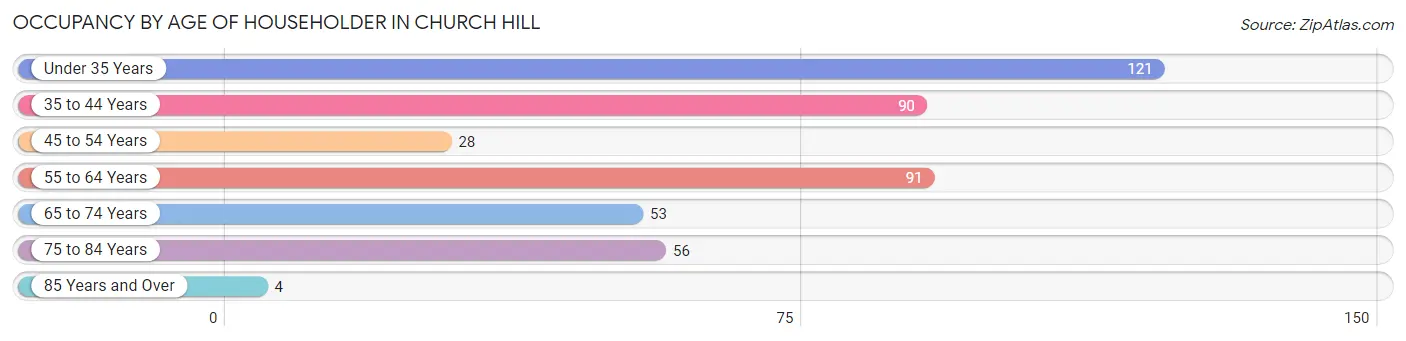
| Age Bracket | # Households | % Households |
| Under 35 Years | 121 | 27.3% |
| 35 to 44 Years | 90 | 20.3% |
| 45 to 54 Years | 28 | 6.3% |
| 55 to 64 Years | 91 | 20.5% |
| 65 to 74 Years | 53 | 12.0% |
| 75 to 84 Years | 56 | 12.6% |
| 85 Years and Over | 4 | 0.9% |
| Total | 443 | 100.0% |
Housing Finances in Church Hill
Median Income by Occupancy in Church Hill
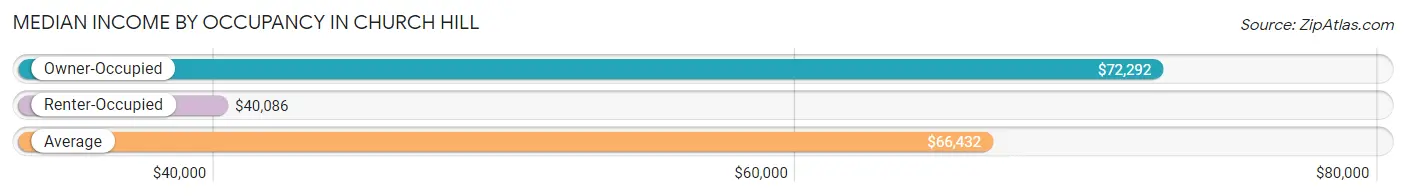
| Occupancy Type | # Households | Median Income |
| Owner-Occupied | 321 (72.5%) | $72,292 |
| Renter-Occupied | 122 (27.5%) | $40,086 |
| Average | 443 (100.0%) | $66,432 |
Occupancy by Householder Income Bracket in Church Hill
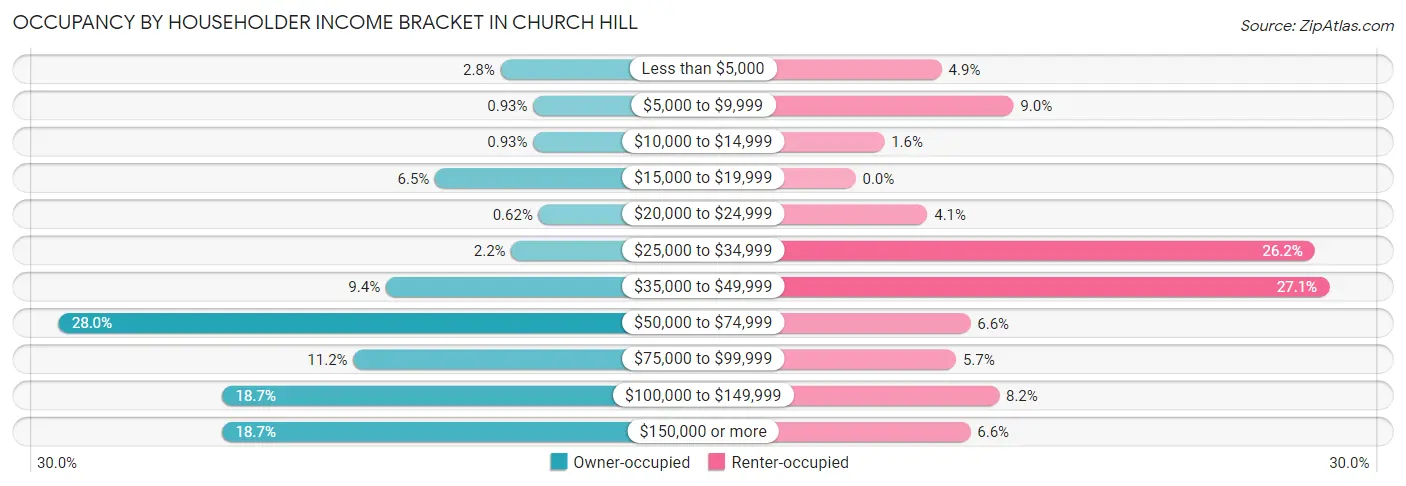
| Income Bracket | Owner-occupied | Renter-occupied |
| Less than $5,000 | 9 (2.8%) | 6 (4.9%) |
| $5,000 to $9,999 | 3 (0.9%) | 11 (9.0%) |
| $10,000 to $14,999 | 3 (0.9%) | 2 (1.6%) |
| $15,000 to $19,999 | 21 (6.5%) | 0 (0.0%) |
| $20,000 to $24,999 | 2 (0.6%) | 5 (4.1%) |
| $25,000 to $34,999 | 7 (2.2%) | 32 (26.2%) |
| $35,000 to $49,999 | 30 (9.3%) | 33 (27.1%) |
| $50,000 to $74,999 | 90 (28.0%) | 8 (6.6%) |
| $75,000 to $99,999 | 36 (11.2%) | 7 (5.7%) |
| $100,000 to $149,999 | 60 (18.7%) | 10 (8.2%) |
| $150,000 or more | 60 (18.7%) | 8 (6.6%) |
| Total | 321 (100.0%) | 122 (100.0%) |
Monthly Housing Cost Tiers in Church Hill
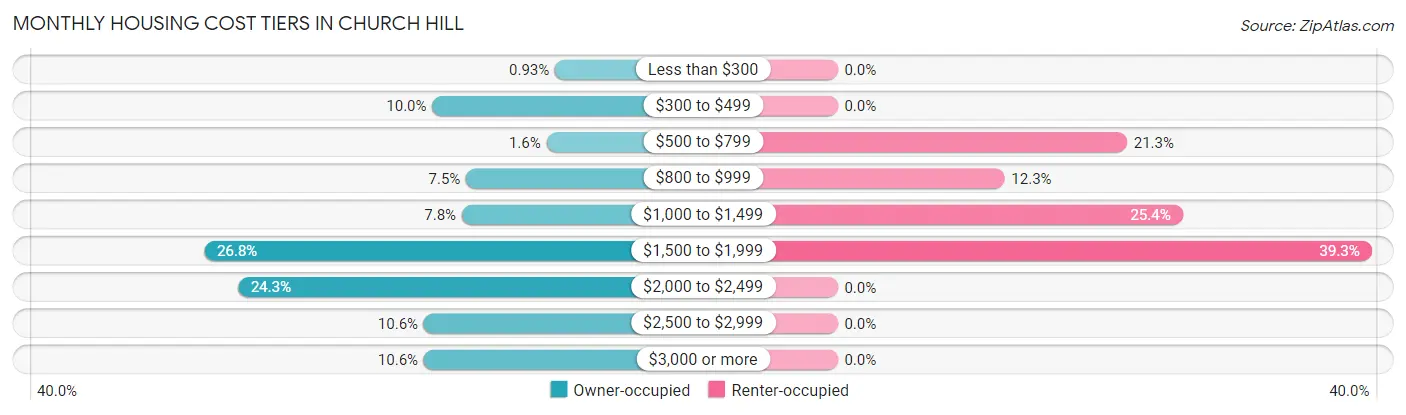
| Monthly Cost | Owner-occupied | Renter-occupied |
| Less than $300 | 3 (0.9%) | 0 (0.0%) |
| $300 to $499 | 32 (10.0%) | 0 (0.0%) |
| $500 to $799 | 5 (1.6%) | 26 (21.3%) |
| $800 to $999 | 24 (7.5%) | 15 (12.3%) |
| $1,000 to $1,499 | 25 (7.8%) | 31 (25.4%) |
| $1,500 to $1,999 | 86 (26.8%) | 48 (39.3%) |
| $2,000 to $2,499 | 78 (24.3%) | 0 (0.0%) |
| $2,500 to $2,999 | 34 (10.6%) | 0 (0.0%) |
| $3,000 or more | 34 (10.6%) | 0 (0.0%) |
| Total | 321 (100.0%) | 122 (100.0%) |
Physical Housing Characteristics in Church Hill
Housing Structures in Church Hill
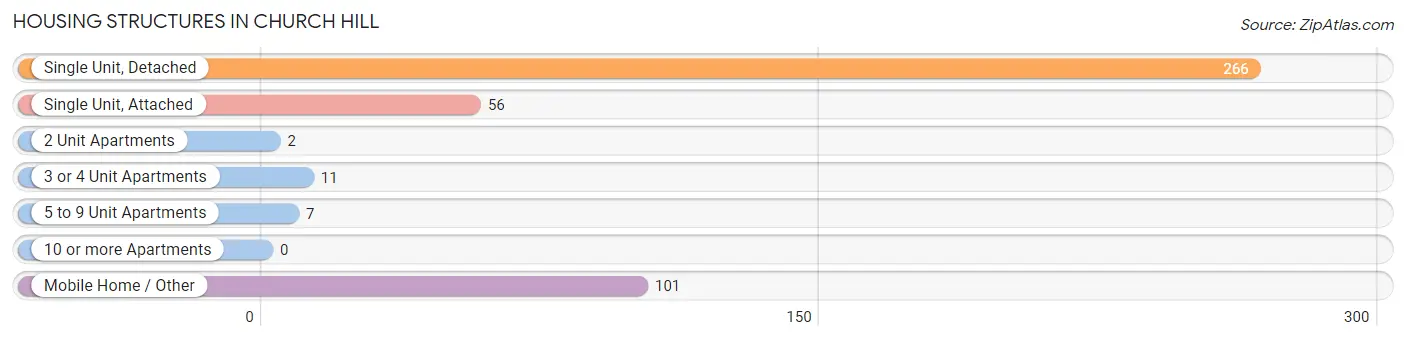
| Structure Type | # Housing Units | % Housing Units |
| Single Unit, Detached | 266 | 60.1% |
| Single Unit, Attached | 56 | 12.6% |
| 2 Unit Apartments | 2 | 0.4% |
| 3 or 4 Unit Apartments | 11 | 2.5% |
| 5 to 9 Unit Apartments | 7 | 1.6% |
| 10 or more Apartments | 0 | 0.0% |
| Mobile Home / Other | 101 | 22.8% |
| Total | 443 | 100.0% |
Housing Structures by Occupancy in Church Hill
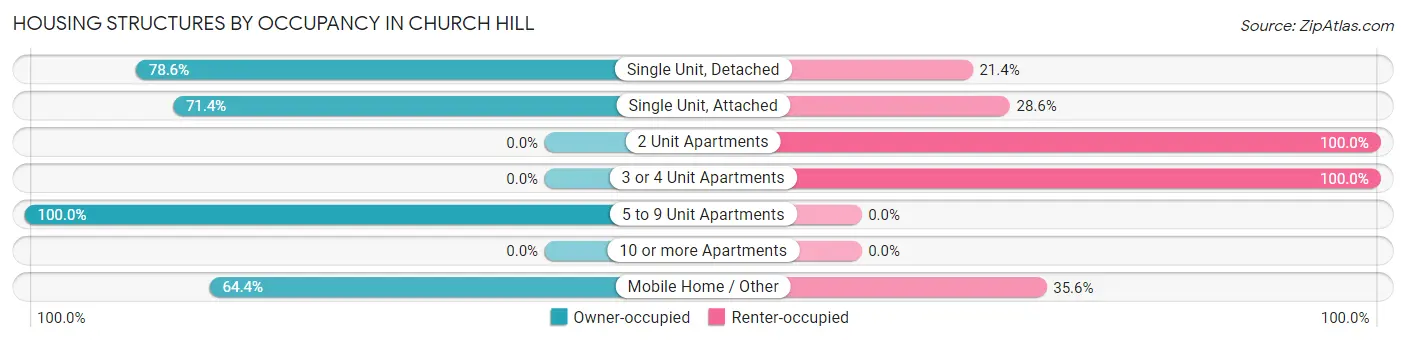
| Structure Type | Owner-occupied | Renter-occupied |
| Single Unit, Detached | 209 (78.6%) | 57 (21.4%) |
| Single Unit, Attached | 40 (71.4%) | 16 (28.6%) |
| 2 Unit Apartments | 0 (0.0%) | 2 (100.0%) |
| 3 or 4 Unit Apartments | 0 (0.0%) | 11 (100.0%) |
| 5 to 9 Unit Apartments | 7 (100.0%) | 0 (0.0%) |
| 10 or more Apartments | 0 (0.0%) | 0 (0.0%) |
| Mobile Home / Other | 65 (64.4%) | 36 (35.6%) |
| Total | 321 (72.5%) | 122 (27.5%) |
Housing Structures by Number of Rooms in Church Hill
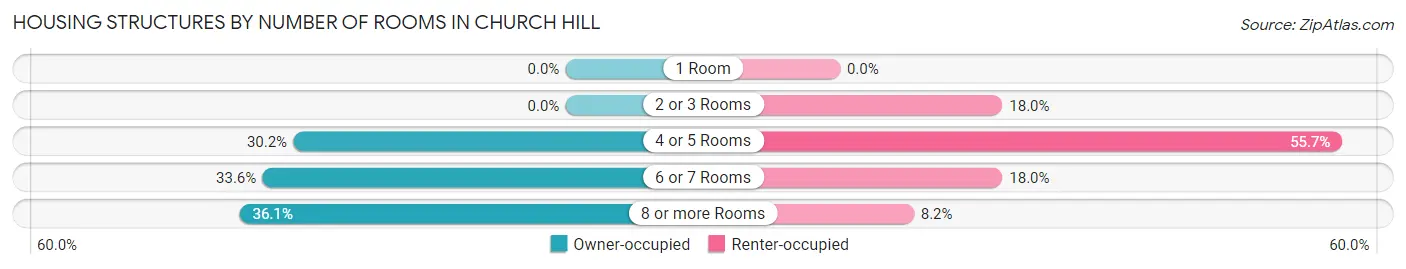
| Number of Rooms | Owner-occupied | Renter-occupied |
| 1 Room | 0 (0.0%) | 0 (0.0%) |
| 2 or 3 Rooms | 0 (0.0%) | 22 (18.0%) |
| 4 or 5 Rooms | 97 (30.2%) | 68 (55.7%) |
| 6 or 7 Rooms | 108 (33.6%) | 22 (18.0%) |
| 8 or more Rooms | 116 (36.1%) | 10 (8.2%) |
| Total | 321 (100.0%) | 122 (100.0%) |
Housing Structure by Heating Type in Church Hill
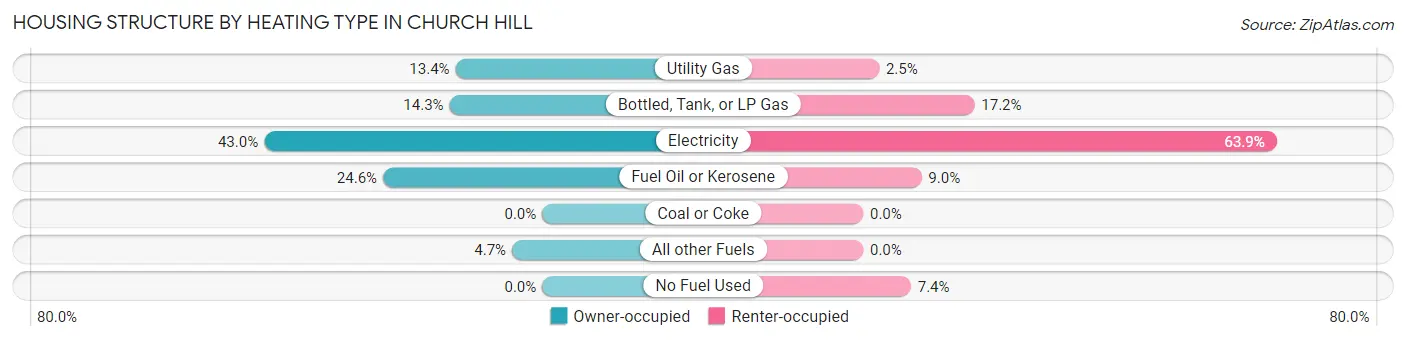
| Heating Type | Owner-occupied | Renter-occupied |
| Utility Gas | 43 (13.4%) | 3 (2.5%) |
| Bottled, Tank, or LP Gas | 46 (14.3%) | 21 (17.2%) |
| Electricity | 138 (43.0%) | 78 (63.9%) |
| Fuel Oil or Kerosene | 79 (24.6%) | 11 (9.0%) |
| Coal or Coke | 0 (0.0%) | 0 (0.0%) |
| All other Fuels | 15 (4.7%) | 0 (0.0%) |
| No Fuel Used | 0 (0.0%) | 9 (7.4%) |
| Total | 321 (100.0%) | 122 (100.0%) |
Household Vehicle Usage in Church Hill
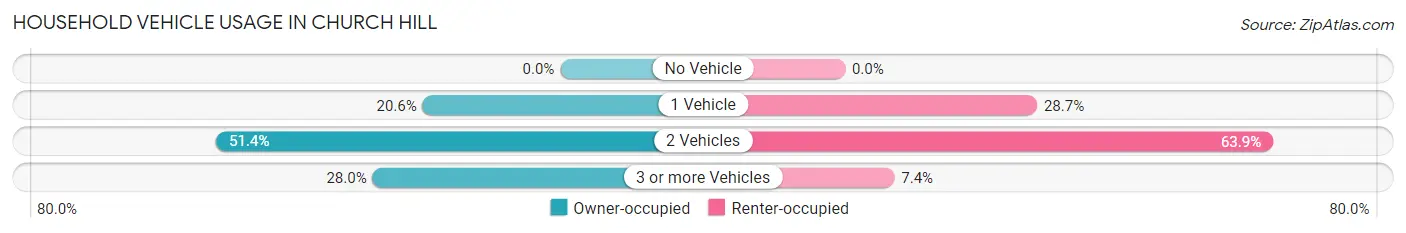
| Vehicles per Household | Owner-occupied | Renter-occupied |
| No Vehicle | 0 (0.0%) | 0 (0.0%) |
| 1 Vehicle | 66 (20.6%) | 35 (28.7%) |
| 2 Vehicles | 165 (51.4%) | 78 (63.9%) |
| 3 or more Vehicles | 90 (28.0%) | 9 (7.4%) |
| Total | 321 (100.0%) | 122 (100.0%) |
Real Estate & Mortgages in Church Hill
Real Estate and Mortgage Overview in Church Hill
| Characteristic | Without Mortgage | With Mortgage |
| Housing Units | 43 | 278 |
| Median Property Value | $253,400 | $246,600 |
| Median Household Income | $35,813 | $60 |
| Monthly Housing Costs | $453 | $34 |
| Real Estate Taxes | $1,870 | $5 |
Property Value by Mortgage Status in Church Hill
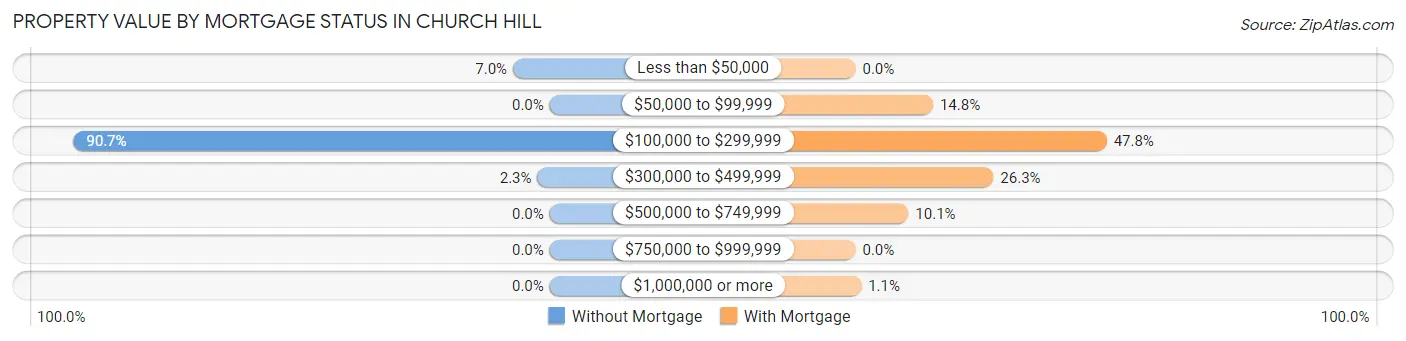
| Property Value | Without Mortgage | With Mortgage |
| Less than $50,000 | 3 (7.0%) | 0 (0.0%) |
| $50,000 to $99,999 | 0 (0.0%) | 41 (14.7%) |
| $100,000 to $299,999 | 39 (90.7%) | 133 (47.8%) |
| $300,000 to $499,999 | 1 (2.3%) | 73 (26.3%) |
| $500,000 to $749,999 | 0 (0.0%) | 28 (10.1%) |
| $750,000 to $999,999 | 0 (0.0%) | 0 (0.0%) |
| $1,000,000 or more | 0 (0.0%) | 3 (1.1%) |
| Total | 43 (100.0%) | 278 (100.0%) |
Household Income by Mortgage Status in Church Hill
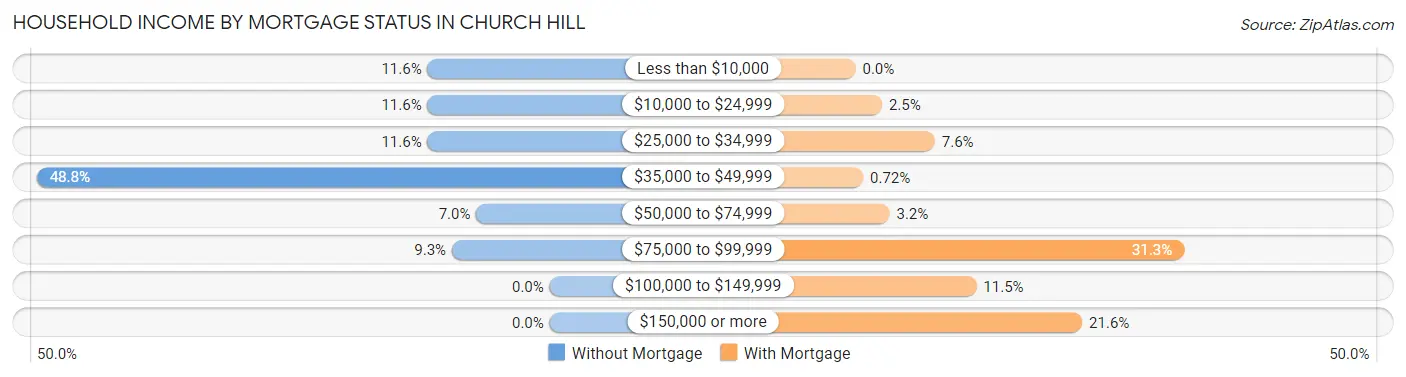
| Household Income | Without Mortgage | With Mortgage |
| Less than $10,000 | 5 (11.6%) | 0 (0.0%) |
| $10,000 to $24,999 | 5 (11.6%) | 7 (2.5%) |
| $25,000 to $34,999 | 5 (11.6%) | 21 (7.5%) |
| $35,000 to $49,999 | 21 (48.8%) | 2 (0.7%) |
| $50,000 to $74,999 | 3 (7.0%) | 9 (3.2%) |
| $75,000 to $99,999 | 4 (9.3%) | 87 (31.3%) |
| $100,000 to $149,999 | 0 (0.0%) | 32 (11.5%) |
| $150,000 or more | 0 (0.0%) | 60 (21.6%) |
| Total | 43 (100.0%) | 278 (100.0%) |
Property Value to Household Income Ratio in Church Hill
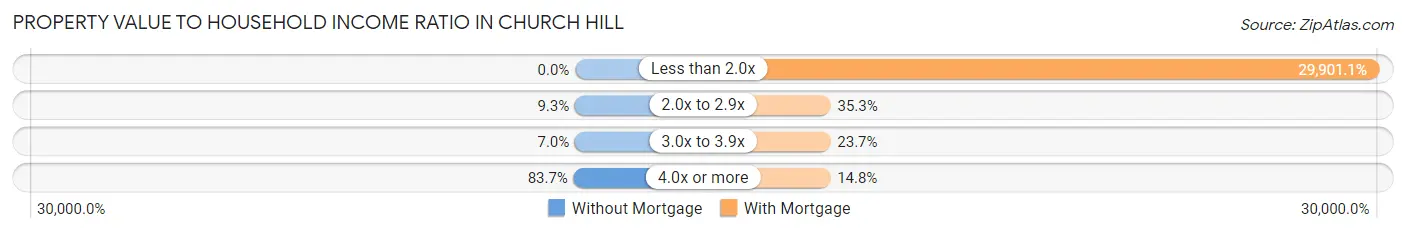
| Value-to-Income Ratio | Without Mortgage | With Mortgage |
| Less than 2.0x | 0 (0.0%) | 83,125 (29,901.1%) |
| 2.0x to 2.9x | 4 (9.3%) | 98 (35.2%) |
| 3.0x to 3.9x | 3 (7.0%) | 66 (23.7%) |
| 4.0x or more | 36 (83.7%) | 41 (14.7%) |
| Total | 43 (100.0%) | 278 (100.0%) |
Real Estate Taxes by Mortgage Status in Church Hill
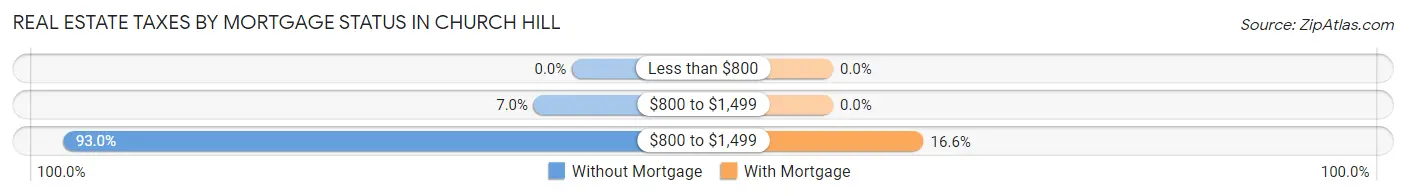
| Property Taxes | Without Mortgage | With Mortgage |
| Less than $800 | 0 (0.0%) | 0 (0.0%) |
| $800 to $1,499 | 3 (7.0%) | 0 (0.0%) |
| $800 to $1,499 | 40 (93.0%) | 46 (16.6%) |
| Total | 43 (100.0%) | 278 (100.0%) |
Health & Disability in Church Hill
Health Insurance Coverage by Age in Church Hill
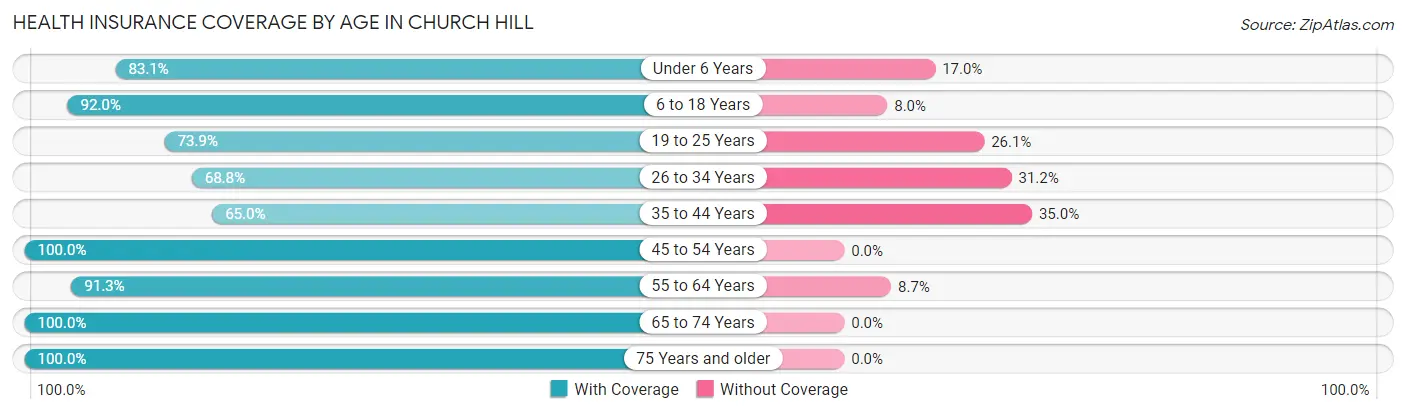
| Age Bracket | With Coverage | Without Coverage |
| Under 6 Years | 98 (83.1%) | 20 (17.0%) |
| 6 to 18 Years | 172 (92.0%) | 15 (8.0%) |
| 19 to 25 Years | 51 (73.9%) | 18 (26.1%) |
| 26 to 34 Years | 150 (68.8%) | 68 (31.2%) |
| 35 to 44 Years | 104 (65.0%) | 56 (35.0%) |
| 45 to 54 Years | 59 (100.0%) | 0 (0.0%) |
| 55 to 64 Years | 115 (91.3%) | 11 (8.7%) |
| 65 to 74 Years | 78 (100.0%) | 0 (0.0%) |
| 75 Years and older | 69 (100.0%) | 0 (0.0%) |
| Total | 896 (82.7%) | 188 (17.3%) |
Health Insurance Coverage by Citizenship Status in Church Hill
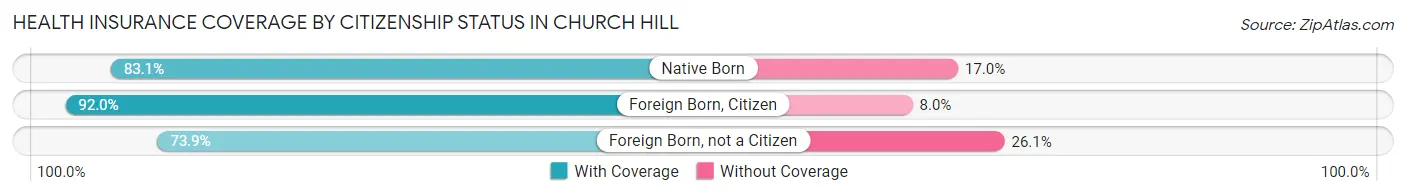
| Citizenship Status | With Coverage | Without Coverage |
| Native Born | 98 (83.1%) | 20 (17.0%) |
| Foreign Born, Citizen | 172 (92.0%) | 15 (8.0%) |
| Foreign Born, not a Citizen | 51 (73.9%) | 18 (26.1%) |
Health Insurance Coverage by Household Income in Church Hill
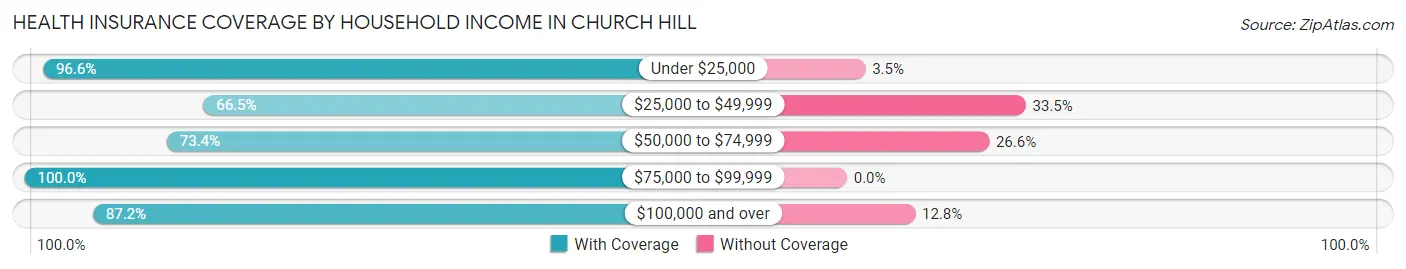
| Household Income | With Coverage | Without Coverage |
| Under $25,000 | 84 (96.6%) | 3 (3.5%) |
| $25,000 to $49,999 | 137 (66.5%) | 69 (33.5%) |
| $50,000 to $74,999 | 168 (73.4%) | 61 (26.6%) |
| $75,000 to $99,999 | 124 (100.0%) | 0 (0.0%) |
| $100,000 and over | 375 (87.2%) | 55 (12.8%) |
Public vs Private Health Insurance Coverage by Age in Church Hill
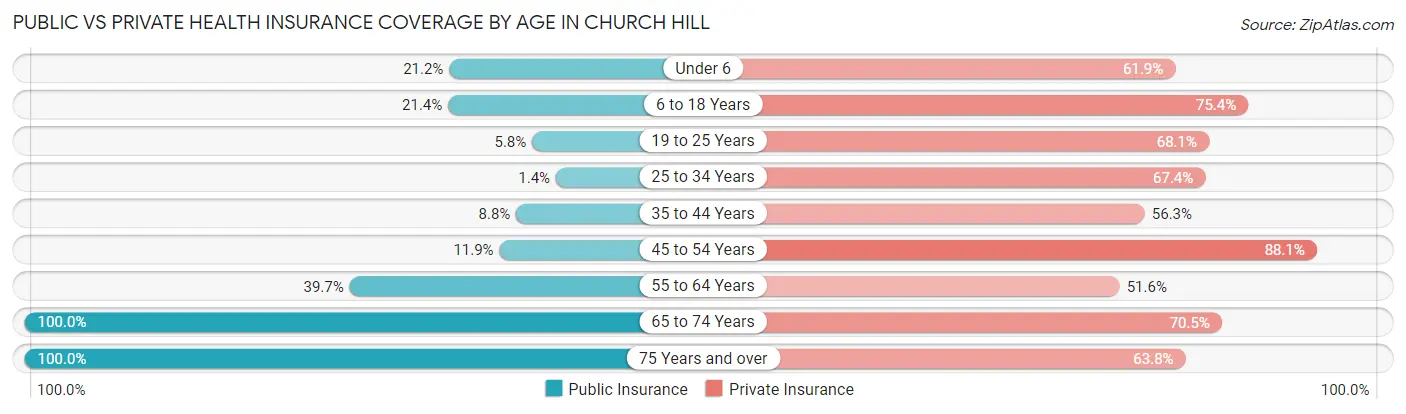
| Age Bracket | Public Insurance | Private Insurance |
| Under 6 | 25 (21.2%) | 73 (61.9%) |
| 6 to 18 Years | 40 (21.4%) | 141 (75.4%) |
| 19 to 25 Years | 4 (5.8%) | 47 (68.1%) |
| 25 to 34 Years | 3 (1.4%) | 147 (67.4%) |
| 35 to 44 Years | 14 (8.7%) | 90 (56.2%) |
| 45 to 54 Years | 7 (11.9%) | 52 (88.1%) |
| 55 to 64 Years | 50 (39.7%) | 65 (51.6%) |
| 65 to 74 Years | 78 (100.0%) | 55 (70.5%) |
| 75 Years and over | 69 (100.0%) | 44 (63.8%) |
| Total | 290 (26.8%) | 714 (65.9%) |
Disability Status by Sex by Age in Church Hill
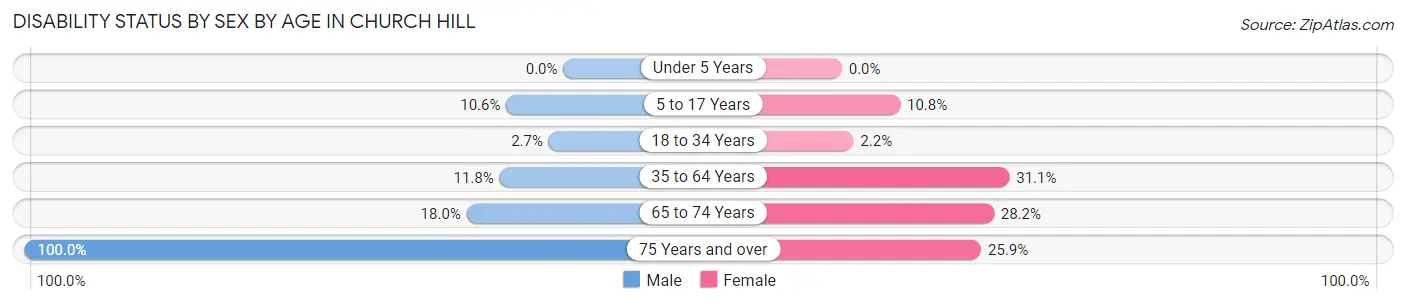
| Age Bracket | Male | Female |
| Under 5 Years | 0 (0.0%) | 0 (0.0%) |
| 5 to 17 Years | 9 (10.6%) | 12 (10.8%) |
| 18 to 34 Years | 4 (2.7%) | 3 (2.2%) |
| 35 to 64 Years | 18 (11.8%) | 60 (31.1%) |
| 65 to 74 Years | 7 (17.9%) | 11 (28.2%) |
| 75 Years and over | 11 (100.0%) | 15 (25.9%) |
Disability Class by Sex by Age in Church Hill
Disability Class: Hearing Difficulty
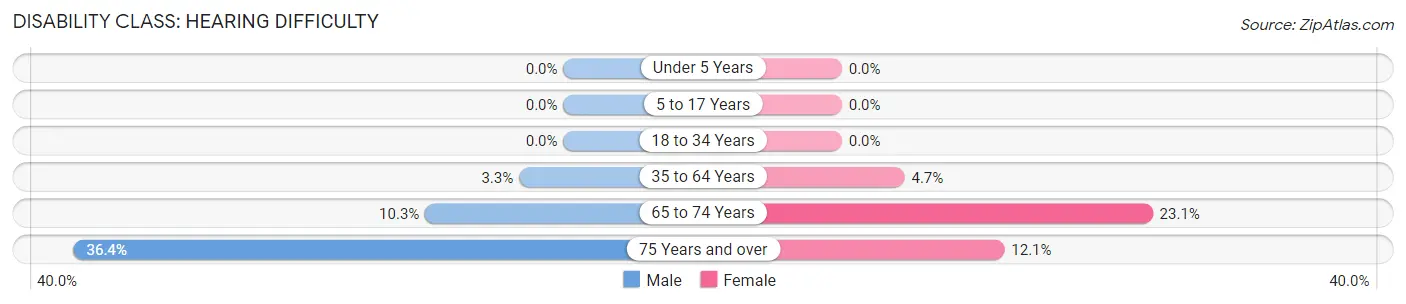
| Age Bracket | Male | Female |
| Under 5 Years | 0 (0.0%) | 0 (0.0%) |
| 5 to 17 Years | 0 (0.0%) | 0 (0.0%) |
| 18 to 34 Years | 0 (0.0%) | 0 (0.0%) |
| 35 to 64 Years | 5 (3.3%) | 9 (4.7%) |
| 65 to 74 Years | 4 (10.3%) | 9 (23.1%) |
| 75 Years and over | 4 (36.4%) | 7 (12.1%) |
Disability Class: Vision Difficulty
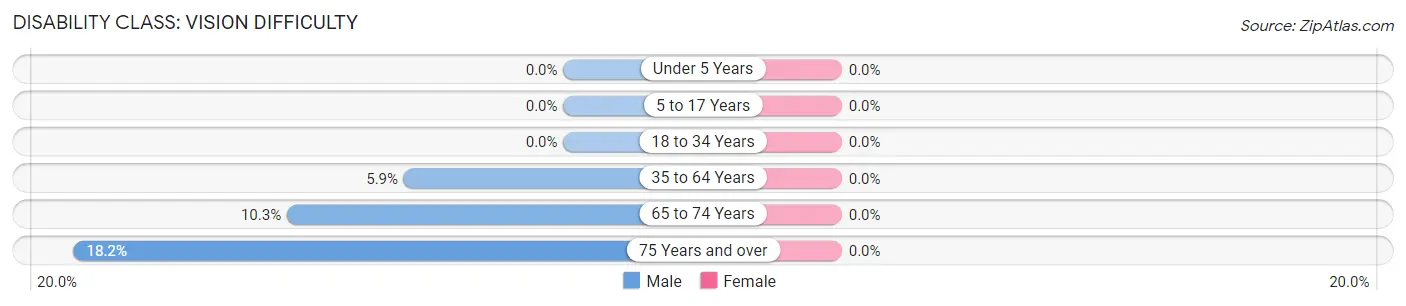
| Age Bracket | Male | Female |
| Under 5 Years | 0 (0.0%) | 0 (0.0%) |
| 5 to 17 Years | 0 (0.0%) | 0 (0.0%) |
| 18 to 34 Years | 0 (0.0%) | 0 (0.0%) |
| 35 to 64 Years | 9 (5.9%) | 0 (0.0%) |
| 65 to 74 Years | 4 (10.3%) | 0 (0.0%) |
| 75 Years and over | 2 (18.2%) | 0 (0.0%) |
Disability Class: Cognitive Difficulty
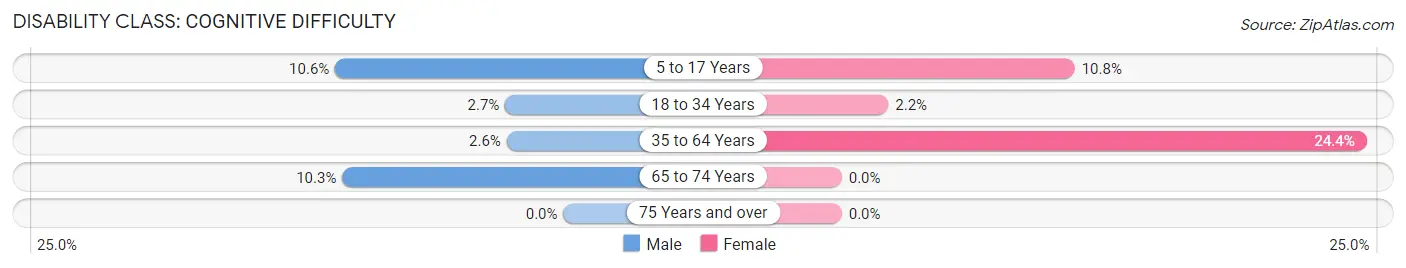
| Age Bracket | Male | Female |
| 5 to 17 Years | 9 (10.6%) | 12 (10.8%) |
| 18 to 34 Years | 4 (2.7%) | 3 (2.2%) |
| 35 to 64 Years | 4 (2.6%) | 47 (24.3%) |
| 65 to 74 Years | 4 (10.3%) | 0 (0.0%) |
| 75 Years and over | 0 (0.0%) | 0 (0.0%) |
Disability Class: Ambulatory Difficulty
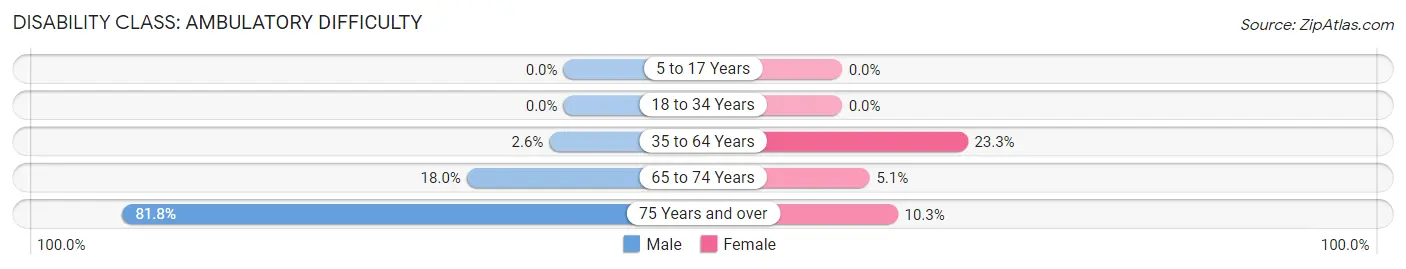
| Age Bracket | Male | Female |
| 5 to 17 Years | 0 (0.0%) | 0 (0.0%) |
| 18 to 34 Years | 0 (0.0%) | 0 (0.0%) |
| 35 to 64 Years | 4 (2.6%) | 45 (23.3%) |
| 65 to 74 Years | 7 (17.9%) | 2 (5.1%) |
| 75 Years and over | 9 (81.8%) | 6 (10.3%) |
Disability Class: Self-Care Difficulty
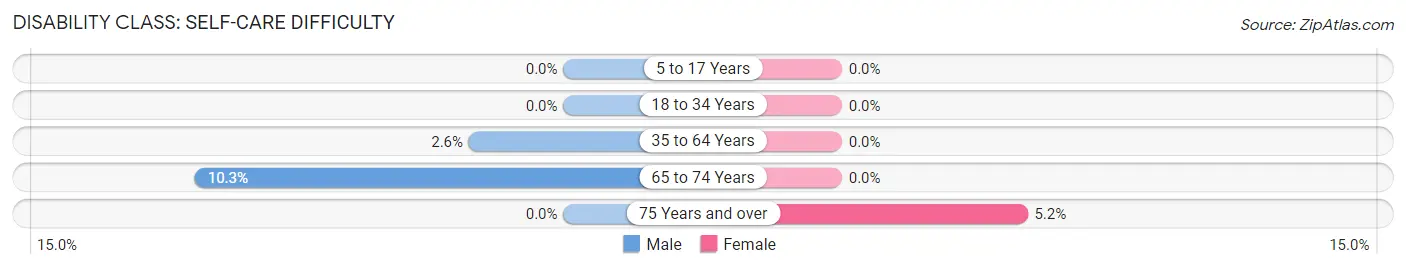
| Age Bracket | Male | Female |
| 5 to 17 Years | 0 (0.0%) | 0 (0.0%) |
| 18 to 34 Years | 0 (0.0%) | 0 (0.0%) |
| 35 to 64 Years | 4 (2.6%) | 0 (0.0%) |
| 65 to 74 Years | 4 (10.3%) | 0 (0.0%) |
| 75 Years and over | 0 (0.0%) | 3 (5.2%) |
Technology Access in Church Hill
Computing Device Access in Church Hill
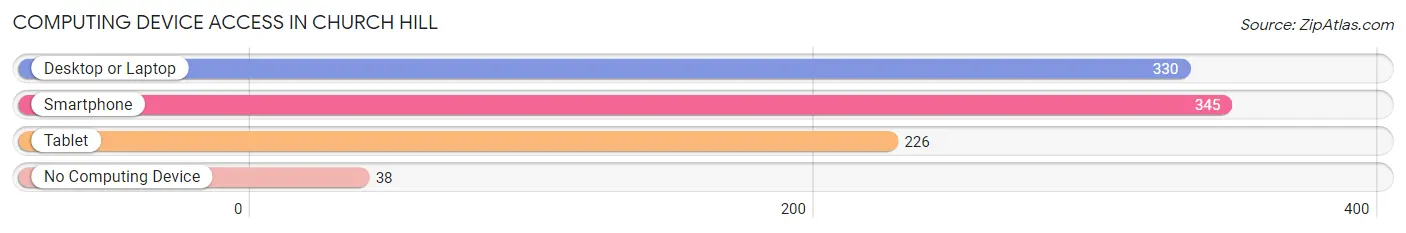
| Device Type | # Households | % Households |
| Desktop or Laptop | 330 | 74.5% |
| Smartphone | 345 | 77.9% |
| Tablet | 226 | 51.0% |
| No Computing Device | 38 | 8.6% |
| Total | 443 | 100.0% |
Internet Access in Church Hill
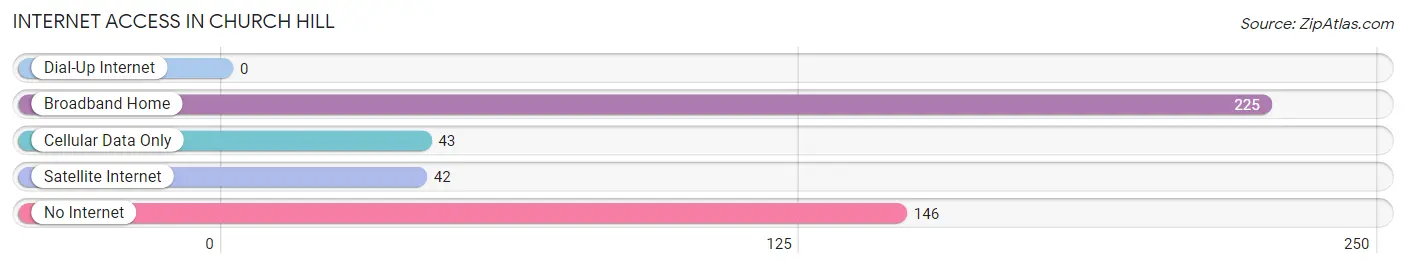
| Internet Type | # Households | % Households |
| Dial-Up Internet | 0 | 0.0% |
| Broadband Home | 225 | 50.8% |
| Cellular Data Only | 43 | 9.7% |
| Satellite Internet | 42 | 9.5% |
| No Internet | 146 | 33.0% |
| Total | 443 | 100.0% |
Church Hill Summary
History
Church Hill is a small town located in Queen Anne’s County, Maryland. It is situated on the Eastern Shore of the Chesapeake Bay, approximately 25 miles south of Annapolis. The town was founded in 1706 and was originally known as “The Church Hill” due to its proximity to a local church. The town was incorporated in 1867 and has since grown to a population of approximately 1,500 people.
The town has a rich history that dates back to the colonial era. During the Revolutionary War, Church Hill was a major supply center for the Continental Army. The town was also the site of a major battle between the British and American forces in 1777.
In the 19th century, Church Hill was a major center for the oyster industry. The town was also home to several shipbuilding companies, which produced vessels for the Chesapeake Bay oyster trade.
Geography
Church Hill is located in Queen Anne’s County, Maryland. It is situated on the Eastern Shore of the Chesapeake Bay, approximately 25 miles south of Annapolis. The town is bordered by the towns of Centreville, Stevensville, and Grasonville.
The town is located on a peninsula, with the Chesapeake Bay to the east and the Chester River to the west. The town is surrounded by several small islands, including Kent Island, Tilghman Island, and Smith Island.
The town has a total area of 1.2 square miles, all of which is land. The town has a humid subtropical climate, with hot, humid summers and mild winters.
Economy
The economy of Church Hill is largely based on tourism and agriculture. The town is home to several small businesses, including restaurants, shops, and marinas. The town is also home to several oyster farms, which produce oysters for the local market.
The town is also home to several wineries, which produce wines from local grapes. The town is also home to several bed and breakfasts, which cater to tourists visiting the area.
Demographics
As of the 2010 census, the population of Church Hill was 1,500. The racial makeup of the town was 94.7% White, 2.7% African American, 0.3% Native American, 0.7% Asian, and 1.6% from other races. Hispanic or Latino of any race were 2.7% of the population.
The median income for a household in the town was $50,000, and the median income for a family was $60,000. The per capita income for the town was $25,000. About 8.3% of families and 10.7% of the population were below the poverty line, including 14.3% of those under age 18 and 6.7% of those age 65 or over.
Common Questions
What is Per Capita Income in Church Hill?
Per Capita income in Church Hill is $33,428.
What is the Median Family Income in Church Hill?
Median Family Income in Church Hill is $71,667.
What is the Median Household income in Church Hill?
Median Household Income in Church Hill is $66,432.
What is Income or Wage Gap in Church Hill?
Income or Wage Gap in Church Hill is 17.1%.
Women in Church Hill earn 82.9 cents for every dollar earned by a man.
What is Inequality or Gini Index in Church Hill?
Inequality or Gini Index in Church Hill is 0.43.
What is the Total Population of Church Hill?
Total Population of Church Hill is 1,084.
What is the Total Male Population of Church Hill?
Total Male Population of Church Hill is 497.
What is the Total Female Population of Church Hill?
Total Female Population of Church Hill is 587.
What is the Ratio of Males per 100 Females in Church Hill?
There are 84.67 Males per 100 Females in Church Hill.
What is the Ratio of Females per 100 Males in Church Hill?
There are 118.11 Females per 100 Males in Church Hill.
What is the Median Population Age in Church Hill?
Median Population Age in Church Hill is 32.6 Years.
What is the Average Family Size in Church Hill
Average Family Size in Church Hill is 2.9 People.
What is the Average Household Size in Church Hill
Average Household Size in Church Hill is 2.4 People.
How Large is the Labor Force in Church Hill?
There are 543 People in the Labor Forcein in Church Hill.
What is the Percentage of People in the Labor Force in Church Hill?
65.9% of People are in the Labor Force in Church Hill.
What is the Unemployment Rate in Church Hill?
Unemployment Rate in Church Hill is 0.4%.