Centreville, MD Map & Demographics
Centreville Map
Centreville Overview
$43,741
PER CAPITA INCOME
$135,448
AVG FAMILY INCOME
$101,455
AVG HOUSEHOLD INCOME
43.1%
WAGE / INCOME GAP [ % ]
56.9¢/ $1
WAGE / INCOME GAP [ $ ]
0.36
INEQUALITY / GINI INDEX
4,700
TOTAL POPULATION
2,075
MALE POPULATION
2,625
FEMALE POPULATION
79.05
MALES / 100 FEMALES
126.51
FEMALES / 100 MALES
40.4
MEDIAN AGE
3.1
AVG FAMILY SIZE
2.6
AVG HOUSEHOLD SIZE
2,318
LABOR FORCE [ PEOPLE ]
64.4%
PERCENT IN LABOR FORCE
2.3%
UNEMPLOYMENT RATE
Centreville Zip Codes
Income in Centreville
Income Overview in Centreville
Per Capita Income in Centreville is $43,741, while median incomes of families and households are $135,448 and $101,455 respectively.
| Characteristic | Number | Measure |
| Per Capita Income | 4,700 | $43,741 |
| Median Family Income | 1,279 | $135,448 |
| Mean Family Income | 1,279 | $133,337 |
| Median Household Income | 1,748 | $101,455 |
| Mean Household Income | 1,748 | $115,698 |
| Income Deficit | 1,279 | $0 |
| Wage / Income Gap (%) | 4,700 | 43.14% |
| Wage / Income Gap ($) | 4,700 | 56.86¢ per $1 |
| Gini / Inequality Index | 4,700 | 0.36 |
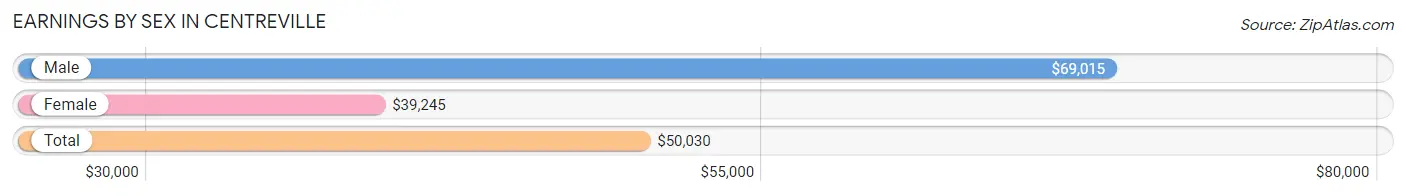
Earnings by Sex in Centreville
Average Earnings in Centreville are $50,030, $69,015 for men and $39,245 for women, a difference of 43.1%.
| Sex | Number | Average Earnings |
| Male | 1,174 (48.2%) | $69,015 |
| Female | 1,259 (51.7%) | $39,245 |
| Total | 2,433 (100.0%) | $50,030 |
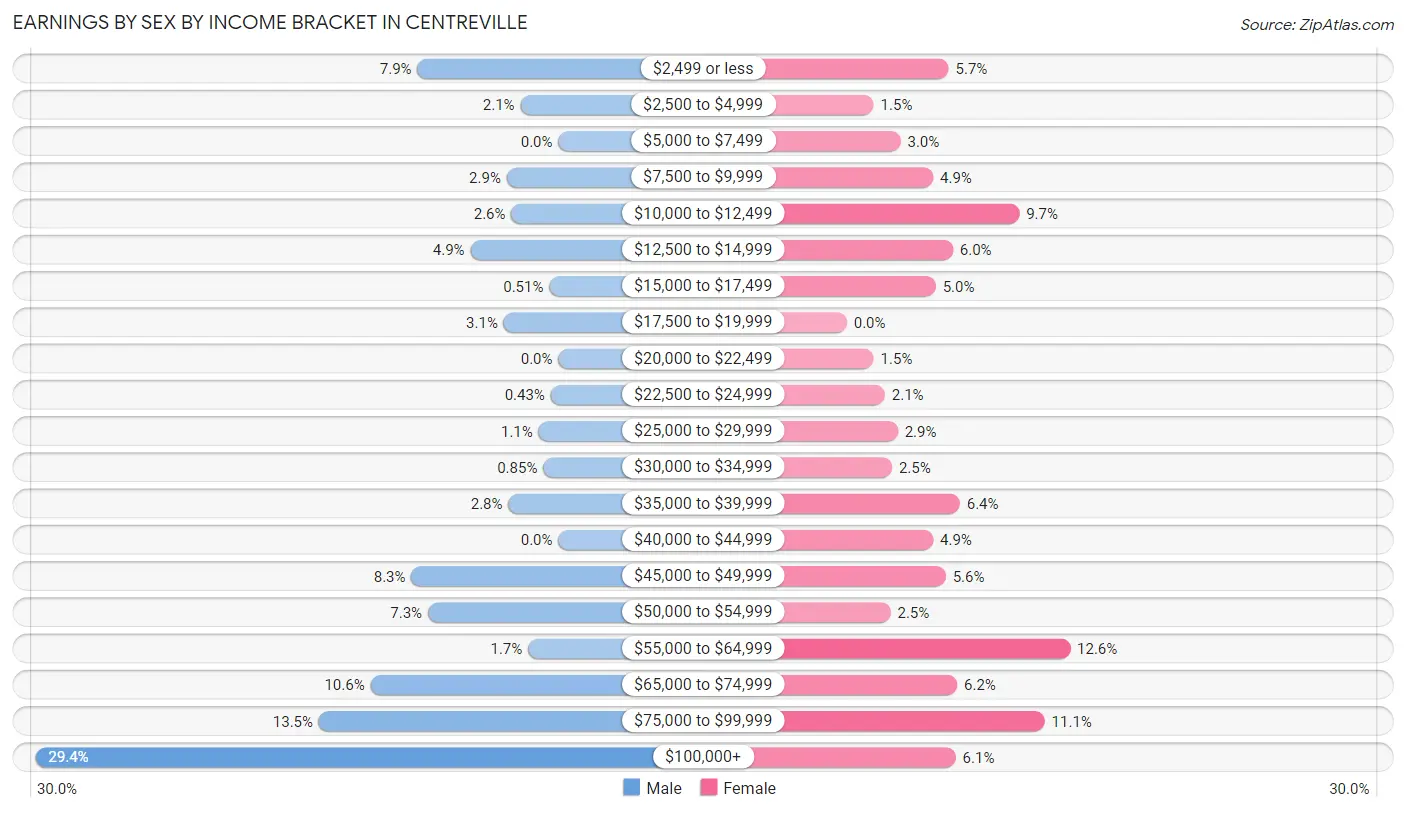
Earnings by Sex by Income Bracket in Centreville
The most common earnings brackets in Centreville are $100,000+ for men (345 | 29.4%) and $55,000 to $64,999 for women (158 | 12.6%).
| Income | Male | Female |
| $2,499 or less | 93 (7.9%) | 72 (5.7%) |
| $2,500 to $4,999 | 25 (2.1%) | 19 (1.5%) |
| $5,000 to $7,499 | 0 (0.0%) | 38 (3.0%) |
| $7,500 to $9,999 | 34 (2.9%) | 61 (4.9%) |
| $10,000 to $12,499 | 31 (2.6%) | 122 (9.7%) |
| $12,500 to $14,999 | 58 (4.9%) | 75 (6.0%) |
| $15,000 to $17,499 | 6 (0.5%) | 63 (5.0%) |
| $17,500 to $19,999 | 36 (3.1%) | 0 (0.0%) |
| $20,000 to $22,499 | 0 (0.0%) | 19 (1.5%) |
| $22,500 to $24,999 | 5 (0.4%) | 27 (2.1%) |
| $25,000 to $29,999 | 13 (1.1%) | 36 (2.9%) |
| $30,000 to $34,999 | 10 (0.9%) | 32 (2.5%) |
| $35,000 to $39,999 | 33 (2.8%) | 80 (6.4%) |
| $40,000 to $44,999 | 0 (0.0%) | 61 (4.9%) |
| $45,000 to $49,999 | 97 (8.3%) | 70 (5.6%) |
| $50,000 to $54,999 | 86 (7.3%) | 31 (2.5%) |
| $55,000 to $64,999 | 20 (1.7%) | 158 (12.6%) |
| $65,000 to $74,999 | 124 (10.6%) | 78 (6.2%) |
| $75,000 to $99,999 | 158 (13.5%) | 140 (11.1%) |
| $100,000+ | 345 (29.4%) | 77 (6.1%) |
| Total | 1,174 (100.0%) | 1,259 (100.0%) |
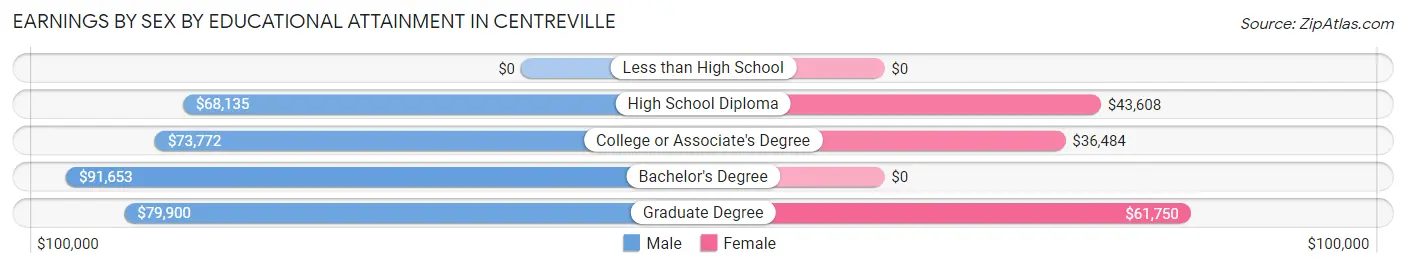
Earnings by Sex by Educational Attainment in Centreville
Average earnings in Centreville are $74,526 for men and $43,463 for women, a difference of 41.7%. Men with an educational attainment of bachelor's degree enjoy the highest average annual earnings of $91,653, while those with high school diploma education earn the least with $68,135. Women with an educational attainment of graduate degree earn the most with the average annual earnings of $61,750, while those with college or associate's degree education have the smallest earnings of $36,484.
| Educational Attainment | Male Income | Female Income |
| Less than High School | - | - |
| High School Diploma | $68,135 | $43,608 |
| College or Associate's Degree | $73,772 | $36,484 |
| Bachelor's Degree | $91,653 | $0 |
| Graduate Degree | $79,900 | $61,750 |
| Total | $74,526 | $43,463 |
Family Income in Centreville
Family Income Brackets in Centreville
According to the Centreville family income data, there are 350 families falling into the $100,000 to $149,999 income range, which is the most common income bracket and makes up 27.4% of all families.
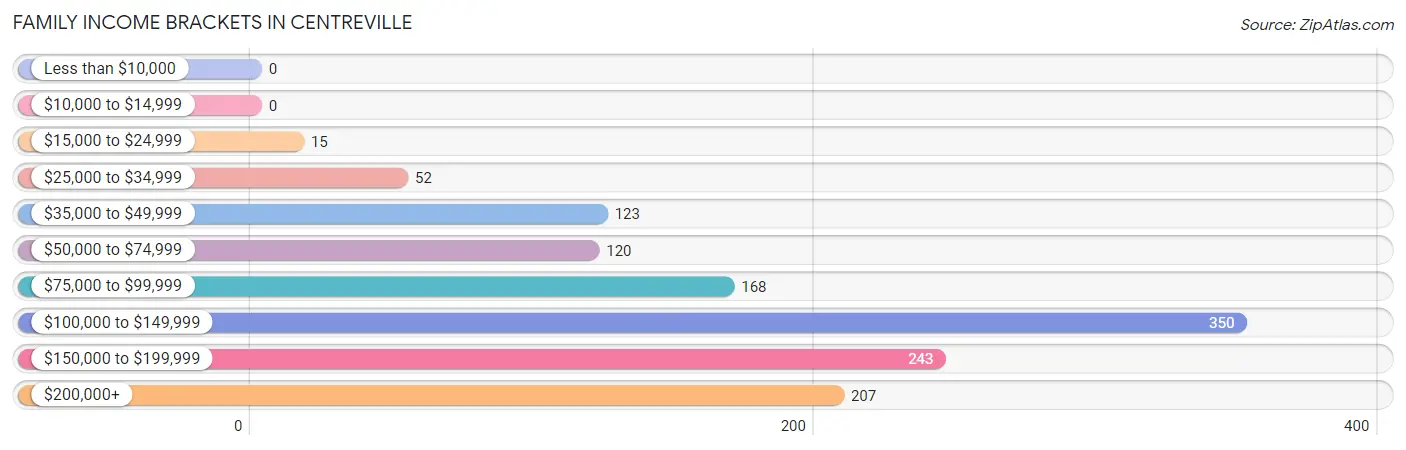
| Income Bracket | # Families | % Families |
| Less than $10,000 | 0 | 0.0% |
| $10,000 to $14,999 | 0 | 0.0% |
| $15,000 to $24,999 | 15 | 1.2% |
| $25,000 to $34,999 | 52 | 4.1% |
| $35,000 to $49,999 | 123 | 9.6% |
| $50,000 to $74,999 | 120 | 9.4% |
| $75,000 to $99,999 | 168 | 13.1% |
| $100,000 to $149,999 | 350 | 27.4% |
| $150,000 to $199,999 | 243 | 19.0% |
| $200,000+ | 207 | 16.2% |
Family Income by Famaliy Size in Centreville
4-person families (279 | 21.8%) account for the highest median family income in Centreville with $151,250 per family, while 2-person families (571 | 44.6%) have the highest median income of $60,804 per family member.
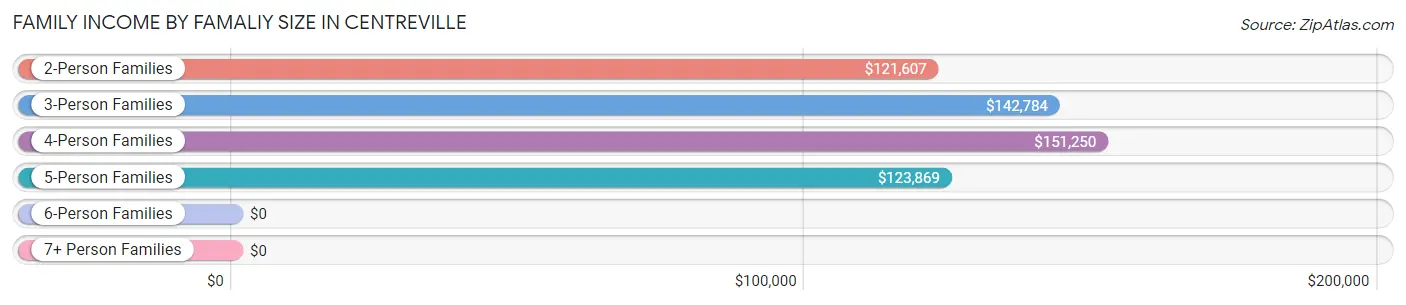
| Income Bracket | # Families | Median Income |
| 2-Person Families | 571 (44.6%) | $121,607 |
| 3-Person Families | 225 (17.6%) | $142,784 |
| 4-Person Families | 279 (21.8%) | $151,250 |
| 5-Person Families | 175 (13.7%) | $123,869 |
| 6-Person Families | 29 (2.3%) | $0 |
| 7+ Person Families | 0 (0.0%) | $0 |
| Total | 1,279 (100.0%) | $135,448 |
Family Income by Number of Earners in Centreville
The median family income in Centreville is $135,448, with families comprising 3+ earners (200) having the highest median family income of $215,761, while families with 1 earner (276) have the lowest median family income of $83,913, accounting for 15.6% and 21.6% of families, respectively.
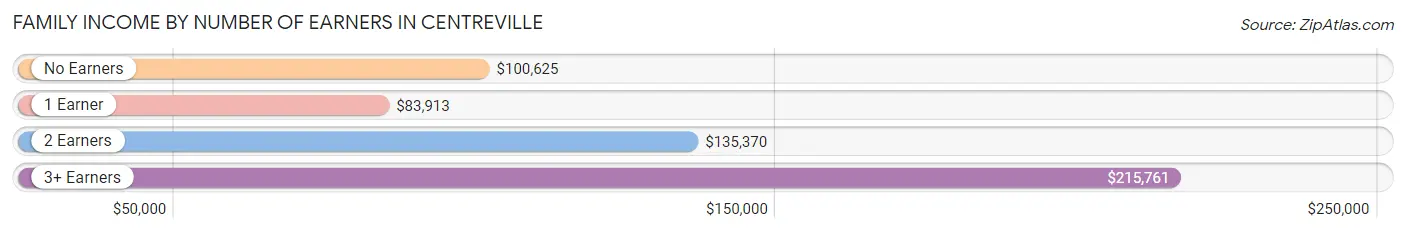
| Number of Earners | # Families | Median Income |
| No Earners | 227 (17.7%) | $100,625 |
| 1 Earner | 276 (21.6%) | $83,913 |
| 2 Earners | 576 (45.0%) | $135,370 |
| 3+ Earners | 200 (15.6%) | $215,761 |
| Total | 1,279 (100.0%) | $135,448 |
Household Income in Centreville
Household Income Brackets in Centreville
With 432 households falling in the category, the $100,000 to $149,999 income range is the most frequent in Centreville, accounting for 24.7% of all households. In contrast, only 23 households (1.3%) fall into the less than $10,000 income bracket, making it the least populous group.
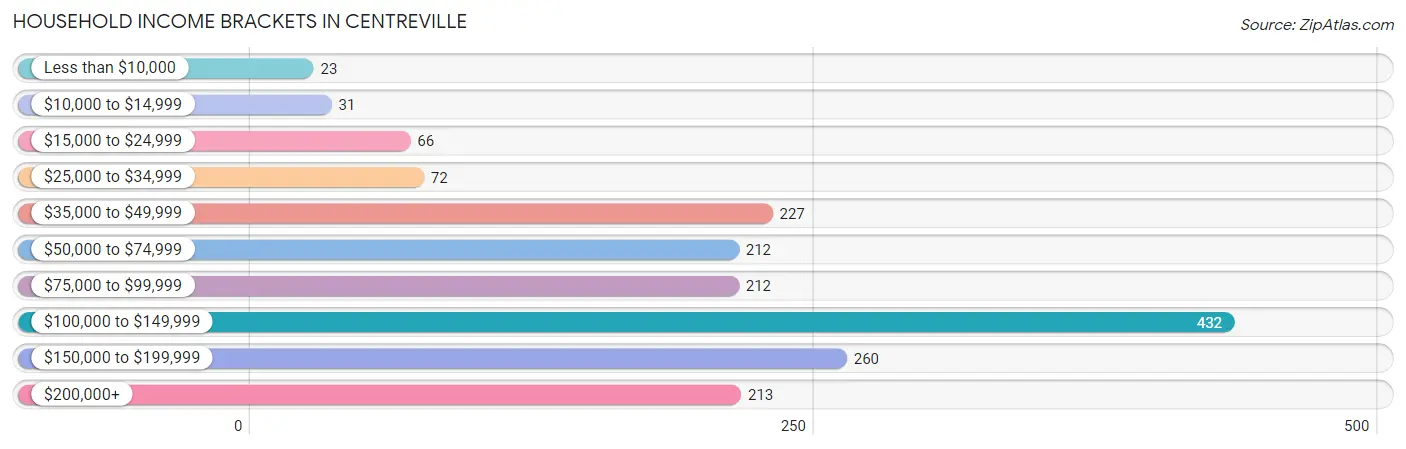
| Income Bracket | # Households | % Households |
| Less than $10,000 | 23 | 1.3% |
| $10,000 to $14,999 | 31 | 1.8% |
| $15,000 to $24,999 | 66 | 3.8% |
| $25,000 to $34,999 | 72 | 4.1% |
| $35,000 to $49,999 | 227 | 13.0% |
| $50,000 to $74,999 | 212 | 12.1% |
| $75,000 to $99,999 | 212 | 12.1% |
| $100,000 to $149,999 | 432 | 24.7% |
| $150,000 to $199,999 | 260 | 14.9% |
| $200,000+ | 213 | 12.2% |
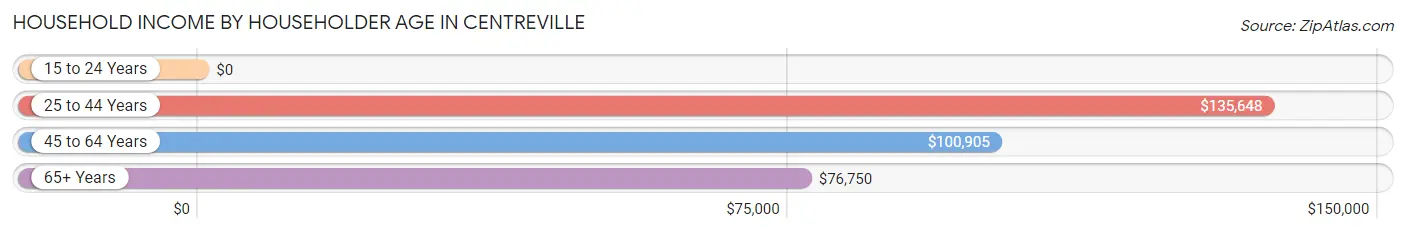
Household Income by Householder Age in Centreville
The median household income in Centreville is $101,455, with the highest median household income of $135,648 found in the 25 to 44 years age bracket for the primary householder. A total of 552 households (31.6%) fall into this category. Meanwhile, the 15 to 24 years age bracket for the primary householder has the lowest median household income of $0, with 21 households (1.2%) in this group.
| Income Bracket | # Households | Median Income |
| 15 to 24 Years | 21 (1.2%) | $0 |
| 25 to 44 Years | 552 (31.6%) | $135,648 |
| 45 to 64 Years | 529 (30.3%) | $100,905 |
| 65+ Years | 646 (37.0%) | $76,750 |
| Total | 1,748 (100.0%) | $101,455 |
Poverty in Centreville
Income Below Poverty by Sex and Age in Centreville
With 2.6% poverty level for males and 4.6% for females among the residents of Centreville, under 5 year old males and 25 to 34 year old females are the most vulnerable to poverty, with 14 males (15.7%) and 35 females (17.9%) in their respective age groups living below the poverty level.
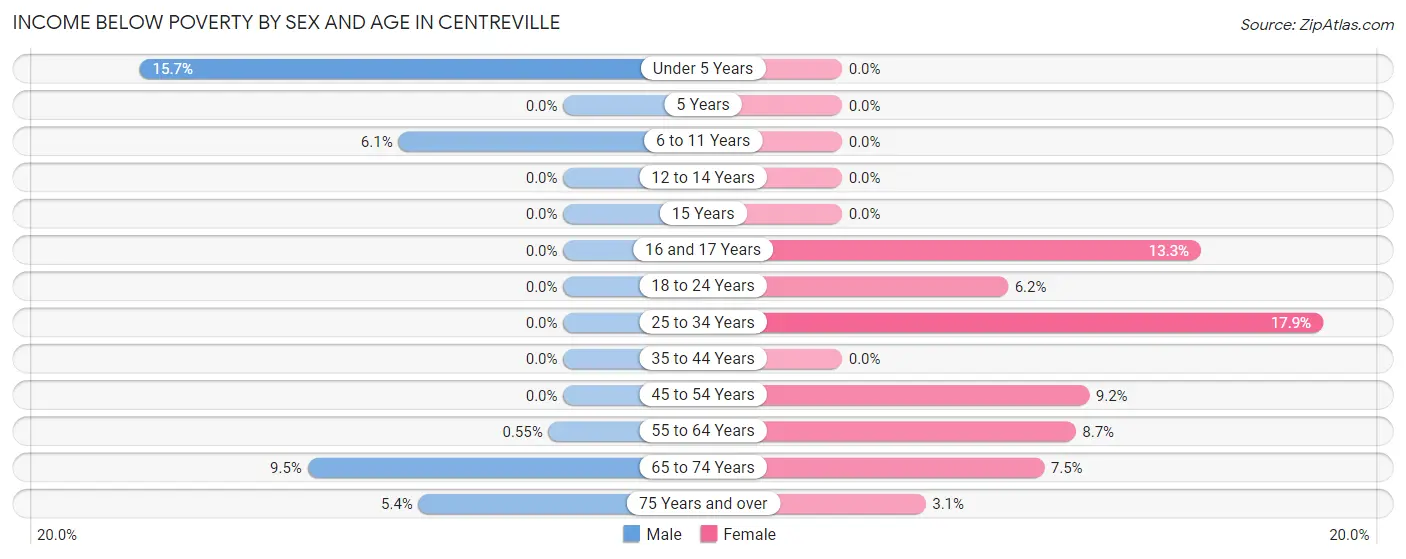
| Age Bracket | Male | Female |
| Under 5 Years | 14 (15.7%) | 0 (0.0%) |
| 5 Years | 0 (0.0%) | 0 (0.0%) |
| 6 to 11 Years | 12 (6.1%) | 0 (0.0%) |
| 12 to 14 Years | 0 (0.0%) | 0 (0.0%) |
| 15 Years | 0 (0.0%) | 0 (0.0%) |
| 16 and 17 Years | 0 (0.0%) | 4 (13.3%) |
| 18 to 24 Years | 0 (0.0%) | 9 (6.2%) |
| 25 to 34 Years | 0 (0.0%) | 35 (17.9%) |
| 35 to 44 Years | 0 (0.0%) | 0 (0.0%) |
| 45 to 54 Years | 0 (0.0%) | 20 (9.2%) |
| 55 to 64 Years | 1 (0.5%) | 17 (8.7%) |
| 65 to 74 Years | 13 (9.5%) | 21 (7.5%) |
| 75 Years and over | 11 (5.4%) | 11 (3.1%) |
| Total | 51 (2.6%) | 117 (4.6%) |
Income Above Poverty by Sex and Age in Centreville
According to the poverty statistics in Centreville, males aged 5 years and females aged under 5 years are the age groups that are most secure financially, with 100.0% of males and 100.0% of females in these age groups living above the poverty line.
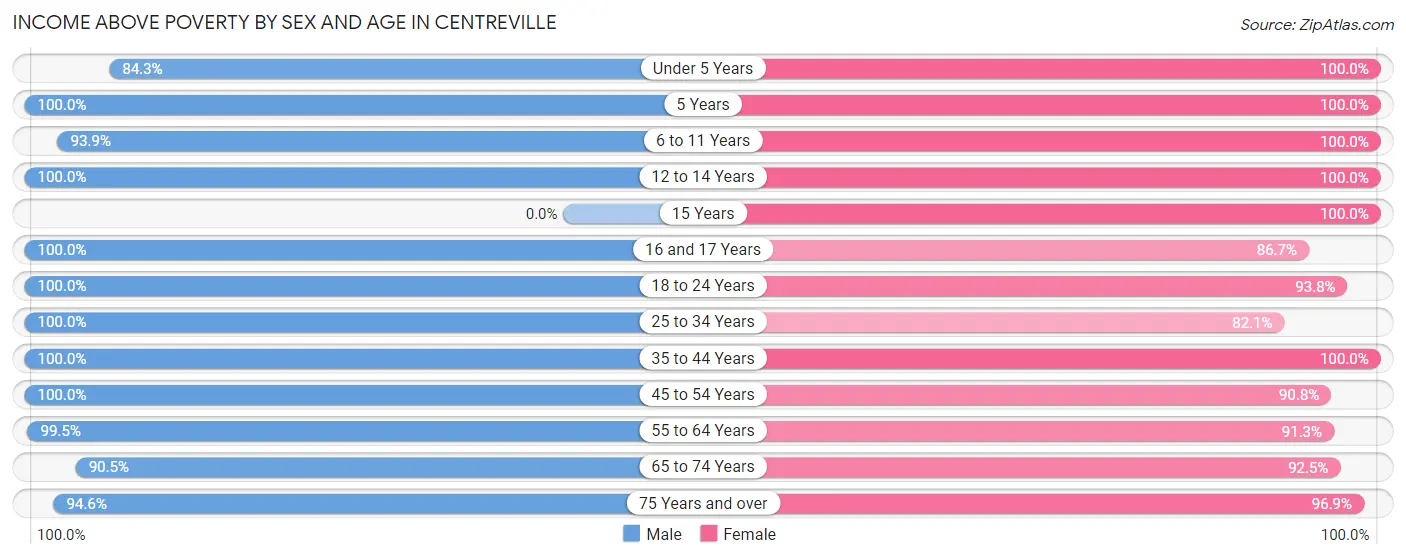
| Age Bracket | Male | Female |
| Under 5 Years | 75 (84.3%) | 101 (100.0%) |
| 5 Years | 53 (100.0%) | 53 (100.0%) |
| 6 to 11 Years | 184 (93.9%) | 256 (100.0%) |
| 12 to 14 Years | 94 (100.0%) | 154 (100.0%) |
| 15 Years | 0 (0.0%) | 52 (100.0%) |
| 16 and 17 Years | 5 (100.0%) | 26 (86.7%) |
| 18 to 24 Years | 146 (100.0%) | 137 (93.8%) |
| 25 to 34 Years | 201 (100.0%) | 161 (82.1%) |
| 35 to 44 Years | 385 (100.0%) | 492 (100.0%) |
| 45 to 54 Years | 249 (100.0%) | 198 (90.8%) |
| 55 to 64 Years | 181 (99.5%) | 179 (91.3%) |
| 65 to 74 Years | 124 (90.5%) | 259 (92.5%) |
| 75 Years and over | 194 (94.6%) | 344 (96.9%) |
| Total | 1,891 (97.4%) | 2,412 (95.4%) |
Income Below Poverty Among Married-Couple Families in Centreville
The poverty statistics for married-couple families in Centreville show that 0.5% or 5 of the total 1,042 families live below the poverty line. Families with 1 or 2 children have the highest poverty rate of 1.5%, comprising of 5 families. On the other hand, families with no children have the lowest poverty rate of 0.0%, which includes 0 families.
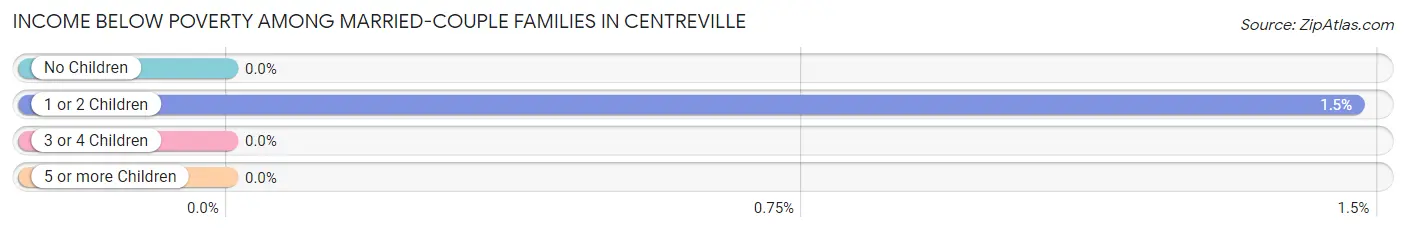
| Children | Above Poverty | Below Poverty |
| No Children | 581 (100.0%) | 0 (0.0%) |
| 1 or 2 Children | 336 (98.5%) | 5 (1.5%) |
| 3 or 4 Children | 120 (100.0%) | 0 (0.0%) |
| 5 or more Children | 0 (0.0%) | 0 (0.0%) |
| Total | 1,037 (99.5%) | 5 (0.5%) |
Income Below Poverty Among Single-Parent Households in Centreville
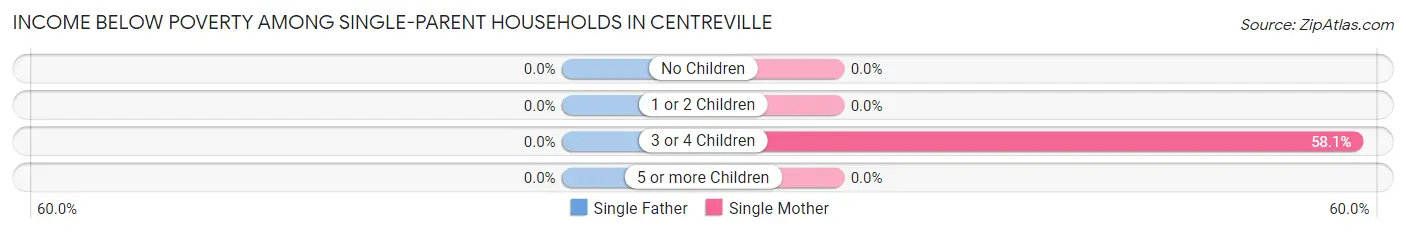
| Children | Single Father | Single Mother |
| No Children | 0 (0.0%) | 0 (0.0%) |
| 1 or 2 Children | 0 (0.0%) | 0 (0.0%) |
| 3 or 4 Children | 0 (0.0%) | 18 (58.1%) |
| 5 or more Children | 0 (0.0%) | 0 (0.0%) |
| Total | 0 (0.0%) | 18 (9.3%) |
Income Below Poverty Among Married-Couple vs Single-Parent Households in Centreville
The poverty data for Centreville shows that 5 of the married-couple family households (0.5%) and 18 of the single-parent households (7.6%) are living below the poverty level. Within the married-couple family households, those with 1 or 2 children have the highest poverty rate, with 5 households (1.5%) falling below the poverty line. Among the single-parent households, those with 3 or 4 children have the highest poverty rate, with 18 household (58.1%) living below poverty.
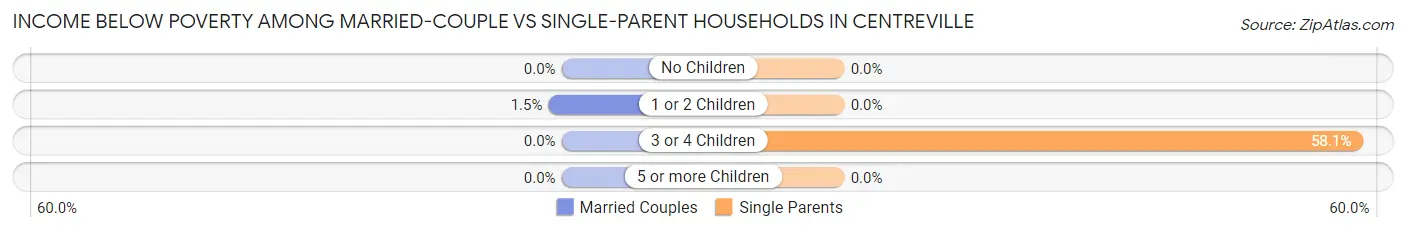
| Children | Married-Couple Families | Single-Parent Households |
| No Children | 0 (0.0%) | 0 (0.0%) |
| 1 or 2 Children | 5 (1.5%) | 0 (0.0%) |
| 3 or 4 Children | 0 (0.0%) | 18 (58.1%) |
| 5 or more Children | 0 (0.0%) | 0 (0.0%) |
| Total | 5 (0.5%) | 18 (7.6%) |
Race in Centreville
The most populous races in Centreville are White / Caucasian (4,053 | 86.2%), Black / African American (455 | 9.7%), and Asian (110 | 2.3%).
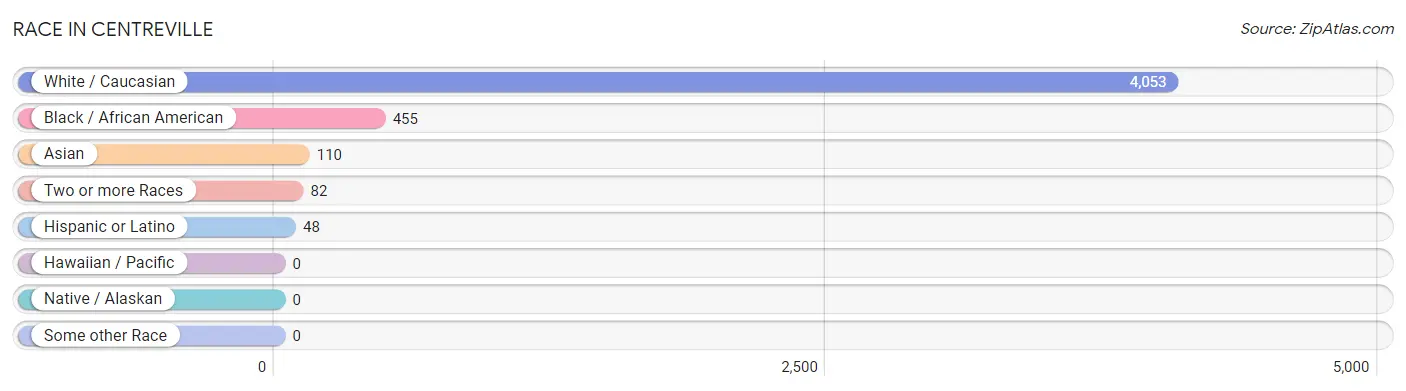
| Race | # Population | % Population |
| Asian | 110 | 2.3% |
| Black / African American | 455 | 9.7% |
| Hawaiian / Pacific | 0 | 0.0% |
| Hispanic or Latino | 48 | 1.0% |
| Native / Alaskan | 0 | 0.0% |
| White / Caucasian | 4,053 | 86.2% |
| Two or more Races | 82 | 1.7% |
| Some other Race | 0 | 0.0% |
| Total | 4,700 | 100.0% |
Ancestry in Centreville
The most populous ancestries reported in Centreville are German (755 | 16.1%), Irish (723 | 15.4%), English (649 | 13.8%), Italian (374 | 8.0%), and European (236 | 5.0%), together accounting for 58.2% of all Centreville residents.
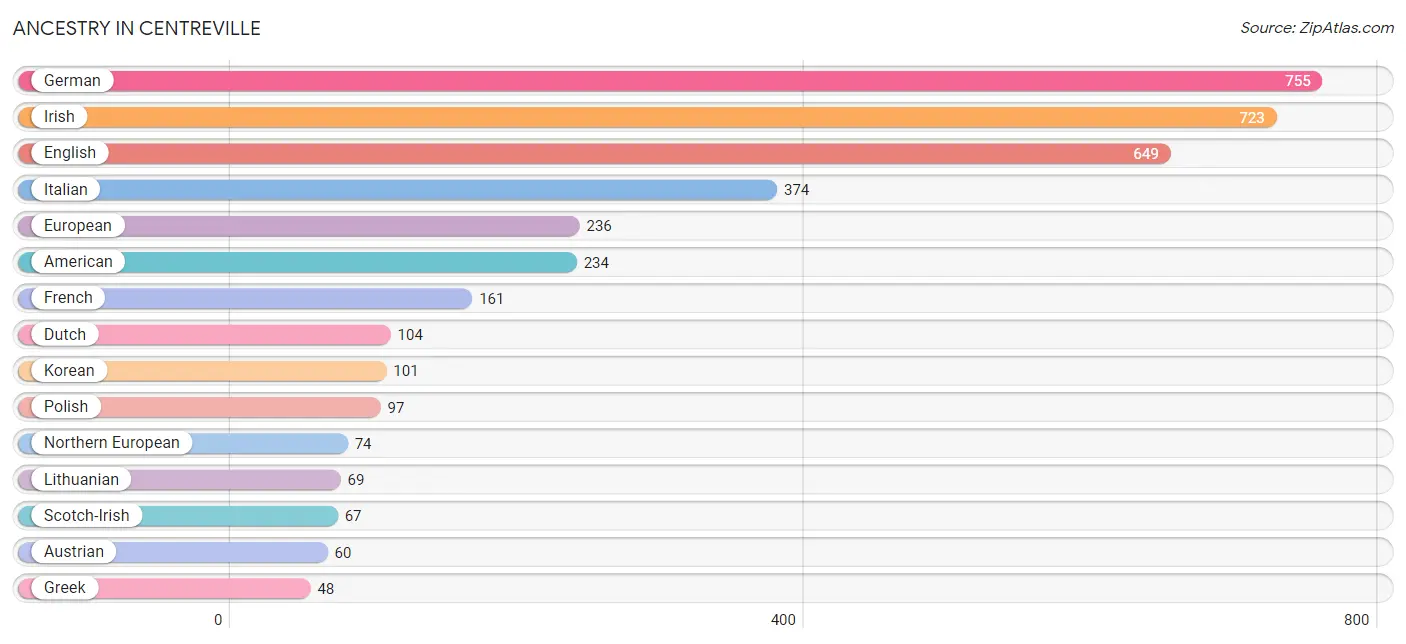
| Ancestry | # Population | % Population |
| African | 36 | 0.8% |
| American | 234 | 5.0% |
| Australian | 11 | 0.2% |
| Austrian | 60 | 1.3% |
| British | 4 | 0.1% |
| Central American | 17 | 0.4% |
| Czech | 5 | 0.1% |
| Dutch | 104 | 2.2% |
| English | 649 | 13.8% |
| Ethiopian | 1 | 0.0% |
| European | 236 | 5.0% |
| French | 161 | 3.4% |
| French Canadian | 14 | 0.3% |
| German | 755 | 16.1% |
| Greek | 48 | 1.0% |
| Hungarian | 22 | 0.5% |
| Indian (Asian) | 9 | 0.2% |
| Irish | 723 | 15.4% |
| Italian | 374 | 8.0% |
| Korean | 101 | 2.1% |
| Latvian | 23 | 0.5% |
| Lithuanian | 69 | 1.5% |
| Mexican | 21 | 0.4% |
| Northern European | 74 | 1.6% |
| Norwegian | 6 | 0.1% |
| Polish | 97 | 2.1% |
| Russian | 15 | 0.3% |
| Salvadoran | 17 | 0.4% |
| Scandinavian | 9 | 0.2% |
| Scotch-Irish | 67 | 1.4% |
| Scottish | 38 | 0.8% |
| Spanish | 10 | 0.2% |
| Subsaharan African | 37 | 0.8% |
| Swedish | 7 | 0.2% |
| Swiss | 27 | 0.6% |
| Welsh | 9 | 0.2% | View All 36 Rows |
Immigrants in Centreville
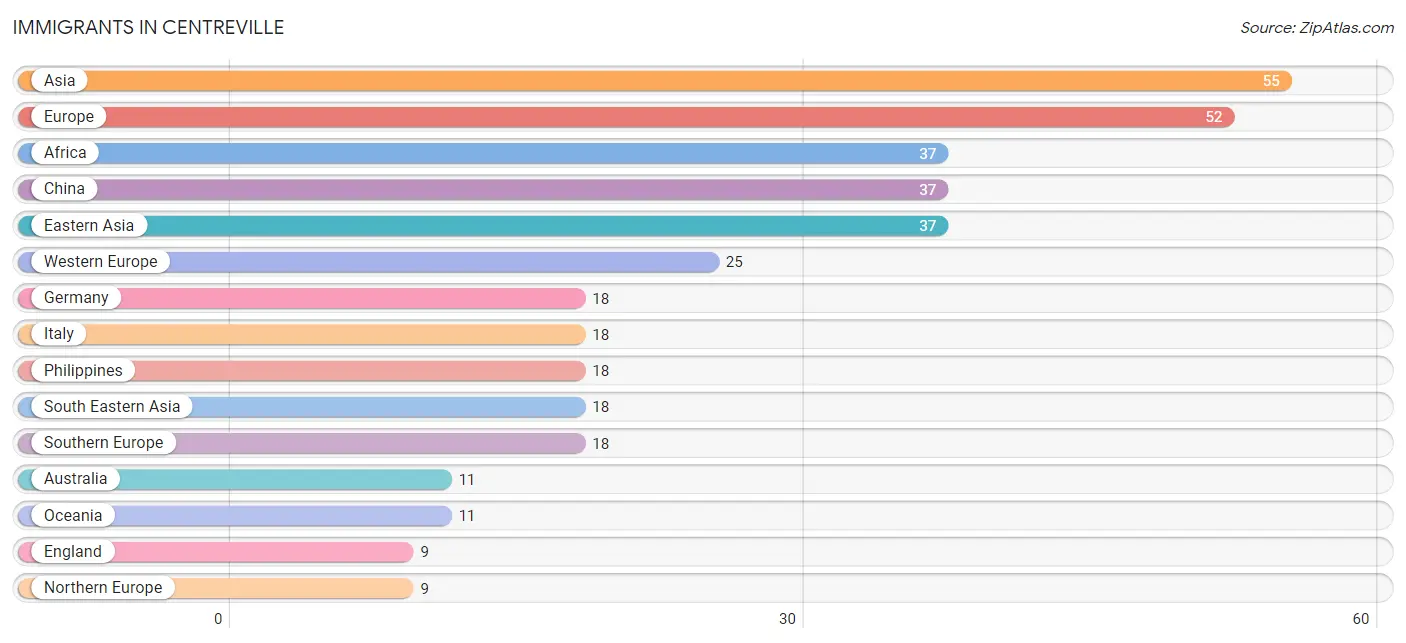
The most numerous immigrant groups reported in Centreville came from Asia (55 | 1.2%), Europe (52 | 1.1%), Africa (37 | 0.8%), China (37 | 0.8%), and Eastern Asia (37 | 0.8%), together accounting for 4.6% of all Centreville residents.
| Immigration Origin | # Population | % Population |
| Africa | 37 | 0.8% |
| Asia | 55 | 1.2% |
| Australia | 11 | 0.2% |
| China | 37 | 0.8% |
| Eastern Africa | 1 | 0.0% |
| Eastern Asia | 37 | 0.8% |
| England | 9 | 0.2% |
| Ethiopia | 1 | 0.0% |
| Europe | 52 | 1.1% |
| Germany | 18 | 0.4% |
| Italy | 18 | 0.4% |
| Netherlands | 7 | 0.2% |
| Northern Europe | 9 | 0.2% |
| Oceania | 11 | 0.2% |
| Philippines | 18 | 0.4% |
| South Eastern Asia | 18 | 0.4% |
| Southern Europe | 18 | 0.4% |
| Western Europe | 25 | 0.5% | View All 18 Rows |
Sex and Age in Centreville
Sex and Age in Centreville
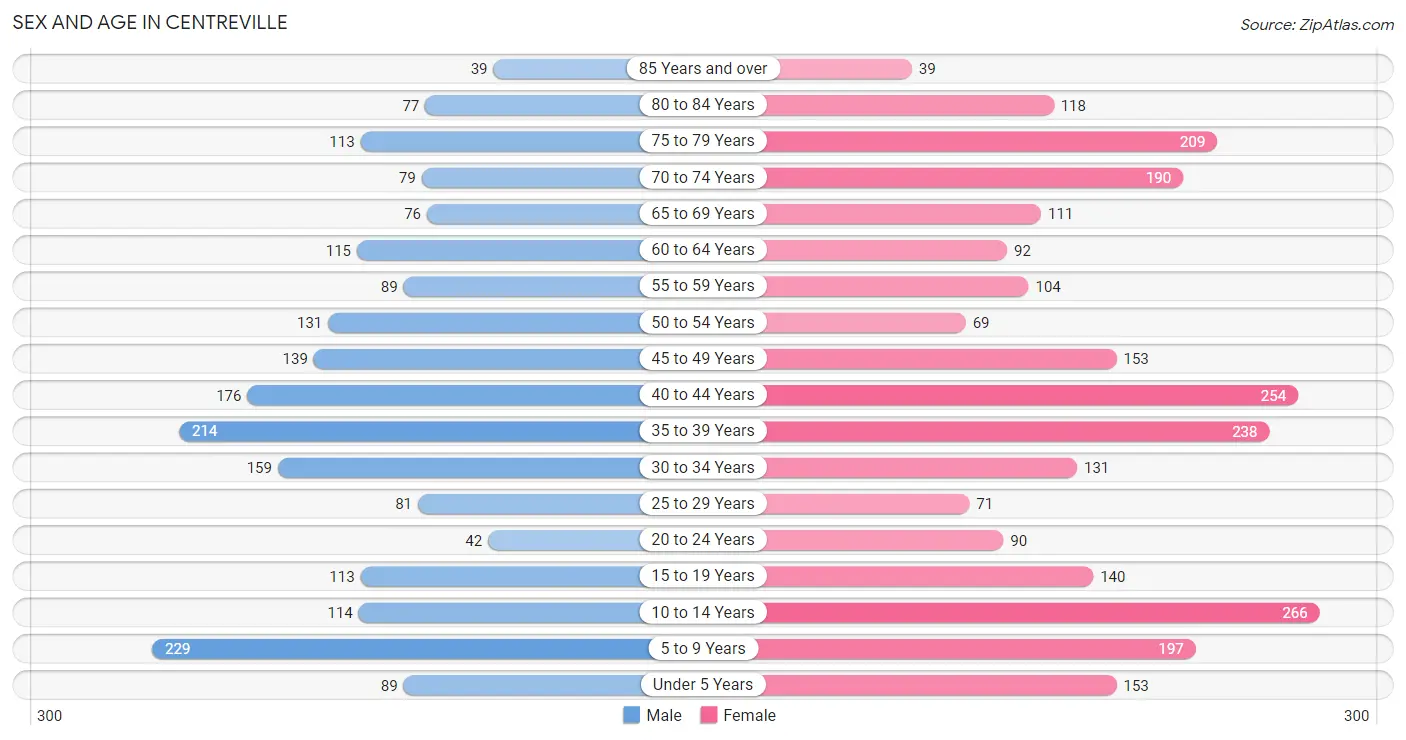
The most populous age groups in Centreville are 5 to 9 Years (229 | 11.0%) for men and 10 to 14 Years (266 | 10.1%) for women.
| Age Bracket | Male | Female |
| Under 5 Years | 89 (4.3%) | 153 (5.8%) |
| 5 to 9 Years | 229 (11.0%) | 197 (7.5%) |
| 10 to 14 Years | 114 (5.5%) | 266 (10.1%) |
| 15 to 19 Years | 113 (5.4%) | 140 (5.3%) |
| 20 to 24 Years | 42 (2.0%) | 90 (3.4%) |
| 25 to 29 Years | 81 (3.9%) | 71 (2.7%) |
| 30 to 34 Years | 159 (7.7%) | 131 (5.0%) |
| 35 to 39 Years | 214 (10.3%) | 238 (9.1%) |
| 40 to 44 Years | 176 (8.5%) | 254 (9.7%) |
| 45 to 49 Years | 139 (6.7%) | 153 (5.8%) |
| 50 to 54 Years | 131 (6.3%) | 69 (2.6%) |
| 55 to 59 Years | 89 (4.3%) | 104 (4.0%) |
| 60 to 64 Years | 115 (5.5%) | 92 (3.5%) |
| 65 to 69 Years | 76 (3.7%) | 111 (4.2%) |
| 70 to 74 Years | 79 (3.8%) | 190 (7.2%) |
| 75 to 79 Years | 113 (5.4%) | 209 (8.0%) |
| 80 to 84 Years | 77 (3.7%) | 118 (4.5%) |
| 85 Years and over | 39 (1.9%) | 39 (1.5%) |
| Total | 2,075 (100.0%) | 2,625 (100.0%) |
Families and Households in Centreville
Median Family Size in Centreville
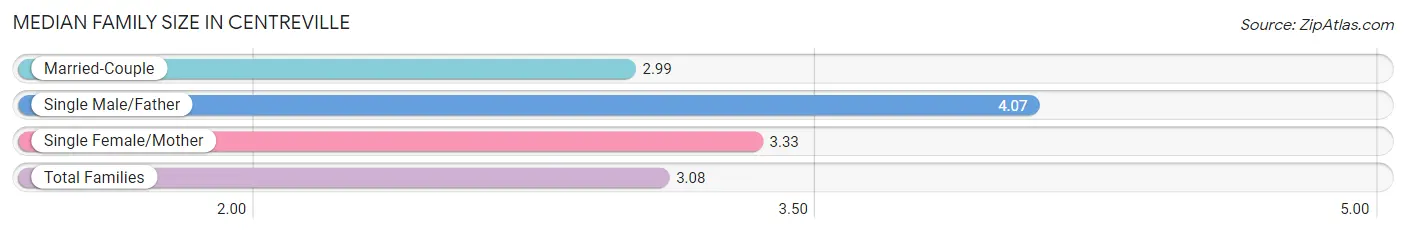
The median family size in Centreville is 3.08 persons per family, with single male/father families (44 | 3.4%) accounting for the largest median family size of 4.07 persons per family. On the other hand, married-couple families (1,042 | 81.5%) represent the smallest median family size with 2.99 persons per family.
| Family Type | # Families | Family Size |
| Married-Couple | 1,042 (81.5%) | 2.99 |
| Single Male/Father | 44 (3.4%) | 4.07 |
| Single Female/Mother | 193 (15.1%) | 3.33 |
| Total Families | 1,279 (100.0%) | 3.08 |
Median Household Size in Centreville
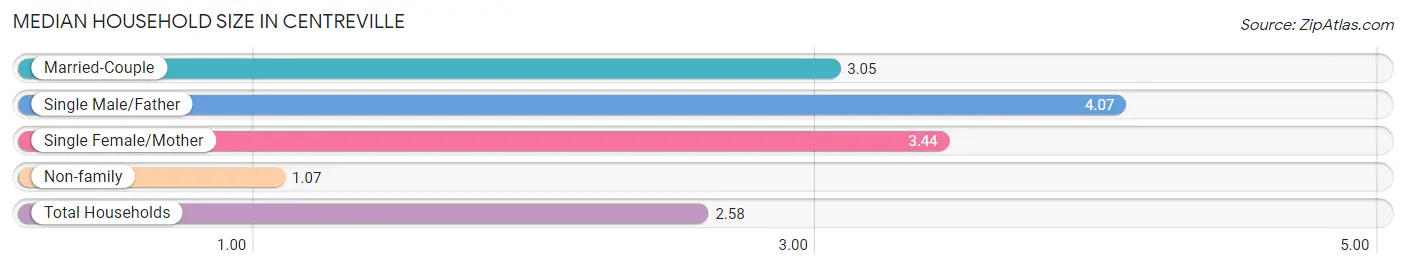
The median household size in Centreville is 2.58 persons per household, with single male/father households (44 | 2.5%) accounting for the largest median household size of 4.07 persons per household. non-family households (469 | 26.8%) represent the smallest median household size with 1.07 persons per household.
| Household Type | # Households | Household Size |
| Married-Couple | 1,042 (59.6%) | 3.05 |
| Single Male/Father | 44 (2.5%) | 4.07 |
| Single Female/Mother | 193 (11.0%) | 3.44 |
| Non-family | 469 (26.8%) | 1.07 |
| Total Households | 1,748 (100.0%) | 2.58 |
Household Size by Marriage Status in Centreville
Out of a total of 1,748 households in Centreville, 1,279 (73.2%) are family households, while 469 (26.8%) are nonfamily households. The most numerous type of family households are 2-person households, comprising 565, and the most common type of nonfamily households are 1-person households, comprising 433.
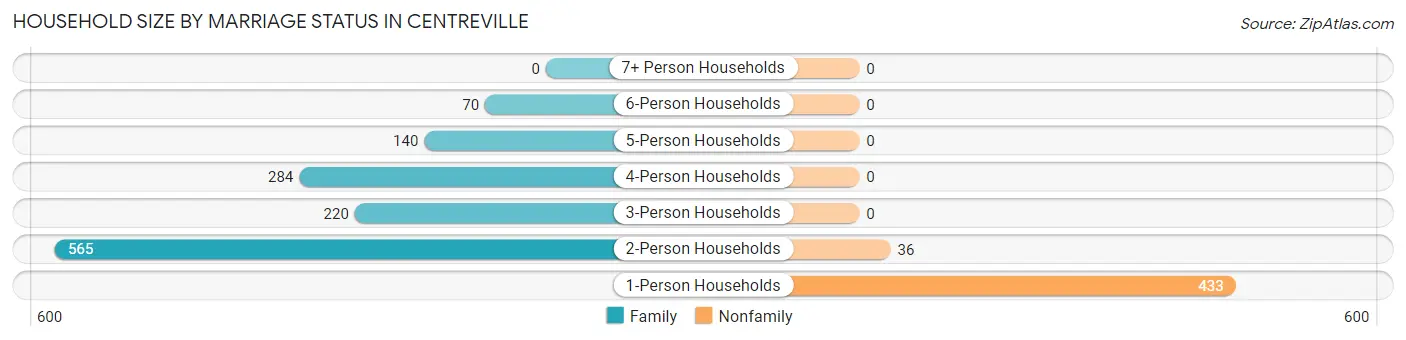
| Household Size | Family Households | Nonfamily Households |
| 1-Person Households | - | 433 (24.8%) |
| 2-Person Households | 565 (32.3%) | 36 (2.1%) |
| 3-Person Households | 220 (12.6%) | 0 (0.0%) |
| 4-Person Households | 284 (16.3%) | 0 (0.0%) |
| 5-Person Households | 140 (8.0%) | 0 (0.0%) |
| 6-Person Households | 70 (4.0%) | 0 (0.0%) |
| 7+ Person Households | 0 (0.0%) | 0 (0.0%) |
| Total | 1,279 (73.2%) | 469 (26.8%) |
Female Fertility in Centreville
Fertility by Age in Centreville
Average fertility rate in Centreville is 25.0 births per 1,000 women. Women in the age bracket of 35 to 50 years have the highest fertility rate with 41.0 births per 1,000 women. Women in the age bracket of 35 to 50 years acount for 100.0% of all women with births.
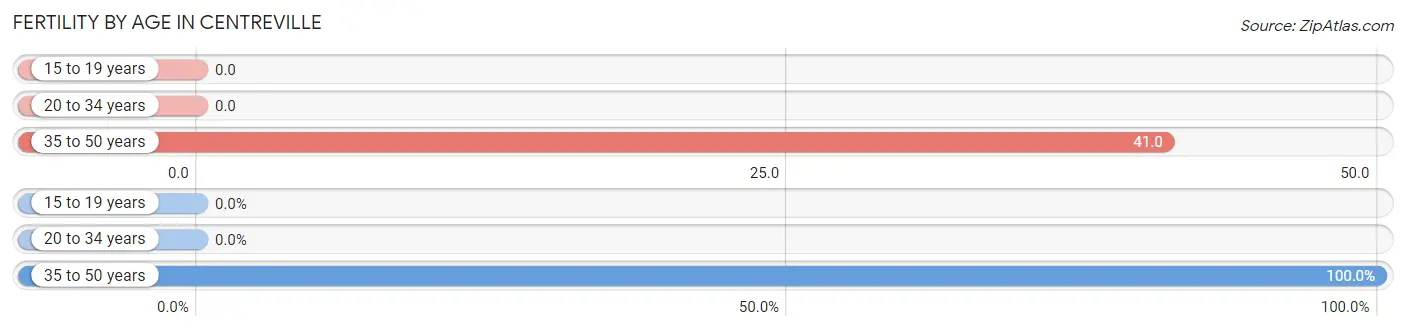
| Age Bracket | Women with Births | Births / 1,000 Women |
| 15 to 19 years | 0 (0.0%) | 0.0 |
| 20 to 34 years | 0 (0.0%) | 0.0 |
| 35 to 50 years | 27 (100.0%) | 41.0 |
| Total | 27 (100.0%) | 25.0 |
Fertility by Age by Marriage Status in Centreville
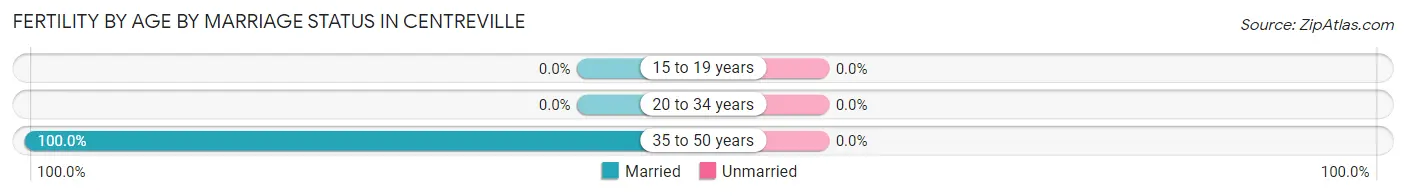
| Age Bracket | Married | Unmarried |
| 15 to 19 years | 0 (0.0%) | 0 (0.0%) |
| 20 to 34 years | 0 (0.0%) | 0 (0.0%) |
| 35 to 50 years | 27 (100.0%) | 0 (0.0%) |
| Total | 27 (100.0%) | 0 (0.0%) |
Fertility by Education in Centreville
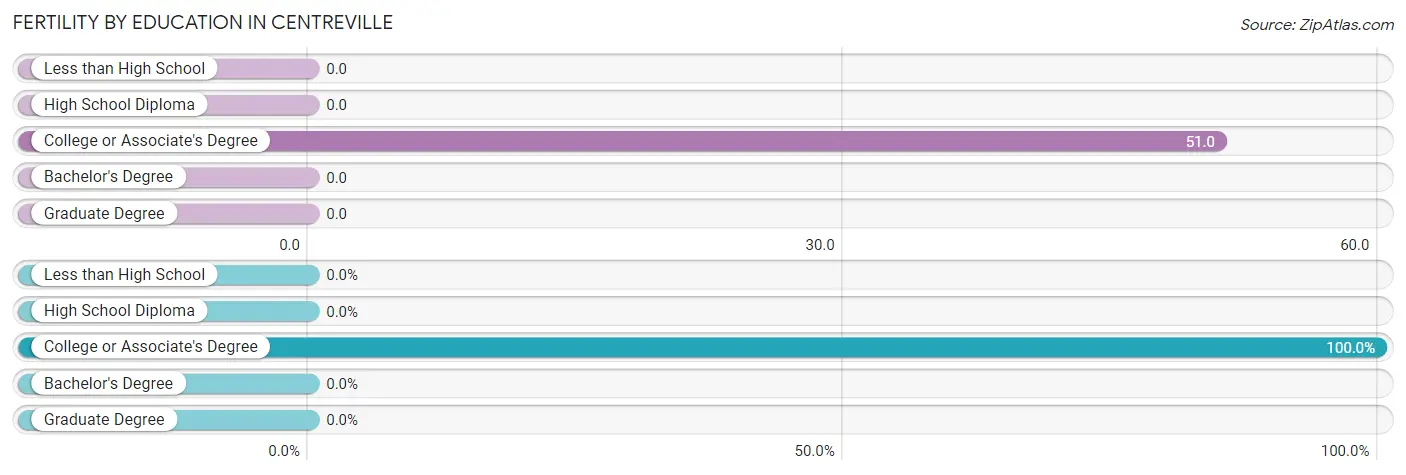
| Educational Attainment | Women with Births | Births / 1,000 Women |
| Less than High School | 0 (0.0%) | 0.0 |
| High School Diploma | 0 (0.0%) | 0.0 |
| College or Associate's Degree | 27 (100.0%) | 51.0 |
| Bachelor's Degree | 0 (0.0%) | 0.0 |
| Graduate Degree | 0 (0.0%) | 0.0 |
| Total | 27 (100.0%) | 25.0 |
Fertility by Education by Marriage Status in Centreville
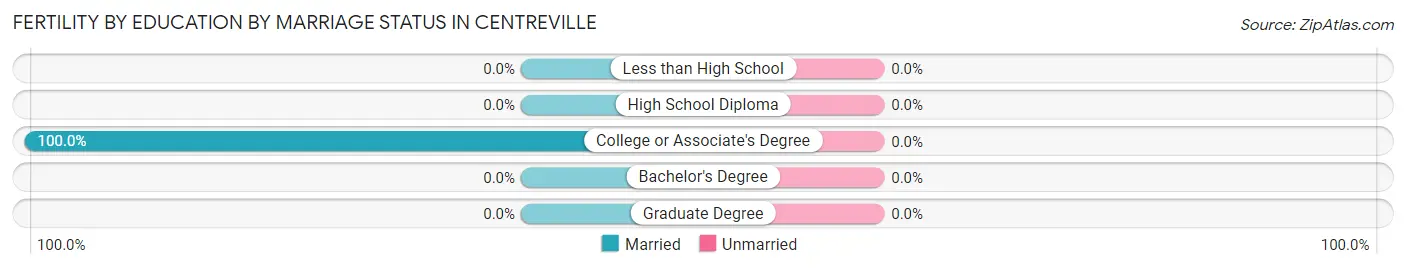
| Educational Attainment | Married | Unmarried |
| Less than High School | 0 (0.0%) | 0 (0.0%) |
| High School Diploma | 0 (0.0%) | 0 (0.0%) |
| College or Associate's Degree | 27 (100.0%) | 0 (0.0%) |
| Bachelor's Degree | 0 (0.0%) | 0 (0.0%) |
| Graduate Degree | 0 (0.0%) | 0 (0.0%) |
| Total | 27 (100.0%) | 0 (0.0%) |
Employment Characteristics in Centreville
Employment by Class of Employer in Centreville
Among the 2,263 employed individuals in Centreville, private company employees (1,429 | 63.1%), local government employees (329 | 14.5%), and self-employed (not incorporated) (156 | 6.9%) make up the most common classes of employment.
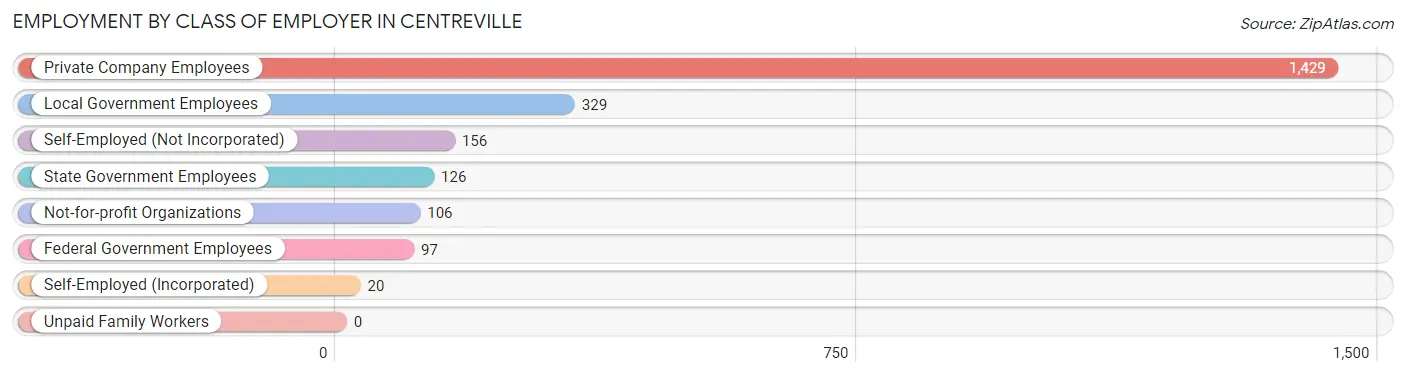
| Employer Class | # Employees | % Employees |
| Private Company Employees | 1,429 | 63.1% |
| Self-Employed (Incorporated) | 20 | 0.9% |
| Self-Employed (Not Incorporated) | 156 | 6.9% |
| Not-for-profit Organizations | 106 | 4.7% |
| Local Government Employees | 329 | 14.5% |
| State Government Employees | 126 | 5.6% |
| Federal Government Employees | 97 | 4.3% |
| Unpaid Family Workers | 0 | 0.0% |
| Total | 2,263 | 100.0% |
Employment Status by Age in Centreville
According to the labor force statistics for Centreville, out of the total population over 16 years of age (3,600), 64.4% or 2,318 individuals are in the labor force, with 2.3% or 53 of them unemployed. The age group with the highest labor force participation rate is 20 to 24 years, with 94.7% or 125 individuals in the labor force. Within the labor force, the 25 to 29 years age range has the highest percentage of unemployed individuals, with 35.7% or 45 of them being unemployed.
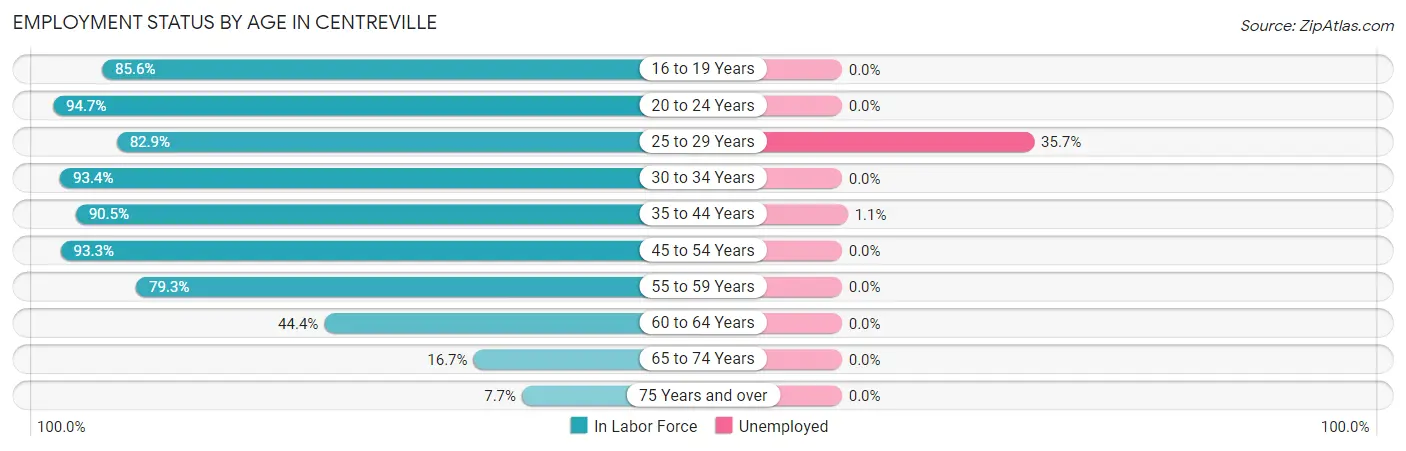
| Age Bracket | In Labor Force | Unemployed |
| 16 to 19 Years | 172 (85.6%) | 0 (0.0%) |
| 20 to 24 Years | 125 (94.7%) | 0 (0.0%) |
| 25 to 29 Years | 126 (82.9%) | 45 (35.7%) |
| 30 to 34 Years | 271 (93.4%) | 0 (0.0%) |
| 35 to 44 Years | 798 (90.5%) | 9 (1.1%) |
| 45 to 54 Years | 459 (93.3%) | 0 (0.0%) |
| 55 to 59 Years | 153 (79.3%) | 0 (0.0%) |
| 60 to 64 Years | 92 (44.4%) | 0 (0.0%) |
| 65 to 74 Years | 76 (16.7%) | 0 (0.0%) |
| 75 Years and over | 46 (7.7%) | 0 (0.0%) |
| Total | 2,318 (64.4%) | 53 (2.3%) |
Employment Status by Educational Attainment in Centreville
According to labor force statistics for Centreville, 85.7% of individuals (1,899) out of the total population between 25 and 64 years of age (2,216) are in the labor force, with 2.8% or 53 of them being unemployed. The group with the highest labor force participation rate are those with the educational attainment of college / associate degree, with 91.6% or 823 individuals in the labor force. Within the labor force, individuals with bachelor's degree or higher education have the highest percentage of unemployment, with 5.0% or 30 of them being unemployed.
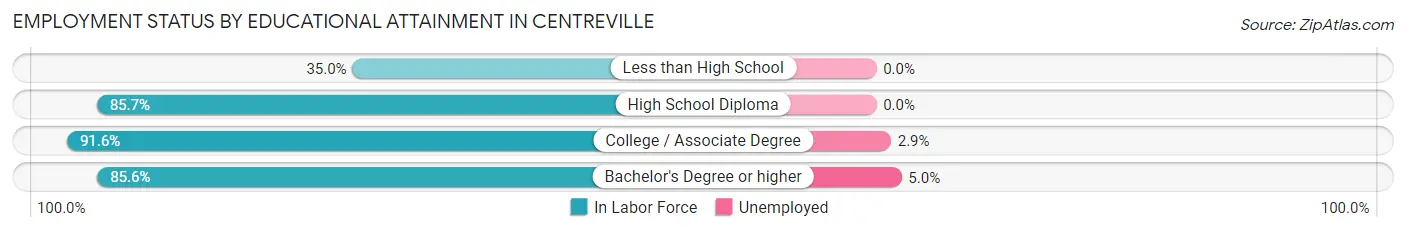
| Educational Attainment | In Labor Force | Unemployed |
| Less than High School | 36 (35.0%) | 0 (0.0%) |
| High School Diploma | 436 (85.7%) | 0 (0.0%) |
| College / Associate Degree | 823 (91.6%) | 26 (2.9%) |
| Bachelor's Degree or higher | 604 (85.6%) | 35 (5.0%) |
| Total | 1,899 (85.7%) | 62 (2.8%) |
Employment Occupations by Sex in Centreville
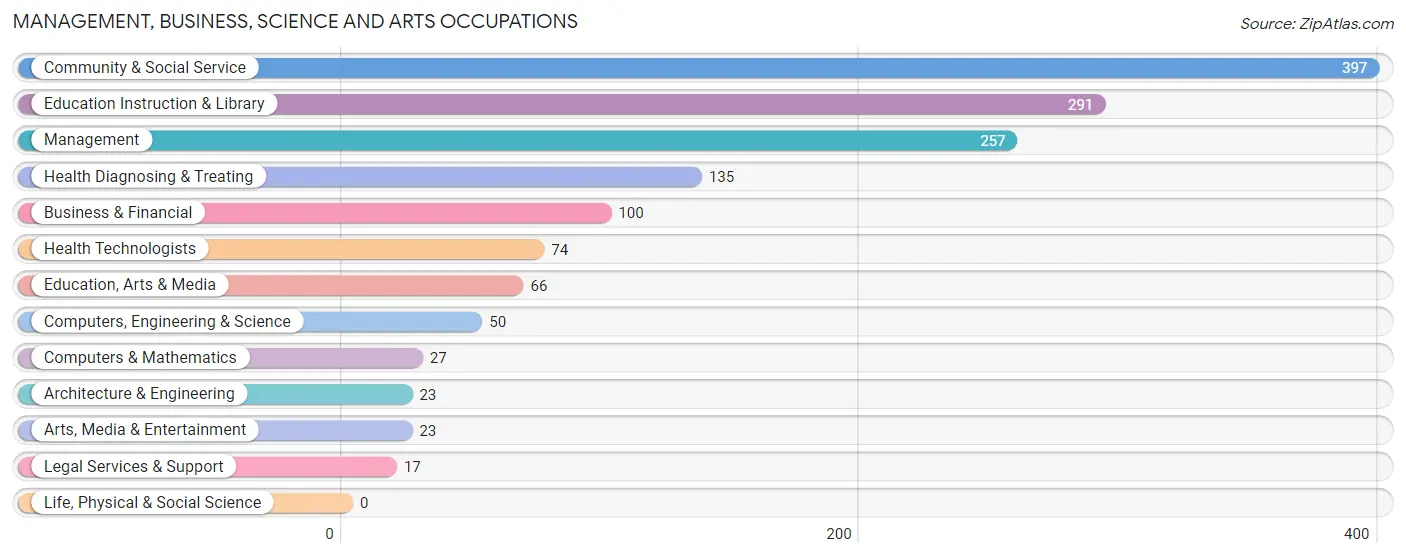
Management, Business, Science and Arts Occupations
The most common Management, Business, Science and Arts occupations in Centreville are Community & Social Service (397 | 17.5%), Education Instruction & Library (291 | 12.9%), Management (257 | 11.4%), Health Diagnosing & Treating (135 | 6.0%), and Business & Financial (100 | 4.4%).
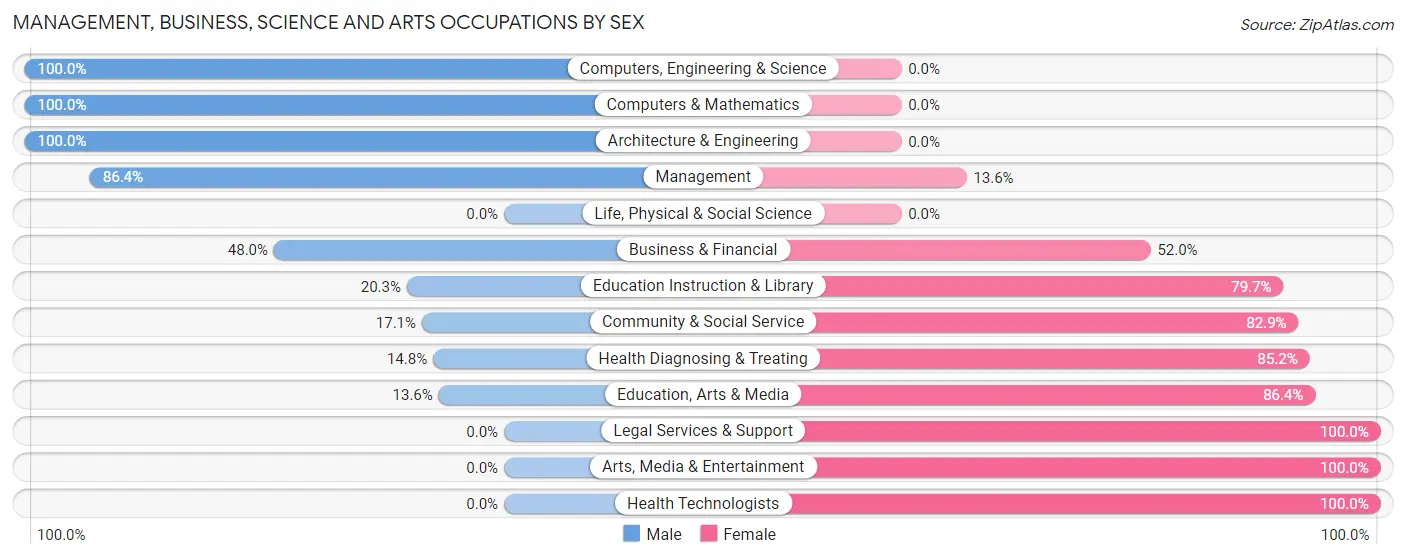
Management, Business, Science and Arts Occupations by Sex
Within the Management, Business, Science and Arts occupations in Centreville, the most male-oriented occupations are Computers, Engineering & Science (100.0%), Computers & Mathematics (100.0%), and Architecture & Engineering (100.0%), while the most female-oriented occupations are Legal Services & Support (100.0%), Arts, Media & Entertainment (100.0%), and Health Technologists (100.0%).
| Occupation | Male | Female |
| Management | 222 (86.4%) | 35 (13.6%) |
| Business & Financial | 48 (48.0%) | 52 (52.0%) |
| Computers, Engineering & Science | 50 (100.0%) | 0 (0.0%) |
| Computers & Mathematics | 27 (100.0%) | 0 (0.0%) |
| Architecture & Engineering | 23 (100.0%) | 0 (0.0%) |
| Life, Physical & Social Science | 0 (0.0%) | 0 (0.0%) |
| Community & Social Service | 68 (17.1%) | 329 (82.9%) |
| Education, Arts & Media | 9 (13.6%) | 57 (86.4%) |
| Legal Services & Support | 0 (0.0%) | 17 (100.0%) |
| Education Instruction & Library | 59 (20.3%) | 232 (79.7%) |
| Arts, Media & Entertainment | 0 (0.0%) | 23 (100.0%) |
| Health Diagnosing & Treating | 20 (14.8%) | 115 (85.2%) |
| Health Technologists | 0 (0.0%) | 74 (100.0%) |
| Total (Category) | 408 (43.4%) | 531 (56.6%) |
| Total (Overall) | 1,059 (46.8%) | 1,205 (53.2%) |
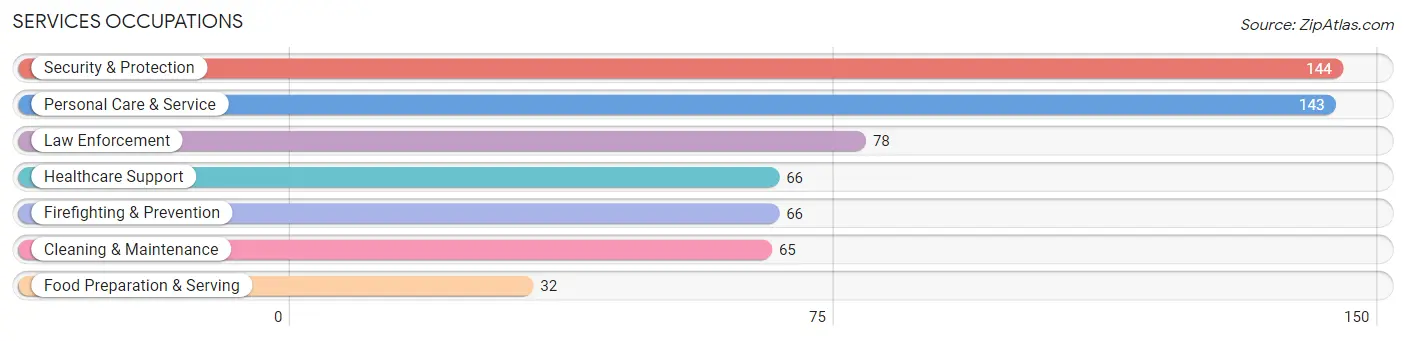
Services Occupations
The most common Services occupations in Centreville are Security & Protection (144 | 6.4%), Personal Care & Service (143 | 6.3%), Law Enforcement (78 | 3.5%), Healthcare Support (66 | 2.9%), and Firefighting & Prevention (66 | 2.9%).
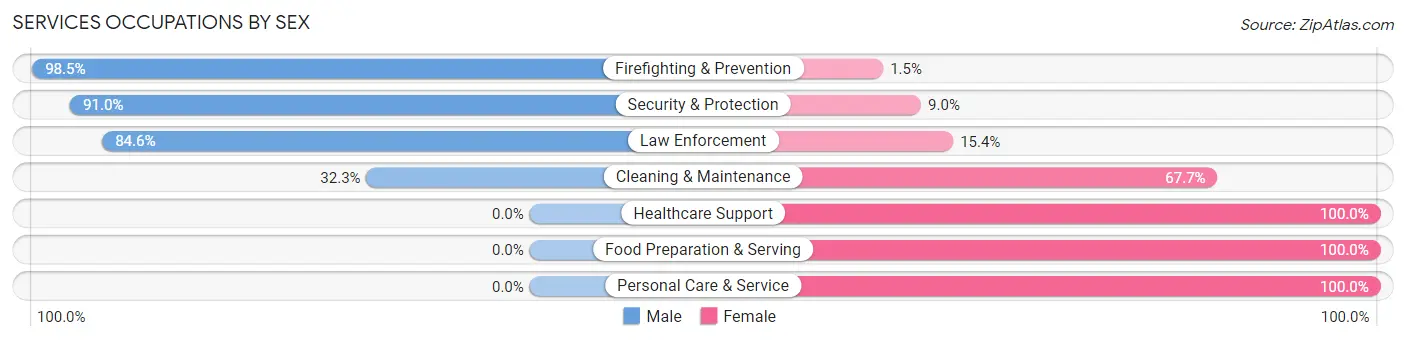
Services Occupations by Sex
Within the Services occupations in Centreville, the most male-oriented occupations are Firefighting & Prevention (98.5%), Security & Protection (91.0%), and Law Enforcement (84.6%), while the most female-oriented occupations are Healthcare Support (100.0%), Food Preparation & Serving (100.0%), and Personal Care & Service (100.0%).
| Occupation | Male | Female |
| Healthcare Support | 0 (0.0%) | 66 (100.0%) |
| Security & Protection | 131 (91.0%) | 13 (9.0%) |
| Firefighting & Prevention | 65 (98.5%) | 1 (1.5%) |
| Law Enforcement | 66 (84.6%) | 12 (15.4%) |
| Food Preparation & Serving | 0 (0.0%) | 32 (100.0%) |
| Cleaning & Maintenance | 21 (32.3%) | 44 (67.7%) |
| Personal Care & Service | 0 (0.0%) | 143 (100.0%) |
| Total (Category) | 152 (33.8%) | 298 (66.2%) |
| Total (Overall) | 1,059 (46.8%) | 1,205 (53.2%) |
Sales and Office Occupations
The most common Sales and Office occupations in Centreville are Sales & Related (315 | 13.9%), and Office & Administration (118 | 5.2%).

Sales and Office Occupations by Sex

| Occupation | Male | Female |
| Sales & Related | 92 (29.2%) | 223 (70.8%) |
| Office & Administration | 14 (11.9%) | 104 (88.1%) |
| Total (Category) | 106 (24.5%) | 327 (75.5%) |
| Total (Overall) | 1,059 (46.8%) | 1,205 (53.2%) |
Natural Resources, Construction and Maintenance Occupations
The most common Natural Resources, Construction and Maintenance occupations in Centreville are Construction & Extraction (134 | 5.9%), and Installation, Maintenance & Repair (89 | 3.9%).
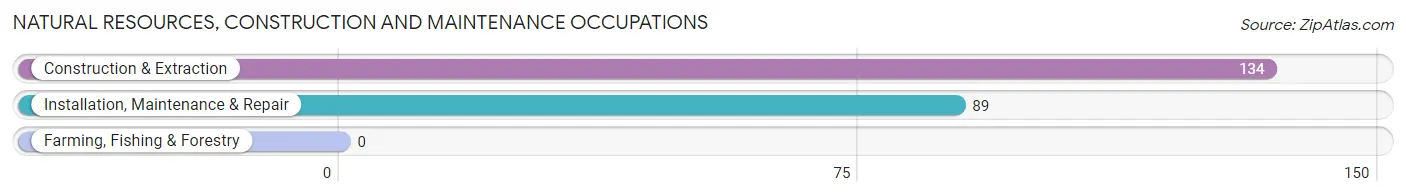
Natural Resources, Construction and Maintenance Occupations by Sex
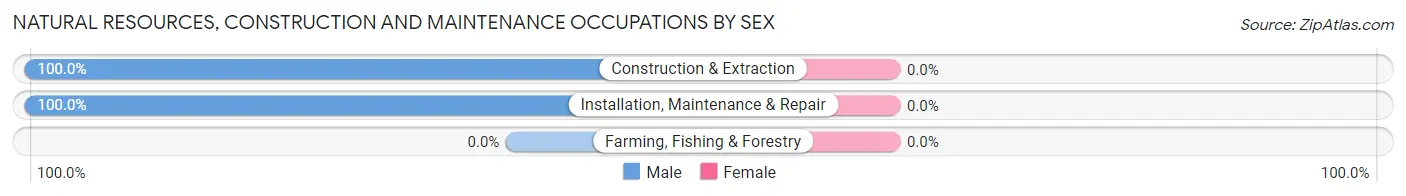
| Occupation | Male | Female |
| Farming, Fishing & Forestry | 0 (0.0%) | 0 (0.0%) |
| Construction & Extraction | 134 (100.0%) | 0 (0.0%) |
| Installation, Maintenance & Repair | 89 (100.0%) | 0 (0.0%) |
| Total (Category) | 223 (100.0%) | 0 (0.0%) |
| Total (Overall) | 1,059 (46.8%) | 1,205 (53.2%) |
Production, Transportation and Moving Occupations
The most common Production, Transportation and Moving occupations in Centreville are Production (85 | 3.7%), Transportation (67 | 3.0%), and Material Moving (67 | 3.0%).
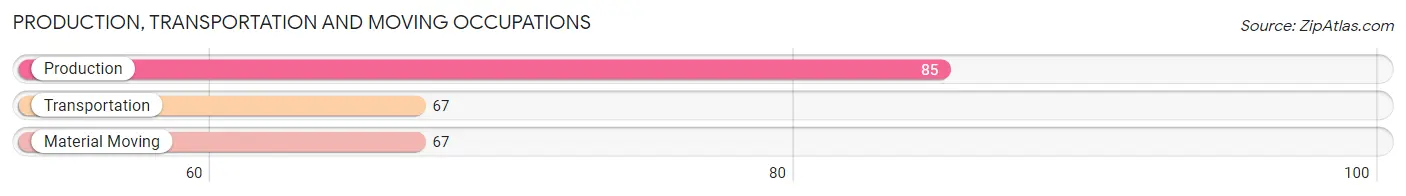
Production, Transportation and Moving Occupations by Sex
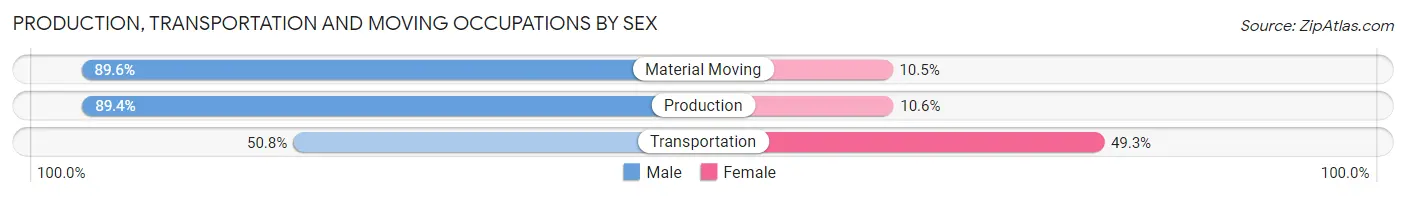
| Occupation | Male | Female |
| Production | 76 (89.4%) | 9 (10.6%) |
| Transportation | 34 (50.7%) | 33 (49.2%) |
| Material Moving | 60 (89.5%) | 7 (10.4%) |
| Total (Category) | 170 (77.6%) | 49 (22.4%) |
| Total (Overall) | 1,059 (46.8%) | 1,205 (53.2%) |
Employment Industries by Sex in Centreville
Employment Industries in Centreville
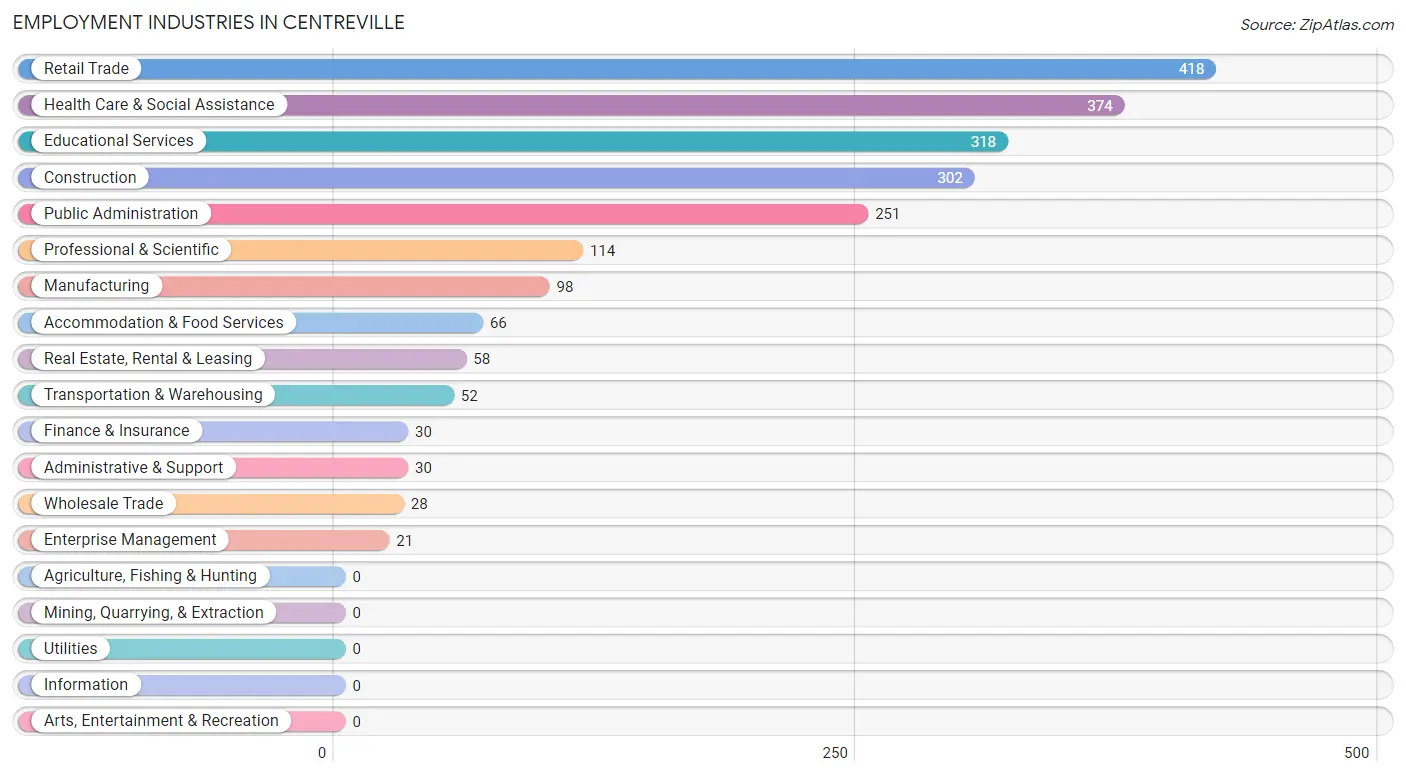
The major employment industries in Centreville include Retail Trade (418 | 18.5%), Health Care & Social Assistance (374 | 16.5%), Educational Services (318 | 14.1%), Construction (302 | 13.3%), and Public Administration (251 | 11.1%).
Employment Industries by Sex in Centreville
The Centreville industries that see more men than women are Real Estate, Rental & Leasing (100.0%), Manufacturing (89.8%), and Construction (83.8%), whereas the industries that tend to have a higher number of women are Enterprise Management (100.0%), Health Care & Social Assistance (98.4%), and Educational Services (79.6%).
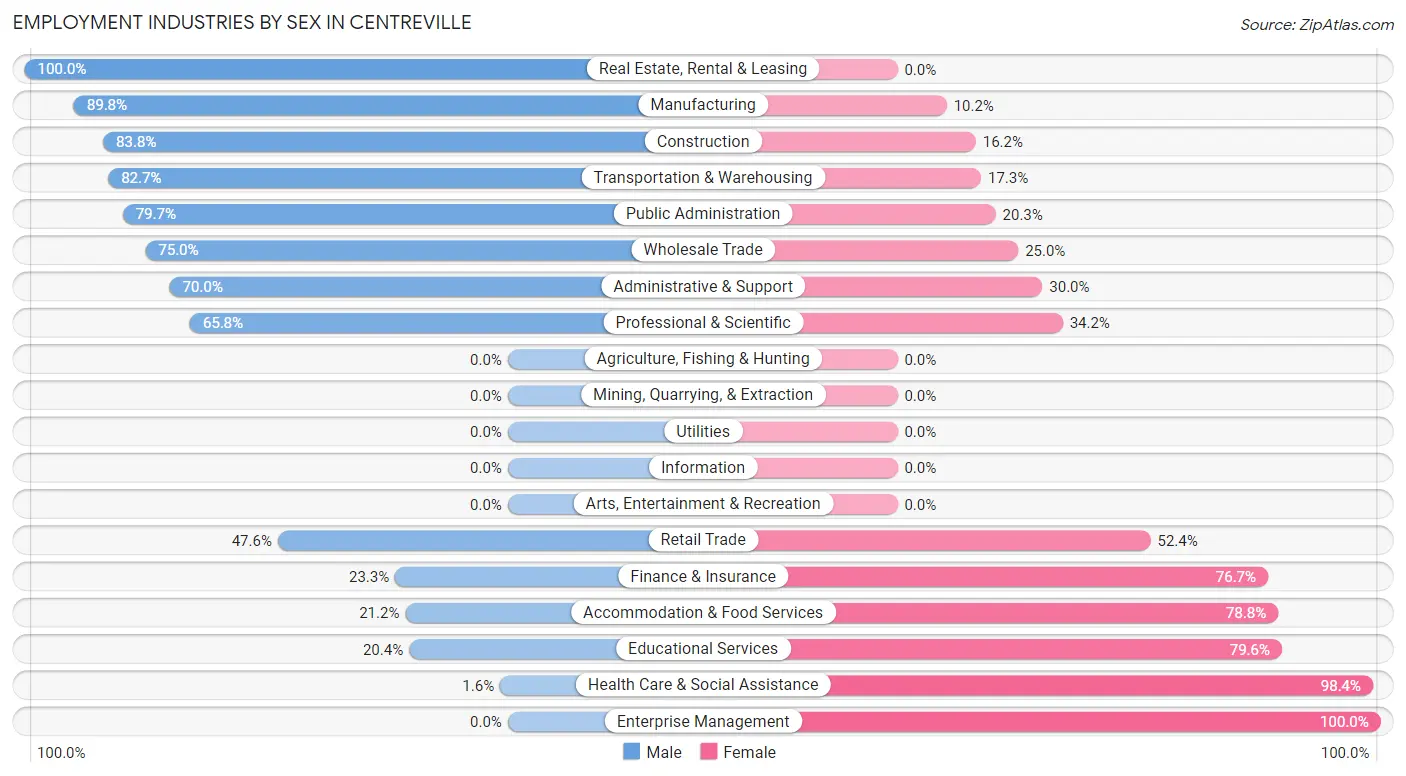
| Industry | Male | Female |
| Agriculture, Fishing & Hunting | 0 (0.0%) | 0 (0.0%) |
| Mining, Quarrying, & Extraction | 0 (0.0%) | 0 (0.0%) |
| Construction | 253 (83.8%) | 49 (16.2%) |
| Manufacturing | 88 (89.8%) | 10 (10.2%) |
| Wholesale Trade | 21 (75.0%) | 7 (25.0%) |
| Retail Trade | 199 (47.6%) | 219 (52.4%) |
| Transportation & Warehousing | 43 (82.7%) | 9 (17.3%) |
| Utilities | 0 (0.0%) | 0 (0.0%) |
| Information | 0 (0.0%) | 0 (0.0%) |
| Finance & Insurance | 7 (23.3%) | 23 (76.7%) |
| Real Estate, Rental & Leasing | 58 (100.0%) | 0 (0.0%) |
| Professional & Scientific | 75 (65.8%) | 39 (34.2%) |
| Enterprise Management | 0 (0.0%) | 21 (100.0%) |
| Administrative & Support | 21 (70.0%) | 9 (30.0%) |
| Educational Services | 65 (20.4%) | 253 (79.6%) |
| Health Care & Social Assistance | 6 (1.6%) | 368 (98.4%) |
| Arts, Entertainment & Recreation | 0 (0.0%) | 0 (0.0%) |
| Accommodation & Food Services | 14 (21.2%) | 52 (78.8%) |
| Public Administration | 200 (79.7%) | 51 (20.3%) |
| Total | 1,059 (46.8%) | 1,205 (53.2%) |
Education in Centreville
School Enrollment in Centreville
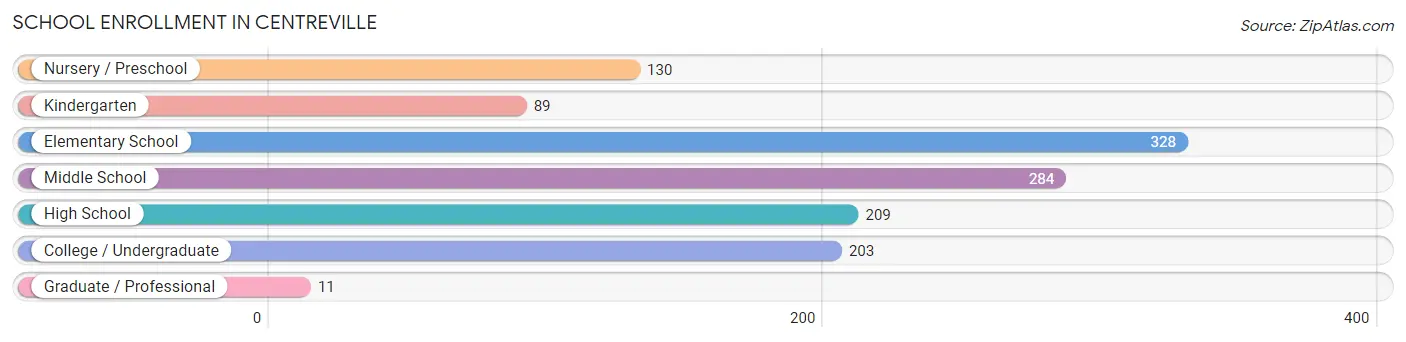
The most common levels of schooling among the 1,254 students in Centreville are elementary school (328 | 26.2%), middle school (284 | 22.7%), and high school (209 | 16.7%).
| School Level | # Students | % Students |
| Nursery / Preschool | 130 | 10.4% |
| Kindergarten | 89 | 7.1% |
| Elementary School | 328 | 26.2% |
| Middle School | 284 | 22.7% |
| High School | 209 | 16.7% |
| College / Undergraduate | 203 | 16.2% |
| Graduate / Professional | 11 | 0.9% |
| Total | 1,254 | 100.0% |
School Enrollment by Age by Funding Source in Centreville
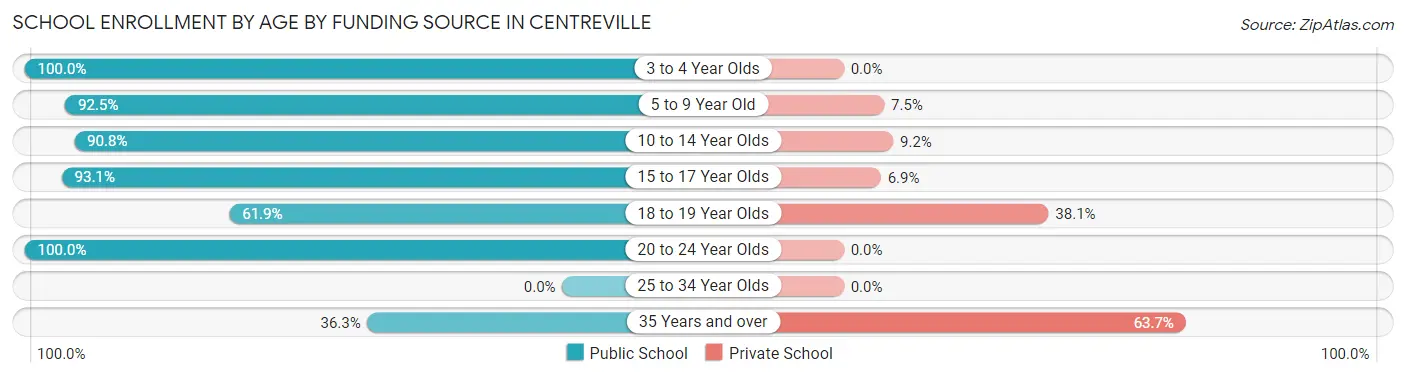
Out of a total of 1,254 students who are enrolled in schools in Centreville, 216 (17.2%) attend a private institution, while the remaining 1,038 (82.8%) are enrolled in public schools. The age group of 35 years and over has the highest likelihood of being enrolled in private schools, with 93 (63.7% in the age bracket) enrolled. Conversely, the age group of 3 to 4 year olds has the lowest likelihood of being enrolled in a private school, with 83 (100.0% in the age bracket) attending a public institution.
| Age Bracket | Public School | Private School |
| 3 to 4 Year Olds | 83 (100.0%) | 0 (0.0%) |
| 5 to 9 Year Old | 356 (92.5%) | 29 (7.5%) |
| 10 to 14 Year Olds | 345 (90.8%) | 35 (9.2%) |
| 15 to 17 Year Olds | 81 (93.1%) | 6 (6.9%) |
| 18 to 19 Year Olds | 86 (61.9%) | 53 (38.1%) |
| 20 to 24 Year Olds | 34 (100.0%) | 0 (0.0%) |
| 25 to 34 Year Olds | 0 (0.0%) | 0 (0.0%) |
| 35 Years and over | 53 (36.3%) | 93 (63.7%) |
| Total | 1,038 (82.8%) | 216 (17.2%) |
Educational Attainment by Field of Study in Centreville
Education (309 | 22.6%), business (204 | 14.9%), arts & humanities (200 | 14.6%), bio, nature & agricultural (127 | 9.3%), and social sciences (109 | 8.0%) are the most common fields of study among 1,367 individuals in Centreville who have obtained a bachelor's degree or higher.
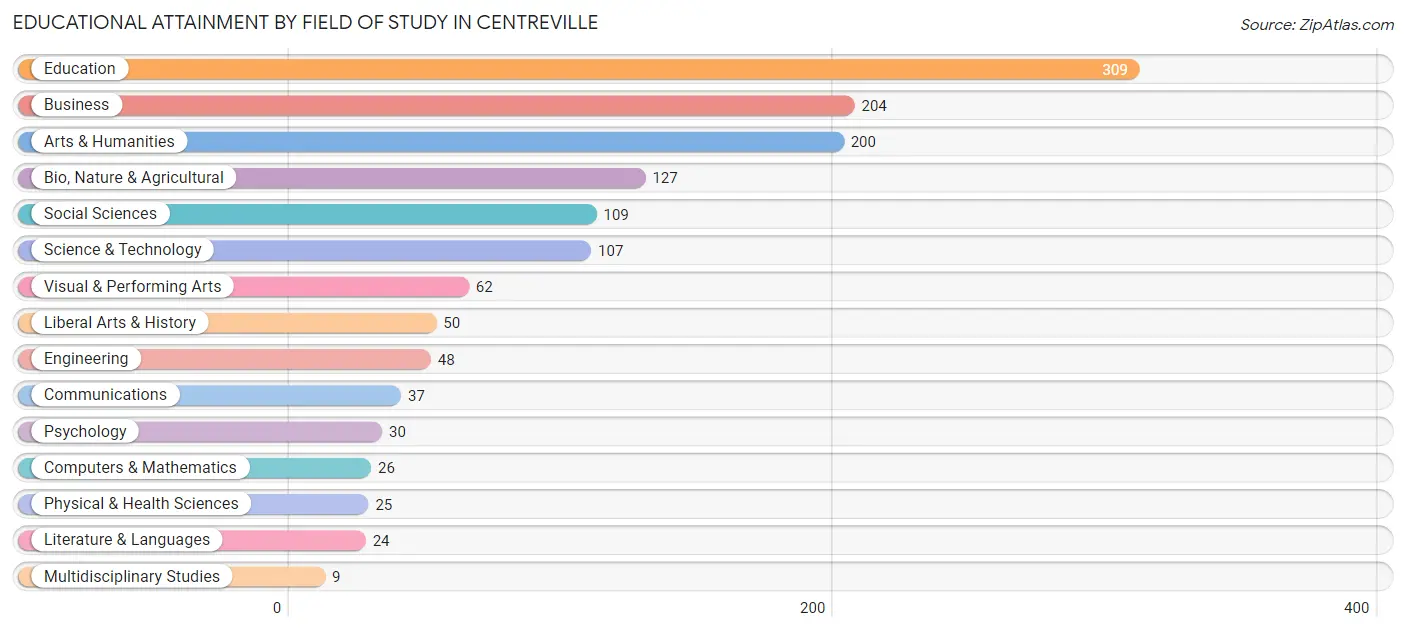
| Field of Study | # Graduates | % Graduates |
| Computers & Mathematics | 26 | 1.9% |
| Bio, Nature & Agricultural | 127 | 9.3% |
| Physical & Health Sciences | 25 | 1.8% |
| Psychology | 30 | 2.2% |
| Social Sciences | 109 | 8.0% |
| Engineering | 48 | 3.5% |
| Multidisciplinary Studies | 9 | 0.7% |
| Science & Technology | 107 | 7.8% |
| Business | 204 | 14.9% |
| Education | 309 | 22.6% |
| Literature & Languages | 24 | 1.8% |
| Liberal Arts & History | 50 | 3.7% |
| Visual & Performing Arts | 62 | 4.5% |
| Communications | 37 | 2.7% |
| Arts & Humanities | 200 | 14.6% |
| Total | 1,367 | 100.0% |
Transportation & Commute in Centreville
Vehicle Availability by Sex in Centreville
The most prevalent vehicle ownership categories in Centreville are males with 2 vehicles (447, accounting for 42.2%) and females with 2 vehicles (435, making up 37.1%).
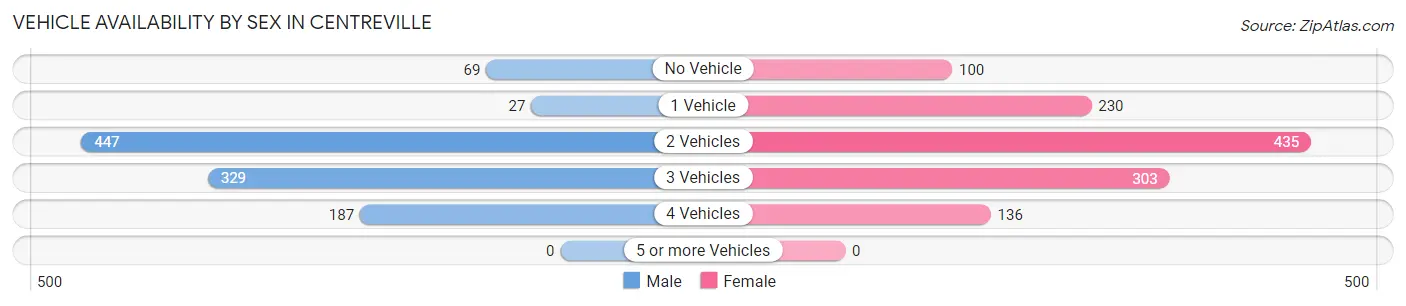
| Vehicles Available | Male | Female |
| No Vehicle | 69 (6.5%) | 100 (8.3%) |
| 1 Vehicle | 27 (2.5%) | 230 (19.1%) |
| 2 Vehicles | 447 (42.2%) | 435 (36.1%) |
| 3 Vehicles | 329 (31.1%) | 303 (25.2%) |
| 4 Vehicles | 187 (17.7%) | 136 (11.3%) |
| 5 or more Vehicles | 0 (0.0%) | 0 (0.0%) |
| Total | 1,059 (100.0%) | 1,204 (100.0%) |
Commute Time in Centreville
The most frequently occuring commute durations in Centreville are 60 to 89 minutes (400 commuters, 20.8%), 10 to 14 minutes (266 commuters, 13.9%), and 20 to 24 minutes (229 commuters, 11.9%).
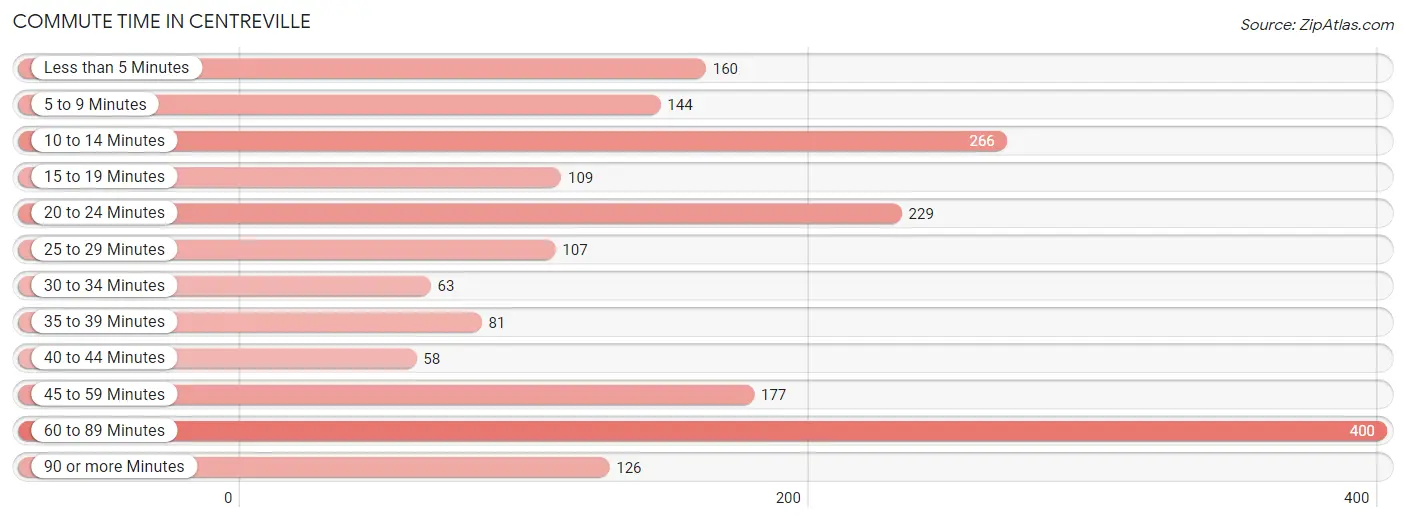
| Commute Time | # Commuters | % Commuters |
| Less than 5 Minutes | 160 | 8.3% |
| 5 to 9 Minutes | 144 | 7.5% |
| 10 to 14 Minutes | 266 | 13.9% |
| 15 to 19 Minutes | 109 | 5.7% |
| 20 to 24 Minutes | 229 | 11.9% |
| 25 to 29 Minutes | 107 | 5.6% |
| 30 to 34 Minutes | 63 | 3.3% |
| 35 to 39 Minutes | 81 | 4.2% |
| 40 to 44 Minutes | 58 | 3.0% |
| 45 to 59 Minutes | 177 | 9.2% |
| 60 to 89 Minutes | 400 | 20.8% |
| 90 or more Minutes | 126 | 6.6% |
Commute Time by Sex in Centreville
The most common commute times in Centreville are 60 to 89 minutes (280 commuters, 29.3%) for males and 10 to 14 minutes (220 commuters, 22.8%) for females.
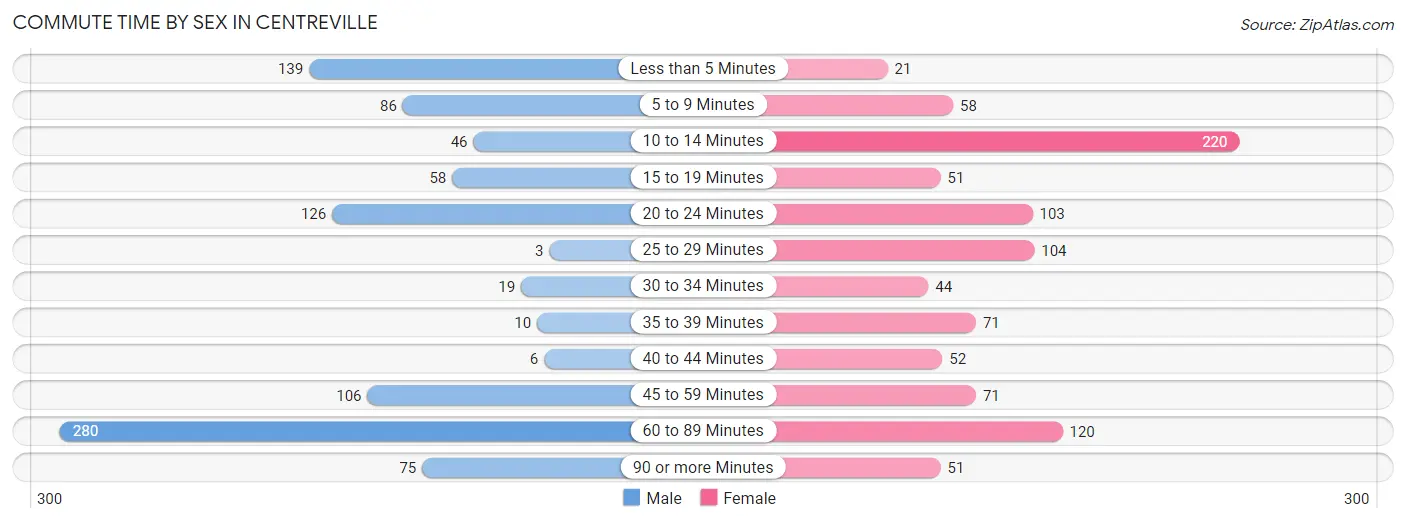
| Commute Time | Male | Female |
| Less than 5 Minutes | 139 (14.6%) | 21 (2.2%) |
| 5 to 9 Minutes | 86 (9.0%) | 58 (6.0%) |
| 10 to 14 Minutes | 46 (4.8%) | 220 (22.8%) |
| 15 to 19 Minutes | 58 (6.1%) | 51 (5.3%) |
| 20 to 24 Minutes | 126 (13.2%) | 103 (10.7%) |
| 25 to 29 Minutes | 3 (0.3%) | 104 (10.8%) |
| 30 to 34 Minutes | 19 (2.0%) | 44 (4.5%) |
| 35 to 39 Minutes | 10 (1.1%) | 71 (7.3%) |
| 40 to 44 Minutes | 6 (0.6%) | 52 (5.4%) |
| 45 to 59 Minutes | 106 (11.1%) | 71 (7.3%) |
| 60 to 89 Minutes | 280 (29.3%) | 120 (12.4%) |
| 90 or more Minutes | 75 (7.9%) | 51 (5.3%) |
Time of Departure to Work by Sex in Centreville
The most frequent times of departure to work in Centreville are 6:00 AM to 6:29 AM (218, 22.9%) for males and 8:00 AM to 8:29 AM (206, 21.3%) for females.
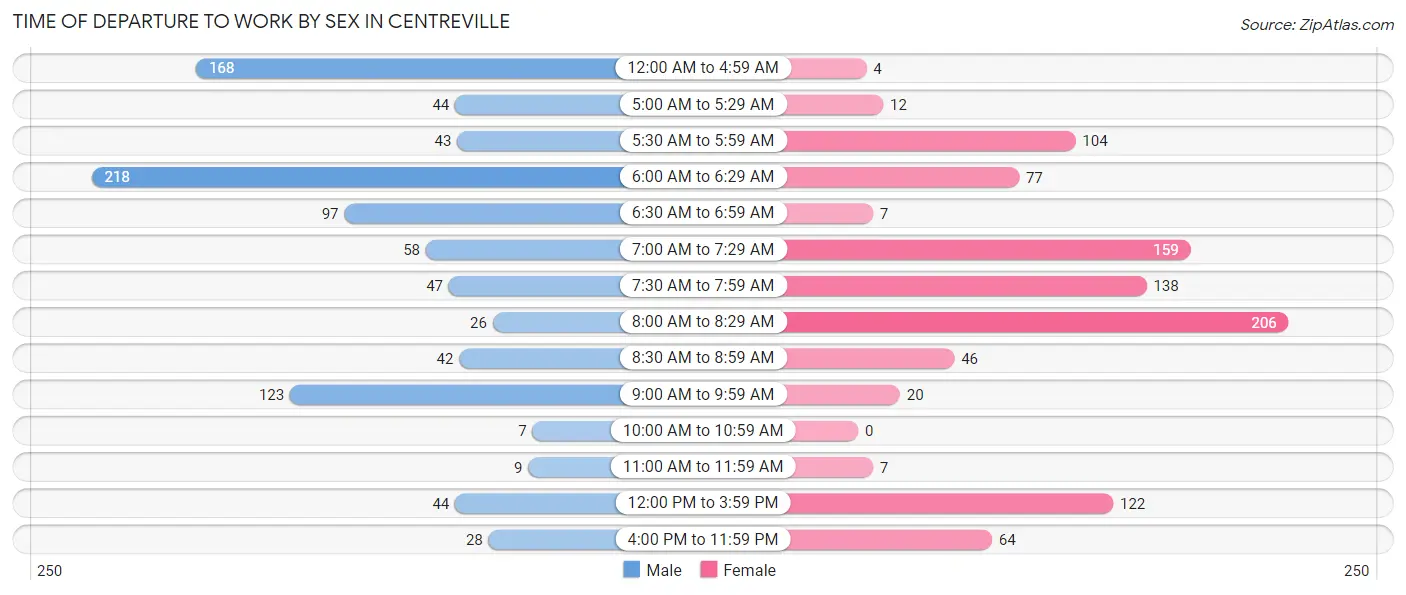
| Time of Departure | Male | Female |
| 12:00 AM to 4:59 AM | 168 (17.6%) | 4 (0.4%) |
| 5:00 AM to 5:29 AM | 44 (4.6%) | 12 (1.2%) |
| 5:30 AM to 5:59 AM | 43 (4.5%) | 104 (10.8%) |
| 6:00 AM to 6:29 AM | 218 (22.9%) | 77 (8.0%) |
| 6:30 AM to 6:59 AM | 97 (10.2%) | 7 (0.7%) |
| 7:00 AM to 7:29 AM | 58 (6.1%) | 159 (16.5%) |
| 7:30 AM to 7:59 AM | 47 (4.9%) | 138 (14.3%) |
| 8:00 AM to 8:29 AM | 26 (2.7%) | 206 (21.3%) |
| 8:30 AM to 8:59 AM | 42 (4.4%) | 46 (4.8%) |
| 9:00 AM to 9:59 AM | 123 (12.9%) | 20 (2.1%) |
| 10:00 AM to 10:59 AM | 7 (0.7%) | 0 (0.0%) |
| 11:00 AM to 11:59 AM | 9 (0.9%) | 7 (0.7%) |
| 12:00 PM to 3:59 PM | 44 (4.6%) | 122 (12.6%) |
| 4:00 PM to 11:59 PM | 28 (2.9%) | 64 (6.6%) |
| Total | 954 (100.0%) | 966 (100.0%) |
Housing Occupancy in Centreville
Occupancy by Ownership in Centreville
Of the total 1,748 dwellings in Centreville, owner-occupied units account for 1,376 (78.7%), while renter-occupied units make up 372 (21.3%).
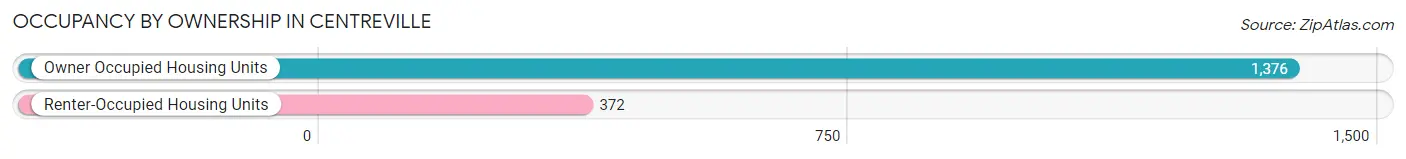
| Occupancy | # Housing Units | % Housing Units |
| Owner Occupied Housing Units | 1,376 | 78.7% |
| Renter-Occupied Housing Units | 372 | 21.3% |
| Total Occupied Housing Units | 1,748 | 100.0% |
Occupancy by Household Size in Centreville
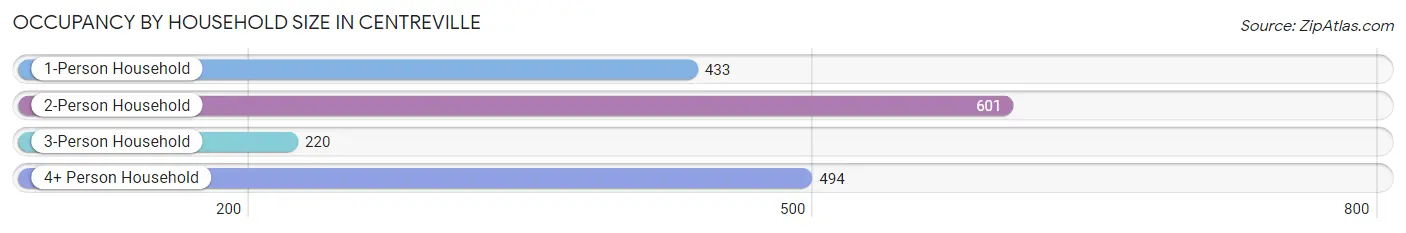
| Household Size | # Housing Units | % Housing Units |
| 1-Person Household | 433 | 24.8% |
| 2-Person Household | 601 | 34.4% |
| 3-Person Household | 220 | 12.6% |
| 4+ Person Household | 494 | 28.3% |
| Total Housing Units | 1,748 | 100.0% |
Occupancy by Ownership by Household Size in Centreville
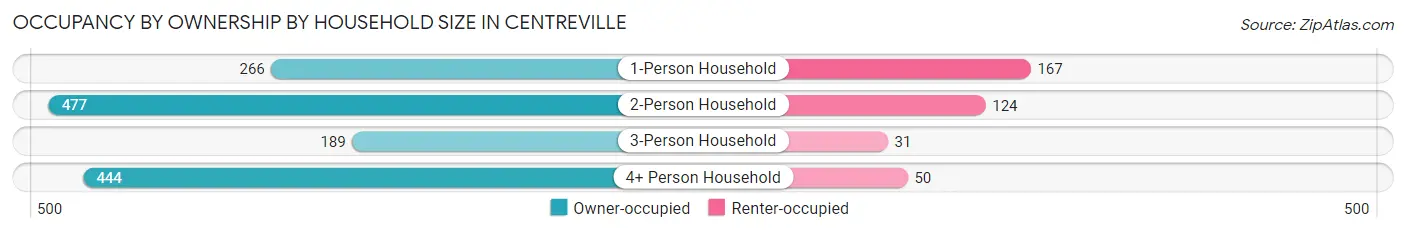
| Household Size | Owner-occupied | Renter-occupied |
| 1-Person Household | 266 (61.4%) | 167 (38.6%) |
| 2-Person Household | 477 (79.4%) | 124 (20.6%) |
| 3-Person Household | 189 (85.9%) | 31 (14.1%) |
| 4+ Person Household | 444 (89.9%) | 50 (10.1%) |
| Total Housing Units | 1,376 (78.7%) | 372 (21.3%) |
Occupancy by Educational Attainment in Centreville
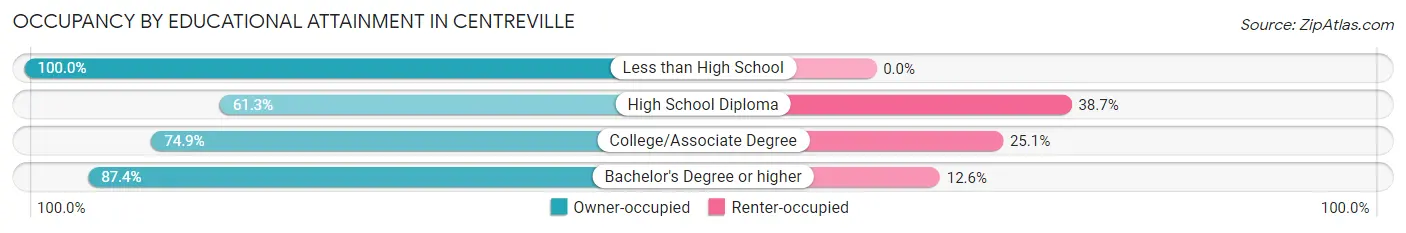
| Household Size | Owner-occupied | Renter-occupied |
| Less than High School | 64 (100.0%) | 0 (0.0%) |
| High School Diploma | 220 (61.3%) | 139 (38.7%) |
| College/Associate Degree | 393 (74.9%) | 132 (25.1%) |
| Bachelor's Degree or higher | 699 (87.4%) | 101 (12.6%) |
Occupancy by Age of Householder in Centreville
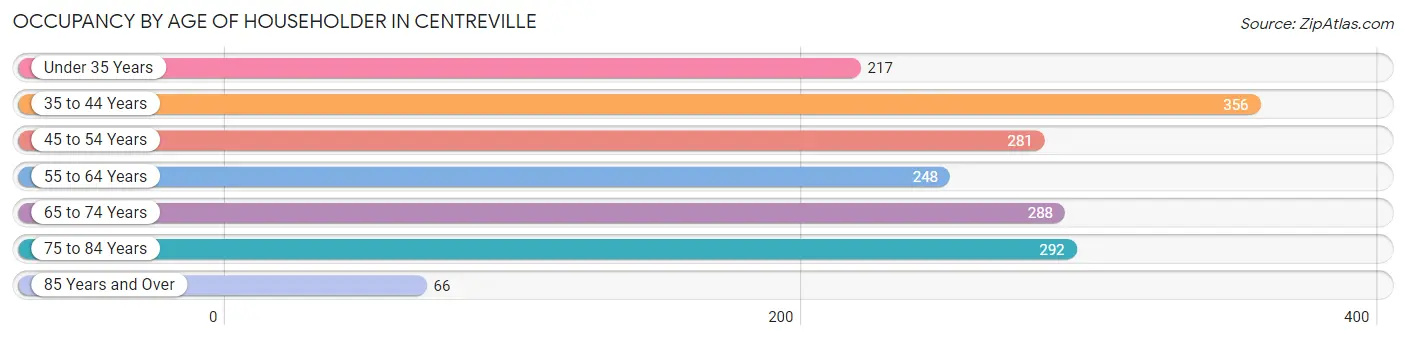
| Age Bracket | # Households | % Households |
| Under 35 Years | 217 | 12.4% |
| 35 to 44 Years | 356 | 20.4% |
| 45 to 54 Years | 281 | 16.1% |
| 55 to 64 Years | 248 | 14.2% |
| 65 to 74 Years | 288 | 16.5% |
| 75 to 84 Years | 292 | 16.7% |
| 85 Years and Over | 66 | 3.8% |
| Total | 1,748 | 100.0% |
Housing Finances in Centreville
Median Income by Occupancy in Centreville
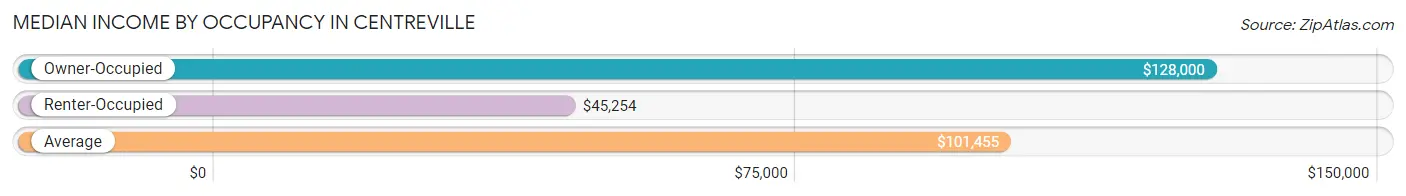
| Occupancy Type | # Households | Median Income |
| Owner-Occupied | 1,376 (78.7%) | $128,000 |
| Renter-Occupied | 372 (21.3%) | $45,254 |
| Average | 1,748 (100.0%) | $101,455 |
Occupancy by Householder Income Bracket in Centreville
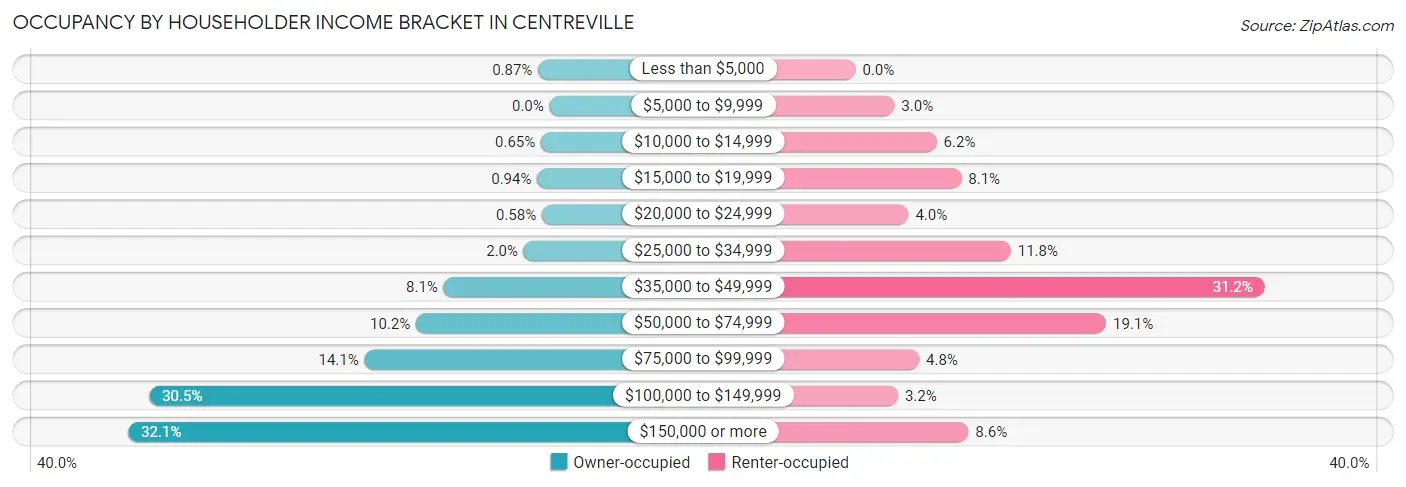
| Income Bracket | Owner-occupied | Renter-occupied |
| Less than $5,000 | 12 (0.9%) | 0 (0.0%) |
| $5,000 to $9,999 | 0 (0.0%) | 11 (3.0%) |
| $10,000 to $14,999 | 9 (0.6%) | 23 (6.2%) |
| $15,000 to $19,999 | 13 (0.9%) | 30 (8.1%) |
| $20,000 to $24,999 | 8 (0.6%) | 15 (4.0%) |
| $25,000 to $34,999 | 27 (2.0%) | 44 (11.8%) |
| $35,000 to $49,999 | 111 (8.1%) | 116 (31.2%) |
| $50,000 to $74,999 | 140 (10.2%) | 71 (19.1%) |
| $75,000 to $99,999 | 194 (14.1%) | 18 (4.8%) |
| $100,000 to $149,999 | 420 (30.5%) | 12 (3.2%) |
| $150,000 or more | 442 (32.1%) | 32 (8.6%) |
| Total | 1,376 (100.0%) | 372 (100.0%) |
Monthly Housing Cost Tiers in Centreville
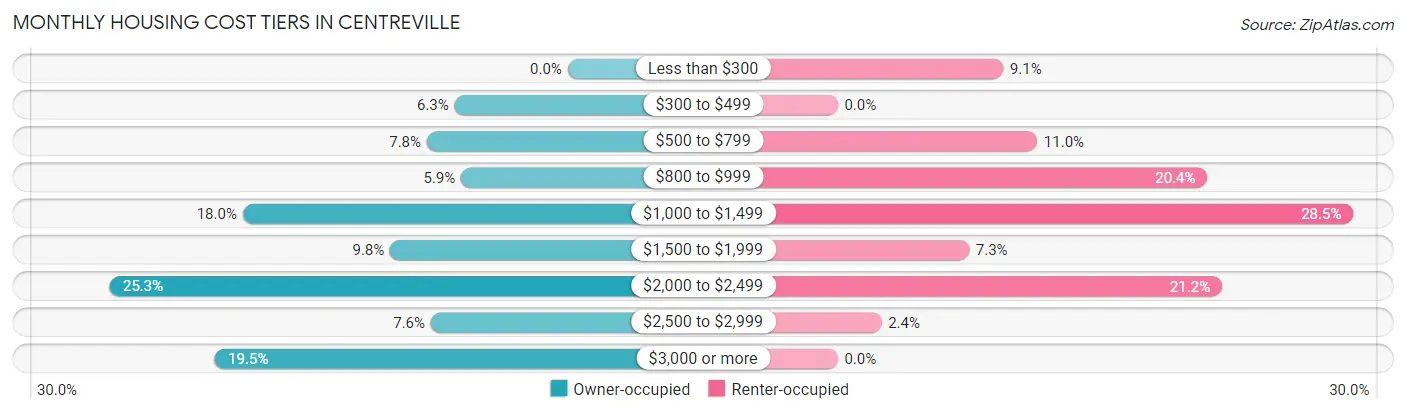
| Monthly Cost | Owner-occupied | Renter-occupied |
| Less than $300 | 0 (0.0%) | 34 (9.1%) |
| $300 to $499 | 86 (6.2%) | 0 (0.0%) |
| $500 to $799 | 107 (7.8%) | 41 (11.0%) |
| $800 to $999 | 81 (5.9%) | 76 (20.4%) |
| $1,000 to $1,499 | 247 (17.9%) | 106 (28.5%) |
| $1,500 to $1,999 | 135 (9.8%) | 27 (7.3%) |
| $2,000 to $2,499 | 348 (25.3%) | 79 (21.2%) |
| $2,500 to $2,999 | 104 (7.6%) | 9 (2.4%) |
| $3,000 or more | 268 (19.5%) | 0 (0.0%) |
| Total | 1,376 (100.0%) | 372 (100.0%) |
Physical Housing Characteristics in Centreville
Housing Structures in Centreville
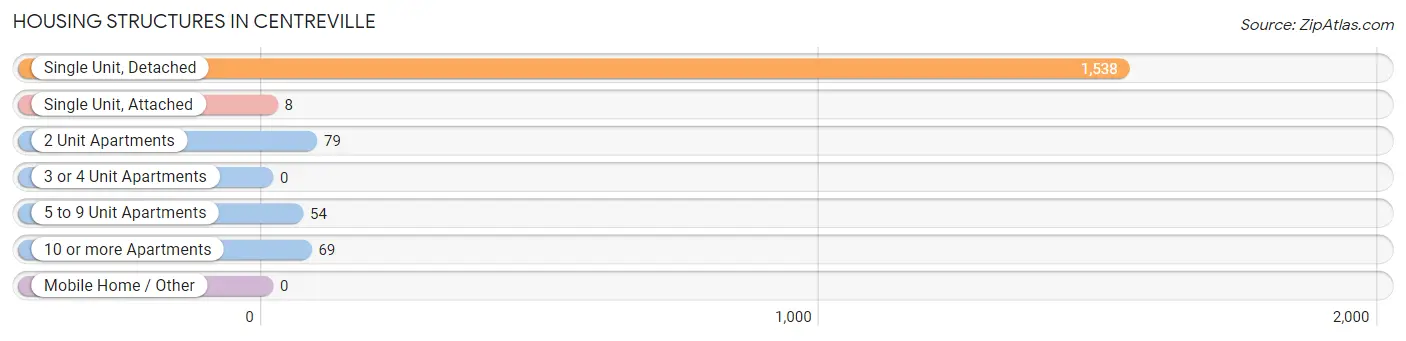
| Structure Type | # Housing Units | % Housing Units |
| Single Unit, Detached | 1,538 | 88.0% |
| Single Unit, Attached | 8 | 0.5% |
| 2 Unit Apartments | 79 | 4.5% |
| 3 or 4 Unit Apartments | 0 | 0.0% |
| 5 to 9 Unit Apartments | 54 | 3.1% |
| 10 or more Apartments | 69 | 4.0% |
| Mobile Home / Other | 0 | 0.0% |
| Total | 1,748 | 100.0% |
Housing Structures by Occupancy in Centreville
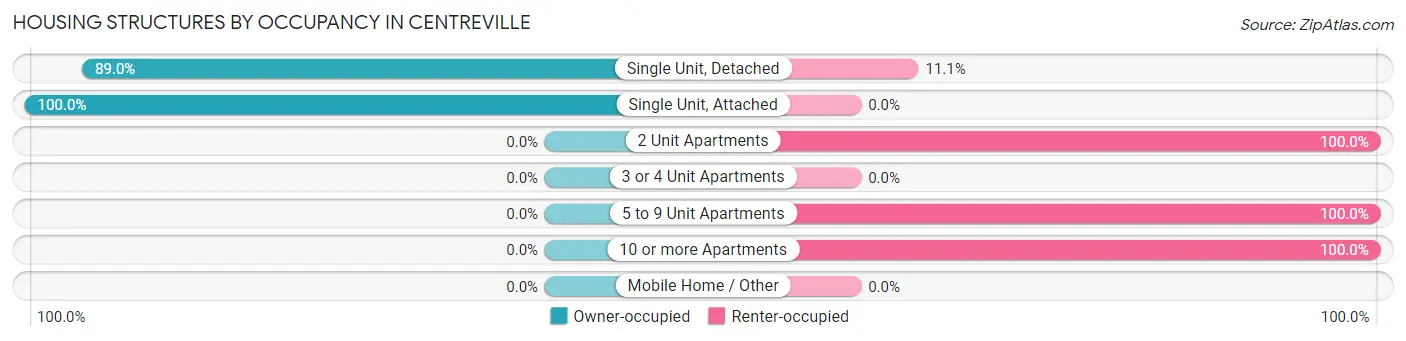
| Structure Type | Owner-occupied | Renter-occupied |
| Single Unit, Detached | 1,368 (88.9%) | 170 (11.1%) |
| Single Unit, Attached | 8 (100.0%) | 0 (0.0%) |
| 2 Unit Apartments | 0 (0.0%) | 79 (100.0%) |
| 3 or 4 Unit Apartments | 0 (0.0%) | 0 (0.0%) |
| 5 to 9 Unit Apartments | 0 (0.0%) | 54 (100.0%) |
| 10 or more Apartments | 0 (0.0%) | 69 (100.0%) |
| Mobile Home / Other | 0 (0.0%) | 0 (0.0%) |
| Total | 1,376 (78.7%) | 372 (21.3%) |
Housing Structures by Number of Rooms in Centreville
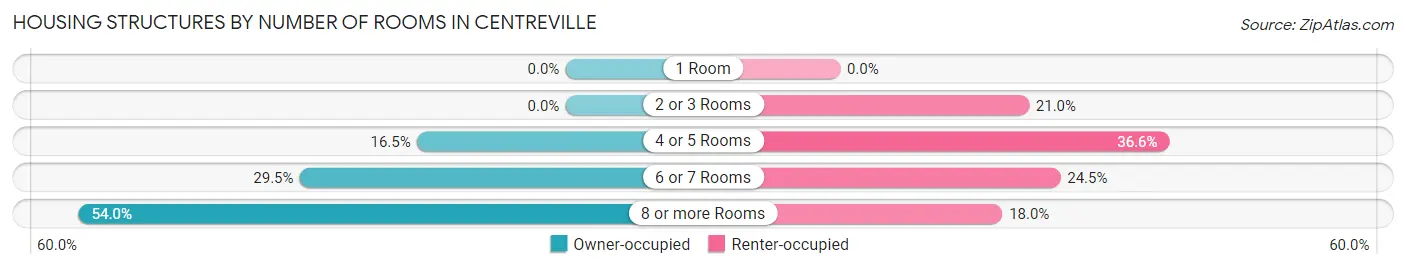
| Number of Rooms | Owner-occupied | Renter-occupied |
| 1 Room | 0 (0.0%) | 0 (0.0%) |
| 2 or 3 Rooms | 0 (0.0%) | 78 (21.0%) |
| 4 or 5 Rooms | 227 (16.5%) | 136 (36.6%) |
| 6 or 7 Rooms | 406 (29.5%) | 91 (24.5%) |
| 8 or more Rooms | 743 (54.0%) | 67 (18.0%) |
| Total | 1,376 (100.0%) | 372 (100.0%) |
Housing Structure by Heating Type in Centreville
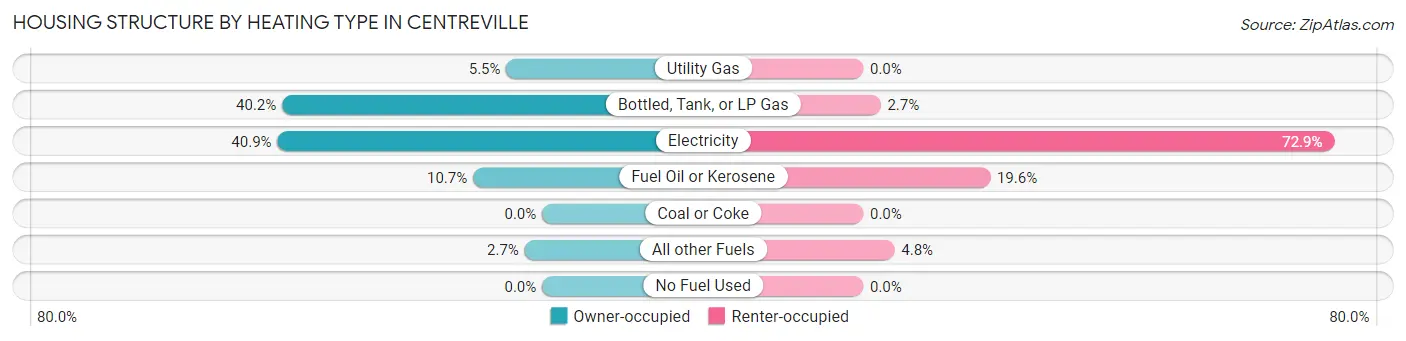
| Heating Type | Owner-occupied | Renter-occupied |
| Utility Gas | 76 (5.5%) | 0 (0.0%) |
| Bottled, Tank, or LP Gas | 553 (40.2%) | 10 (2.7%) |
| Electricity | 563 (40.9%) | 271 (72.9%) |
| Fuel Oil or Kerosene | 147 (10.7%) | 73 (19.6%) |
| Coal or Coke | 0 (0.0%) | 0 (0.0%) |
| All other Fuels | 37 (2.7%) | 18 (4.8%) |
| No Fuel Used | 0 (0.0%) | 0 (0.0%) |
| Total | 1,376 (100.0%) | 372 (100.0%) |
Household Vehicle Usage in Centreville
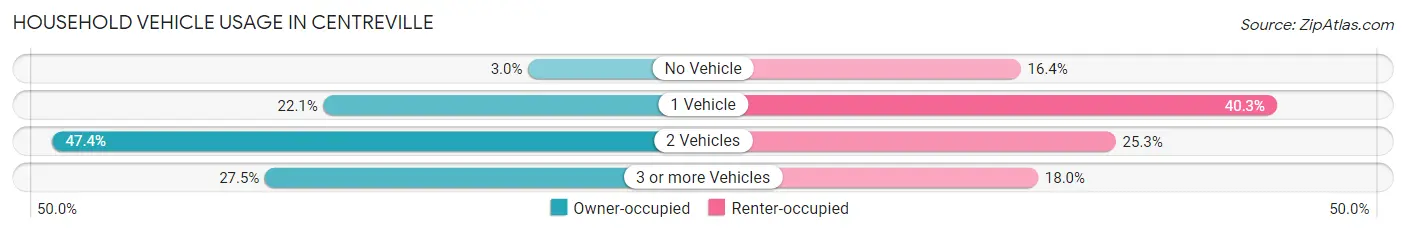
| Vehicles per Household | Owner-occupied | Renter-occupied |
| No Vehicle | 41 (3.0%) | 61 (16.4%) |
| 1 Vehicle | 304 (22.1%) | 150 (40.3%) |
| 2 Vehicles | 652 (47.4%) | 94 (25.3%) |
| 3 or more Vehicles | 379 (27.5%) | 67 (18.0%) |
| Total | 1,376 (100.0%) | 372 (100.0%) |
Real Estate & Mortgages in Centreville
Real Estate and Mortgage Overview in Centreville
| Characteristic | Without Mortgage | With Mortgage |
| Housing Units | 439 | 937 |
| Median Property Value | $420,700 | $411,300 |
| Median Household Income | $104,208 | $361 |
| Monthly Housing Costs | $906 | $268 |
| Real Estate Taxes | $4,646 | $29 |
Property Value by Mortgage Status in Centreville
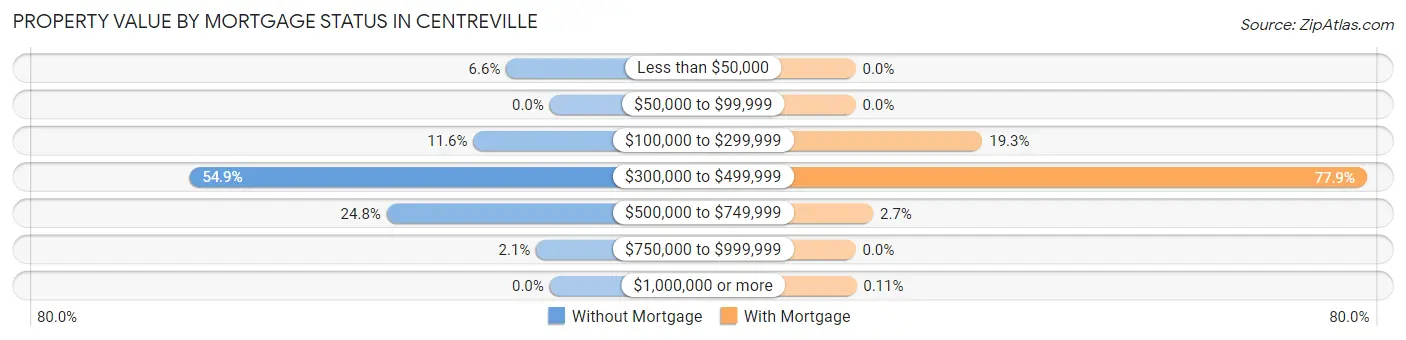
| Property Value | Without Mortgage | With Mortgage |
| Less than $50,000 | 29 (6.6%) | 0 (0.0%) |
| $50,000 to $99,999 | 0 (0.0%) | 0 (0.0%) |
| $100,000 to $299,999 | 51 (11.6%) | 181 (19.3%) |
| $300,000 to $499,999 | 241 (54.9%) | 730 (77.9%) |
| $500,000 to $749,999 | 109 (24.8%) | 25 (2.7%) |
| $750,000 to $999,999 | 9 (2.1%) | 0 (0.0%) |
| $1,000,000 or more | 0 (0.0%) | 1 (0.1%) |
| Total | 439 (100.0%) | 937 (100.0%) |
Household Income by Mortgage Status in Centreville
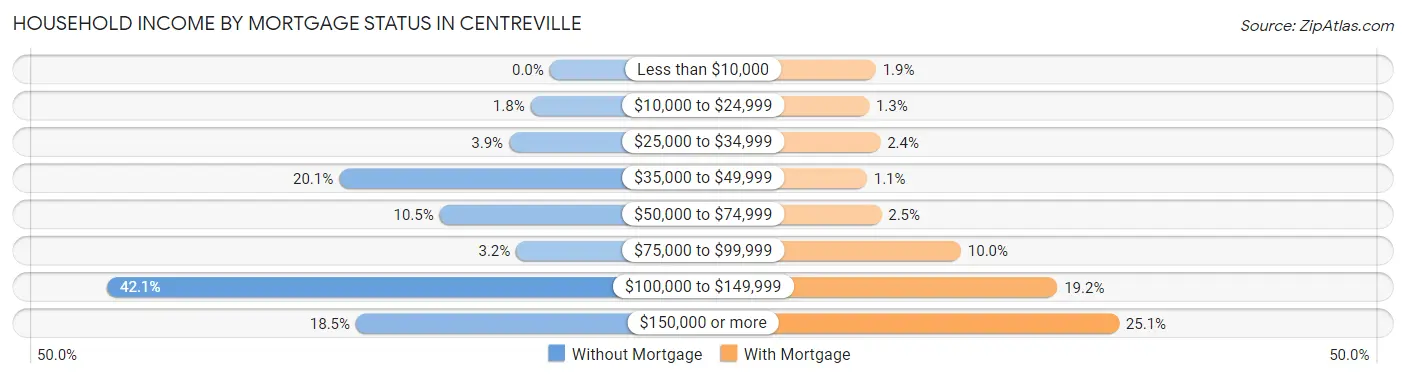
| Household Income | Without Mortgage | With Mortgage |
| Less than $10,000 | 0 (0.0%) | 18 (1.9%) |
| $10,000 to $24,999 | 8 (1.8%) | 12 (1.3%) |
| $25,000 to $34,999 | 17 (3.9%) | 22 (2.4%) |
| $35,000 to $49,999 | 88 (20.1%) | 10 (1.1%) |
| $50,000 to $74,999 | 46 (10.5%) | 23 (2.5%) |
| $75,000 to $99,999 | 14 (3.2%) | 94 (10.0%) |
| $100,000 to $149,999 | 185 (42.1%) | 180 (19.2%) |
| $150,000 or more | 81 (18.4%) | 235 (25.1%) |
| Total | 439 (100.0%) | 937 (100.0%) |
Property Value to Household Income Ratio in Centreville
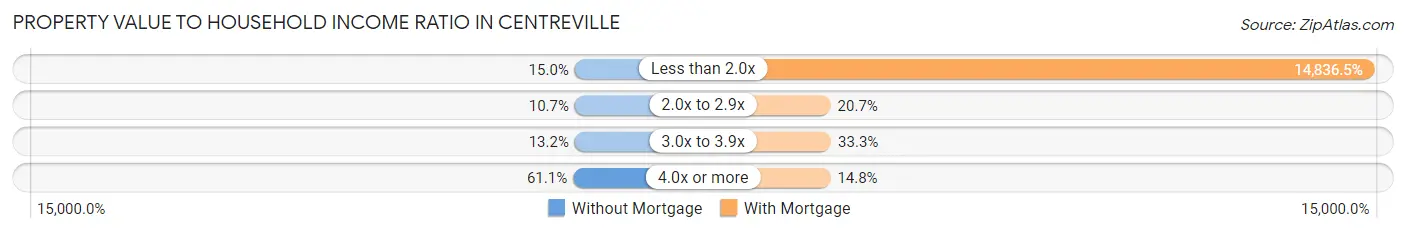
| Value-to-Income Ratio | Without Mortgage | With Mortgage |
| Less than 2.0x | 66 (15.0%) | 139,018 (14,836.5%) |
| 2.0x to 2.9x | 47 (10.7%) | 194 (20.7%) |
| 3.0x to 3.9x | 58 (13.2%) | 312 (33.3%) |
| 4.0x or more | 268 (61.1%) | 139 (14.8%) |
| Total | 439 (100.0%) | 937 (100.0%) |
Real Estate Taxes by Mortgage Status in Centreville
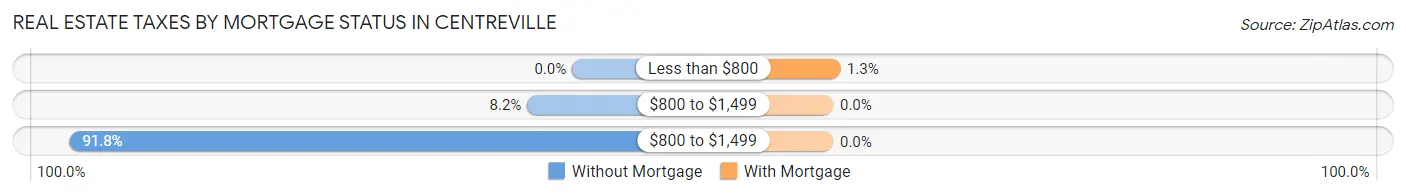
| Property Taxes | Without Mortgage | With Mortgage |
| Less than $800 | 0 (0.0%) | 12 (1.3%) |
| $800 to $1,499 | 36 (8.2%) | 0 (0.0%) |
| $800 to $1,499 | 403 (91.8%) | 0 (0.0%) |
| Total | 439 (100.0%) | 937 (100.0%) |
Health & Disability in Centreville
Health Insurance Coverage by Age in Centreville
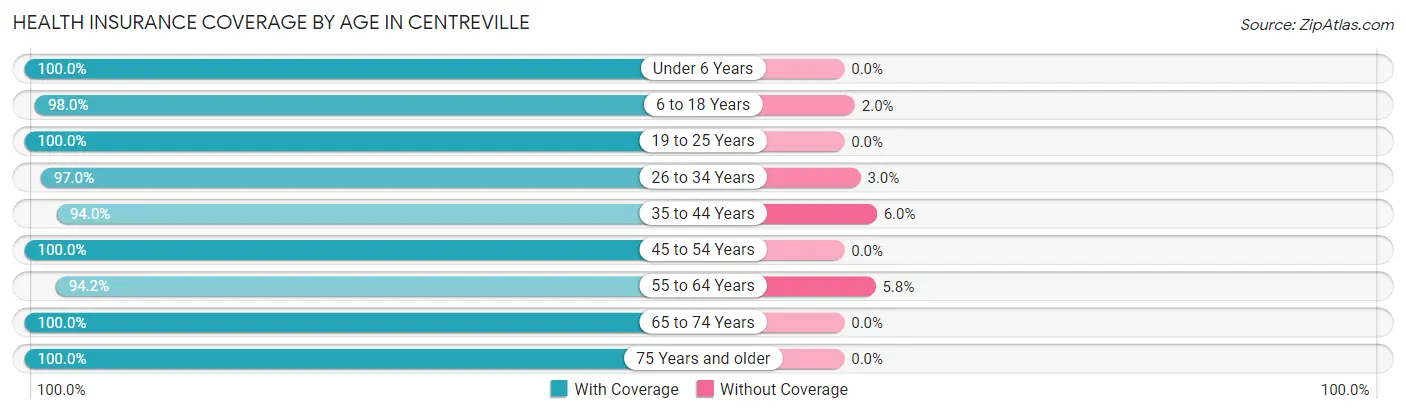
| Age Bracket | With Coverage | Without Coverage |
| Under 6 Years | 348 (100.0%) | 0 (0.0%) |
| 6 to 18 Years | 845 (98.0%) | 17 (2.0%) |
| 19 to 25 Years | 284 (100.0%) | 0 (0.0%) |
| 26 to 34 Years | 320 (97.0%) | 10 (3.0%) |
| 35 to 44 Years | 824 (94.0%) | 53 (6.0%) |
| 45 to 54 Years | 467 (100.0%) | 0 (0.0%) |
| 55 to 64 Years | 356 (94.2%) | 22 (5.8%) |
| 65 to 74 Years | 417 (100.0%) | 0 (0.0%) |
| 75 Years and older | 560 (100.0%) | 0 (0.0%) |
| Total | 4,421 (97.7%) | 102 (2.3%) |
Health Insurance Coverage by Citizenship Status in Centreville

| Citizenship Status | With Coverage | Without Coverage |
| Native Born | 348 (100.0%) | 0 (0.0%) |
| Foreign Born, Citizen | 845 (98.0%) | 17 (2.0%) |
| Foreign Born, not a Citizen | 284 (100.0%) | 0 (0.0%) |
Health Insurance Coverage by Household Income in Centreville
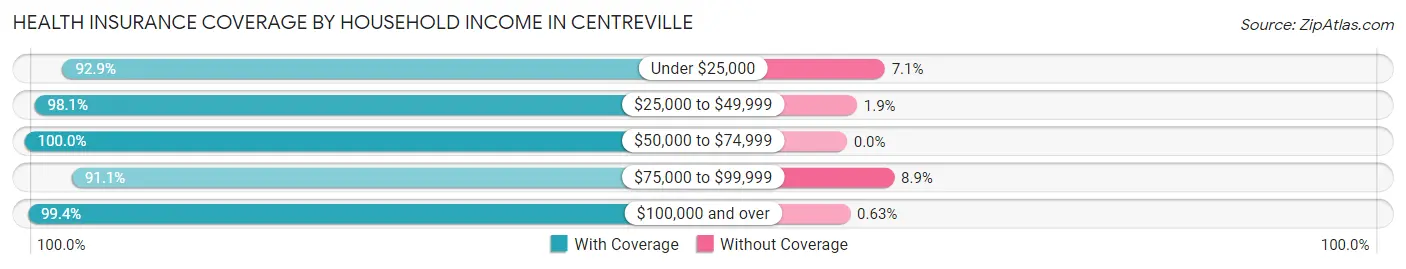
| Household Income | With Coverage | Without Coverage |
| Under $25,000 | 157 (92.9%) | 12 (7.1%) |
| $25,000 to $49,999 | 522 (98.1%) | 10 (1.9%) |
| $50,000 to $74,999 | 429 (100.0%) | 0 (0.0%) |
| $75,000 to $99,999 | 647 (91.1%) | 63 (8.9%) |
| $100,000 and over | 2,661 (99.4%) | 17 (0.6%) |
Public vs Private Health Insurance Coverage by Age in Centreville
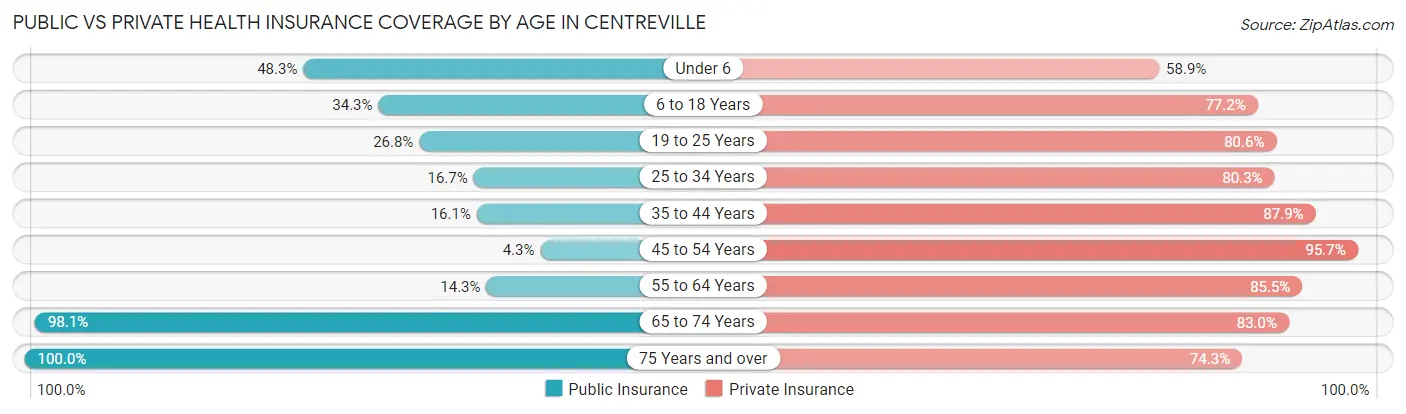
| Age Bracket | Public Insurance | Private Insurance |
| Under 6 | 168 (48.3%) | 205 (58.9%) |
| 6 to 18 Years | 296 (34.3%) | 665 (77.1%) |
| 19 to 25 Years | 76 (26.8%) | 229 (80.6%) |
| 25 to 34 Years | 55 (16.7%) | 265 (80.3%) |
| 35 to 44 Years | 141 (16.1%) | 771 (87.9%) |
| 45 to 54 Years | 20 (4.3%) | 447 (95.7%) |
| 55 to 64 Years | 54 (14.3%) | 323 (85.5%) |
| 65 to 74 Years | 409 (98.1%) | 346 (83.0%) |
| 75 Years and over | 560 (100.0%) | 416 (74.3%) |
| Total | 1,779 (39.3%) | 3,667 (81.1%) |
Disability Status by Sex by Age in Centreville
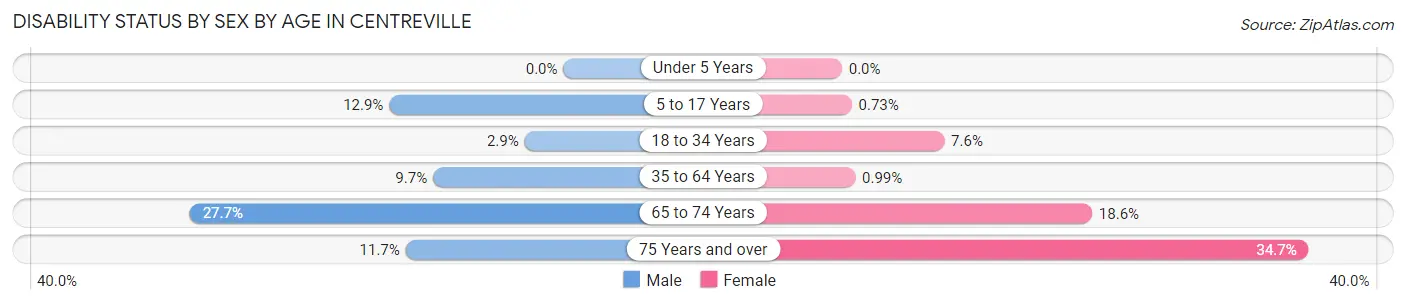
| Age Bracket | Male | Female |
| Under 5 Years | 0 (0.0%) | 0 (0.0%) |
| 5 to 17 Years | 45 (12.9%) | 4 (0.7%) |
| 18 to 34 Years | 10 (2.9%) | 26 (7.6%) |
| 35 to 64 Years | 79 (9.7%) | 9 (1.0%) |
| 65 to 74 Years | 38 (27.7%) | 52 (18.6%) |
| 75 Years and over | 24 (11.7%) | 123 (34.6%) |
Disability Class by Sex by Age in Centreville
Disability Class: Hearing Difficulty
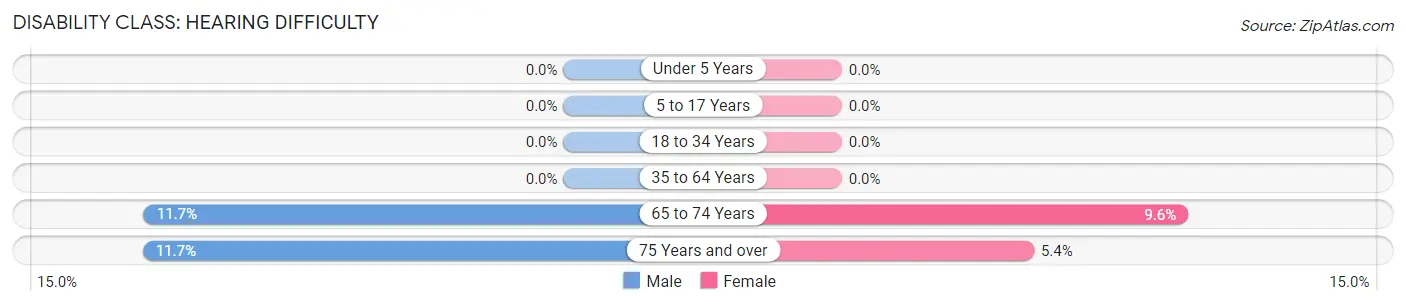
| Age Bracket | Male | Female |
| Under 5 Years | 0 (0.0%) | 0 (0.0%) |
| 5 to 17 Years | 0 (0.0%) | 0 (0.0%) |
| 18 to 34 Years | 0 (0.0%) | 0 (0.0%) |
| 35 to 64 Years | 0 (0.0%) | 0 (0.0%) |
| 65 to 74 Years | 16 (11.7%) | 27 (9.6%) |
| 75 Years and over | 24 (11.7%) | 19 (5.3%) |
Disability Class: Vision Difficulty
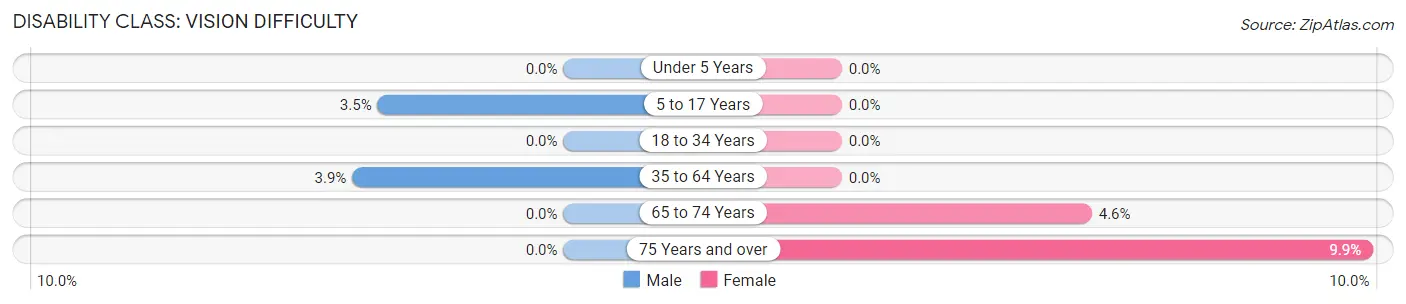
| Age Bracket | Male | Female |
| Under 5 Years | 0 (0.0%) | 0 (0.0%) |
| 5 to 17 Years | 12 (3.5%) | 0 (0.0%) |
| 18 to 34 Years | 0 (0.0%) | 0 (0.0%) |
| 35 to 64 Years | 32 (3.9%) | 0 (0.0%) |
| 65 to 74 Years | 0 (0.0%) | 13 (4.6%) |
| 75 Years and over | 0 (0.0%) | 35 (9.9%) |
Disability Class: Cognitive Difficulty
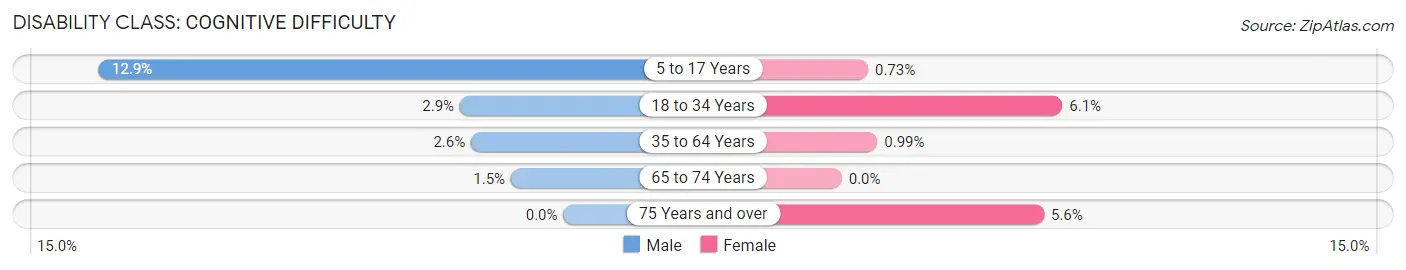
| Age Bracket | Male | Female |
| 5 to 17 Years | 45 (12.9%) | 4 (0.7%) |
| 18 to 34 Years | 10 (2.9%) | 21 (6.1%) |
| 35 to 64 Years | 21 (2.6%) | 9 (1.0%) |
| 65 to 74 Years | 2 (1.5%) | 0 (0.0%) |
| 75 Years and over | 0 (0.0%) | 20 (5.6%) |
Disability Class: Ambulatory Difficulty
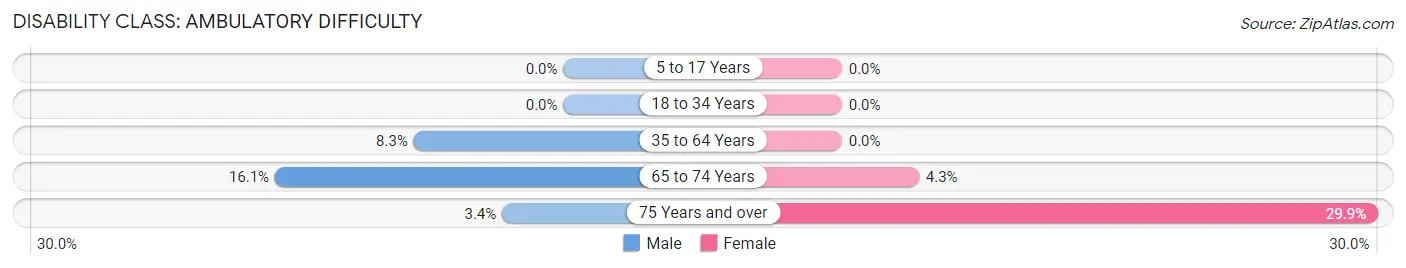
| Age Bracket | Male | Female |
| 5 to 17 Years | 0 (0.0%) | 0 (0.0%) |
| 18 to 34 Years | 0 (0.0%) | 0 (0.0%) |
| 35 to 64 Years | 68 (8.3%) | 0 (0.0%) |
| 65 to 74 Years | 22 (16.1%) | 12 (4.3%) |
| 75 Years and over | 7 (3.4%) | 106 (29.9%) |
Disability Class: Self-Care Difficulty
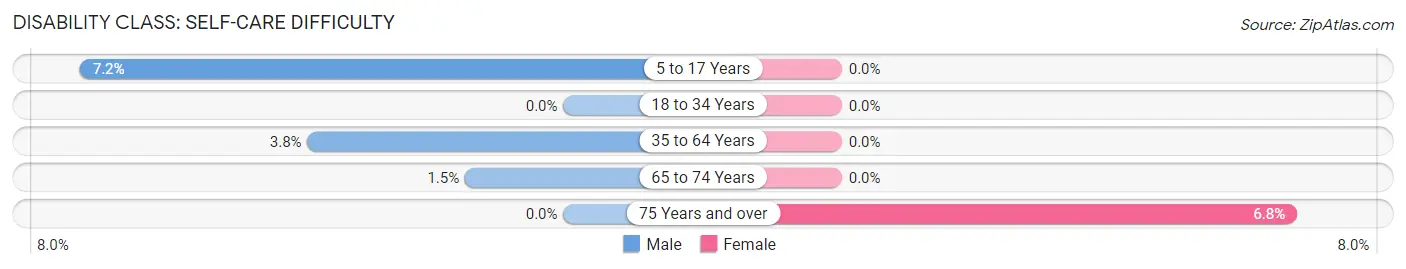
| Age Bracket | Male | Female |
| 5 to 17 Years | 25 (7.2%) | 0 (0.0%) |
| 18 to 34 Years | 0 (0.0%) | 0 (0.0%) |
| 35 to 64 Years | 31 (3.8%) | 0 (0.0%) |
| 65 to 74 Years | 2 (1.5%) | 0 (0.0%) |
| 75 Years and over | 0 (0.0%) | 24 (6.8%) |
Technology Access in Centreville
Computing Device Access in Centreville
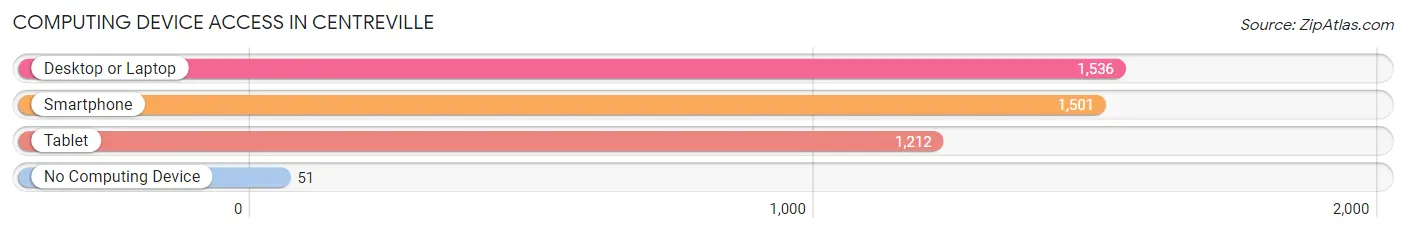
| Device Type | # Households | % Households |
| Desktop or Laptop | 1,536 | 87.9% |
| Smartphone | 1,501 | 85.9% |
| Tablet | 1,212 | 69.3% |
| No Computing Device | 51 | 2.9% |
| Total | 1,748 | 100.0% |
Internet Access in Centreville
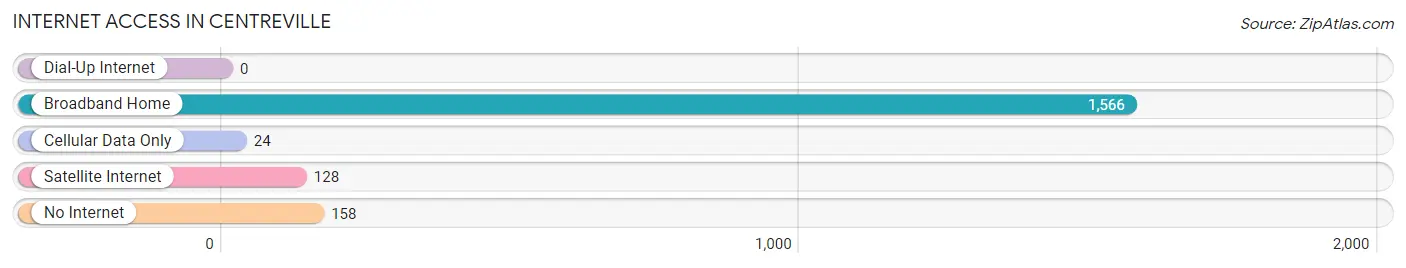
| Internet Type | # Households | % Households |
| Dial-Up Internet | 0 | 0.0% |
| Broadband Home | 1,566 | 89.6% |
| Cellular Data Only | 24 | 1.4% |
| Satellite Internet | 128 | 7.3% |
| No Internet | 158 | 9.0% |
| Total | 1,748 | 100.0% |
Centreville Summary
Centreville is a census-designated place (CDP) located in Queen Anne’s County, Maryland, United States. It is situated on the Eastern Shore of the Chesapeake Bay, approximately 25 miles south of Annapolis and 40 miles east of Washington, D.C. The population of Centreville was 5,945 at the 2010 census.
History
Centreville was founded in 1794 by a group of Quakers from Pennsylvania. The town was named after the central location of the Quaker meeting house, which was located at the intersection of what is now known as Main Street and Commerce Street. The town was incorporated in 1808 and was the county seat of Queen Anne’s County until 1872, when the county seat was moved to Centreville.
Geography
Centreville is located at 39°2′17″N 76°7′17″W (39.038, -76.121). According to the United States Census Bureau, the CDP has a total area of 4.2 square miles (10.8 km2), of which 4.1 square miles (10.6 km2) is land and 0.1 square miles (0.2 km2) (2.45%) is water.
Economy
Centreville’s economy is largely based on agriculture and tourism. The town is home to several farms, including the historic Centreville Farm, which has been in operation since the late 1700s. The town is also home to several wineries, including the Centreville Winery, which produces award-winning wines.
Tourism is a major part of Centreville’s economy. The town is home to several historic sites, including the Centreville Historic District, which is listed on the National Register of Historic Places. The town also hosts several annual festivals, including the Centreville Day Festival, which is held each year in June.
Demographics
As of the census of 2010, there were 5,945 people, 2,093 households, and 1,541 families residing in the CDP. The population density was 1,450.2 people per square mile (560.7/km2). There were 2,093 housing units at an average density of 511.3 per square mile (197.3/km2). The racial makeup of the CDP was 87.2% White, 8.2% African American, 0.3% Native American, 1.2% Asian, 0.1% Pacific Islander, 1.2% from other races, and 1.9% from two or more races. Hispanic or Latino of any race were 3.3% of the population.
There were 2,093 households, out of which 37.2% had children under the age of 18 living with them, 57.2% were married couples living together, 11.7% had a female householder with no husband present, and 26.2% were non-families. 21.2% of all households were made up of individuals, and 8.2% had someone living alone who was 65 years of age or older. The average household size was 2.83 and the average family size was 3.30.
In the CDP, the population was spread out, with 28.2% under the age of 18, 7.2% from 18 to 24, 30.2% from 25 to 44, 24.2% from 45 to 64, and 10.2% who were 65 years of age or older. The median age was 36 years. For every 100 females, there were 97.2 males. For every 100 females age 18 and over, there were 94.2 males.
The median income for a household in the CDP was $63,958, and the median income for a family was $71,917. Males had a median income of $45,938 versus $35,938 for females. The per capita income for the CDP was $25,917. About 4.2% of families and 5.7% of the population were below the poverty line, including 6.2% of those under age 18 and 5.2% of those age 65 or over.
Common Questions
What is Per Capita Income in Centreville?
Per Capita income in Centreville is $43,741.
What is the Median Family Income in Centreville?
Median Family Income in Centreville is $135,448.
What is the Median Household income in Centreville?
Median Household Income in Centreville is $101,455.
What is Income or Wage Gap in Centreville?
Income or Wage Gap in Centreville is 43.1%.
Women in Centreville earn 56.9 cents for every dollar earned by a man.
What is Inequality or Gini Index in Centreville?
Inequality or Gini Index in Centreville is 0.36.
What is the Total Population of Centreville?
Total Population of Centreville is 4,700.
What is the Total Male Population of Centreville?
Total Male Population of Centreville is 2,075.
What is the Total Female Population of Centreville?
Total Female Population of Centreville is 2,625.
What is the Ratio of Males per 100 Females in Centreville?
There are 79.05 Males per 100 Females in Centreville.
What is the Ratio of Females per 100 Males in Centreville?
There are 126.51 Females per 100 Males in Centreville.
What is the Median Population Age in Centreville?
Median Population Age in Centreville is 40.4 Years.
What is the Average Family Size in Centreville
Average Family Size in Centreville is 3.1 People.
What is the Average Household Size in Centreville
Average Household Size in Centreville is 2.6 People.
How Large is the Labor Force in Centreville?
There are 2,318 People in the Labor Forcein in Centreville.
What is the Percentage of People in the Labor Force in Centreville?
64.4% of People are in the Labor Force in Centreville.
What is the Unemployment Rate in Centreville?
Unemployment Rate in Centreville is 2.3%.