Funkstown, MD Map & Demographics
Funkstown Map
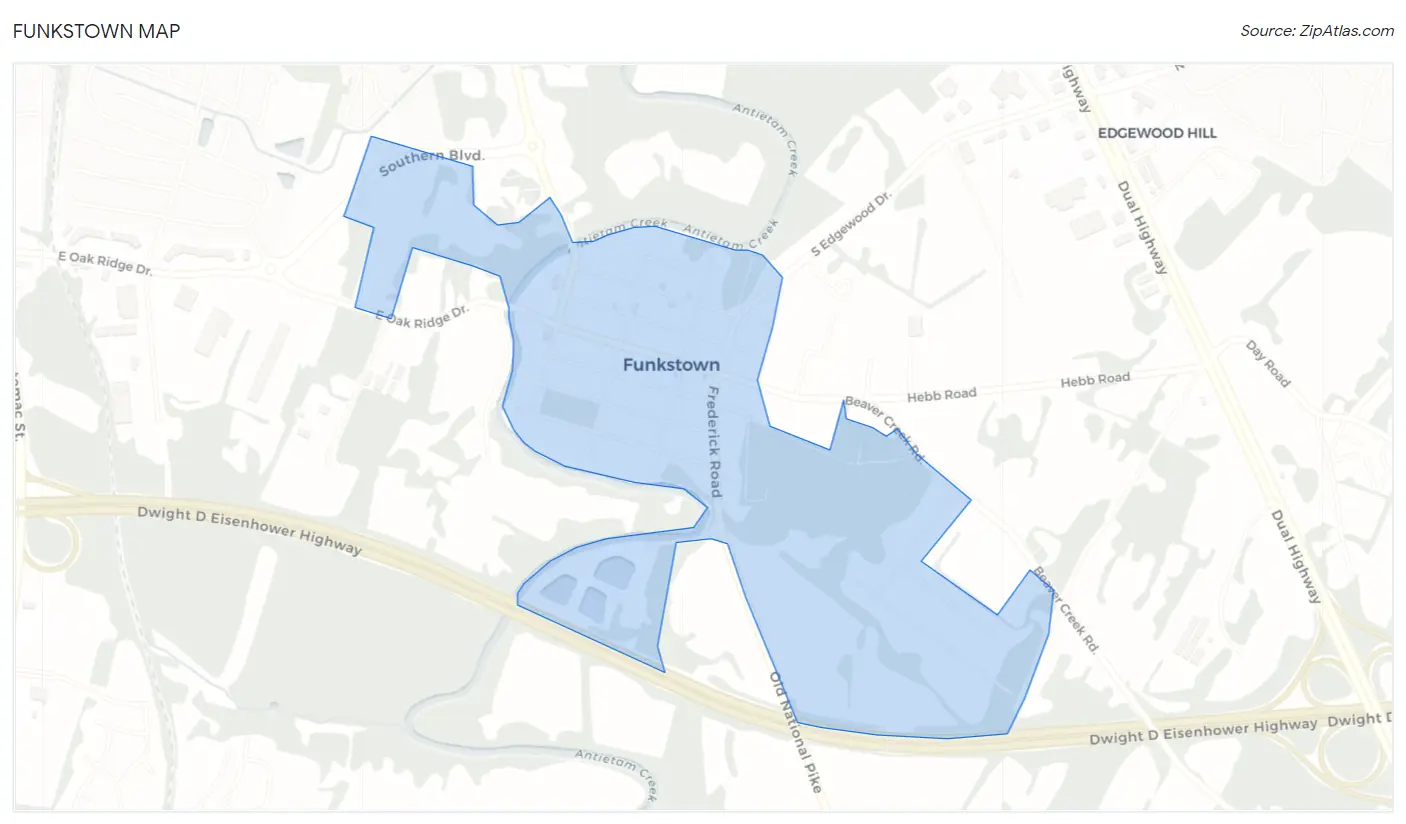
Funkstown Overview
$38,458
PER CAPITA INCOME
$88,973
AVG FAMILY INCOME
$52,794
AVG HOUSEHOLD INCOME
30.4%
WAGE / INCOME GAP [ % ]
69.6¢/ $1
WAGE / INCOME GAP [ $ ]
0.40
INEQUALITY / GINI INDEX
861
TOTAL POPULATION
433
MALE POPULATION
428
FEMALE POPULATION
101.17
MALES / 100 FEMALES
98.85
FEMALES / 100 MALES
59.1
MEDIAN AGE
2.3
AVG FAMILY SIZE
1.8
AVG HOUSEHOLD SIZE
449
LABOR FORCE [ PEOPLE ]
53.9%
PERCENT IN LABOR FORCE
4.2%
UNEMPLOYMENT RATE
Funkstown Zip Codes
Funkstown Area Codes
Income in Funkstown
Income Overview in Funkstown
Per Capita Income in Funkstown is $38,458, while median incomes of families and households are $88,973 and $52,794 respectively.
| Characteristic | Number | Measure |
| Per Capita Income | 861 | $38,458 |
| Median Family Income | 263 | $88,973 |
| Mean Family Income | 263 | $94,023 |
| Median Household Income | 474 | $52,794 |
| Mean Household Income | 474 | $68,250 |
| Income Deficit | 263 | $0 |
| Wage / Income Gap (%) | 861 | 30.41% |
| Wage / Income Gap ($) | 861 | 69.59¢ per $1 |
| Gini / Inequality Index | 861 | 0.40 |
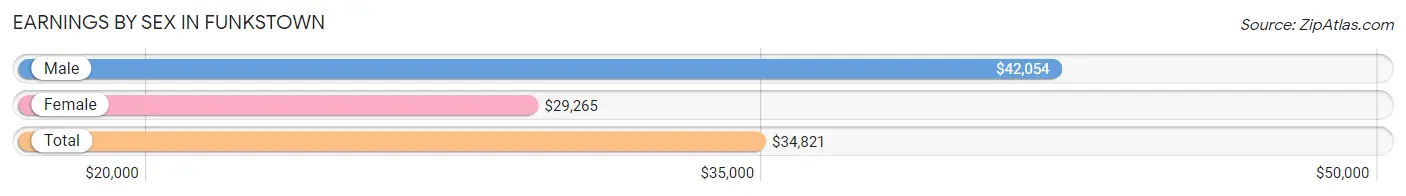
Earnings by Sex in Funkstown
Average Earnings in Funkstown are $34,821, $42,054 for men and $29,265 for women, a difference of 30.4%.
| Sex | Number | Average Earnings |
| Male | 277 (55.1%) | $42,054 |
| Female | 226 (44.9%) | $29,265 |
| Total | 503 (100.0%) | $34,821 |
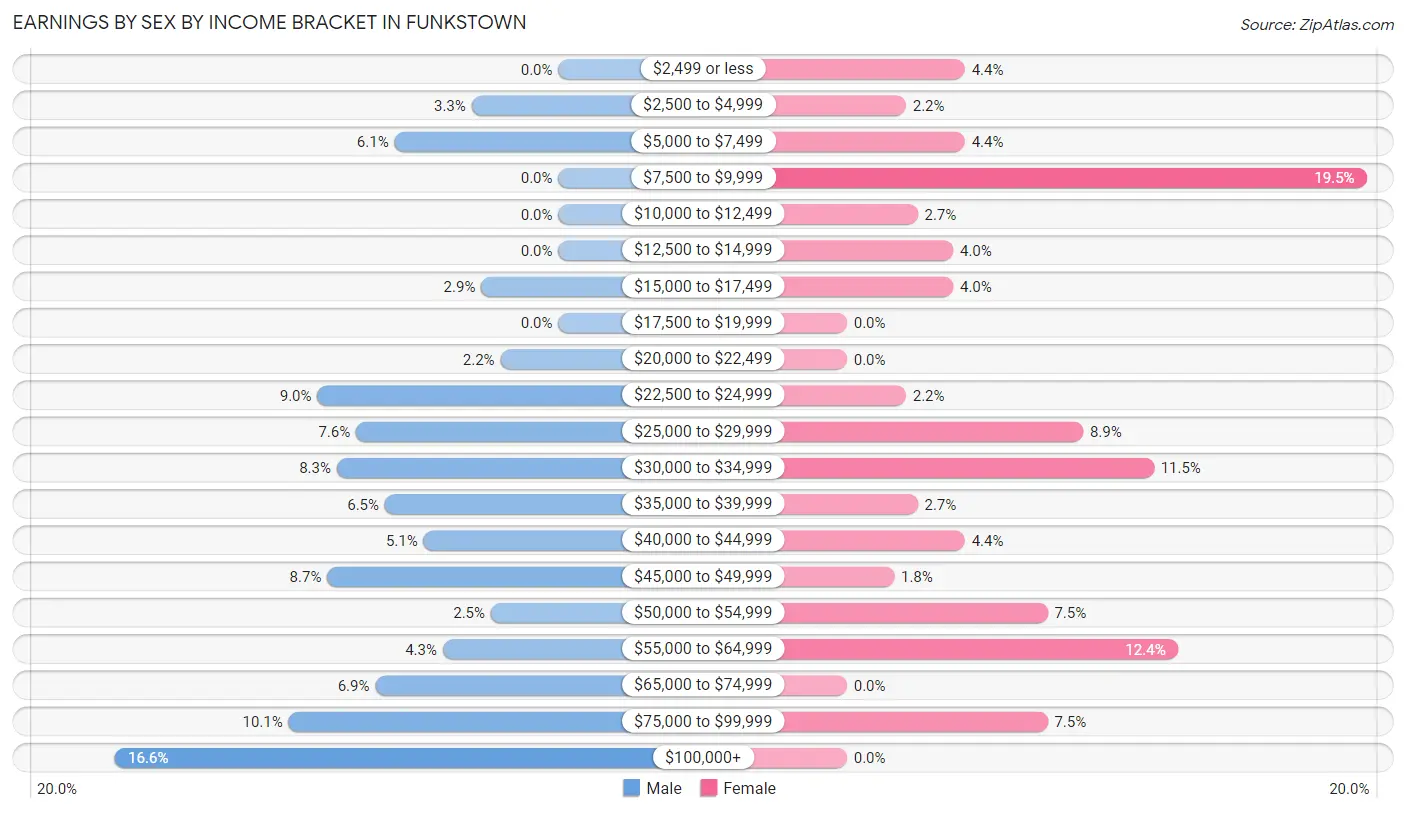
Earnings by Sex by Income Bracket in Funkstown
The most common earnings brackets in Funkstown are $100,000+ for men (46 | 16.6%) and $7,500 to $9,999 for women (44 | 19.5%).
| Income | Male | Female |
| $2,499 or less | 0 (0.0%) | 10 (4.4%) |
| $2,500 to $4,999 | 9 (3.3%) | 5 (2.2%) |
| $5,000 to $7,499 | 17 (6.1%) | 10 (4.4%) |
| $7,500 to $9,999 | 0 (0.0%) | 44 (19.5%) |
| $10,000 to $12,499 | 0 (0.0%) | 6 (2.6%) |
| $12,500 to $14,999 | 0 (0.0%) | 9 (4.0%) |
| $15,000 to $17,499 | 8 (2.9%) | 9 (4.0%) |
| $17,500 to $19,999 | 0 (0.0%) | 0 (0.0%) |
| $20,000 to $22,499 | 6 (2.2%) | 0 (0.0%) |
| $22,500 to $24,999 | 25 (9.0%) | 5 (2.2%) |
| $25,000 to $29,999 | 21 (7.6%) | 20 (8.8%) |
| $30,000 to $34,999 | 23 (8.3%) | 26 (11.5%) |
| $35,000 to $39,999 | 18 (6.5%) | 6 (2.6%) |
| $40,000 to $44,999 | 14 (5.1%) | 10 (4.4%) |
| $45,000 to $49,999 | 24 (8.7%) | 4 (1.8%) |
| $50,000 to $54,999 | 7 (2.5%) | 17 (7.5%) |
| $55,000 to $64,999 | 12 (4.3%) | 28 (12.4%) |
| $65,000 to $74,999 | 19 (6.9%) | 0 (0.0%) |
| $75,000 to $99,999 | 28 (10.1%) | 17 (7.5%) |
| $100,000+ | 46 (16.6%) | 0 (0.0%) |
| Total | 277 (100.0%) | 226 (100.0%) |
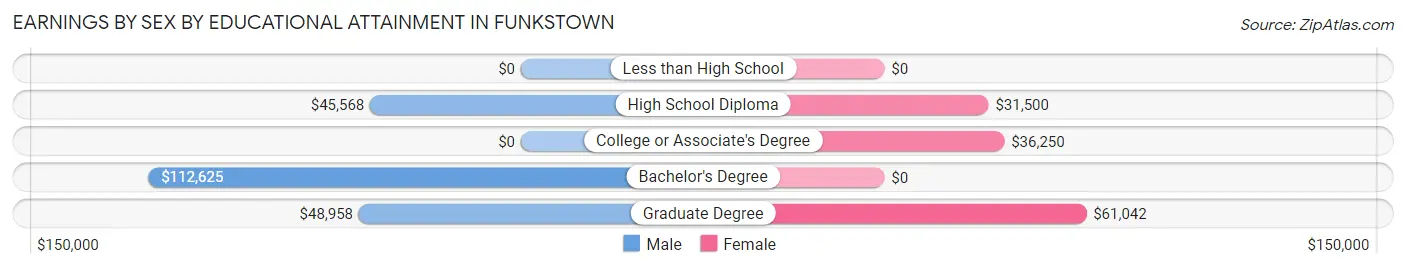
Earnings by Sex by Educational Attainment in Funkstown
Average earnings in Funkstown are $47,500 for men and $32,250 for women, a difference of 32.1%. Men with an educational attainment of bachelor's degree enjoy the highest average annual earnings of $112,625, while those with high school diploma education earn the least with $45,568. Women with an educational attainment of graduate degree earn the most with the average annual earnings of $61,042, while those with high school diploma education have the smallest earnings of $31,500.
| Educational Attainment | Male Income | Female Income |
| Less than High School | - | - |
| High School Diploma | $45,568 | $31,500 |
| College or Associate's Degree | - | - |
| Bachelor's Degree | $112,625 | $0 |
| Graduate Degree | $48,958 | $61,042 |
| Total | $47,500 | $32,250 |
Family Income in Funkstown
Family Income Brackets in Funkstown
According to the Funkstown family income data, there are 77 families falling into the $100,000 to $149,999 income range, which is the most common income bracket and makes up 29.3% of all families.
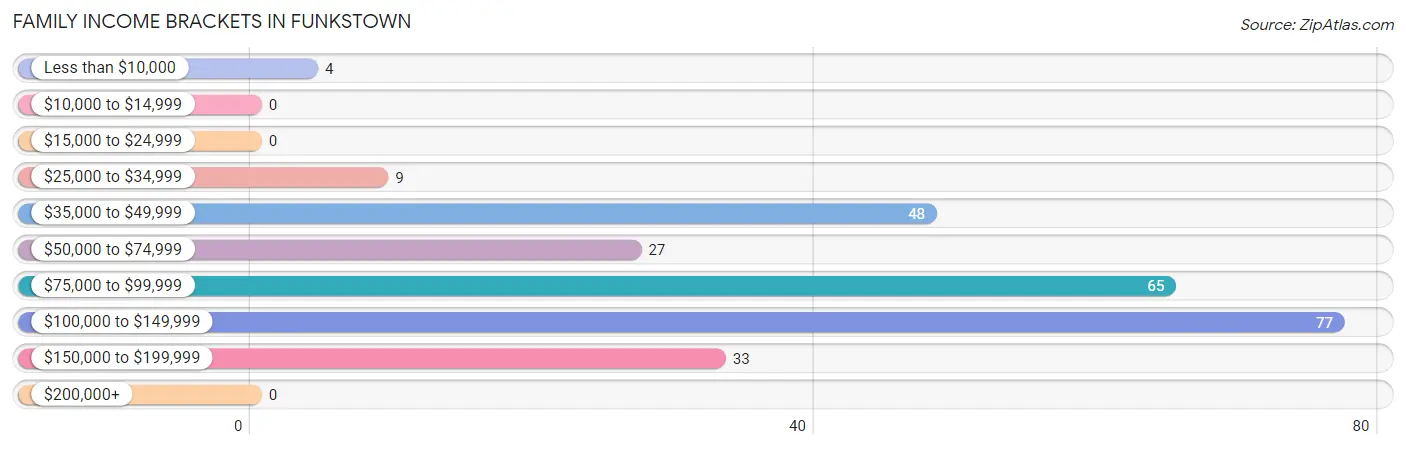
| Income Bracket | # Families | % Families |
| Less than $10,000 | 4 | 1.5% |
| $10,000 to $14,999 | 0 | 0.0% |
| $15,000 to $24,999 | 0 | 0.0% |
| $25,000 to $34,999 | 9 | 3.4% |
| $35,000 to $49,999 | 48 | 18.3% |
| $50,000 to $74,999 | 27 | 10.3% |
| $75,000 to $99,999 | 65 | 24.7% |
| $100,000 to $149,999 | 77 | 29.3% |
| $150,000 to $199,999 | 33 | 12.5% |
| $200,000+ | 0 | 0.0% |
Family Income by Famaliy Size in Funkstown
3-person families (58 | 22.1%) account for the highest median family income in Funkstown with $118,043 per family, while 2-person families (190 | 72.2%) have the highest median income of $44,107 per family member.
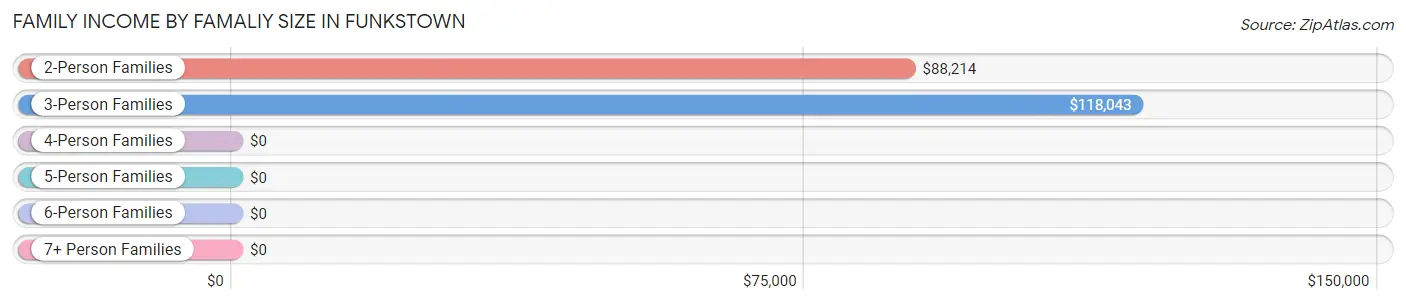
| Income Bracket | # Families | Median Income |
| 2-Person Families | 190 (72.2%) | $88,214 |
| 3-Person Families | 58 (22.1%) | $118,043 |
| 4-Person Families | 15 (5.7%) | $0 |
| 5-Person Families | 0 (0.0%) | $0 |
| 6-Person Families | 0 (0.0%) | $0 |
| 7+ Person Families | 0 (0.0%) | $0 |
| Total | 263 (100.0%) | $88,973 |
Family Income by Number of Earners in Funkstown
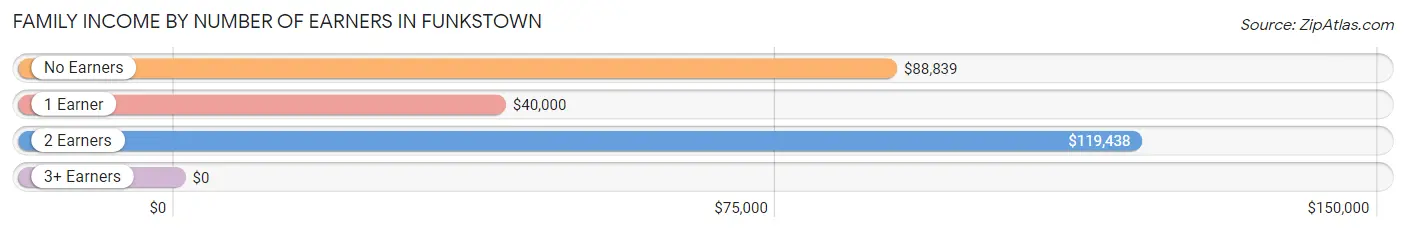
| Number of Earners | # Families | Median Income |
| No Earners | 46 (17.5%) | $88,839 |
| 1 Earner | 82 (31.2%) | $40,000 |
| 2 Earners | 121 (46.0%) | $119,438 |
| 3+ Earners | 14 (5.3%) | $0 |
| Total | 263 (100.0%) | $88,973 |
Household Income in Funkstown
Household Income Brackets in Funkstown
With 91 households falling in the category, the $35,000 to $49,999 income range is the most frequent in Funkstown, accounting for 19.2% of all households. In contrast, only 10 households (2.1%) fall into the $200,000+ income bracket, making it the least populous group.
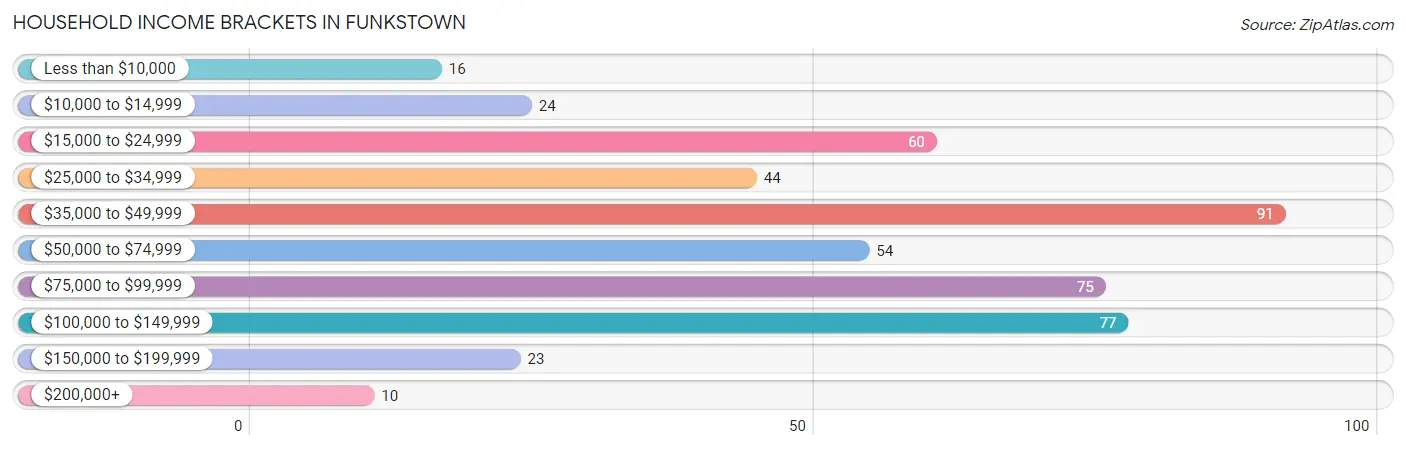
| Income Bracket | # Households | % Households |
| Less than $10,000 | 16 | 3.4% |
| $10,000 to $14,999 | 24 | 5.1% |
| $15,000 to $24,999 | 60 | 12.7% |
| $25,000 to $34,999 | 44 | 9.3% |
| $35,000 to $49,999 | 91 | 19.2% |
| $50,000 to $74,999 | 54 | 11.4% |
| $75,000 to $99,999 | 75 | 15.8% |
| $100,000 to $149,999 | 77 | 16.2% |
| $150,000 to $199,999 | 23 | 4.9% |
| $200,000+ | 10 | 2.1% |
Household Income by Householder Age in Funkstown
The median household income in Funkstown is $52,794, with the highest median household income of $60,625 found in the 45 to 64 years age bracket for the primary householder. A total of 225 households (47.5%) fall into this category. Meanwhile, the 15 to 24 years age bracket for the primary householder has the lowest median household income of $0, with 18 households (3.8%) in this group.
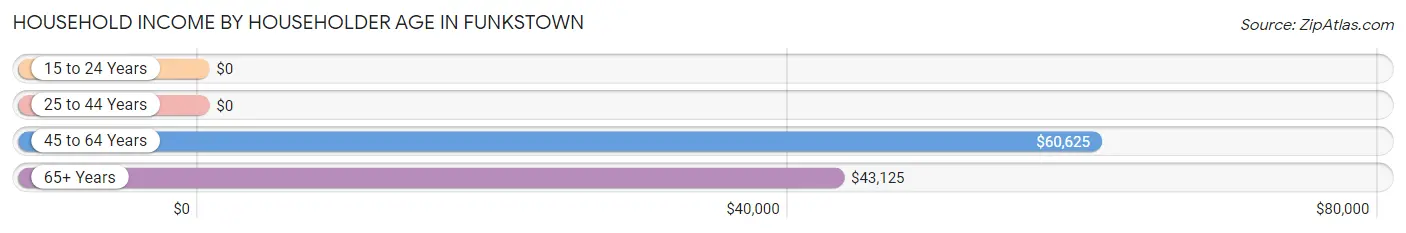
| Income Bracket | # Households | Median Income |
| 15 to 24 Years | 18 (3.8%) | $0 |
| 25 to 44 Years | 67 (14.1%) | $0 |
| 45 to 64 Years | 225 (47.5%) | $60,625 |
| 65+ Years | 164 (34.6%) | $43,125 |
| Total | 474 (100.0%) | $52,794 |
Poverty in Funkstown
Income Below Poverty by Sex and Age in Funkstown
With 11.1% poverty level for males and 6.3% for females among the residents of Funkstown, 16 and 17 year old males and under 5 year old females are the most vulnerable to poverty, with 14 males (100.0%) and 4 females (50.0%) in their respective age groups living below the poverty level.
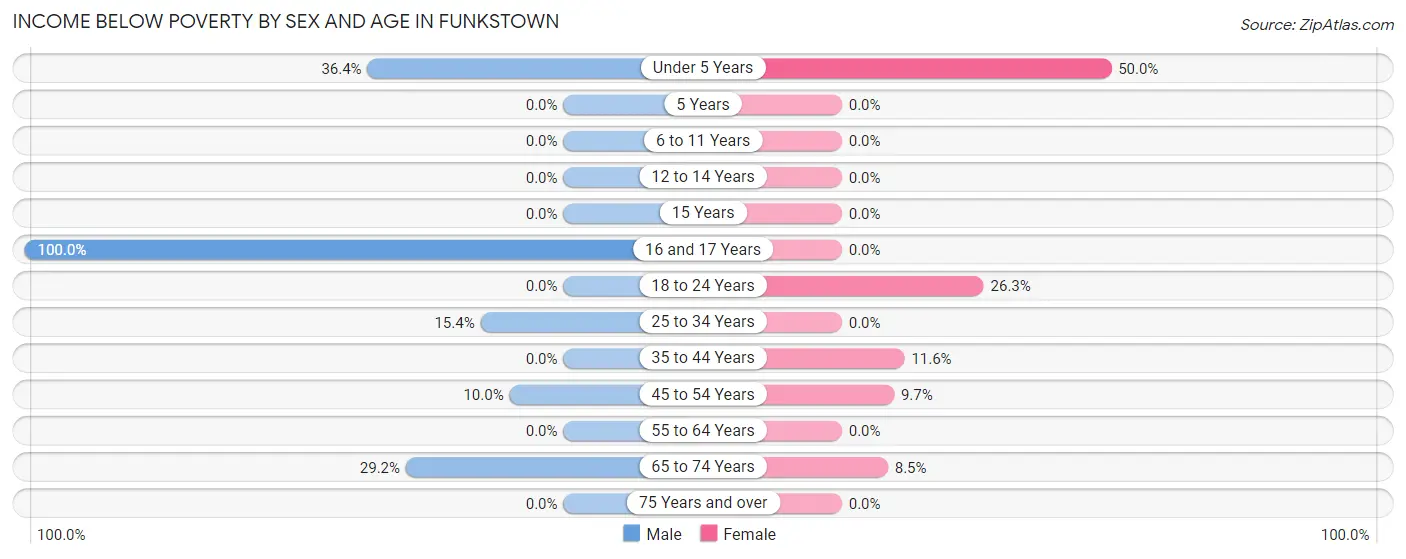
| Age Bracket | Male | Female |
| Under 5 Years | 4 (36.4%) | 4 (50.0%) |
| 5 Years | 0 (0.0%) | 0 (0.0%) |
| 6 to 11 Years | 0 (0.0%) | 0 (0.0%) |
| 12 to 14 Years | 0 (0.0%) | 0 (0.0%) |
| 15 Years | 0 (0.0%) | 0 (0.0%) |
| 16 and 17 Years | 14 (100.0%) | 0 (0.0%) |
| 18 to 24 Years | 0 (0.0%) | 5 (26.3%) |
| 25 to 34 Years | 4 (15.4%) | 0 (0.0%) |
| 35 to 44 Years | 0 (0.0%) | 5 (11.6%) |
| 45 to 54 Years | 7 (10.0%) | 6 (9.7%) |
| 55 to 64 Years | 0 (0.0%) | 0 (0.0%) |
| 65 to 74 Years | 19 (29.2%) | 7 (8.5%) |
| 75 Years and over | 0 (0.0%) | 0 (0.0%) |
| Total | 48 (11.1%) | 27 (6.3%) |
Income Above Poverty by Sex and Age in Funkstown
According to the poverty statistics in Funkstown, males aged 12 to 14 years and females aged 6 to 11 years are the age groups that are most secure financially, with 100.0% of males and 100.0% of females in these age groups living above the poverty line.
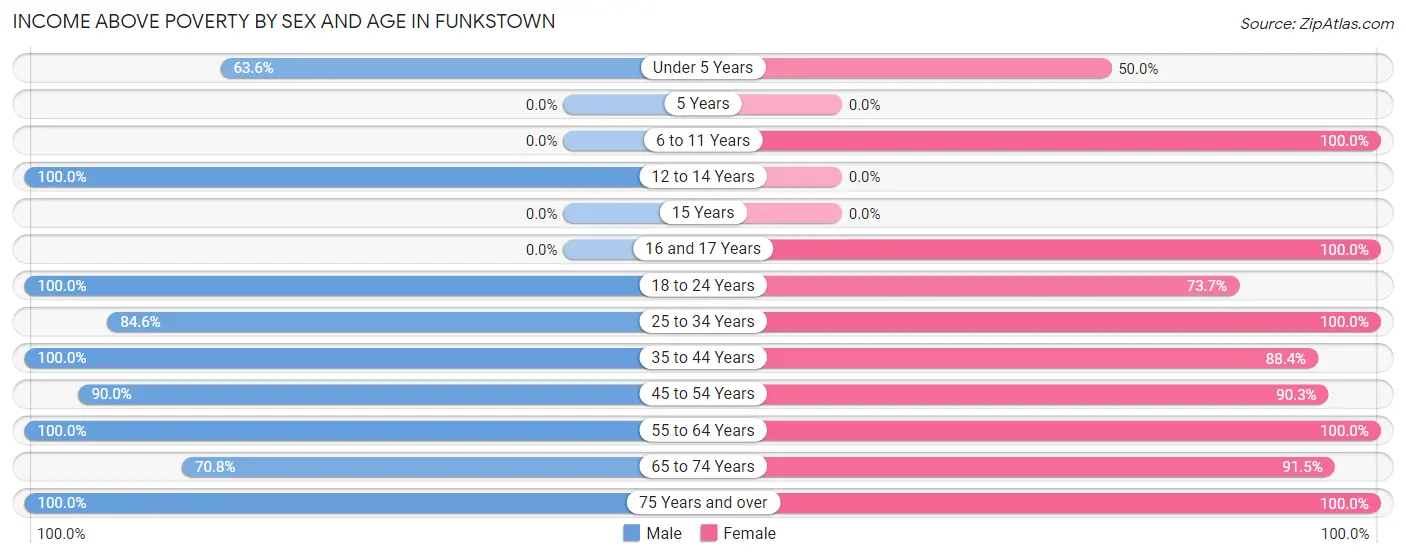
| Age Bracket | Male | Female |
| Under 5 Years | 7 (63.6%) | 4 (50.0%) |
| 5 Years | 0 (0.0%) | 0 (0.0%) |
| 6 to 11 Years | 0 (0.0%) | 4 (100.0%) |
| 12 to 14 Years | 5 (100.0%) | 0 (0.0%) |
| 15 Years | 0 (0.0%) | 0 (0.0%) |
| 16 and 17 Years | 0 (0.0%) | 15 (100.0%) |
| 18 to 24 Years | 49 (100.0%) | 14 (73.7%) |
| 25 to 34 Years | 22 (84.6%) | 13 (100.0%) |
| 35 to 44 Years | 35 (100.0%) | 38 (88.4%) |
| 45 to 54 Years | 63 (90.0%) | 56 (90.3%) |
| 55 to 64 Years | 121 (100.0%) | 116 (100.0%) |
| 65 to 74 Years | 46 (70.8%) | 75 (91.5%) |
| 75 Years and over | 37 (100.0%) | 66 (100.0%) |
| Total | 385 (88.9%) | 401 (93.7%) |
Income Below Poverty Among Married-Couple Families in Funkstown
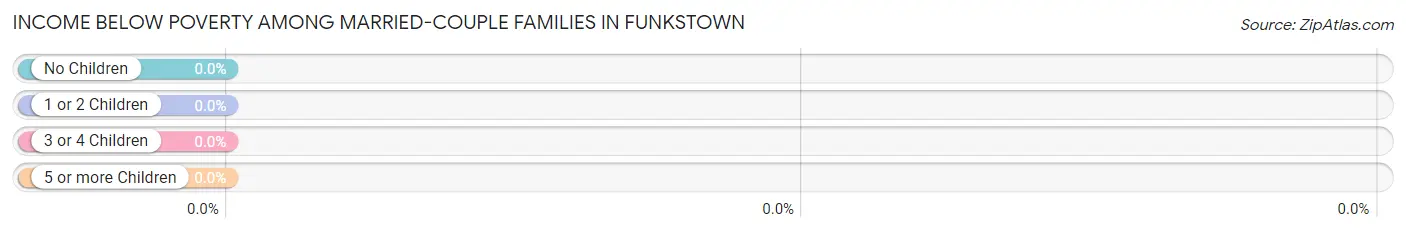
| Children | Above Poverty | Below Poverty |
| No Children | 219 (100.0%) | 0 (0.0%) |
| 1 or 2 Children | 21 (100.0%) | 0 (0.0%) |
| 3 or 4 Children | 0 (0.0%) | 0 (0.0%) |
| 5 or more Children | 0 (0.0%) | 0 (0.0%) |
| Total | 240 (100.0%) | 0 (0.0%) |
Income Below Poverty Among Single-Parent Households in Funkstown
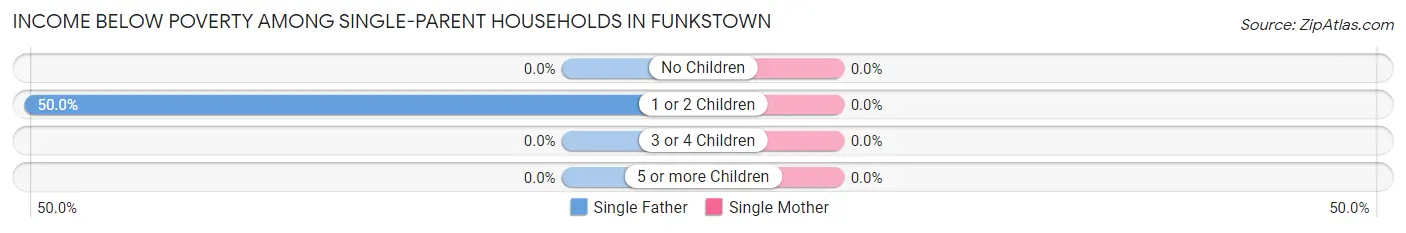
| Children | Single Father | Single Mother |
| No Children | 0 (0.0%) | 0 (0.0%) |
| 1 or 2 Children | 4 (50.0%) | 0 (0.0%) |
| 3 or 4 Children | 0 (0.0%) | 0 (0.0%) |
| 5 or more Children | 0 (0.0%) | 0 (0.0%) |
| Total | 4 (22.2%) | 0 (0.0%) |
Income Below Poverty Among Married-Couple vs Single-Parent Households in Funkstown
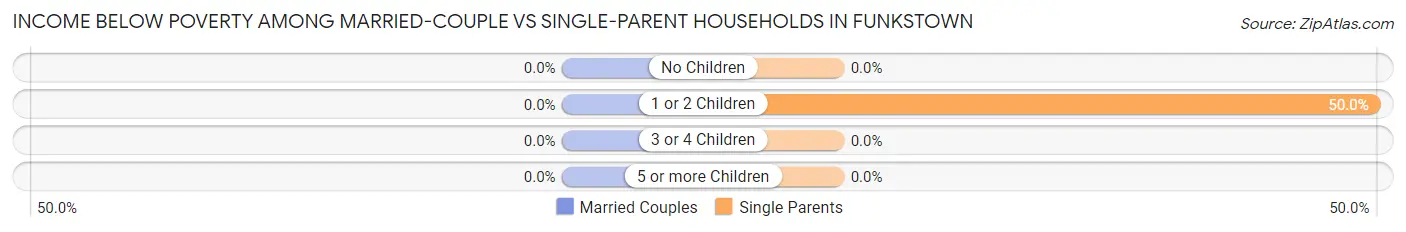
| Children | Married-Couple Families | Single-Parent Households |
| No Children | 0 (0.0%) | 0 (0.0%) |
| 1 or 2 Children | 0 (0.0%) | 4 (50.0%) |
| 3 or 4 Children | 0 (0.0%) | 0 (0.0%) |
| 5 or more Children | 0 (0.0%) | 0 (0.0%) |
| Total | 0 (0.0%) | 4 (17.4%) |
Race in Funkstown
The most populous races in Funkstown are White / Caucasian (858 | 99.7%), Hispanic or Latino (8 | 0.9%), and Two or more Races (3 | 0.4%).
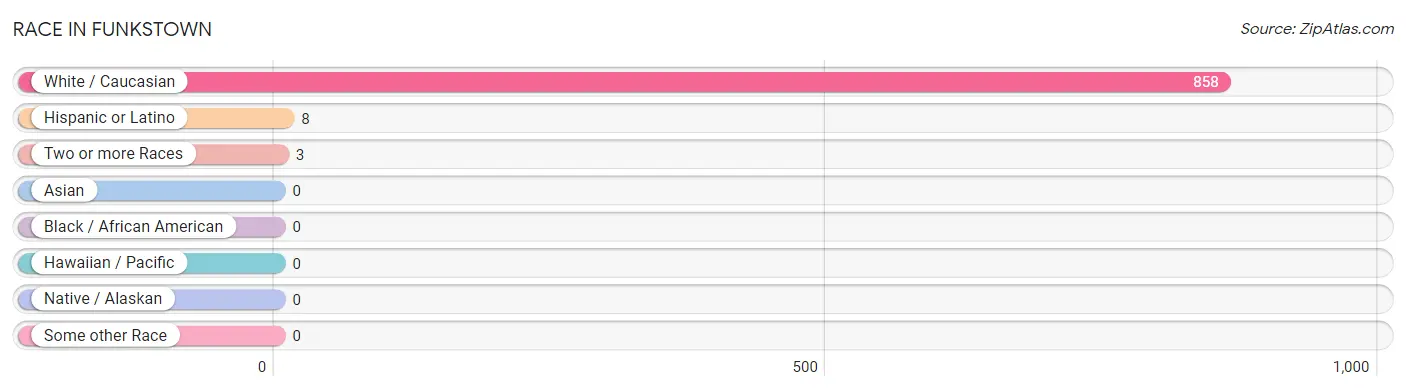
| Race | # Population | % Population |
| Asian | 0 | 0.0% |
| Black / African American | 0 | 0.0% |
| Hawaiian / Pacific | 0 | 0.0% |
| Hispanic or Latino | 8 | 0.9% |
| Native / Alaskan | 0 | 0.0% |
| White / Caucasian | 858 | 99.7% |
| Two or more Races | 3 | 0.4% |
| Some other Race | 0 | 0.0% |
| Total | 861 | 100.0% |
Ancestry in Funkstown
The most populous ancestries reported in Funkstown are German (369 | 42.9%), English (172 | 20.0%), Irish (94 | 10.9%), Italian (53 | 6.2%), and Scottish (36 | 4.2%), together accounting for 84.1% of all Funkstown residents.
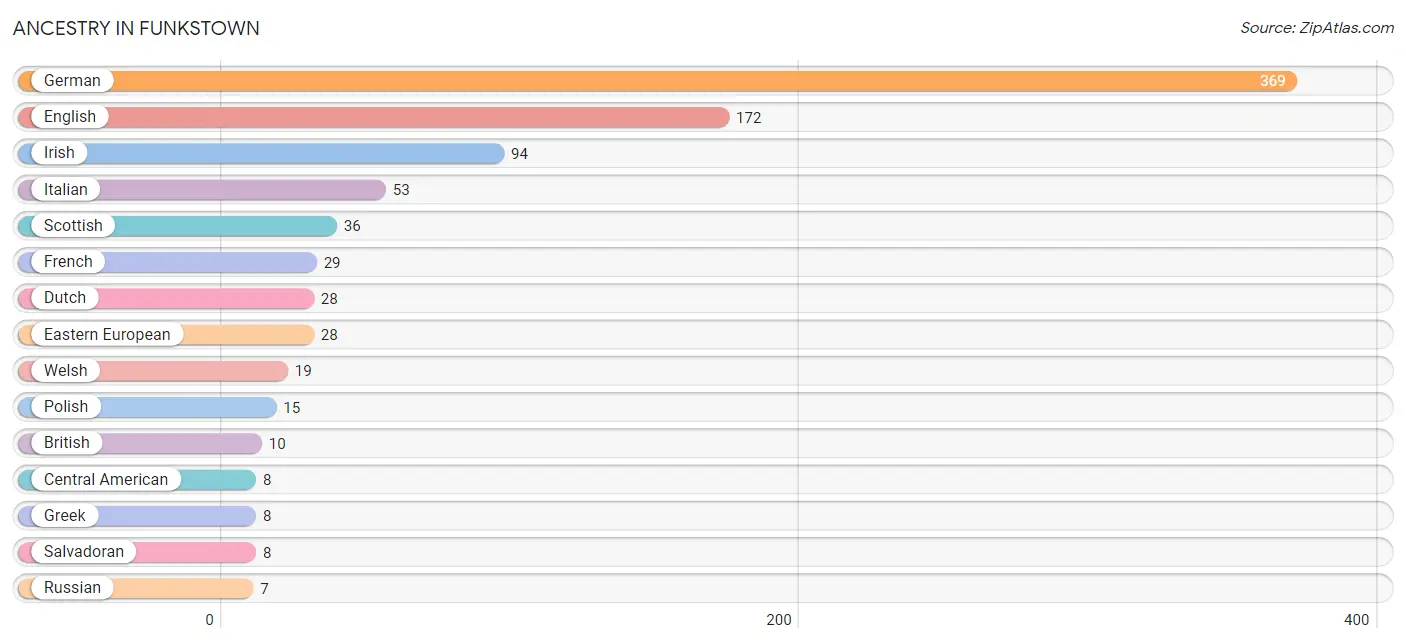
| Ancestry | # Population | % Population |
| Belgian | 5 | 0.6% |
| British | 10 | 1.2% |
| Central American | 8 | 0.9% |
| Danish | 6 | 0.7% |
| Dutch | 28 | 3.3% |
| Eastern European | 28 | 3.3% |
| English | 172 | 20.0% |
| Finnish | 6 | 0.7% |
| French | 29 | 3.4% |
| German | 369 | 42.9% |
| Greek | 8 | 0.9% |
| Irish | 94 | 10.9% |
| Italian | 53 | 6.2% |
| Lithuanian | 4 | 0.5% |
| Northern European | 5 | 0.6% |
| Polish | 15 | 1.7% |
| Russian | 7 | 0.8% |
| Salvadoran | 8 | 0.9% |
| Scottish | 36 | 4.2% |
| Slovak | 5 | 0.6% |
| Ukrainian | 6 | 0.7% |
| Welsh | 19 | 2.2% | View All 22 Rows |
Immigrants in Funkstown

| Immigration Origin | # Population | % Population | View All 0 Rows |
Sex and Age in Funkstown
Sex and Age in Funkstown
The most populous age groups in Funkstown are 55 to 59 Years (61 | 14.1%) for men and 60 to 64 Years (78 | 18.2%) for women.
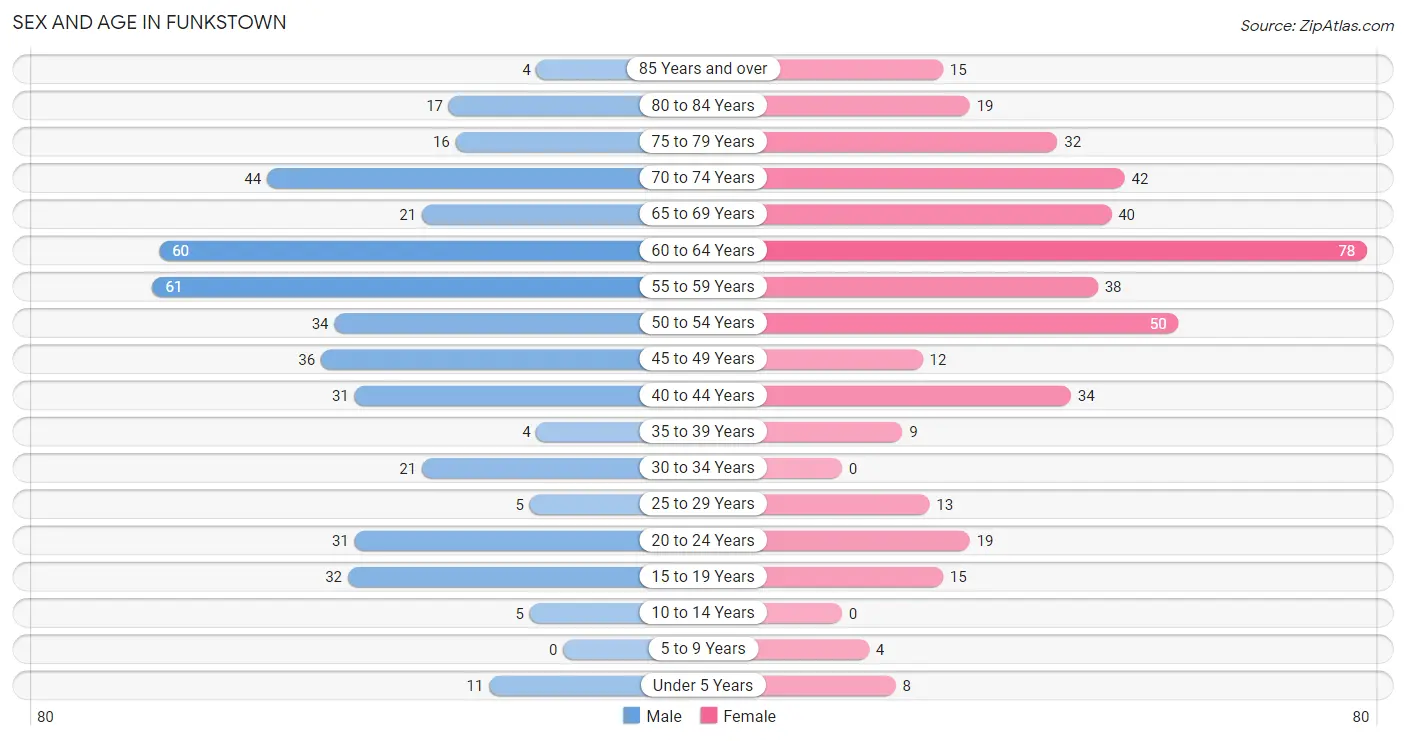
| Age Bracket | Male | Female |
| Under 5 Years | 11 (2.5%) | 8 (1.9%) |
| 5 to 9 Years | 0 (0.0%) | 4 (0.9%) |
| 10 to 14 Years | 5 (1.1%) | 0 (0.0%) |
| 15 to 19 Years | 32 (7.4%) | 15 (3.5%) |
| 20 to 24 Years | 31 (7.2%) | 19 (4.4%) |
| 25 to 29 Years | 5 (1.1%) | 13 (3.0%) |
| 30 to 34 Years | 21 (4.9%) | 0 (0.0%) |
| 35 to 39 Years | 4 (0.9%) | 9 (2.1%) |
| 40 to 44 Years | 31 (7.2%) | 34 (7.9%) |
| 45 to 49 Years | 36 (8.3%) | 12 (2.8%) |
| 50 to 54 Years | 34 (7.9%) | 50 (11.7%) |
| 55 to 59 Years | 61 (14.1%) | 38 (8.9%) |
| 60 to 64 Years | 60 (13.9%) | 78 (18.2%) |
| 65 to 69 Years | 21 (4.9%) | 40 (9.3%) |
| 70 to 74 Years | 44 (10.2%) | 42 (9.8%) |
| 75 to 79 Years | 16 (3.7%) | 32 (7.5%) |
| 80 to 84 Years | 17 (3.9%) | 19 (4.4%) |
| 85 Years and over | 4 (0.9%) | 15 (3.5%) |
| Total | 433 (100.0%) | 428 (100.0%) |
Families and Households in Funkstown
Median Family Size in Funkstown
The median family size in Funkstown is 2.26 persons per family, with single male/father families (18 | 6.8%) accounting for the largest median family size of 2.78 persons per family. On the other hand, single female/mother families (5 | 1.9%) represent the smallest median family size with 2.00 persons per family.
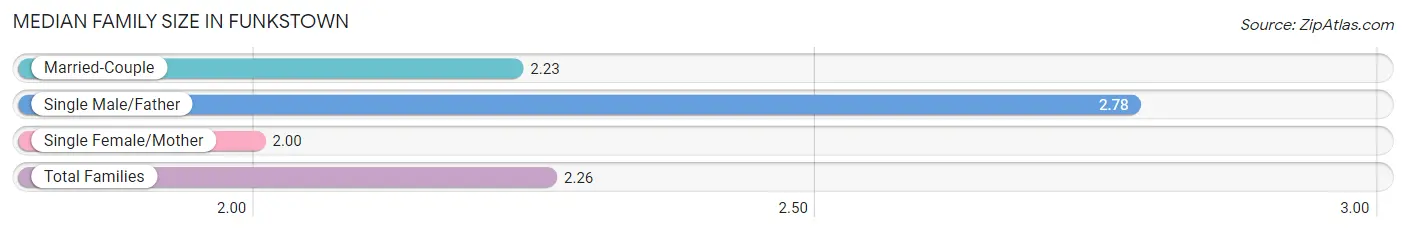
| Family Type | # Families | Family Size |
| Married-Couple | 240 (91.2%) | 2.23 |
| Single Male/Father | 18 (6.8%) | 2.78 |
| Single Female/Mother | 5 (1.9%) | 2.00 |
| Total Families | 263 (100.0%) | 2.26 |
Median Household Size in Funkstown
The median household size in Funkstown is 1.77 persons per household, with single male/father households (18 | 3.8%) accounting for the largest median household size of 4.17 persons per household. non-family households (211 | 44.5%) represent the smallest median household size with 1.05 persons per household.
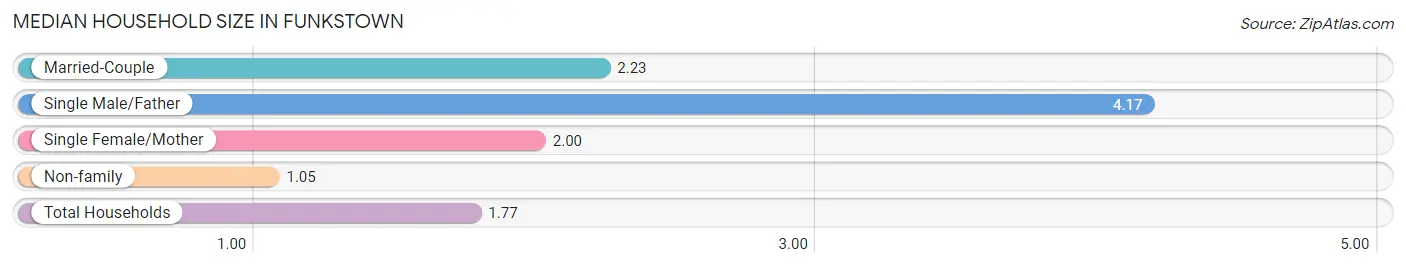
| Household Type | # Households | Household Size |
| Married-Couple | 240 (50.6%) | 2.23 |
| Single Male/Father | 18 (3.8%) | 4.17 |
| Single Female/Mother | 5 (1.1%) | 2.00 |
| Non-family | 211 (44.5%) | 1.05 |
| Total Households | 474 (100.0%) | 1.77 |
Household Size by Marriage Status in Funkstown
Out of a total of 474 households in Funkstown, 263 (55.5%) are family households, while 211 (44.5%) are nonfamily households. The most numerous type of family households are 2-person households, comprising 180, and the most common type of nonfamily households are 1-person households, comprising 204.
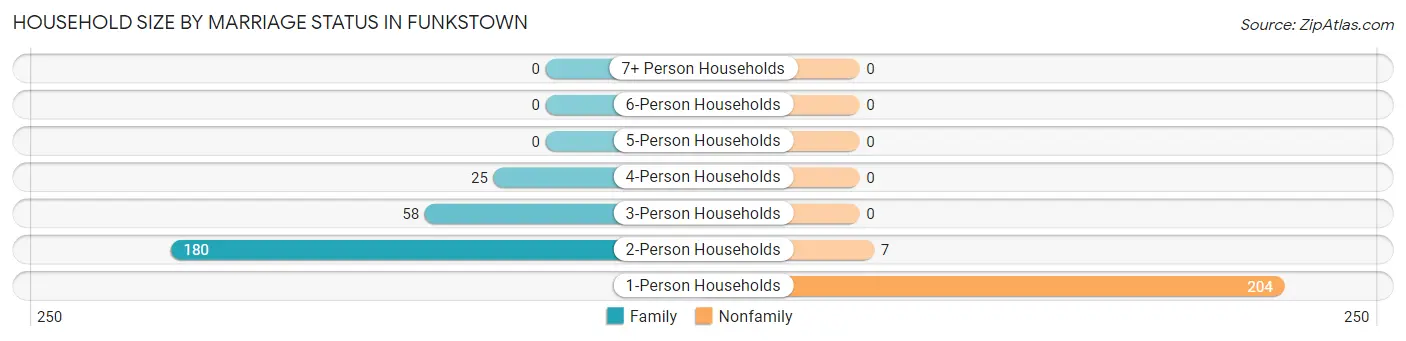
| Household Size | Family Households | Nonfamily Households |
| 1-Person Households | - | 204 (43.0%) |
| 2-Person Households | 180 (38.0%) | 7 (1.5%) |
| 3-Person Households | 58 (12.2%) | 0 (0.0%) |
| 4-Person Households | 25 (5.3%) | 0 (0.0%) |
| 5-Person Households | 0 (0.0%) | 0 (0.0%) |
| 6-Person Households | 0 (0.0%) | 0 (0.0%) |
| 7+ Person Households | 0 (0.0%) | 0 (0.0%) |
| Total | 263 (55.5%) | 211 (44.5%) |
Female Fertility in Funkstown
Fertility by Age in Funkstown
| Age Bracket | Women with Births | Births / 1,000 Women |
| 15 to 19 years | 0 (0.0%) | 0.0 |
| 20 to 34 years | 0 (0.0%) | 0.0 |
| 35 to 50 years | 0 (0.0%) | 0.0 |
| Total | 0 (0.0%) | 0.0 |
Fertility by Age by Marriage Status in Funkstown
| Age Bracket | Married | Unmarried |
| 15 to 19 years | 0 (0.0%) | 0 (0.0%) |
| 20 to 34 years | 0 (0.0%) | 0 (0.0%) |
| 35 to 50 years | 0 (0.0%) | 0 (0.0%) |
| Total | 0 (0.0%) | 0 (0.0%) |
Fertility by Education in Funkstown
| Educational Attainment | Women with Births | Births / 1,000 Women |
| Less than High School | 0 (0.0%) | 0.0 |
| High School Diploma | 0 (0.0%) | 0.0 |
| College or Associate's Degree | 0 (0.0%) | 0.0 |
| Bachelor's Degree | 0 (0.0%) | 0.0 |
| Graduate Degree | 0 (0.0%) | 0.0 |
| Total | 0 (0.0%) | 0.0 |
Fertility by Education by Marriage Status in Funkstown
| Educational Attainment | Married | Unmarried |
| Less than High School | 0 (0.0%) | 0 (0.0%) |
| High School Diploma | 0 (0.0%) | 0 (0.0%) |
| College or Associate's Degree | 0 (0.0%) | 0 (0.0%) |
| Bachelor's Degree | 0 (0.0%) | 0 (0.0%) |
| Graduate Degree | 0 (0.0%) | 0 (0.0%) |
| Total | 0 (0.0%) | 0 (0.0%) |
Employment Characteristics in Funkstown
Employment by Class of Employer in Funkstown
Among the 430 employed individuals in Funkstown, private company employees (312 | 72.6%), not-for-profit organizations (48 | 11.2%), and local government employees (31 | 7.2%) make up the most common classes of employment.
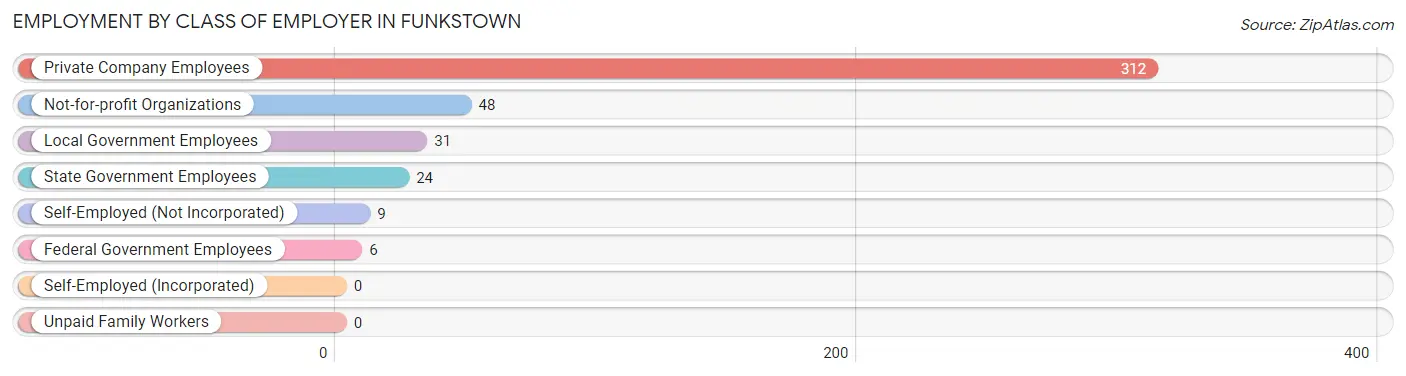
| Employer Class | # Employees | % Employees |
| Private Company Employees | 312 | 72.6% |
| Self-Employed (Incorporated) | 0 | 0.0% |
| Self-Employed (Not Incorporated) | 9 | 2.1% |
| Not-for-profit Organizations | 48 | 11.2% |
| Local Government Employees | 31 | 7.2% |
| State Government Employees | 24 | 5.6% |
| Federal Government Employees | 6 | 1.4% |
| Unpaid Family Workers | 0 | 0.0% |
| Total | 430 | 100.0% |
Employment Status by Age in Funkstown
According to the labor force statistics for Funkstown, out of the total population over 16 years of age (833), 53.9% or 449 individuals are in the labor force, with 4.2% or 19 of them unemployed. The age group with the highest labor force participation rate is 20 to 24 years, with 100.0% or 50 individuals in the labor force. Within the labor force, the 20 to 24 years age range has the highest percentage of unemployed individuals, with 20.0% or 10 of them being unemployed.
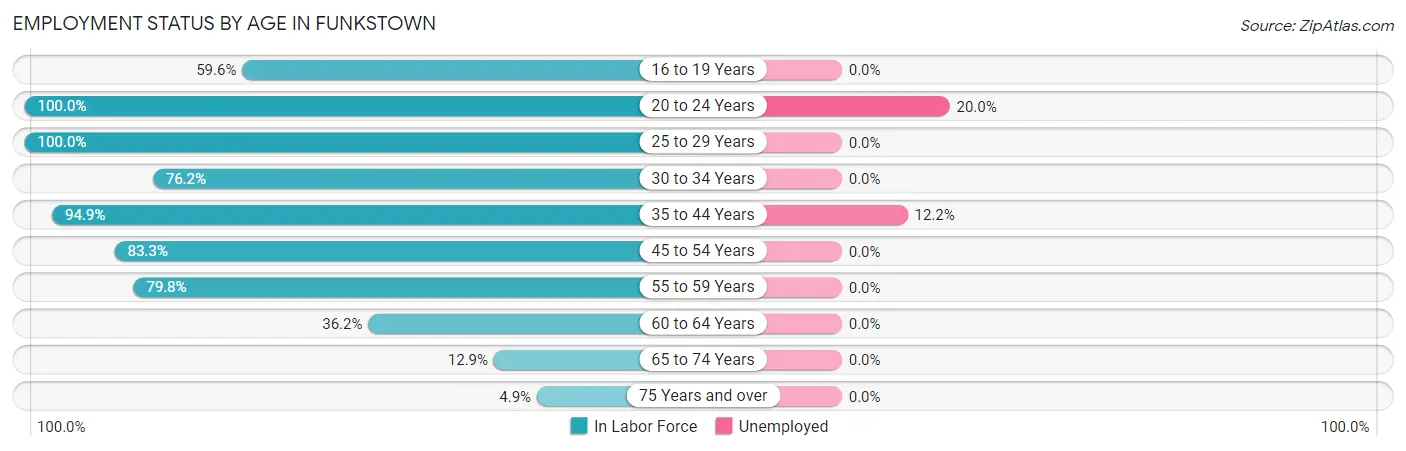
| Age Bracket | In Labor Force | Unemployed |
| 16 to 19 Years | 28 (59.6%) | 0 (0.0%) |
| 20 to 24 Years | 50 (100.0%) | 10 (20.0%) |
| 25 to 29 Years | 18 (100.0%) | 0 (0.0%) |
| 30 to 34 Years | 16 (76.2%) | 0 (0.0%) |
| 35 to 44 Years | 74 (94.9%) | 9 (12.2%) |
| 45 to 54 Years | 110 (83.3%) | 0 (0.0%) |
| 55 to 59 Years | 79 (79.8%) | 0 (0.0%) |
| 60 to 64 Years | 50 (36.2%) | 0 (0.0%) |
| 65 to 74 Years | 19 (12.9%) | 0 (0.0%) |
| 75 Years and over | 5 (4.9%) | 0 (0.0%) |
| Total | 449 (53.9%) | 19 (4.2%) |
Employment Status by Educational Attainment in Funkstown
According to labor force statistics for Funkstown, 71.4% of individuals (347) out of the total population between 25 and 64 years of age (486) are in the labor force, with 2.6% or 9 of them being unemployed. The group with the highest labor force participation rate are those with the educational attainment of high school diploma, with 85.7% or 120 individuals in the labor force. Within the labor force, individuals with bachelor's degree or higher education have the highest percentage of unemployment, with 11.4% or 9 of them being unemployed.

| Educational Attainment | In Labor Force | Unemployed |
| Less than High School | 10 (62.5%) | 0 (0.0%) |
| High School Diploma | 120 (85.7%) | 0 (0.0%) |
| College / Associate Degree | 138 (70.1%) | 0 (0.0%) |
| Bachelor's Degree or higher | 79 (59.4%) | 15 (11.4%) |
| Total | 347 (71.4%) | 13 (2.6%) |
Employment Occupations by Sex in Funkstown
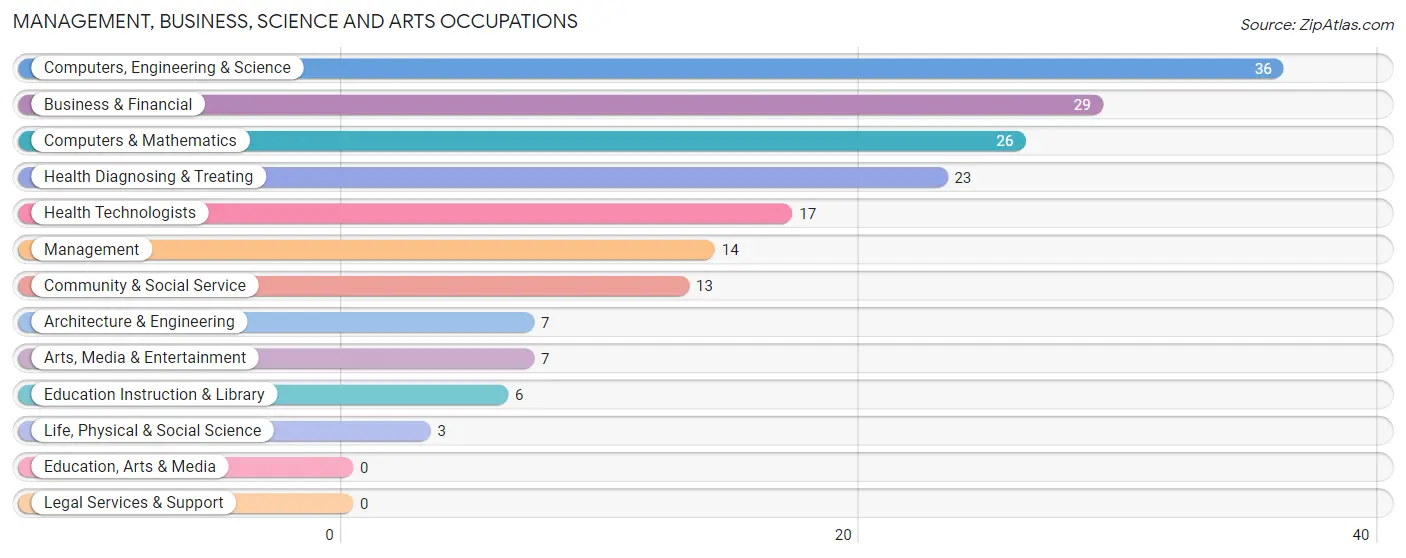
Management, Business, Science and Arts Occupations
The most common Management, Business, Science and Arts occupations in Funkstown are Computers, Engineering & Science (36 | 8.4%), Business & Financial (29 | 6.7%), Computers & Mathematics (26 | 6.0%), Health Diagnosing & Treating (23 | 5.3%), and Health Technologists (17 | 4.0%).
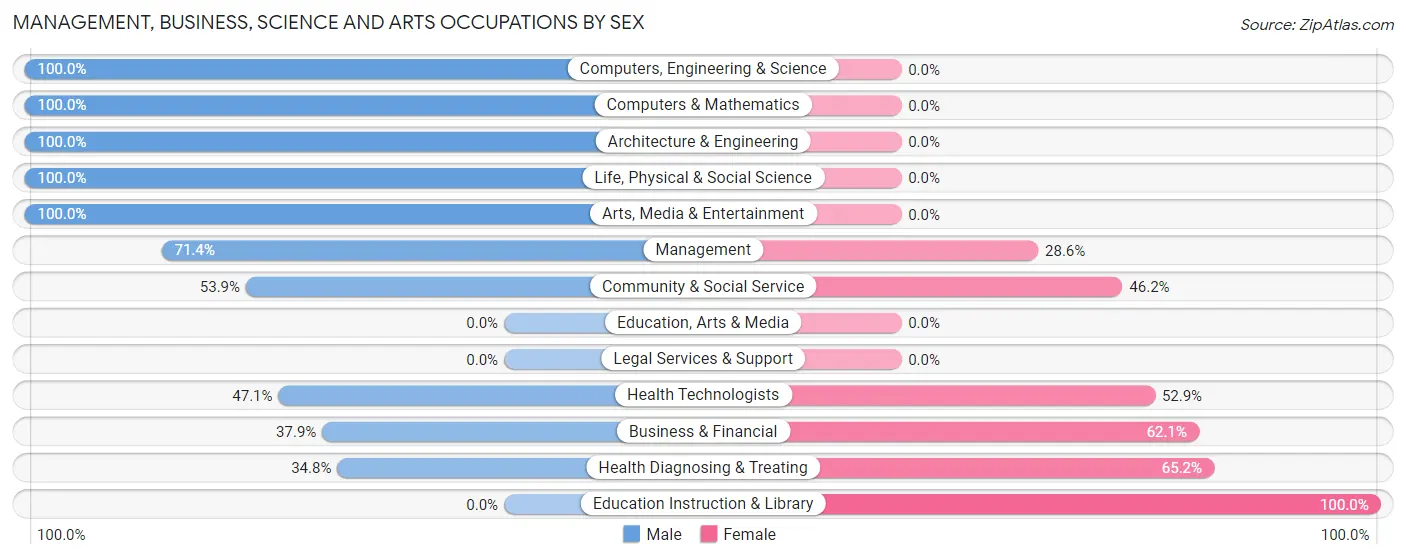
Management, Business, Science and Arts Occupations by Sex
Within the Management, Business, Science and Arts occupations in Funkstown, the most male-oriented occupations are Computers, Engineering & Science (100.0%), Computers & Mathematics (100.0%), and Architecture & Engineering (100.0%), while the most female-oriented occupations are Education Instruction & Library (100.0%), Health Diagnosing & Treating (65.2%), and Business & Financial (62.1%).
| Occupation | Male | Female |
| Management | 10 (71.4%) | 4 (28.6%) |
| Business & Financial | 11 (37.9%) | 18 (62.1%) |
| Computers, Engineering & Science | 36 (100.0%) | 0 (0.0%) |
| Computers & Mathematics | 26 (100.0%) | 0 (0.0%) |
| Architecture & Engineering | 7 (100.0%) | 0 (0.0%) |
| Life, Physical & Social Science | 3 (100.0%) | 0 (0.0%) |
| Community & Social Service | 7 (53.8%) | 6 (46.2%) |
| Education, Arts & Media | 0 (0.0%) | 0 (0.0%) |
| Legal Services & Support | 0 (0.0%) | 0 (0.0%) |
| Education Instruction & Library | 0 (0.0%) | 6 (100.0%) |
| Arts, Media & Entertainment | 7 (100.0%) | 0 (0.0%) |
| Health Diagnosing & Treating | 8 (34.8%) | 15 (65.2%) |
| Health Technologists | 8 (47.1%) | 9 (52.9%) |
| Total (Category) | 72 (62.6%) | 43 (37.4%) |
| Total (Overall) | 266 (61.9%) | 164 (38.1%) |
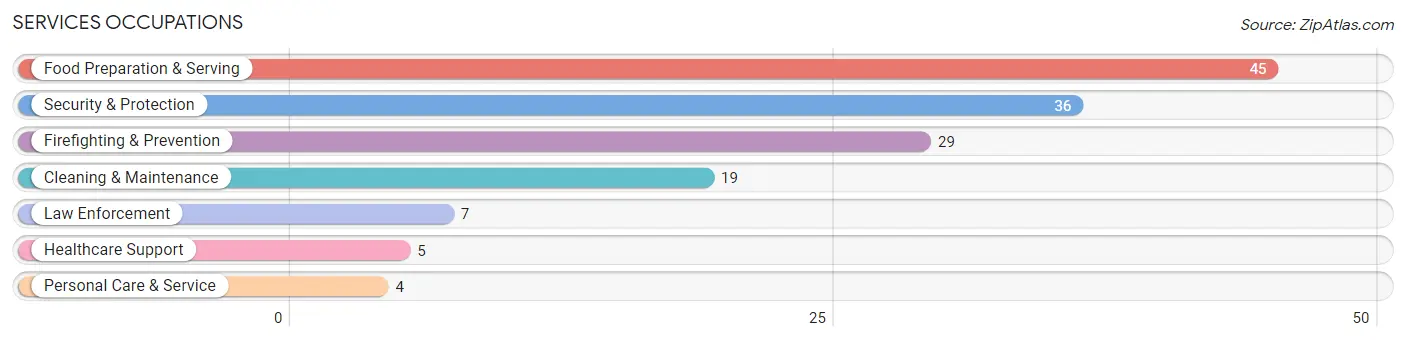
Services Occupations
The most common Services occupations in Funkstown are Food Preparation & Serving (45 | 10.5%), Security & Protection (36 | 8.4%), Firefighting & Prevention (29 | 6.7%), Cleaning & Maintenance (19 | 4.4%), and Law Enforcement (7 | 1.6%).
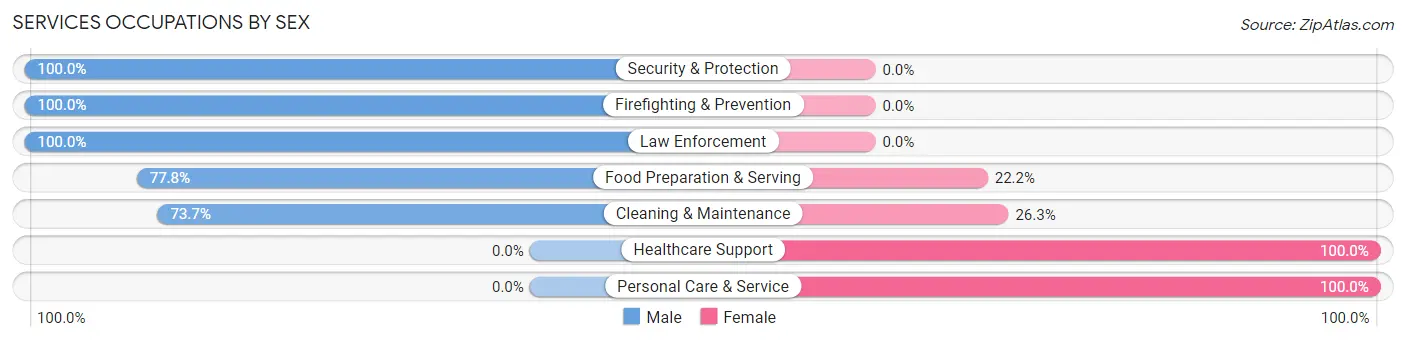
Services Occupations by Sex
Within the Services occupations in Funkstown, the most male-oriented occupations are Security & Protection (100.0%), Firefighting & Prevention (100.0%), and Law Enforcement (100.0%), while the most female-oriented occupations are Healthcare Support (100.0%), Personal Care & Service (100.0%), and Cleaning & Maintenance (26.3%).
| Occupation | Male | Female |
| Healthcare Support | 0 (0.0%) | 5 (100.0%) |
| Security & Protection | 36 (100.0%) | 0 (0.0%) |
| Firefighting & Prevention | 29 (100.0%) | 0 (0.0%) |
| Law Enforcement | 7 (100.0%) | 0 (0.0%) |
| Food Preparation & Serving | 35 (77.8%) | 10 (22.2%) |
| Cleaning & Maintenance | 14 (73.7%) | 5 (26.3%) |
| Personal Care & Service | 0 (0.0%) | 4 (100.0%) |
| Total (Category) | 85 (78.0%) | 24 (22.0%) |
| Total (Overall) | 266 (61.9%) | 164 (38.1%) |
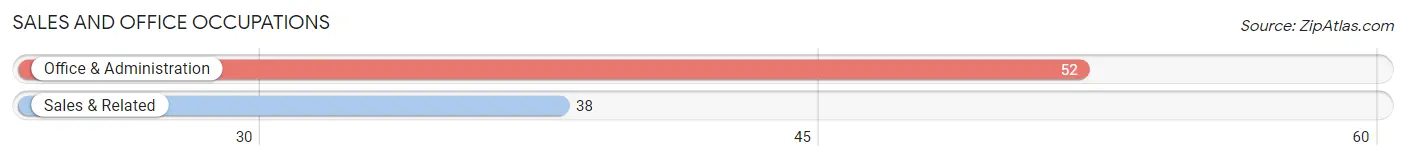
Sales and Office Occupations
The most common Sales and Office occupations in Funkstown are Office & Administration (52 | 12.1%), and Sales & Related (38 | 8.8%).
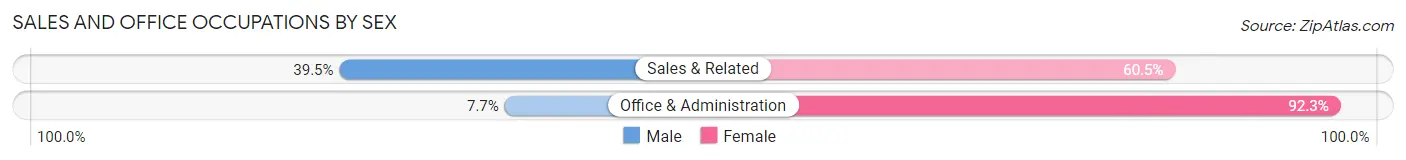
Sales and Office Occupations by Sex
| Occupation | Male | Female |
| Sales & Related | 15 (39.5%) | 23 (60.5%) |
| Office & Administration | 4 (7.7%) | 48 (92.3%) |
| Total (Category) | 19 (21.1%) | 71 (78.9%) |
| Total (Overall) | 266 (61.9%) | 164 (38.1%) |
Natural Resources, Construction and Maintenance Occupations
The most common Natural Resources, Construction and Maintenance occupations in Funkstown are Construction & Extraction (32 | 7.4%), Installation, Maintenance & Repair (5 | 1.2%), and Farming, Fishing & Forestry (4 | 0.9%).
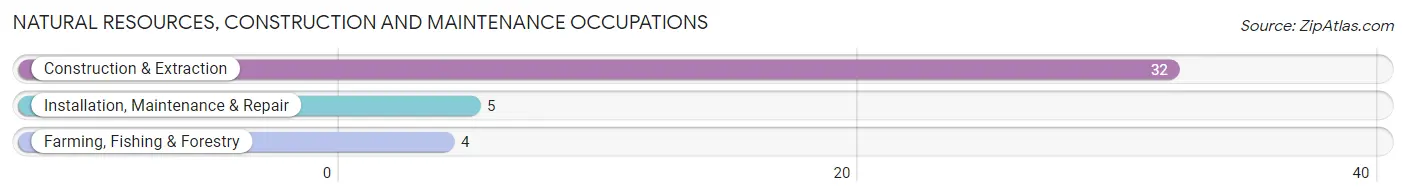
Natural Resources, Construction and Maintenance Occupations by Sex

| Occupation | Male | Female |
| Farming, Fishing & Forestry | 0 (0.0%) | 4 (100.0%) |
| Construction & Extraction | 32 (100.0%) | 0 (0.0%) |
| Installation, Maintenance & Repair | 5 (100.0%) | 0 (0.0%) |
| Total (Category) | 37 (90.2%) | 4 (9.8%) |
| Total (Overall) | 266 (61.9%) | 164 (38.1%) |
Production, Transportation and Moving Occupations
The most common Production, Transportation and Moving occupations in Funkstown are Transportation (39 | 9.1%), Material Moving (28 | 6.5%), and Production (8 | 1.9%).
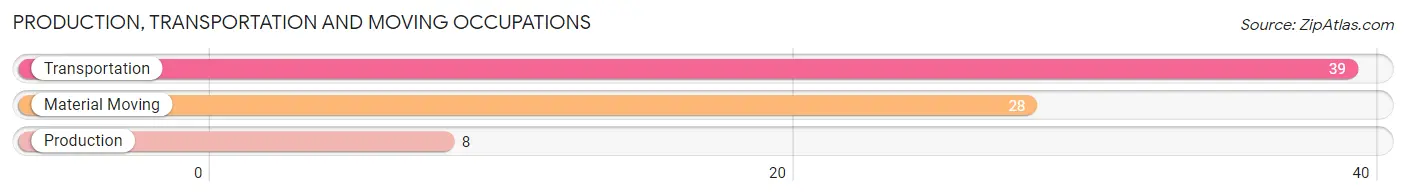
Production, Transportation and Moving Occupations by Sex
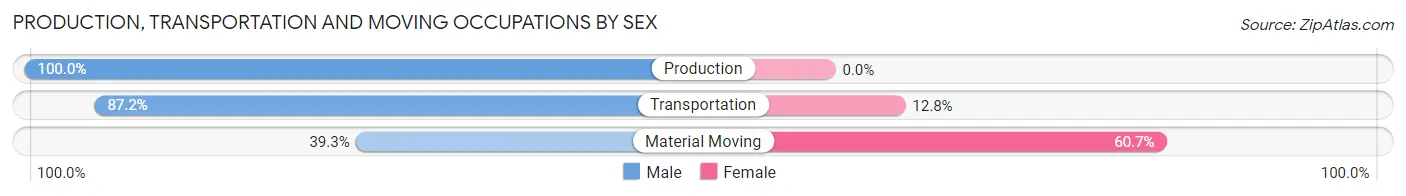
| Occupation | Male | Female |
| Production | 8 (100.0%) | 0 (0.0%) |
| Transportation | 34 (87.2%) | 5 (12.8%) |
| Material Moving | 11 (39.3%) | 17 (60.7%) |
| Total (Category) | 53 (70.7%) | 22 (29.3%) |
| Total (Overall) | 266 (61.9%) | 164 (38.1%) |
Employment Industries by Sex in Funkstown
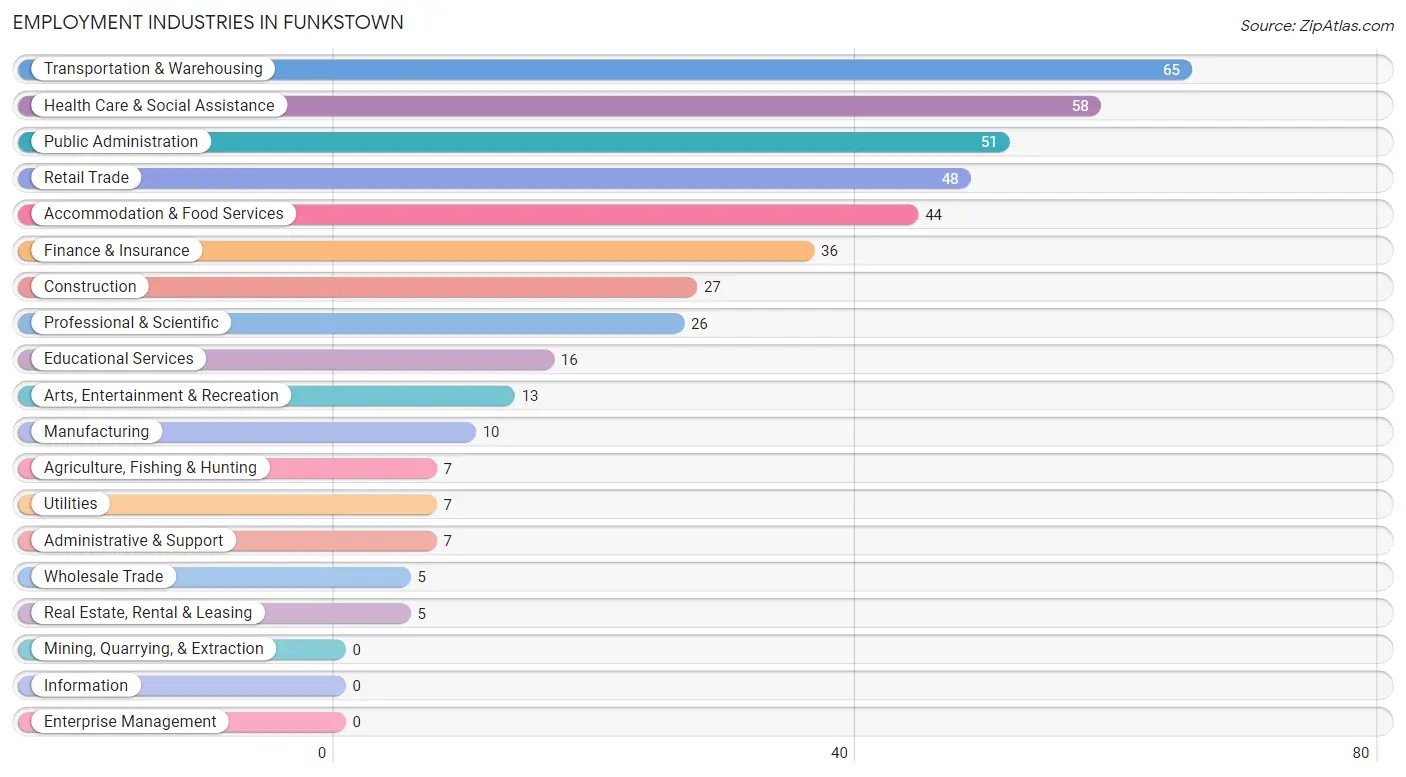
Employment Industries in Funkstown
The major employment industries in Funkstown include Transportation & Warehousing (65 | 15.1%), Health Care & Social Assistance (58 | 13.5%), Public Administration (51 | 11.9%), Retail Trade (48 | 11.2%), and Accommodation & Food Services (44 | 10.2%).
Employment Industries by Sex in Funkstown
The Funkstown industries that see more men than women are Construction (100.0%), Wholesale Trade (100.0%), and Utilities (100.0%), whereas the industries that tend to have a higher number of women are Manufacturing (100.0%), Real Estate, Rental & Leasing (100.0%), and Educational Services (100.0%).
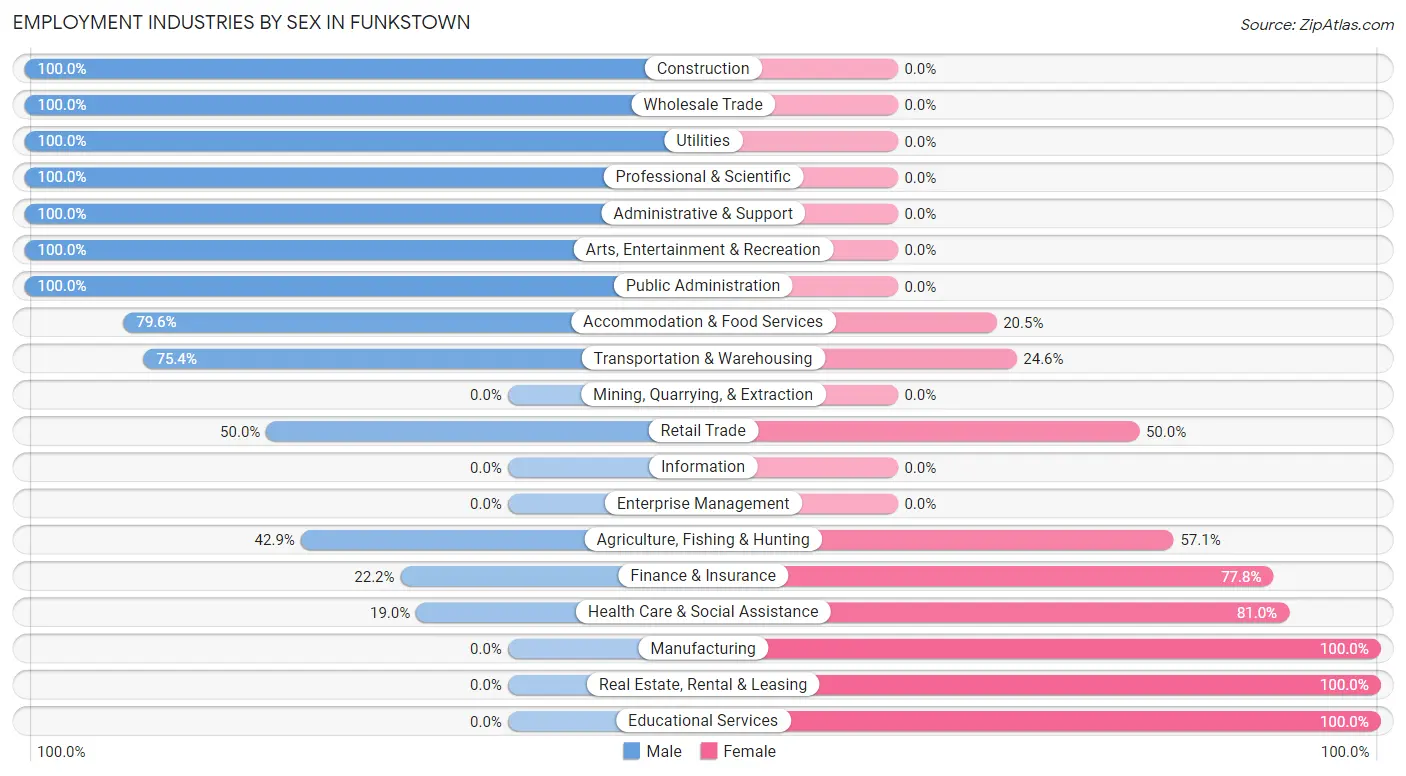
| Industry | Male | Female |
| Agriculture, Fishing & Hunting | 3 (42.9%) | 4 (57.1%) |
| Mining, Quarrying, & Extraction | 0 (0.0%) | 0 (0.0%) |
| Construction | 27 (100.0%) | 0 (0.0%) |
| Manufacturing | 0 (0.0%) | 10 (100.0%) |
| Wholesale Trade | 5 (100.0%) | 0 (0.0%) |
| Retail Trade | 24 (50.0%) | 24 (50.0%) |
| Transportation & Warehousing | 49 (75.4%) | 16 (24.6%) |
| Utilities | 7 (100.0%) | 0 (0.0%) |
| Information | 0 (0.0%) | 0 (0.0%) |
| Finance & Insurance | 8 (22.2%) | 28 (77.8%) |
| Real Estate, Rental & Leasing | 0 (0.0%) | 5 (100.0%) |
| Professional & Scientific | 26 (100.0%) | 0 (0.0%) |
| Enterprise Management | 0 (0.0%) | 0 (0.0%) |
| Administrative & Support | 7 (100.0%) | 0 (0.0%) |
| Educational Services | 0 (0.0%) | 16 (100.0%) |
| Health Care & Social Assistance | 11 (19.0%) | 47 (81.0%) |
| Arts, Entertainment & Recreation | 13 (100.0%) | 0 (0.0%) |
| Accommodation & Food Services | 35 (79.5%) | 9 (20.4%) |
| Public Administration | 51 (100.0%) | 0 (0.0%) |
| Total | 266 (61.9%) | 164 (38.1%) |
Education in Funkstown
School Enrollment in Funkstown
The most common levels of schooling among the 82 students in Funkstown are high school (29 | 35.4%), college / undergraduate (28 | 34.2%), and graduate / professional (12 | 14.6%).
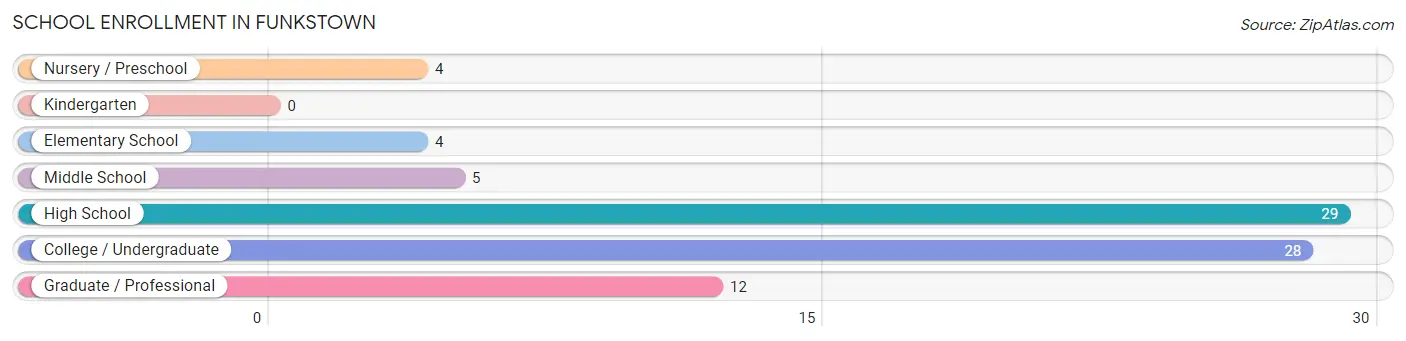
| School Level | # Students | % Students |
| Nursery / Preschool | 4 | 4.9% |
| Kindergarten | 0 | 0.0% |
| Elementary School | 4 | 4.9% |
| Middle School | 5 | 6.1% |
| High School | 29 | 35.4% |
| College / Undergraduate | 28 | 34.2% |
| Graduate / Professional | 12 | 14.6% |
| Total | 82 | 100.0% |
School Enrollment by Age by Funding Source in Funkstown
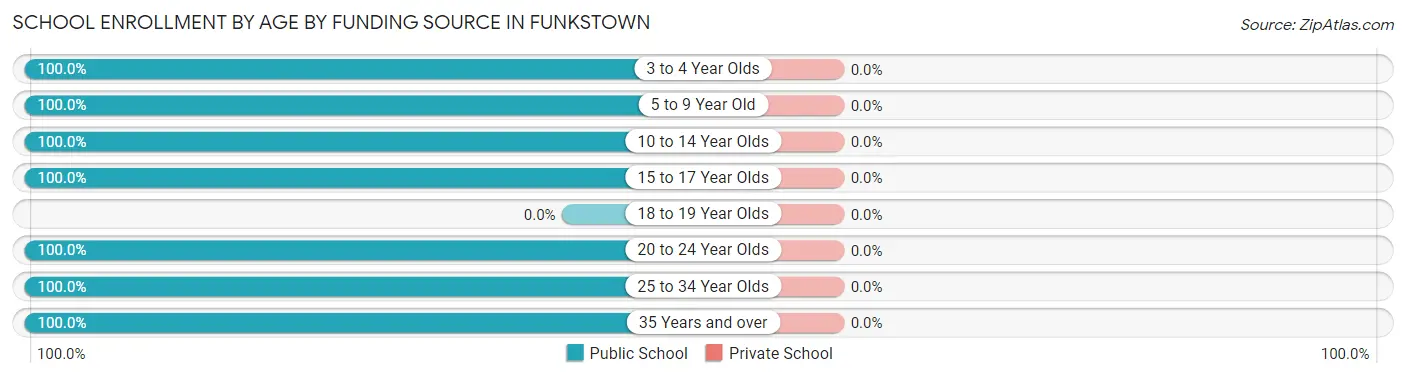
| Age Bracket | Public School | Private School |
| 3 to 4 Year Olds | 4 (100.0%) | 0 (0.0%) |
| 5 to 9 Year Old | 4 (100.0%) | 0 (0.0%) |
| 10 to 14 Year Olds | 5 (100.0%) | 0 (0.0%) |
| 15 to 17 Year Olds | 29 (100.0%) | 0 (0.0%) |
| 18 to 19 Year Olds | 0 (0.0%) | 0 (0.0%) |
| 20 to 24 Year Olds | 18 (100.0%) | 0 (0.0%) |
| 25 to 34 Year Olds | 4 (100.0%) | 0 (0.0%) |
| 35 Years and over | 18 (100.0%) | 0 (0.0%) |
| Total | 82 (100.0%) | 0 (0.0%) |
Educational Attainment by Field of Study in Funkstown
Business (48 | 20.9%), science & technology (47 | 20.4%), education (42 | 18.3%), engineering (29 | 12.6%), and liberal arts & history (18 | 7.8%) are the most common fields of study among 230 individuals in Funkstown who have obtained a bachelor's degree or higher.
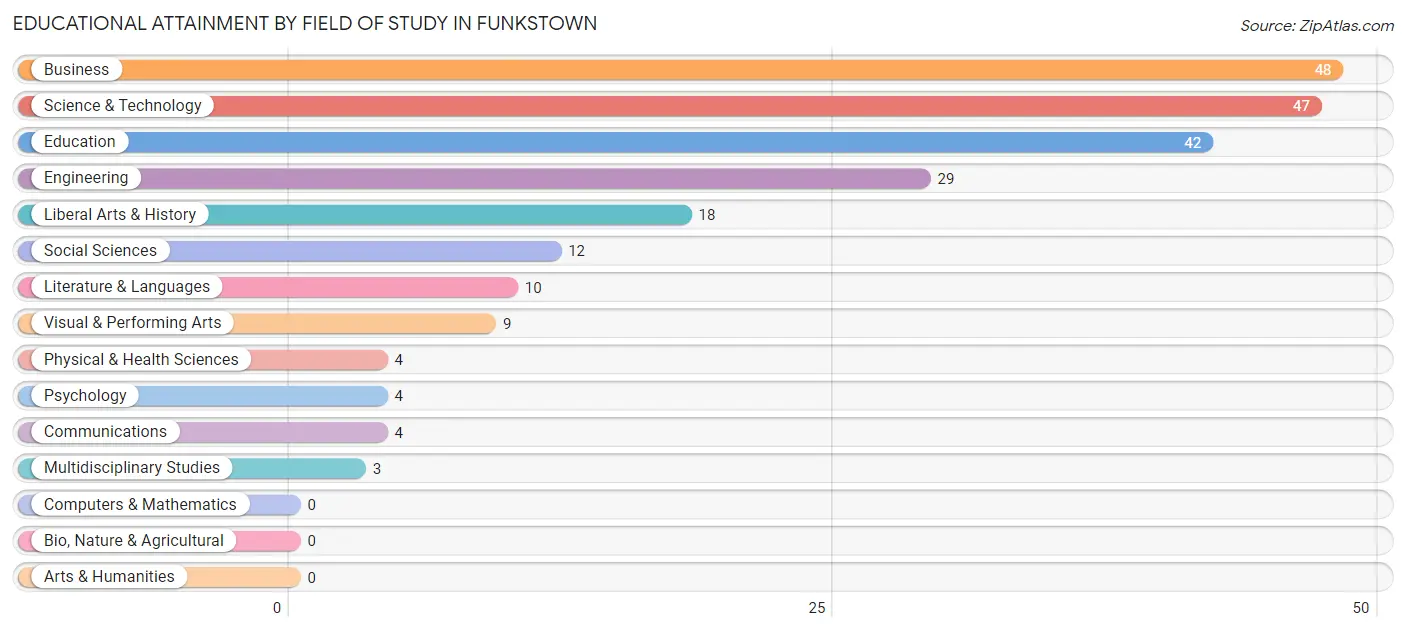
| Field of Study | # Graduates | % Graduates |
| Computers & Mathematics | 0 | 0.0% |
| Bio, Nature & Agricultural | 0 | 0.0% |
| Physical & Health Sciences | 4 | 1.7% |
| Psychology | 4 | 1.7% |
| Social Sciences | 12 | 5.2% |
| Engineering | 29 | 12.6% |
| Multidisciplinary Studies | 3 | 1.3% |
| Science & Technology | 47 | 20.4% |
| Business | 48 | 20.9% |
| Education | 42 | 18.3% |
| Literature & Languages | 10 | 4.3% |
| Liberal Arts & History | 18 | 7.8% |
| Visual & Performing Arts | 9 | 3.9% |
| Communications | 4 | 1.7% |
| Arts & Humanities | 0 | 0.0% |
| Total | 230 | 100.0% |
Transportation & Commute in Funkstown
Vehicle Availability by Sex in Funkstown
The most prevalent vehicle ownership categories in Funkstown are males with 2 vehicles (100, accounting for 37.6%) and females with 2 vehicles (81, making up 61.0%).
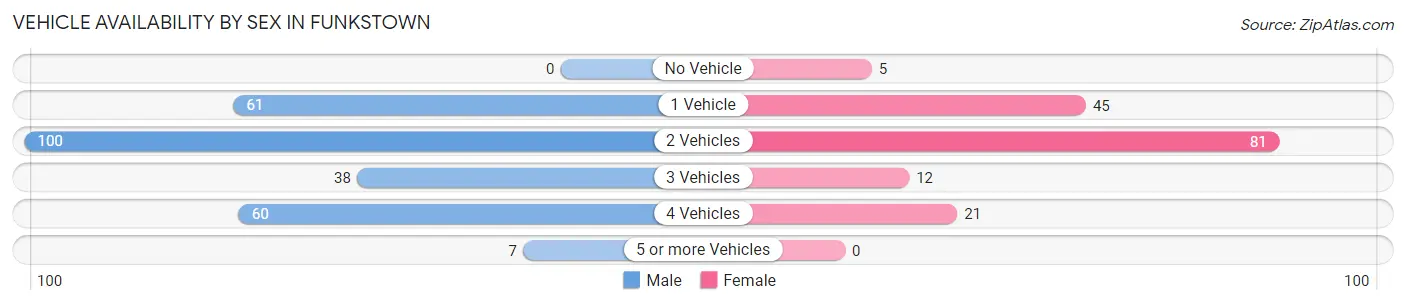
| Vehicles Available | Male | Female |
| No Vehicle | 0 (0.0%) | 5 (3.0%) |
| 1 Vehicle | 61 (22.9%) | 45 (27.4%) |
| 2 Vehicles | 100 (37.6%) | 81 (49.4%) |
| 3 Vehicles | 38 (14.3%) | 12 (7.3%) |
| 4 Vehicles | 60 (22.6%) | 21 (12.8%) |
| 5 or more Vehicles | 7 (2.6%) | 0 (0.0%) |
| Total | 266 (100.0%) | 164 (100.0%) |
Commute Time in Funkstown
The most frequently occuring commute durations in Funkstown are 5 to 9 minutes (82 commuters, 22.2%), 10 to 14 minutes (79 commuters, 21.3%), and 15 to 19 minutes (60 commuters, 16.2%).
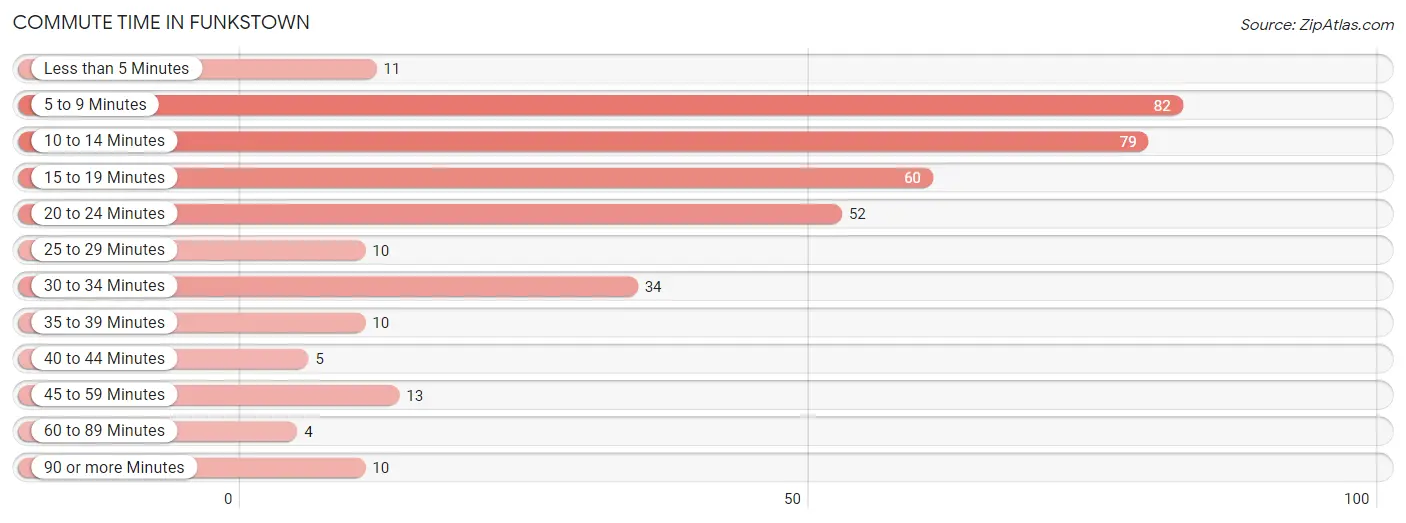
| Commute Time | # Commuters | % Commuters |
| Less than 5 Minutes | 11 | 3.0% |
| 5 to 9 Minutes | 82 | 22.2% |
| 10 to 14 Minutes | 79 | 21.3% |
| 15 to 19 Minutes | 60 | 16.2% |
| 20 to 24 Minutes | 52 | 14.1% |
| 25 to 29 Minutes | 10 | 2.7% |
| 30 to 34 Minutes | 34 | 9.2% |
| 35 to 39 Minutes | 10 | 2.7% |
| 40 to 44 Minutes | 5 | 1.3% |
| 45 to 59 Minutes | 13 | 3.5% |
| 60 to 89 Minutes | 4 | 1.1% |
| 90 or more Minutes | 10 | 2.7% |
Commute Time by Sex in Funkstown
The most common commute times in Funkstown are 10 to 14 minutes (67 commuters, 27.9%) for males and 5 to 9 minutes (52 commuters, 40.0%) for females.
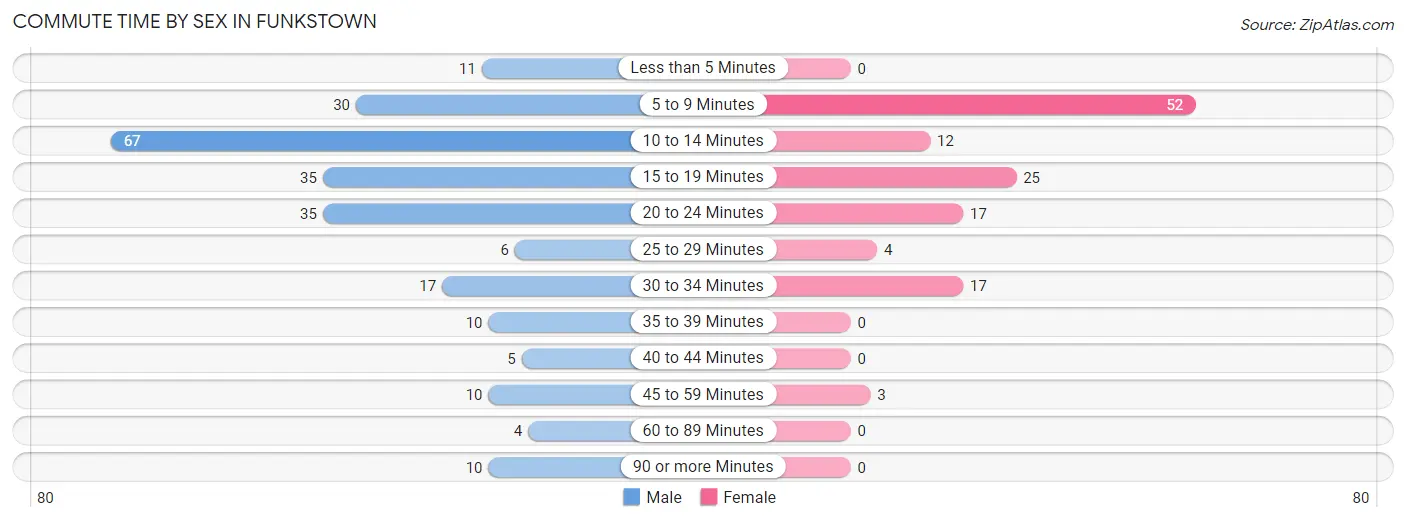
| Commute Time | Male | Female |
| Less than 5 Minutes | 11 (4.6%) | 0 (0.0%) |
| 5 to 9 Minutes | 30 (12.5%) | 52 (40.0%) |
| 10 to 14 Minutes | 67 (27.9%) | 12 (9.2%) |
| 15 to 19 Minutes | 35 (14.6%) | 25 (19.2%) |
| 20 to 24 Minutes | 35 (14.6%) | 17 (13.1%) |
| 25 to 29 Minutes | 6 (2.5%) | 4 (3.1%) |
| 30 to 34 Minutes | 17 (7.1%) | 17 (13.1%) |
| 35 to 39 Minutes | 10 (4.2%) | 0 (0.0%) |
| 40 to 44 Minutes | 5 (2.1%) | 0 (0.0%) |
| 45 to 59 Minutes | 10 (4.2%) | 3 (2.3%) |
| 60 to 89 Minutes | 4 (1.7%) | 0 (0.0%) |
| 90 or more Minutes | 10 (4.2%) | 0 (0.0%) |
Time of Departure to Work by Sex in Funkstown
The most frequent times of departure to work in Funkstown are 12:00 AM to 4:59 AM (51, 21.2%) for males and 7:30 AM to 7:59 AM (27, 20.8%) for females.
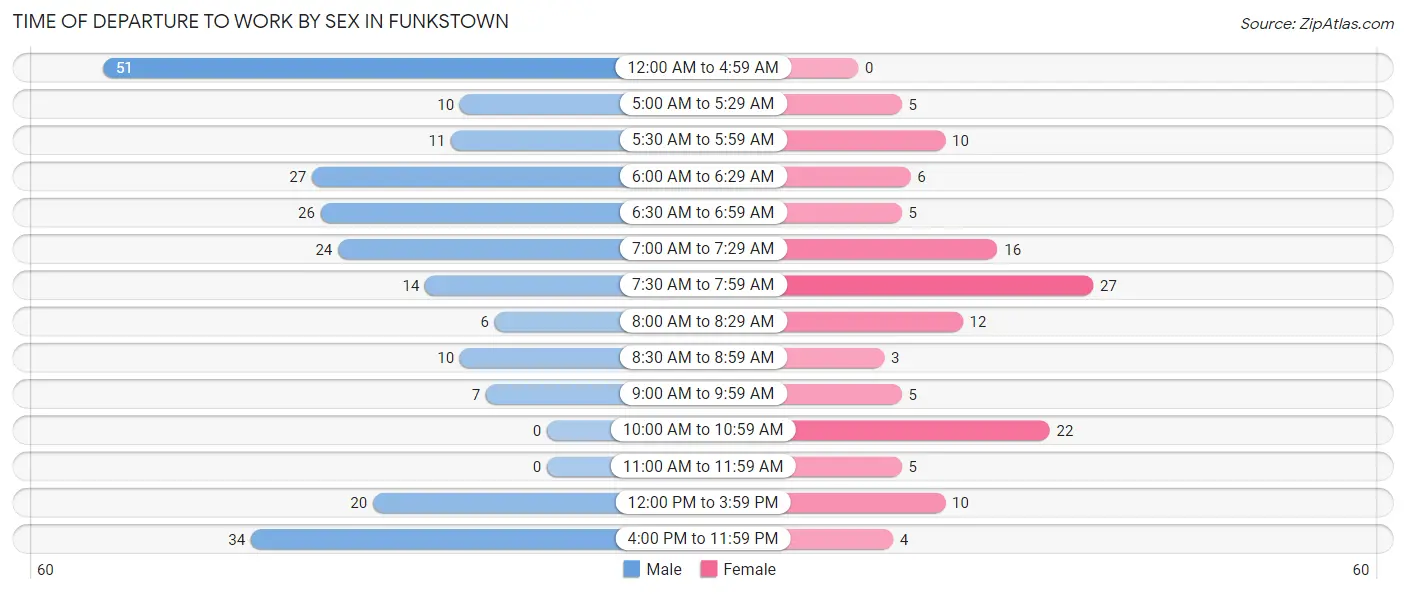
| Time of Departure | Male | Female |
| 12:00 AM to 4:59 AM | 51 (21.2%) | 0 (0.0%) |
| 5:00 AM to 5:29 AM | 10 (4.2%) | 5 (3.8%) |
| 5:30 AM to 5:59 AM | 11 (4.6%) | 10 (7.7%) |
| 6:00 AM to 6:29 AM | 27 (11.3%) | 6 (4.6%) |
| 6:30 AM to 6:59 AM | 26 (10.8%) | 5 (3.8%) |
| 7:00 AM to 7:29 AM | 24 (10.0%) | 16 (12.3%) |
| 7:30 AM to 7:59 AM | 14 (5.8%) | 27 (20.8%) |
| 8:00 AM to 8:29 AM | 6 (2.5%) | 12 (9.2%) |
| 8:30 AM to 8:59 AM | 10 (4.2%) | 3 (2.3%) |
| 9:00 AM to 9:59 AM | 7 (2.9%) | 5 (3.8%) |
| 10:00 AM to 10:59 AM | 0 (0.0%) | 22 (16.9%) |
| 11:00 AM to 11:59 AM | 0 (0.0%) | 5 (3.8%) |
| 12:00 PM to 3:59 PM | 20 (8.3%) | 10 (7.7%) |
| 4:00 PM to 11:59 PM | 34 (14.2%) | 4 (3.1%) |
| Total | 240 (100.0%) | 130 (100.0%) |
Housing Occupancy in Funkstown
Occupancy by Ownership in Funkstown
Of the total 474 dwellings in Funkstown, owner-occupied units account for 293 (61.8%), while renter-occupied units make up 181 (38.2%).
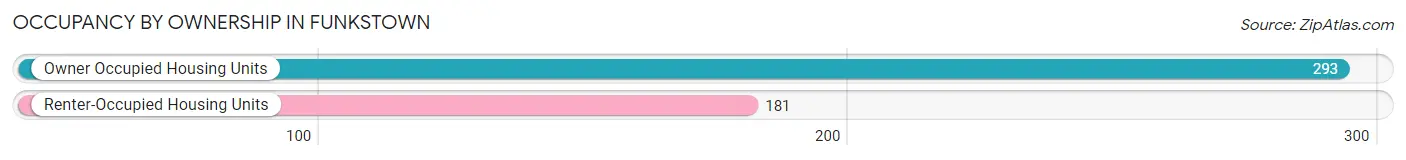
| Occupancy | # Housing Units | % Housing Units |
| Owner Occupied Housing Units | 293 | 61.8% |
| Renter-Occupied Housing Units | 181 | 38.2% |
| Total Occupied Housing Units | 474 | 100.0% |
Occupancy by Household Size in Funkstown
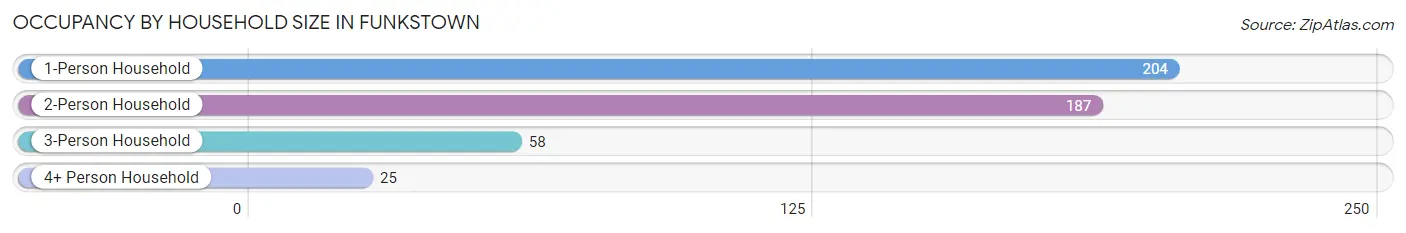
| Household Size | # Housing Units | % Housing Units |
| 1-Person Household | 204 | 43.0% |
| 2-Person Household | 187 | 39.5% |
| 3-Person Household | 58 | 12.2% |
| 4+ Person Household | 25 | 5.3% |
| Total Housing Units | 474 | 100.0% |
Occupancy by Ownership by Household Size in Funkstown
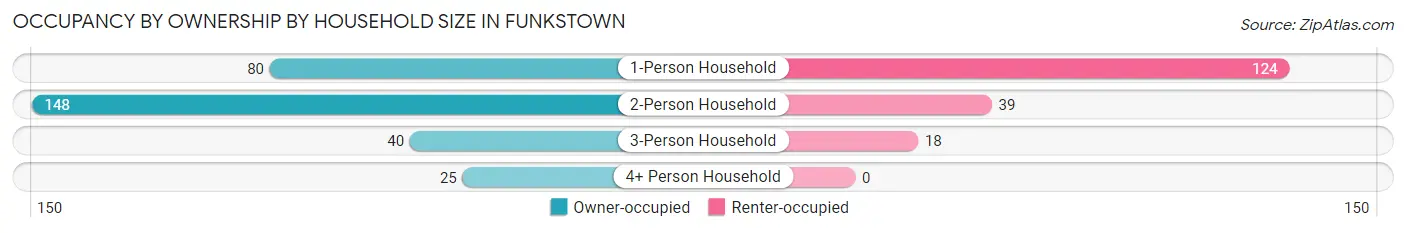
| Household Size | Owner-occupied | Renter-occupied |
| 1-Person Household | 80 (39.2%) | 124 (60.8%) |
| 2-Person Household | 148 (79.1%) | 39 (20.9%) |
| 3-Person Household | 40 (69.0%) | 18 (31.0%) |
| 4+ Person Household | 25 (100.0%) | 0 (0.0%) |
| Total Housing Units | 293 (61.8%) | 181 (38.2%) |
Occupancy by Educational Attainment in Funkstown
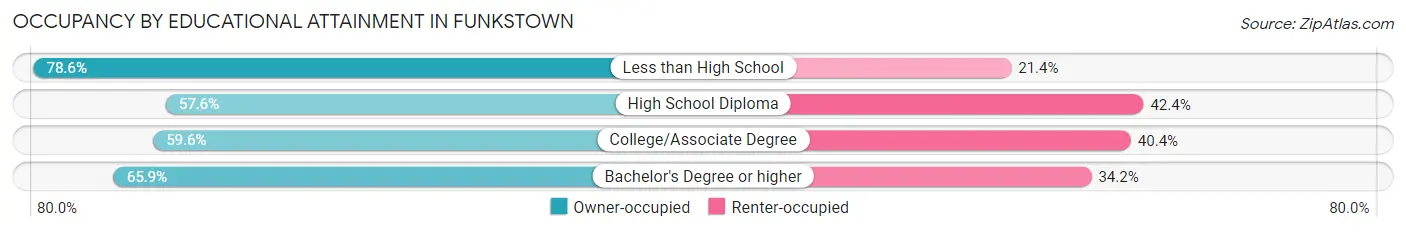
| Household Size | Owner-occupied | Renter-occupied |
| Less than High School | 22 (78.6%) | 6 (21.4%) |
| High School Diploma | 72 (57.6%) | 53 (42.4%) |
| College/Associate Degree | 118 (59.6%) | 80 (40.4%) |
| Bachelor's Degree or higher | 81 (65.8%) | 42 (34.2%) |
Occupancy by Age of Householder in Funkstown
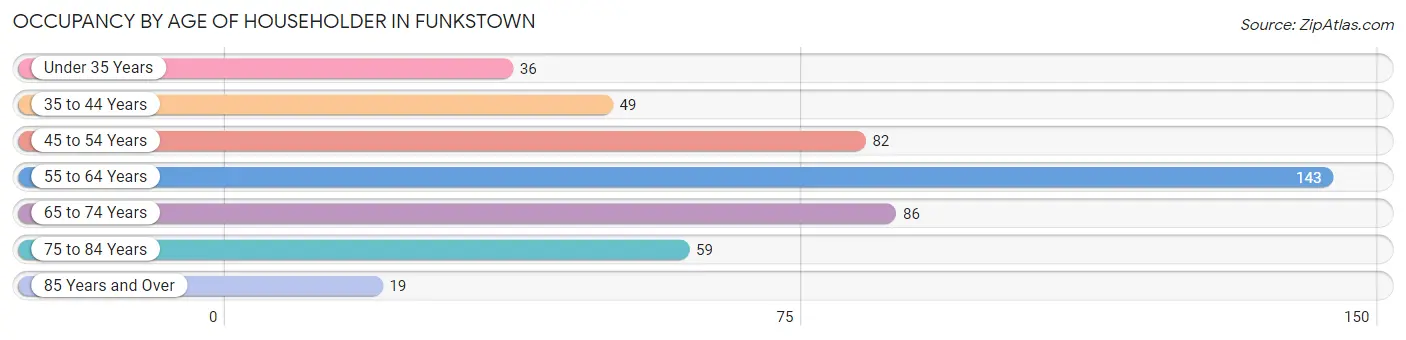
| Age Bracket | # Households | % Households |
| Under 35 Years | 36 | 7.6% |
| 35 to 44 Years | 49 | 10.3% |
| 45 to 54 Years | 82 | 17.3% |
| 55 to 64 Years | 143 | 30.2% |
| 65 to 74 Years | 86 | 18.1% |
| 75 to 84 Years | 59 | 12.4% |
| 85 Years and Over | 19 | 4.0% |
| Total | 474 | 100.0% |
Housing Finances in Funkstown
Median Income by Occupancy in Funkstown
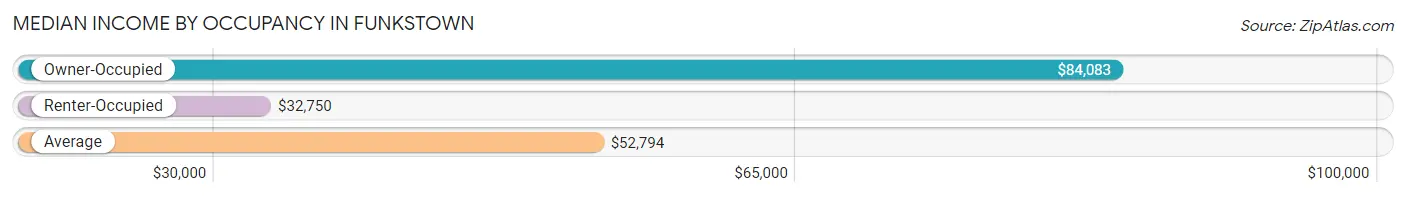
| Occupancy Type | # Households | Median Income |
| Owner-Occupied | 293 (61.8%) | $84,083 |
| Renter-Occupied | 181 (38.2%) | $32,750 |
| Average | 474 (100.0%) | $52,794 |
Occupancy by Householder Income Bracket in Funkstown
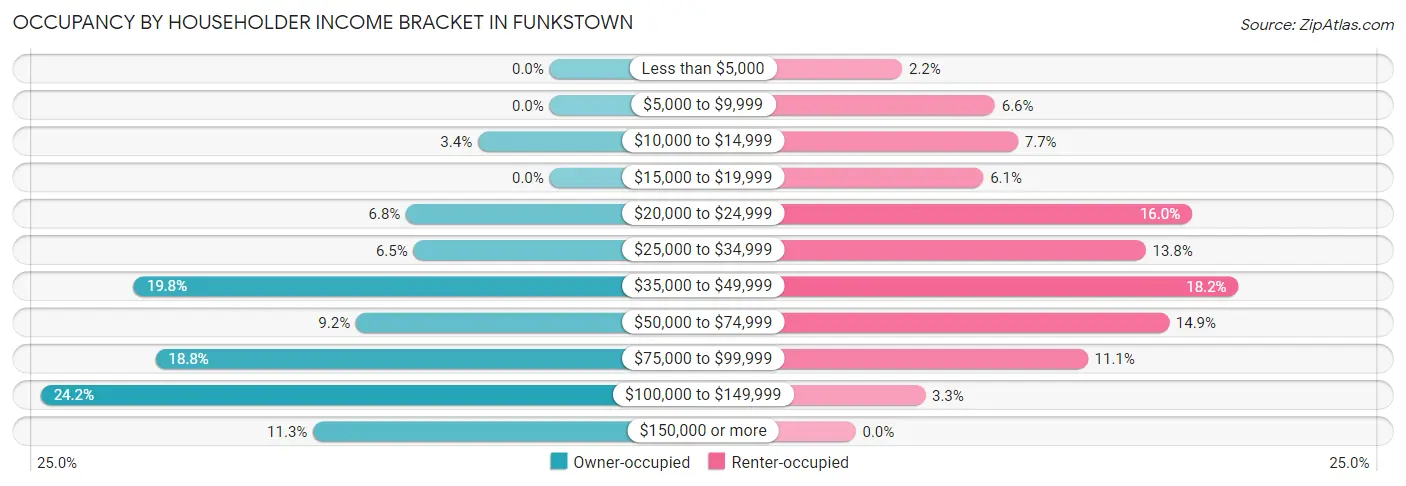
| Income Bracket | Owner-occupied | Renter-occupied |
| Less than $5,000 | 0 (0.0%) | 4 (2.2%) |
| $5,000 to $9,999 | 0 (0.0%) | 12 (6.6%) |
| $10,000 to $14,999 | 10 (3.4%) | 14 (7.7%) |
| $15,000 to $19,999 | 0 (0.0%) | 11 (6.1%) |
| $20,000 to $24,999 | 20 (6.8%) | 29 (16.0%) |
| $25,000 to $34,999 | 19 (6.5%) | 25 (13.8%) |
| $35,000 to $49,999 | 58 (19.8%) | 33 (18.2%) |
| $50,000 to $74,999 | 27 (9.2%) | 27 (14.9%) |
| $75,000 to $99,999 | 55 (18.8%) | 20 (11.1%) |
| $100,000 to $149,999 | 71 (24.2%) | 6 (3.3%) |
| $150,000 or more | 33 (11.3%) | 0 (0.0%) |
| Total | 293 (100.0%) | 181 (100.0%) |
Monthly Housing Cost Tiers in Funkstown
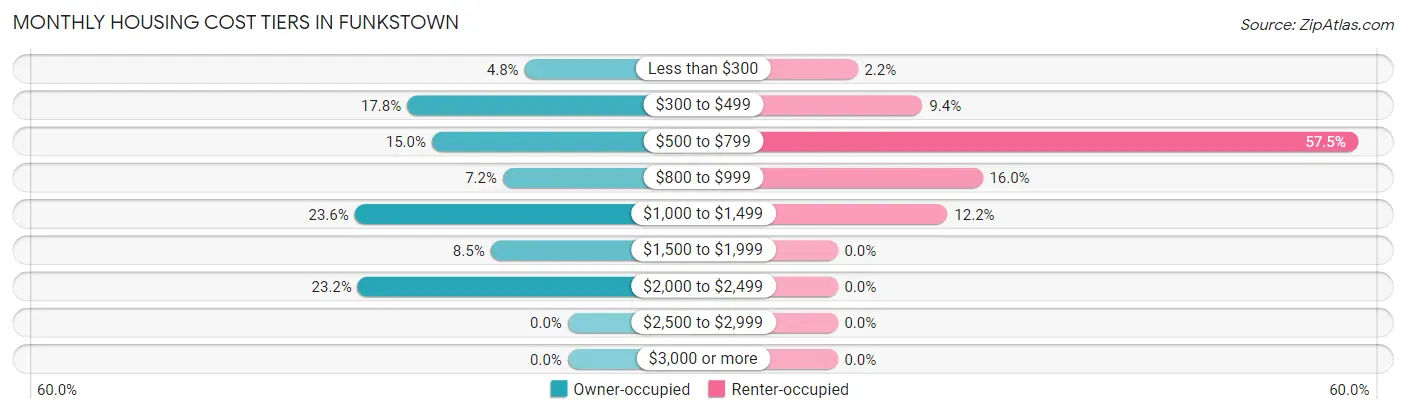
| Monthly Cost | Owner-occupied | Renter-occupied |
| Less than $300 | 14 (4.8%) | 4 (2.2%) |
| $300 to $499 | 52 (17.7%) | 17 (9.4%) |
| $500 to $799 | 44 (15.0%) | 104 (57.5%) |
| $800 to $999 | 21 (7.2%) | 29 (16.0%) |
| $1,000 to $1,499 | 69 (23.5%) | 22 (12.1%) |
| $1,500 to $1,999 | 25 (8.5%) | 0 (0.0%) |
| $2,000 to $2,499 | 68 (23.2%) | 0 (0.0%) |
| $2,500 to $2,999 | 0 (0.0%) | 0 (0.0%) |
| $3,000 or more | 0 (0.0%) | 0 (0.0%) |
| Total | 293 (100.0%) | 181 (100.0%) |
Physical Housing Characteristics in Funkstown
Housing Structures in Funkstown
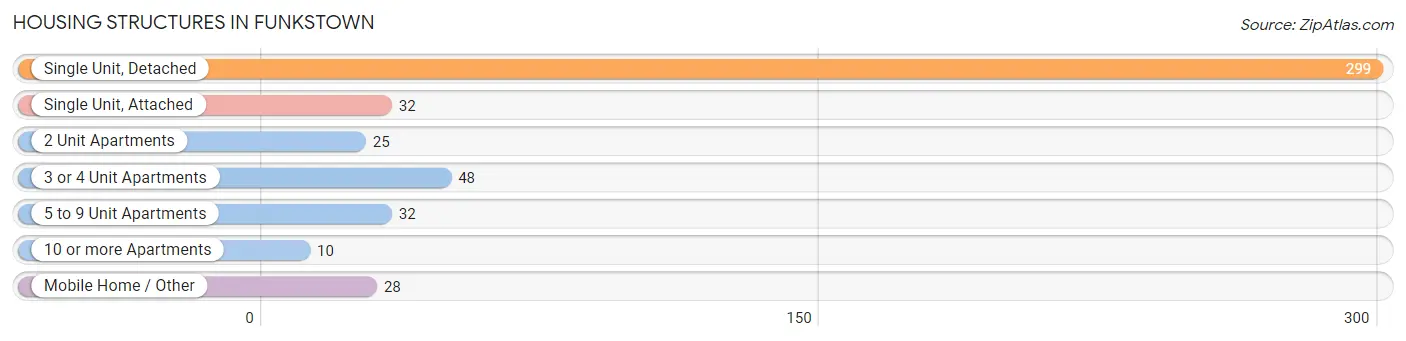
| Structure Type | # Housing Units | % Housing Units |
| Single Unit, Detached | 299 | 63.1% |
| Single Unit, Attached | 32 | 6.8% |
| 2 Unit Apartments | 25 | 5.3% |
| 3 or 4 Unit Apartments | 48 | 10.1% |
| 5 to 9 Unit Apartments | 32 | 6.8% |
| 10 or more Apartments | 10 | 2.1% |
| Mobile Home / Other | 28 | 5.9% |
| Total | 474 | 100.0% |
Housing Structures by Occupancy in Funkstown
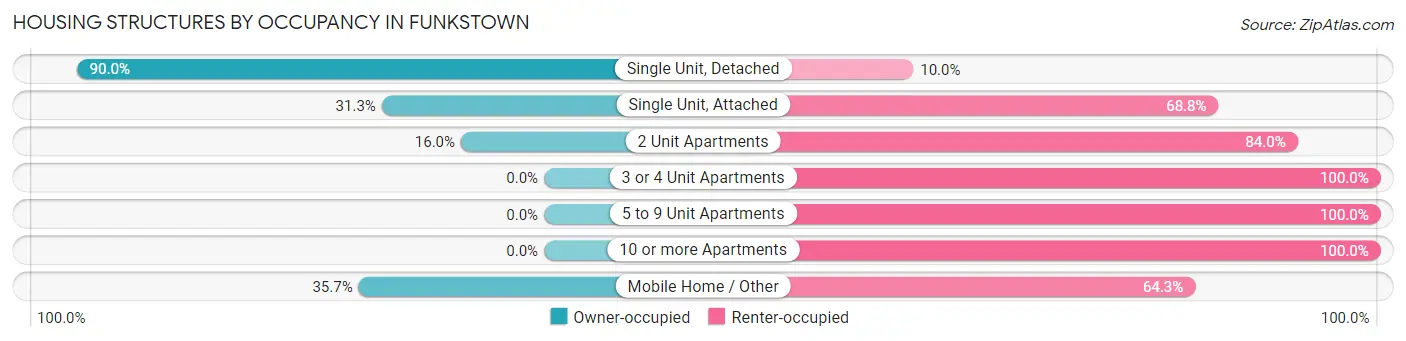
| Structure Type | Owner-occupied | Renter-occupied |
| Single Unit, Detached | 269 (90.0%) | 30 (10.0%) |
| Single Unit, Attached | 10 (31.2%) | 22 (68.8%) |
| 2 Unit Apartments | 4 (16.0%) | 21 (84.0%) |
| 3 or 4 Unit Apartments | 0 (0.0%) | 48 (100.0%) |
| 5 to 9 Unit Apartments | 0 (0.0%) | 32 (100.0%) |
| 10 or more Apartments | 0 (0.0%) | 10 (100.0%) |
| Mobile Home / Other | 10 (35.7%) | 18 (64.3%) |
| Total | 293 (61.8%) | 181 (38.2%) |
Housing Structures by Number of Rooms in Funkstown
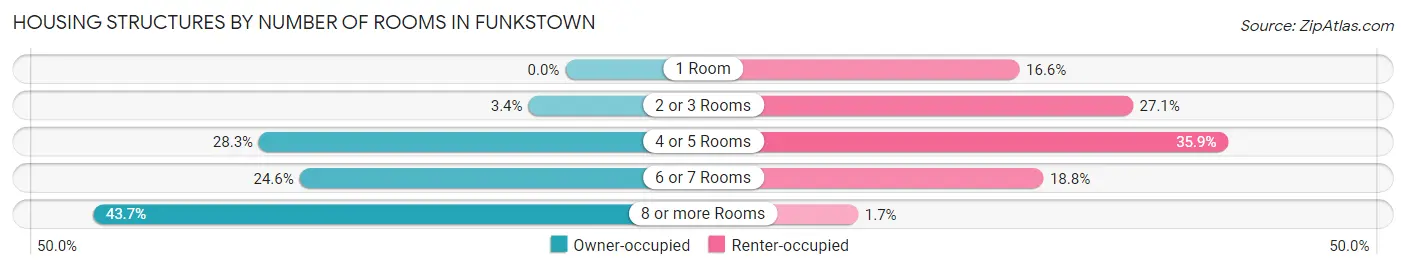
| Number of Rooms | Owner-occupied | Renter-occupied |
| 1 Room | 0 (0.0%) | 30 (16.6%) |
| 2 or 3 Rooms | 10 (3.4%) | 49 (27.1%) |
| 4 or 5 Rooms | 83 (28.3%) | 65 (35.9%) |
| 6 or 7 Rooms | 72 (24.6%) | 34 (18.8%) |
| 8 or more Rooms | 128 (43.7%) | 3 (1.7%) |
| Total | 293 (100.0%) | 181 (100.0%) |
Housing Structure by Heating Type in Funkstown
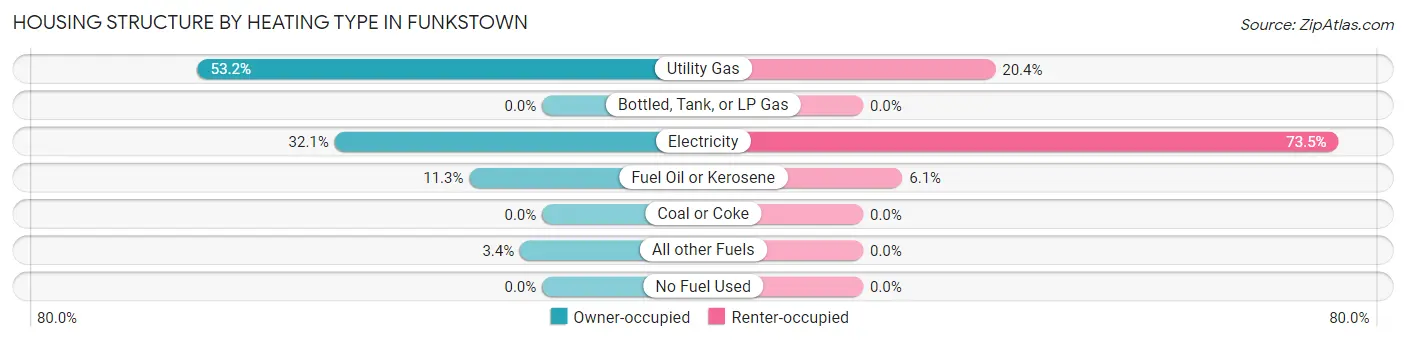
| Heating Type | Owner-occupied | Renter-occupied |
| Utility Gas | 156 (53.2%) | 37 (20.4%) |
| Bottled, Tank, or LP Gas | 0 (0.0%) | 0 (0.0%) |
| Electricity | 94 (32.1%) | 133 (73.5%) |
| Fuel Oil or Kerosene | 33 (11.3%) | 11 (6.1%) |
| Coal or Coke | 0 (0.0%) | 0 (0.0%) |
| All other Fuels | 10 (3.4%) | 0 (0.0%) |
| No Fuel Used | 0 (0.0%) | 0 (0.0%) |
| Total | 293 (100.0%) | 181 (100.0%) |
Household Vehicle Usage in Funkstown
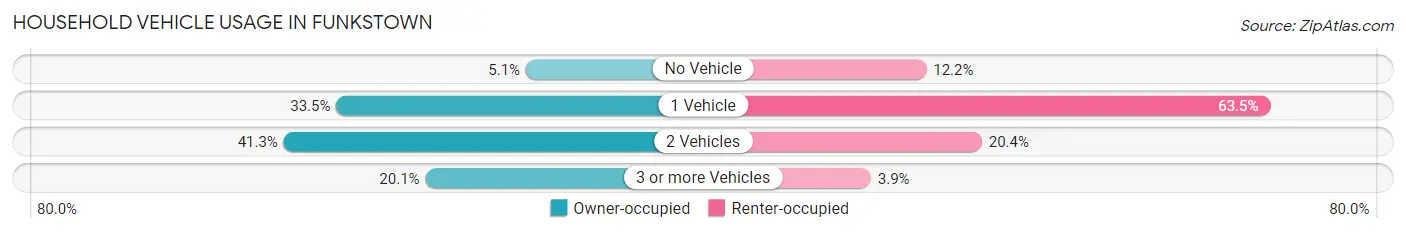
| Vehicles per Household | Owner-occupied | Renter-occupied |
| No Vehicle | 15 (5.1%) | 22 (12.1%) |
| 1 Vehicle | 98 (33.5%) | 115 (63.5%) |
| 2 Vehicles | 121 (41.3%) | 37 (20.4%) |
| 3 or more Vehicles | 59 (20.1%) | 7 (3.9%) |
| Total | 293 (100.0%) | 181 (100.0%) |
Real Estate & Mortgages in Funkstown
Real Estate and Mortgage Overview in Funkstown
| Characteristic | Without Mortgage | With Mortgage |
| Housing Units | 84 | 209 |
| Median Property Value | $178,600 | $252,900 |
| Median Household Income | $51,250 | $33 |
| Monthly Housing Costs | $435 | $0 |
| Real Estate Taxes | $2,060 | $0 |
Property Value by Mortgage Status in Funkstown
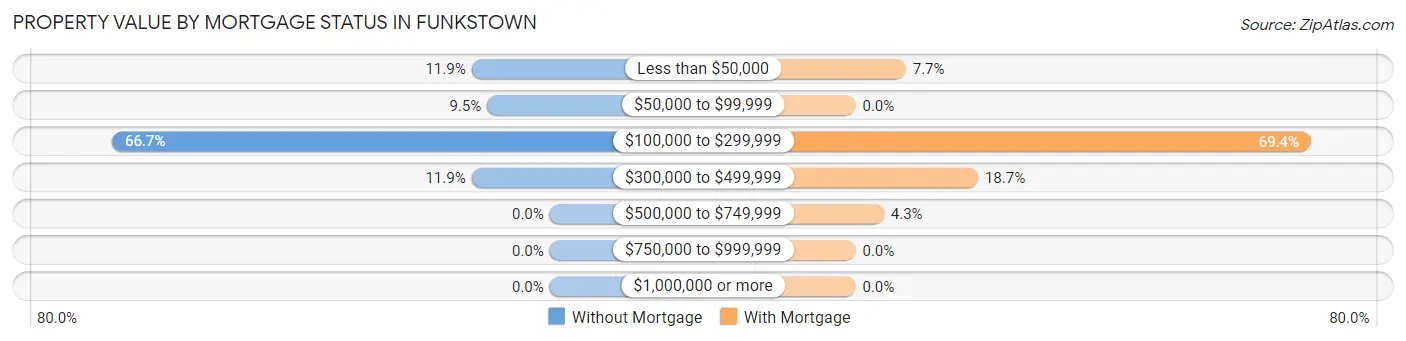
| Property Value | Without Mortgage | With Mortgage |
| Less than $50,000 | 10 (11.9%) | 16 (7.7%) |
| $50,000 to $99,999 | 8 (9.5%) | 0 (0.0%) |
| $100,000 to $299,999 | 56 (66.7%) | 145 (69.4%) |
| $300,000 to $499,999 | 10 (11.9%) | 39 (18.7%) |
| $500,000 to $749,999 | 0 (0.0%) | 9 (4.3%) |
| $750,000 to $999,999 | 0 (0.0%) | 0 (0.0%) |
| $1,000,000 or more | 0 (0.0%) | 0 (0.0%) |
| Total | 84 (100.0%) | 209 (100.0%) |
Household Income by Mortgage Status in Funkstown
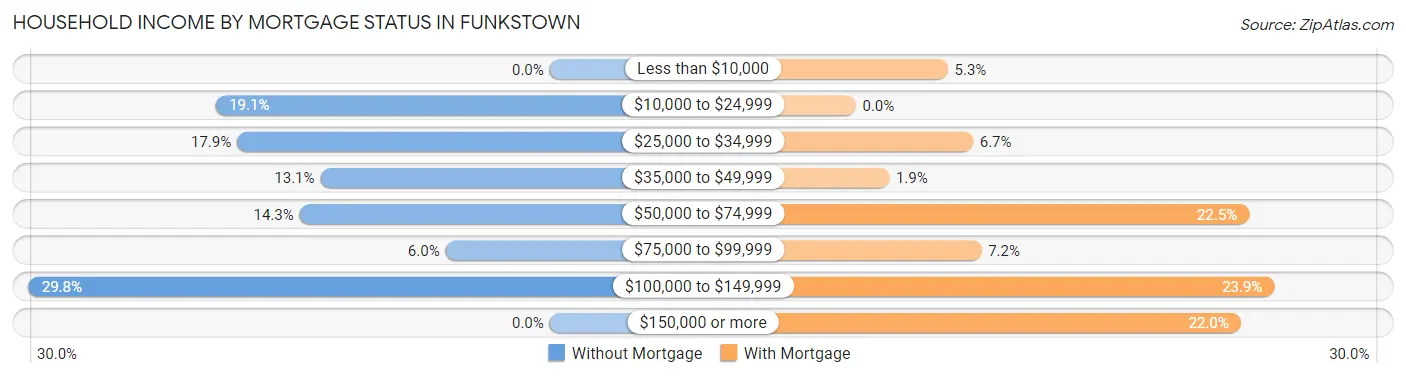
| Household Income | Without Mortgage | With Mortgage |
| Less than $10,000 | 0 (0.0%) | 11 (5.3%) |
| $10,000 to $24,999 | 16 (19.1%) | 0 (0.0%) |
| $25,000 to $34,999 | 15 (17.9%) | 14 (6.7%) |
| $35,000 to $49,999 | 11 (13.1%) | 4 (1.9%) |
| $50,000 to $74,999 | 12 (14.3%) | 47 (22.5%) |
| $75,000 to $99,999 | 5 (5.9%) | 15 (7.2%) |
| $100,000 to $149,999 | 25 (29.8%) | 50 (23.9%) |
| $150,000 or more | 0 (0.0%) | 46 (22.0%) |
| Total | 84 (100.0%) | 209 (100.0%) |
Property Value to Household Income Ratio in Funkstown
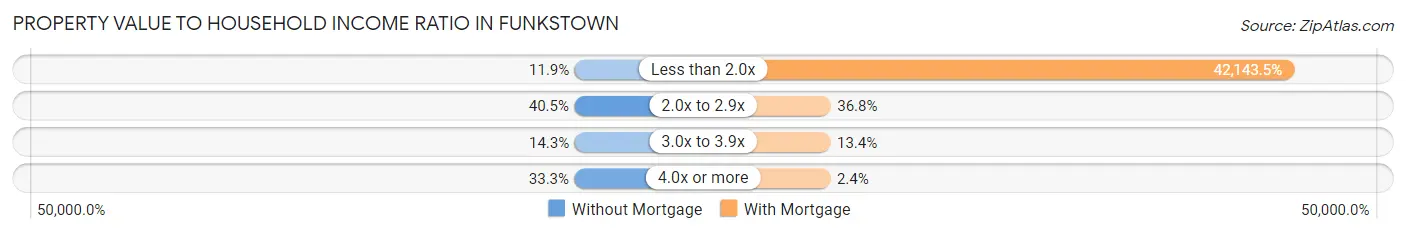
| Value-to-Income Ratio | Without Mortgage | With Mortgage |
| Less than 2.0x | 10 (11.9%) | 88,080 (42,143.5%) |
| 2.0x to 2.9x | 34 (40.5%) | 77 (36.8%) |
| 3.0x to 3.9x | 12 (14.3%) | 28 (13.4%) |
| 4.0x or more | 28 (33.3%) | 5 (2.4%) |
| Total | 84 (100.0%) | 209 (100.0%) |
Real Estate Taxes by Mortgage Status in Funkstown
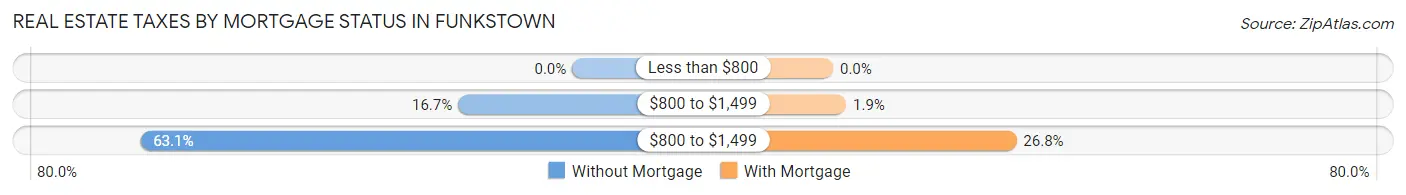
| Property Taxes | Without Mortgage | With Mortgage |
| Less than $800 | 0 (0.0%) | 0 (0.0%) |
| $800 to $1,499 | 14 (16.7%) | 4 (1.9%) |
| $800 to $1,499 | 53 (63.1%) | 56 (26.8%) |
| Total | 84 (100.0%) | 209 (100.0%) |
Health & Disability in Funkstown
Health Insurance Coverage by Age in Funkstown
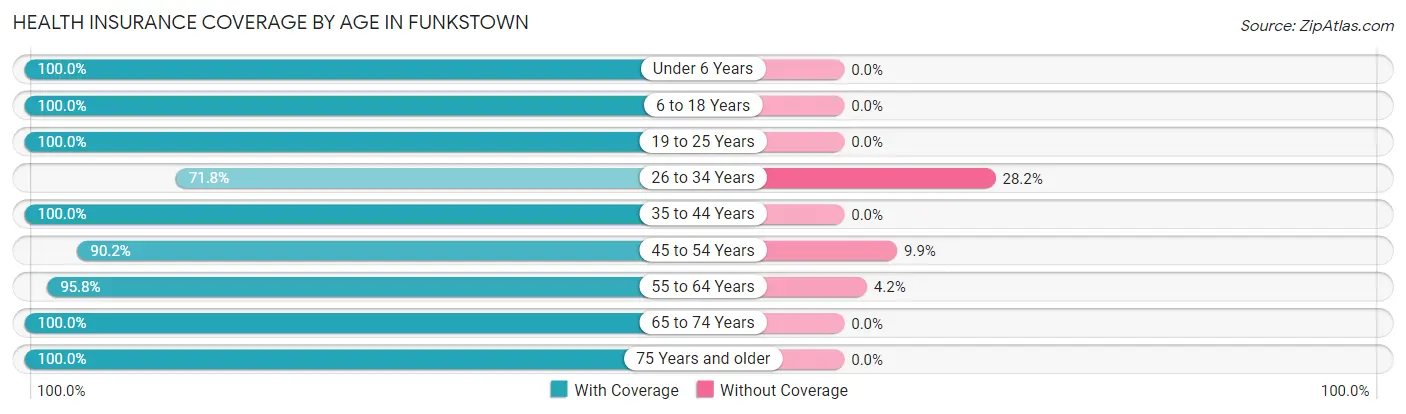
| Age Bracket | With Coverage | Without Coverage |
| Under 6 Years | 19 (100.0%) | 0 (0.0%) |
| 6 to 18 Years | 56 (100.0%) | 0 (0.0%) |
| 19 to 25 Years | 50 (100.0%) | 0 (0.0%) |
| 26 to 34 Years | 28 (71.8%) | 11 (28.2%) |
| 35 to 44 Years | 78 (100.0%) | 0 (0.0%) |
| 45 to 54 Years | 119 (90.1%) | 13 (9.9%) |
| 55 to 64 Years | 227 (95.8%) | 10 (4.2%) |
| 65 to 74 Years | 147 (100.0%) | 0 (0.0%) |
| 75 Years and older | 103 (100.0%) | 0 (0.0%) |
| Total | 827 (96.1%) | 34 (4.0%) |
Health Insurance Coverage by Citizenship Status in Funkstown
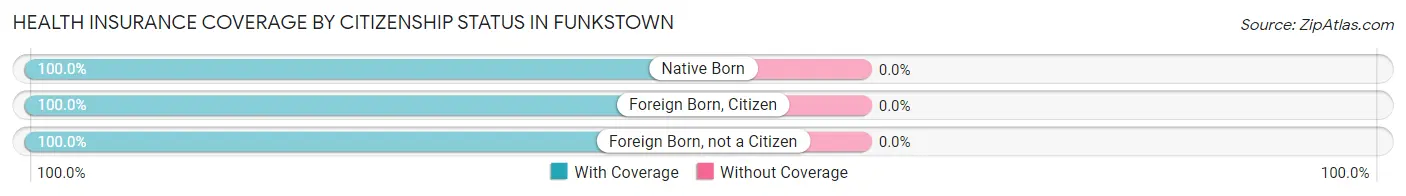
| Citizenship Status | With Coverage | Without Coverage |
| Native Born | 19 (100.0%) | 0 (0.0%) |
| Foreign Born, Citizen | 56 (100.0%) | 0 (0.0%) |
| Foreign Born, not a Citizen | 50 (100.0%) | 0 (0.0%) |
Health Insurance Coverage by Household Income in Funkstown
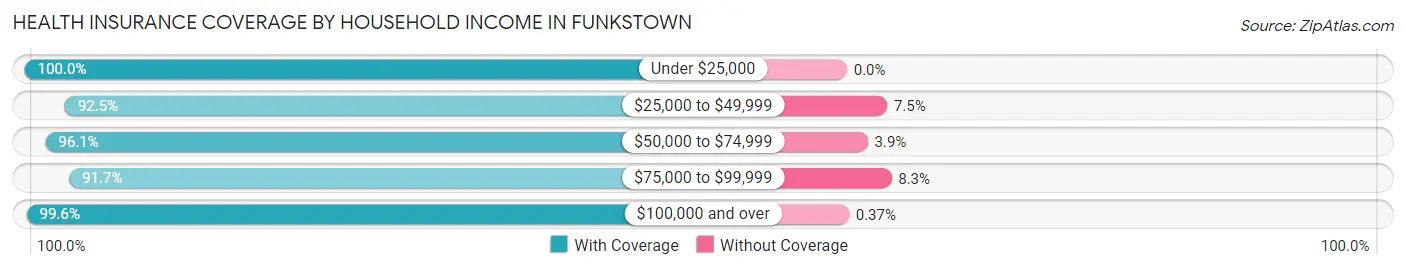
| Household Income | With Coverage | Without Coverage |
| Under $25,000 | 108 (100.0%) | 0 (0.0%) |
| $25,000 to $49,999 | 209 (92.5%) | 17 (7.5%) |
| $50,000 to $74,999 | 74 (96.1%) | 3 (3.9%) |
| $75,000 to $99,999 | 143 (91.7%) | 13 (8.3%) |
| $100,000 and over | 272 (99.6%) | 1 (0.4%) |
Public vs Private Health Insurance Coverage by Age in Funkstown
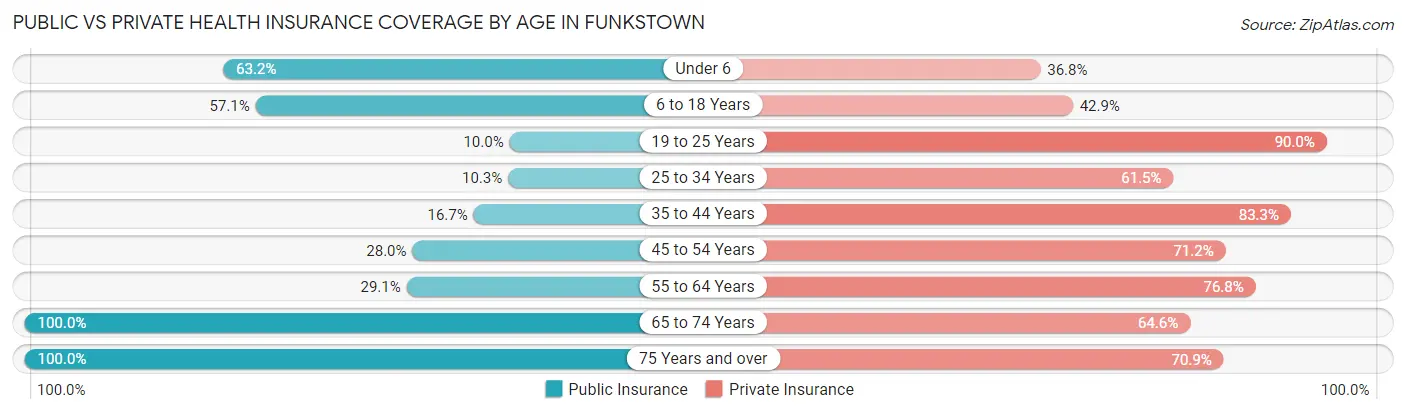
| Age Bracket | Public Insurance | Private Insurance |
| Under 6 | 12 (63.2%) | 7 (36.8%) |
| 6 to 18 Years | 32 (57.1%) | 24 (42.9%) |
| 19 to 25 Years | 5 (10.0%) | 45 (90.0%) |
| 25 to 34 Years | 4 (10.3%) | 24 (61.5%) |
| 35 to 44 Years | 13 (16.7%) | 65 (83.3%) |
| 45 to 54 Years | 37 (28.0%) | 94 (71.2%) |
| 55 to 64 Years | 69 (29.1%) | 182 (76.8%) |
| 65 to 74 Years | 147 (100.0%) | 95 (64.6%) |
| 75 Years and over | 103 (100.0%) | 73 (70.9%) |
| Total | 422 (49.0%) | 609 (70.7%) |
Disability Status by Sex by Age in Funkstown
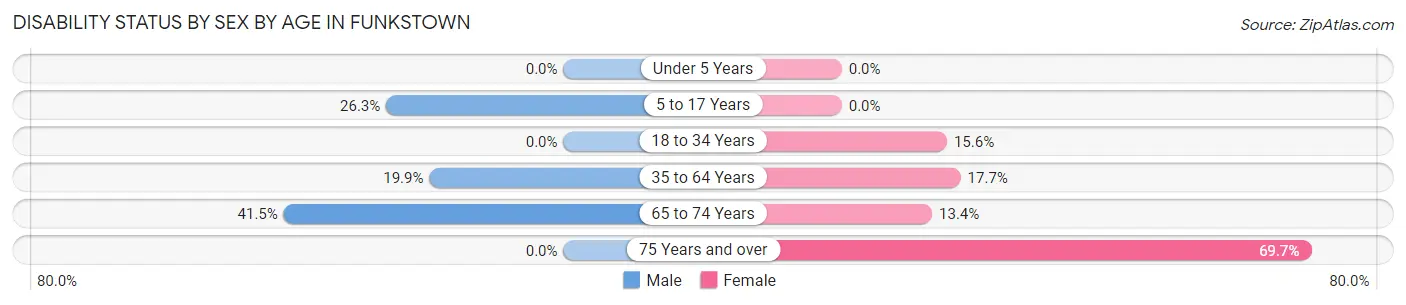
| Age Bracket | Male | Female |
| Under 5 Years | 0 (0.0%) | 0 (0.0%) |
| 5 to 17 Years | 5 (26.3%) | 0 (0.0%) |
| 18 to 34 Years | 0 (0.0%) | 5 (15.6%) |
| 35 to 64 Years | 45 (19.9%) | 39 (17.6%) |
| 65 to 74 Years | 27 (41.5%) | 11 (13.4%) |
| 75 Years and over | 0 (0.0%) | 46 (69.7%) |
Disability Class by Sex by Age in Funkstown
Disability Class: Hearing Difficulty
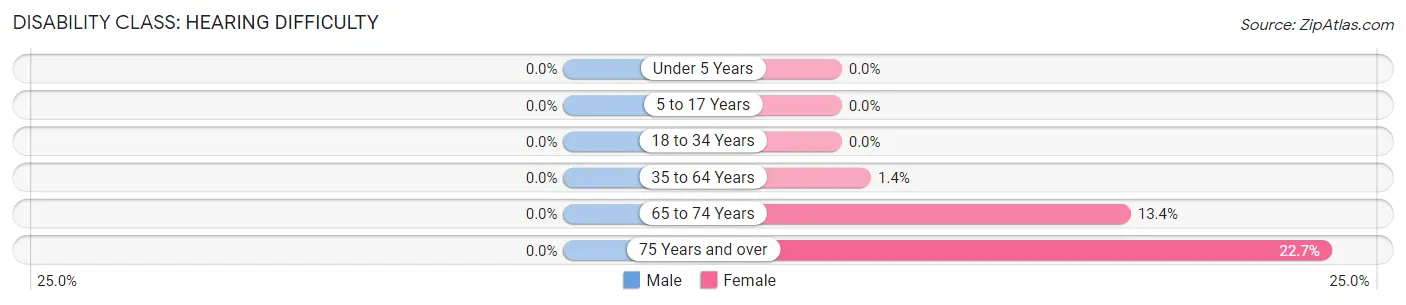
| Age Bracket | Male | Female |
| Under 5 Years | 0 (0.0%) | 0 (0.0%) |
| 5 to 17 Years | 0 (0.0%) | 0 (0.0%) |
| 18 to 34 Years | 0 (0.0%) | 0 (0.0%) |
| 35 to 64 Years | 0 (0.0%) | 3 (1.4%) |
| 65 to 74 Years | 0 (0.0%) | 11 (13.4%) |
| 75 Years and over | 0 (0.0%) | 15 (22.7%) |
Disability Class: Vision Difficulty
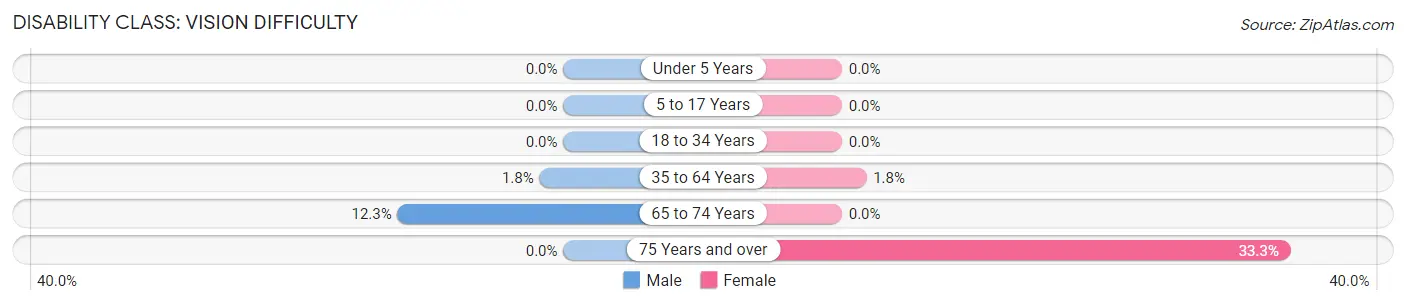
| Age Bracket | Male | Female |
| Under 5 Years | 0 (0.0%) | 0 (0.0%) |
| 5 to 17 Years | 0 (0.0%) | 0 (0.0%) |
| 18 to 34 Years | 0 (0.0%) | 0 (0.0%) |
| 35 to 64 Years | 4 (1.8%) | 4 (1.8%) |
| 65 to 74 Years | 8 (12.3%) | 0 (0.0%) |
| 75 Years and over | 0 (0.0%) | 22 (33.3%) |
Disability Class: Cognitive Difficulty
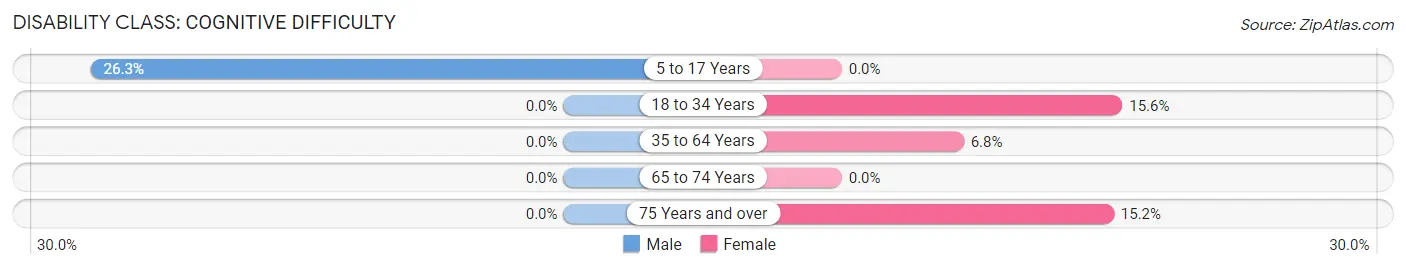
| Age Bracket | Male | Female |
| 5 to 17 Years | 5 (26.3%) | 0 (0.0%) |
| 18 to 34 Years | 0 (0.0%) | 5 (15.6%) |
| 35 to 64 Years | 0 (0.0%) | 15 (6.8%) |
| 65 to 74 Years | 0 (0.0%) | 0 (0.0%) |
| 75 Years and over | 0 (0.0%) | 10 (15.1%) |
Disability Class: Ambulatory Difficulty
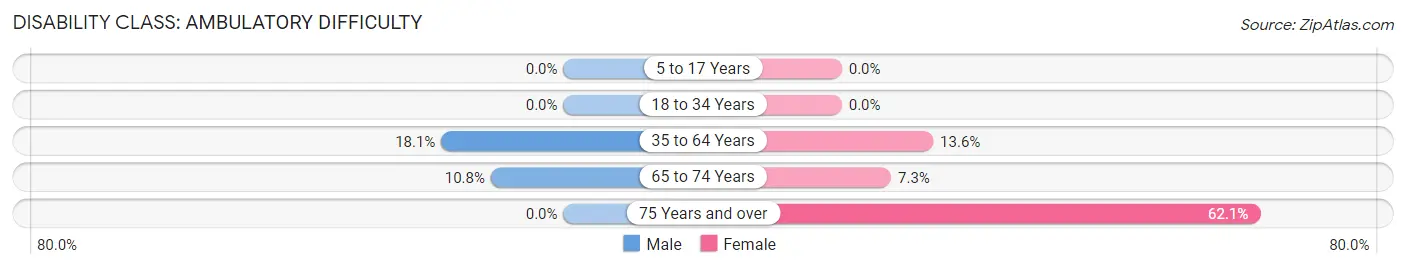
| Age Bracket | Male | Female |
| 5 to 17 Years | 0 (0.0%) | 0 (0.0%) |
| 18 to 34 Years | 0 (0.0%) | 0 (0.0%) |
| 35 to 64 Years | 41 (18.1%) | 30 (13.6%) |
| 65 to 74 Years | 7 (10.8%) | 6 (7.3%) |
| 75 Years and over | 0 (0.0%) | 41 (62.1%) |
Disability Class: Self-Care Difficulty
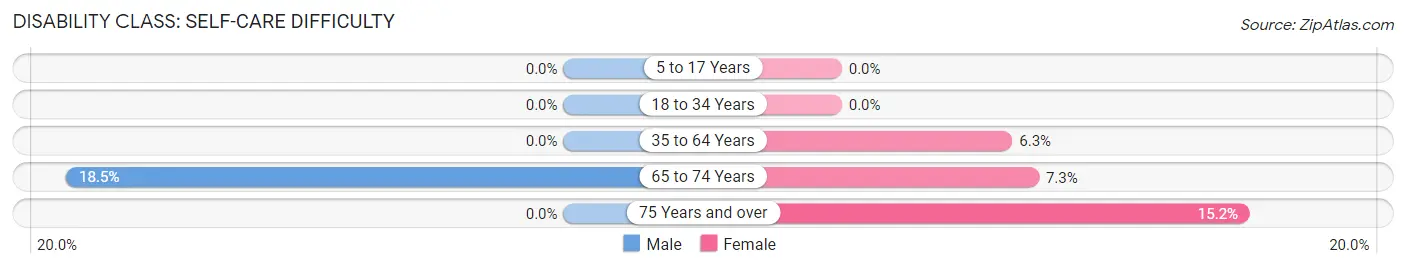
| Age Bracket | Male | Female |
| 5 to 17 Years | 0 (0.0%) | 0 (0.0%) |
| 18 to 34 Years | 0 (0.0%) | 0 (0.0%) |
| 35 to 64 Years | 0 (0.0%) | 14 (6.3%) |
| 65 to 74 Years | 12 (18.5%) | 6 (7.3%) |
| 75 Years and over | 0 (0.0%) | 10 (15.1%) |
Technology Access in Funkstown
Computing Device Access in Funkstown
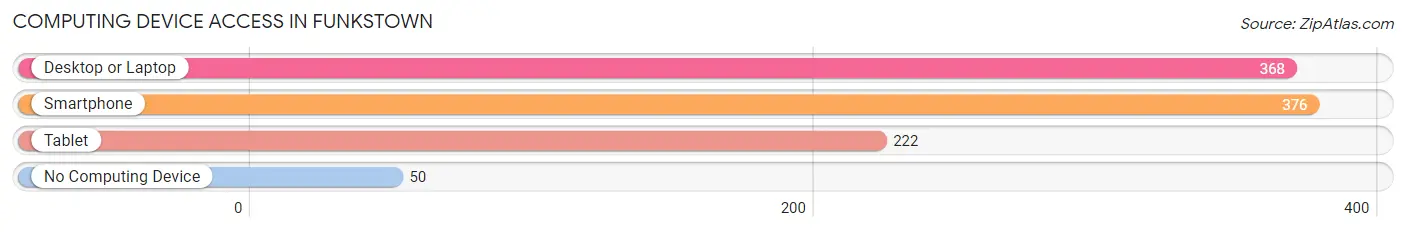
| Device Type | # Households | % Households |
| Desktop or Laptop | 368 | 77.6% |
| Smartphone | 376 | 79.3% |
| Tablet | 222 | 46.8% |
| No Computing Device | 50 | 10.5% |
| Total | 474 | 100.0% |
Internet Access in Funkstown
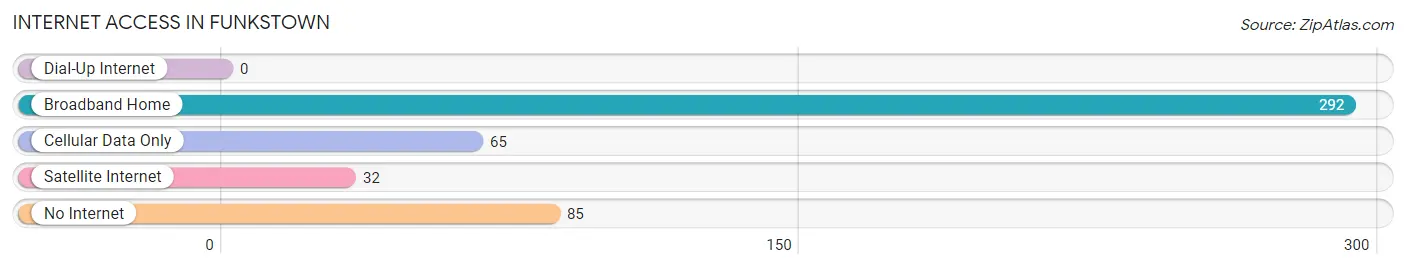
| Internet Type | # Households | % Households |
| Dial-Up Internet | 0 | 0.0% |
| Broadband Home | 292 | 61.6% |
| Cellular Data Only | 65 | 13.7% |
| Satellite Internet | 32 | 6.8% |
| No Internet | 85 | 17.9% |
| Total | 474 | 100.0% |
Funkstown Summary
Funkstown, Maryland is a small town located in Washington County, Maryland. It is situated along the Antietam Creek, approximately seven miles northwest of Hagerstown. The town was founded in 1762 by German immigrant Jacob Funk and is one of the oldest towns in the county. The town has a population of 1,717 as of the 2010 census.
History
Funkstown was founded in 1762 by German immigrant Jacob Funk. He purchased the land from the local Native Americans and established a trading post. The town was originally known as Funk’s Town, but the name was changed to Funkstown in 1814. The town was an important stop on the National Road, which was the first federally funded highway in the United States. The road was built in the early 19th century and connected Cumberland, Maryland to Vandalia, Illinois.
Funkstown was an important stop on the Underground Railroad, which was a network of secret routes and safe houses used by African-American slaves to escape to freedom in the northern United States and Canada. The town was also the site of a Civil War battle in July 1863. The Battle of Funkstown was a Confederate victory and resulted in the death of Union General John Sedgwick.
Geography
Funkstown is located in Washington County, Maryland. It is situated along the Antietam Creek, approximately seven miles northwest of Hagerstown. The town has a total area of 0.7 square miles, all of which is land. The town is located in the Appalachian Mountains and is surrounded by rolling hills and farmland.
Economy
Funkstown’s economy is largely based on agriculture and manufacturing. The town is home to several small businesses, including a grocery store, a hardware store, and a restaurant. The town is also home to several small farms, which produce a variety of crops, including corn, soybeans, and hay.
The town is also home to several manufacturing companies, including a furniture manufacturer, a printing company, and a metal fabrication company. The town is also home to a number of small retail stores, including a gift shop, a clothing store, and a jewelry store.
Demographics
As of the 2010 census, Funkstown had a population of 1,717. The racial makeup of the town was 94.3% White, 2.2% African American, 0.3% Native American, 0.7% Asian, 0.1% Pacific Islander, 0.7% from other races, and 1.7% from two or more races. Hispanic or Latino of any race were 2.2% of the population.
The median income for a household in the town was $45,938, and the median income for a family was $51,250. The per capita income for the town was $20,945. About 8.2% of families and 10.2% of the population were below the poverty line, including 14.2% of those under age 18 and 8.3% of those age 65 or over.
Funkstown is a small town with a rich history and a vibrant economy. The town is home to a variety of businesses and industries, and its population is diverse and growing. The town is a great place to live, work, and raise a family.
Common Questions
What is Per Capita Income in Funkstown?
Per Capita income in Funkstown is $38,458.
What is the Median Family Income in Funkstown?
Median Family Income in Funkstown is $88,973.
What is the Median Household income in Funkstown?
Median Household Income in Funkstown is $52,794.
What is Income or Wage Gap in Funkstown?
Income or Wage Gap in Funkstown is 30.4%.
Women in Funkstown earn 69.6 cents for every dollar earned by a man.
What is Inequality or Gini Index in Funkstown?
Inequality or Gini Index in Funkstown is 0.40.
What is the Total Population of Funkstown?
Total Population of Funkstown is 861.
What is the Total Male Population of Funkstown?
Total Male Population of Funkstown is 433.
What is the Total Female Population of Funkstown?
Total Female Population of Funkstown is 428.
What is the Ratio of Males per 100 Females in Funkstown?
There are 101.17 Males per 100 Females in Funkstown.
What is the Ratio of Females per 100 Males in Funkstown?
There are 98.85 Females per 100 Males in Funkstown.
What is the Median Population Age in Funkstown?
Median Population Age in Funkstown is 59.1 Years.
What is the Average Family Size in Funkstown
Average Family Size in Funkstown is 2.3 People.
What is the Average Household Size in Funkstown
Average Household Size in Funkstown is 1.8 People.
How Large is the Labor Force in Funkstown?
There are 449 People in the Labor Forcein in Funkstown.
What is the Percentage of People in the Labor Force in Funkstown?
53.9% of People are in the Labor Force in Funkstown.
What is the Unemployment Rate in Funkstown?
Unemployment Rate in Funkstown is 4.2%.