Sykesville, MD Map & Demographics
Sykesville Map
Sykesville Overview
$48,450
PER CAPITA INCOME
$133,542
AVG FAMILY INCOME
$126,941
AVG HOUSEHOLD INCOME
20.3%
WAGE / INCOME GAP [ % ]
79.7¢/ $1
WAGE / INCOME GAP [ $ ]
0.37
INEQUALITY / GINI INDEX
4,305
TOTAL POPULATION
2,158
MALE POPULATION
2,147
FEMALE POPULATION
100.51
MALES / 100 FEMALES
99.49
FEMALES / 100 MALES
34.9
MEDIAN AGE
3.5
AVG FAMILY SIZE
3.0
AVG HOUSEHOLD SIZE
2,348
LABOR FORCE [ PEOPLE ]
71.5%
PERCENT IN LABOR FORCE
1.7%
UNEMPLOYMENT RATE
Sykesville Zip Codes
Income in Sykesville
Income Overview in Sykesville
Per Capita Income in Sykesville is $48,450, while median incomes of families and households are $133,542 and $126,941 respectively.
| Characteristic | Number | Measure |
| Per Capita Income | 4,305 | $48,450 |
| Median Family Income | 1,069 | $133,542 |
| Mean Family Income | 1,069 | $174,591 |
| Median Household Income | 1,409 | $126,941 |
| Mean Household Income | 1,409 | $149,121 |
| Income Deficit | 1,069 | $0 |
| Wage / Income Gap (%) | 4,305 | 20.30% |
| Wage / Income Gap ($) | 4,305 | 79.70¢ per $1 |
| Gini / Inequality Index | 4,305 | 0.37 |
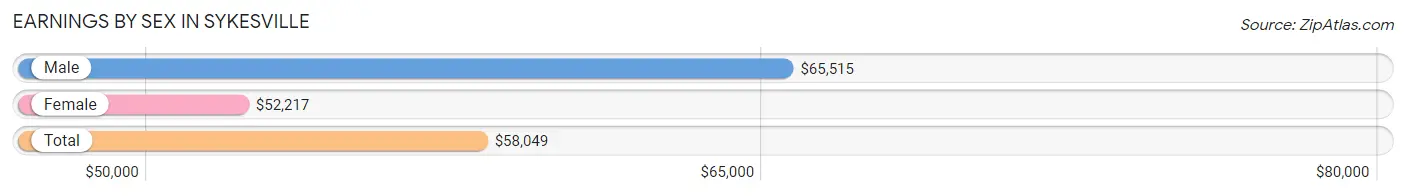
Earnings by Sex in Sykesville
Average Earnings in Sykesville are $58,049, $65,515 for men and $52,217 for women, a difference of 20.3%.
| Sex | Number | Average Earnings |
| Male | 1,441 (55.7%) | $65,515 |
| Female | 1,144 (44.3%) | $52,217 |
| Total | 2,585 (100.0%) | $58,049 |
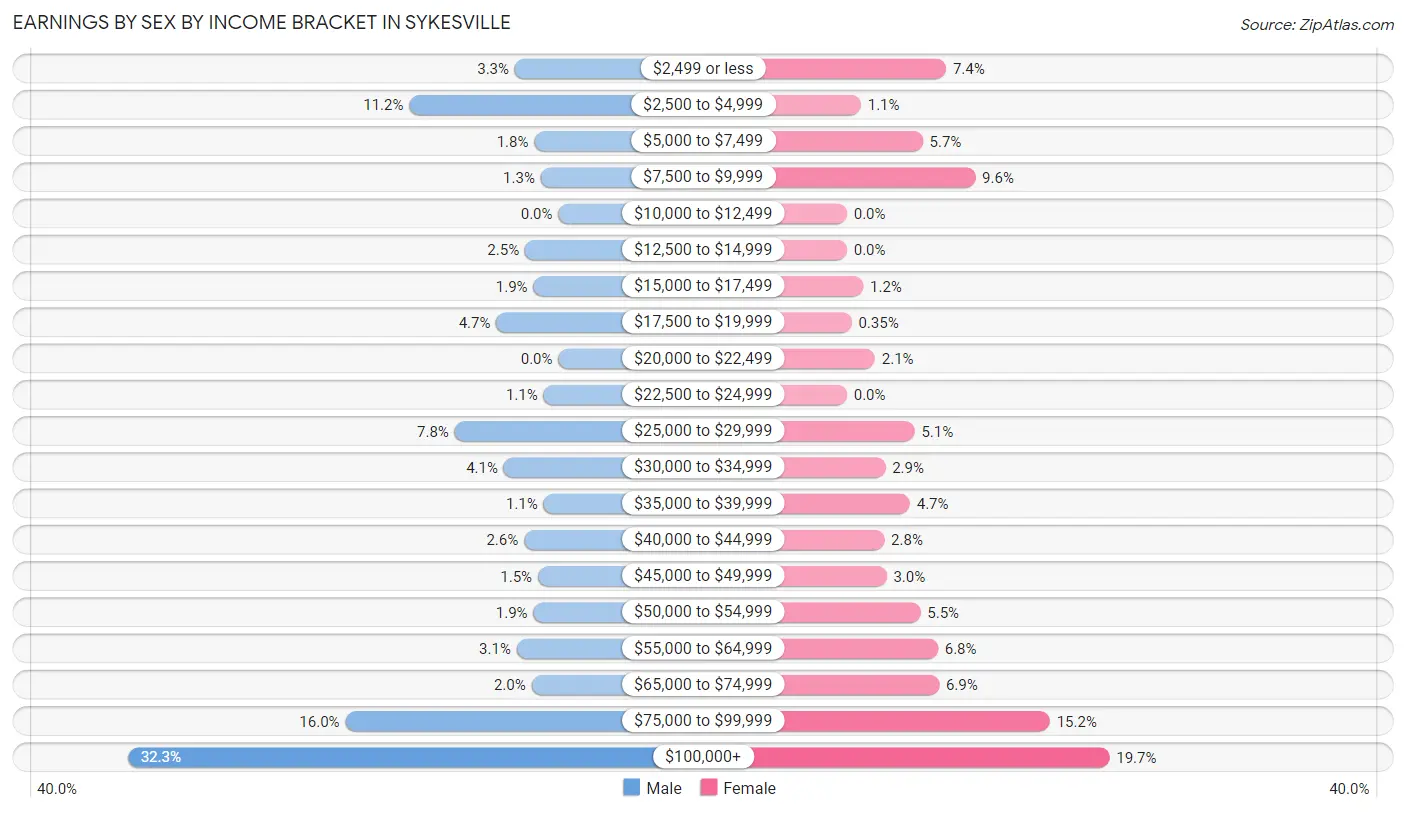
Earnings by Sex by Income Bracket in Sykesville
The most common earnings brackets in Sykesville are $100,000+ for men (465 | 32.3%) and $100,000+ for women (225 | 19.7%).
| Income | Male | Female |
| $2,499 or less | 47 (3.3%) | 85 (7.4%) |
| $2,500 to $4,999 | 161 (11.2%) | 12 (1.1%) |
| $5,000 to $7,499 | 26 (1.8%) | 65 (5.7%) |
| $7,500 to $9,999 | 19 (1.3%) | 110 (9.6%) |
| $10,000 to $12,499 | 0 (0.0%) | 0 (0.0%) |
| $12,500 to $14,999 | 36 (2.5%) | 0 (0.0%) |
| $15,000 to $17,499 | 27 (1.9%) | 14 (1.2%) |
| $17,500 to $19,999 | 67 (4.6%) | 4 (0.4%) |
| $20,000 to $22,499 | 0 (0.0%) | 24 (2.1%) |
| $22,500 to $24,999 | 16 (1.1%) | 0 (0.0%) |
| $25,000 to $29,999 | 112 (7.8%) | 58 (5.1%) |
| $30,000 to $34,999 | 59 (4.1%) | 33 (2.9%) |
| $35,000 to $39,999 | 16 (1.1%) | 54 (4.7%) |
| $40,000 to $44,999 | 37 (2.6%) | 32 (2.8%) |
| $45,000 to $49,999 | 22 (1.5%) | 34 (3.0%) |
| $50,000 to $54,999 | 27 (1.9%) | 63 (5.5%) |
| $55,000 to $64,999 | 45 (3.1%) | 78 (6.8%) |
| $65,000 to $74,999 | 29 (2.0%) | 79 (6.9%) |
| $75,000 to $99,999 | 230 (16.0%) | 174 (15.2%) |
| $100,000+ | 465 (32.3%) | 225 (19.7%) |
| Total | 1,441 (100.0%) | 1,144 (100.0%) |
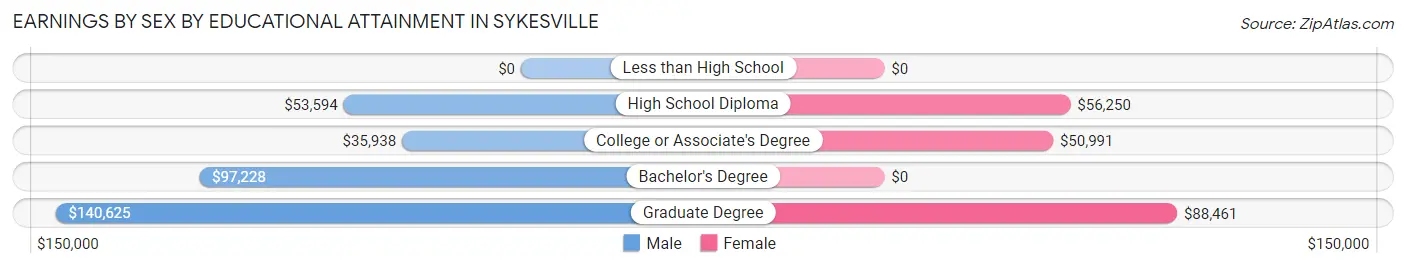
Earnings by Sex by Educational Attainment in Sykesville
Average earnings in Sykesville are $92,033 for men and $65,156 for women, a difference of 29.2%. Men with an educational attainment of graduate degree enjoy the highest average annual earnings of $140,625, while those with college or associate's degree education earn the least with $35,938. Women with an educational attainment of graduate degree earn the most with the average annual earnings of $88,461, while those with college or associate's degree education have the smallest earnings of $50,991.
| Educational Attainment | Male Income | Female Income |
| Less than High School | - | - |
| High School Diploma | $53,594 | $56,250 |
| College or Associate's Degree | $35,938 | $50,991 |
| Bachelor's Degree | $97,228 | $0 |
| Graduate Degree | $140,625 | $88,461 |
| Total | $92,033 | $65,156 |
Family Income in Sykesville
Family Income Brackets in Sykesville
According to the Sykesville family income data, there are 424 families falling into the $100,000 to $149,999 income range, which is the most common income bracket and makes up 39.7% of all families.
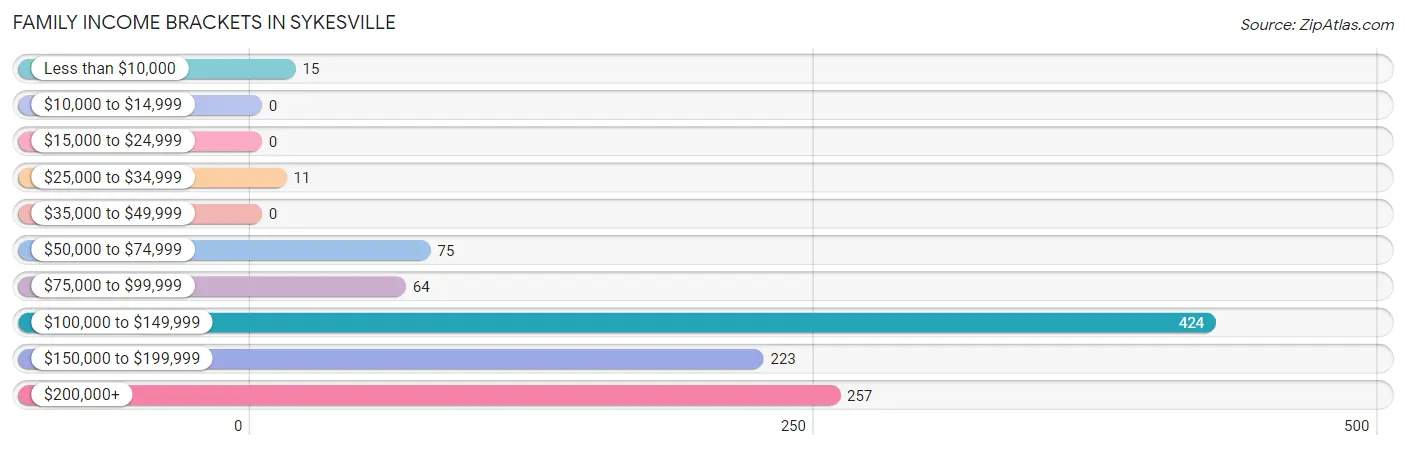
| Income Bracket | # Families | % Families |
| Less than $10,000 | 15 | 1.4% |
| $10,000 to $14,999 | 0 | 0.0% |
| $15,000 to $24,999 | 0 | 0.0% |
| $25,000 to $34,999 | 11 | 1.0% |
| $35,000 to $49,999 | 0 | 0.0% |
| $50,000 to $74,999 | 75 | 7.0% |
| $75,000 to $99,999 | 64 | 6.0% |
| $100,000 to $149,999 | 424 | 39.7% |
| $150,000 to $199,999 | 223 | 20.9% |
| $200,000+ | 257 | 24.0% |
Family Income by Famaliy Size in Sykesville
6-person families (141 | 13.2%) account for the highest median family income in Sykesville with $198,689 per family, while 2-person families (278 | 26.0%) have the highest median income of $59,584 per family member.
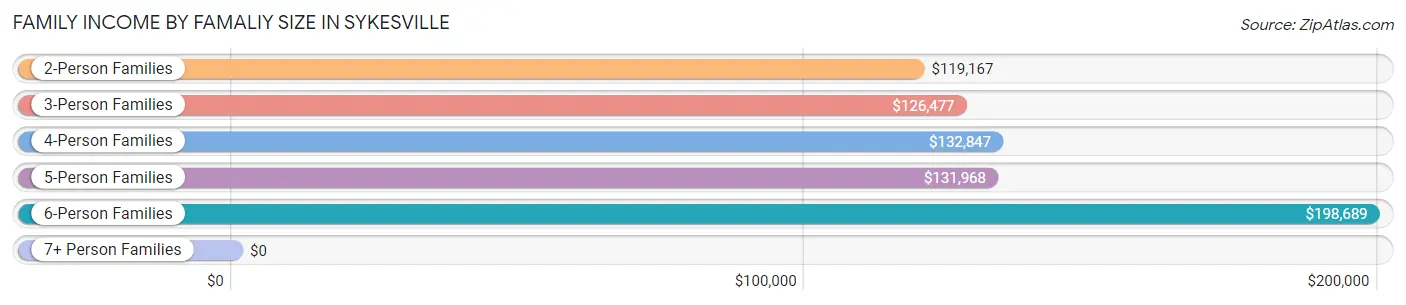
| Income Bracket | # Families | Median Income |
| 2-Person Families | 278 (26.0%) | $119,167 |
| 3-Person Families | 219 (20.5%) | $126,477 |
| 4-Person Families | 241 (22.5%) | $132,847 |
| 5-Person Families | 190 (17.8%) | $131,968 |
| 6-Person Families | 141 (13.2%) | $198,689 |
| 7+ Person Families | 0 (0.0%) | $0 |
| Total | 1,069 (100.0%) | $133,542 |
Family Income by Number of Earners in Sykesville
The median family income in Sykesville is $133,542, with families comprising 2 earners (683) having the highest median family income of $165,938, while families with no earners (66) have the lowest median family income of $100,577, accounting for 63.9% and 6.2% of families, respectively.
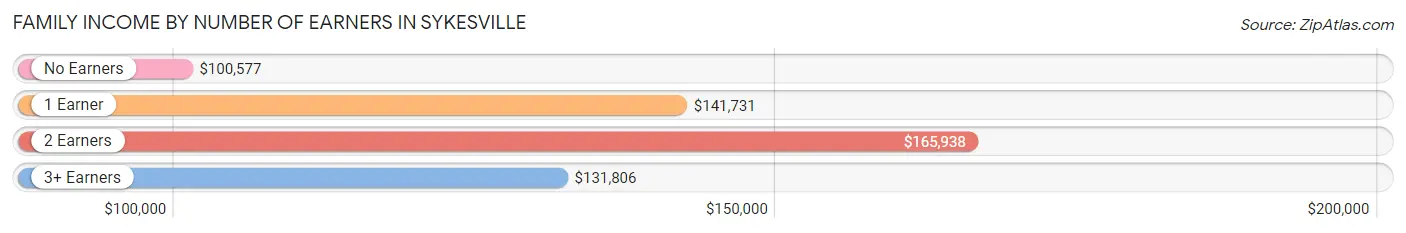
| Number of Earners | # Families | Median Income |
| No Earners | 66 (6.2%) | $100,577 |
| 1 Earner | 110 (10.3%) | $141,731 |
| 2 Earners | 683 (63.9%) | $165,938 |
| 3+ Earners | 210 (19.6%) | $131,806 |
| Total | 1,069 (100.0%) | $133,542 |
Household Income in Sykesville
Household Income Brackets in Sykesville
With 471 households falling in the category, the $100,000 to $149,999 income range is the most frequent in Sykesville, accounting for 33.4% of all households. In contrast, only 15 households (1.1%) fall into the $35,000 to $49,999 income bracket, making it the least populous group.
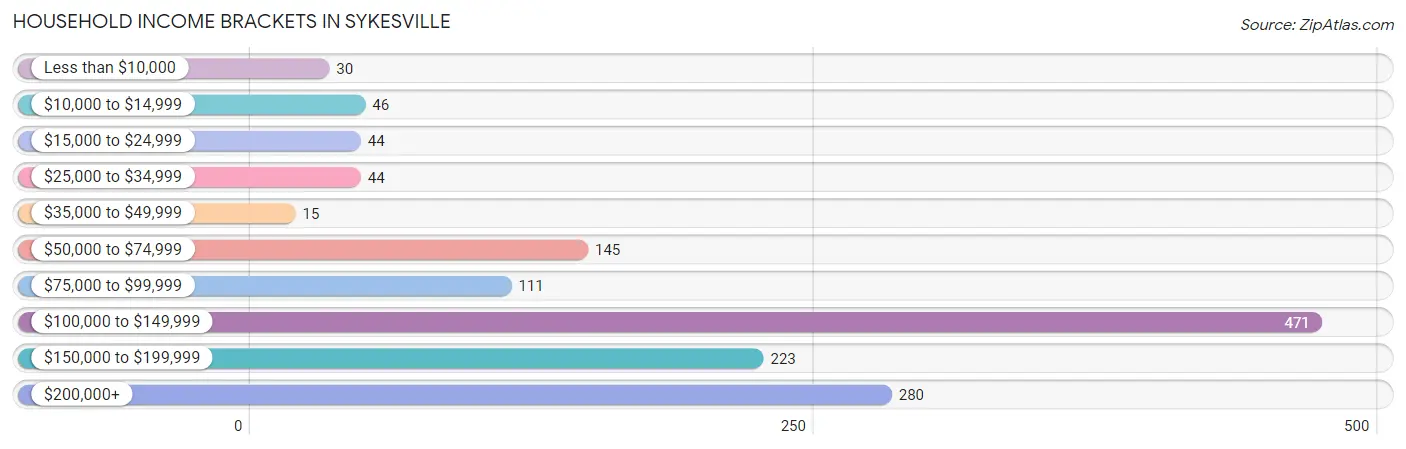
| Income Bracket | # Households | % Households |
| Less than $10,000 | 30 | 2.1% |
| $10,000 to $14,999 | 46 | 3.3% |
| $15,000 to $24,999 | 44 | 3.1% |
| $25,000 to $34,999 | 44 | 3.1% |
| $35,000 to $49,999 | 15 | 1.1% |
| $50,000 to $74,999 | 145 | 10.3% |
| $75,000 to $99,999 | 111 | 7.9% |
| $100,000 to $149,999 | 471 | 33.4% |
| $150,000 to $199,999 | 223 | 15.8% |
| $200,000+ | 280 | 19.9% |
Household Income by Householder Age in Sykesville
The median household income in Sykesville is $126,941, with the highest median household income of $132,917 found in the 25 to 44 years age bracket for the primary householder. A total of 586 households (41.6%) fall into this category.
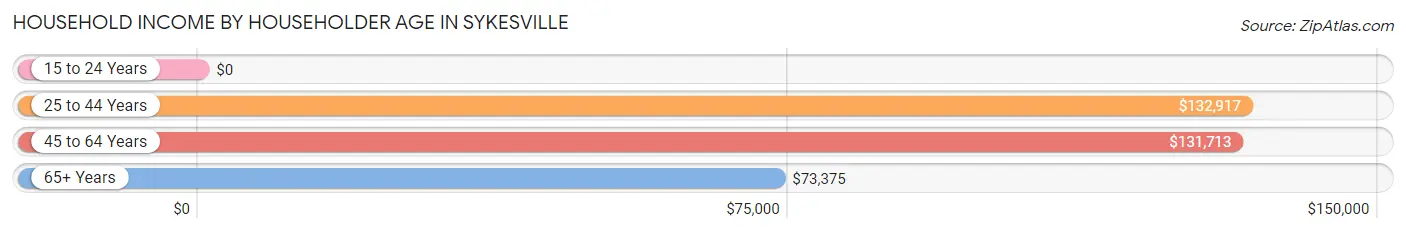
| Income Bracket | # Households | Median Income |
| 15 to 24 Years | 0 (0.0%) | $0 |
| 25 to 44 Years | 586 (41.6%) | $132,917 |
| 45 to 64 Years | 566 (40.2%) | $131,713 |
| 65+ Years | 257 (18.2%) | $73,375 |
| Total | 1,409 (100.0%) | $126,941 |
Poverty in Sykesville
Income Below Poverty by Sex and Age in Sykesville
With 3.9% poverty level for males and 3.2% for females among the residents of Sykesville, 25 to 34 year old males and 65 to 74 year old females are the most vulnerable to poverty, with 36 males (14.2%) and 15 females (11.0%) in their respective age groups living below the poverty level.
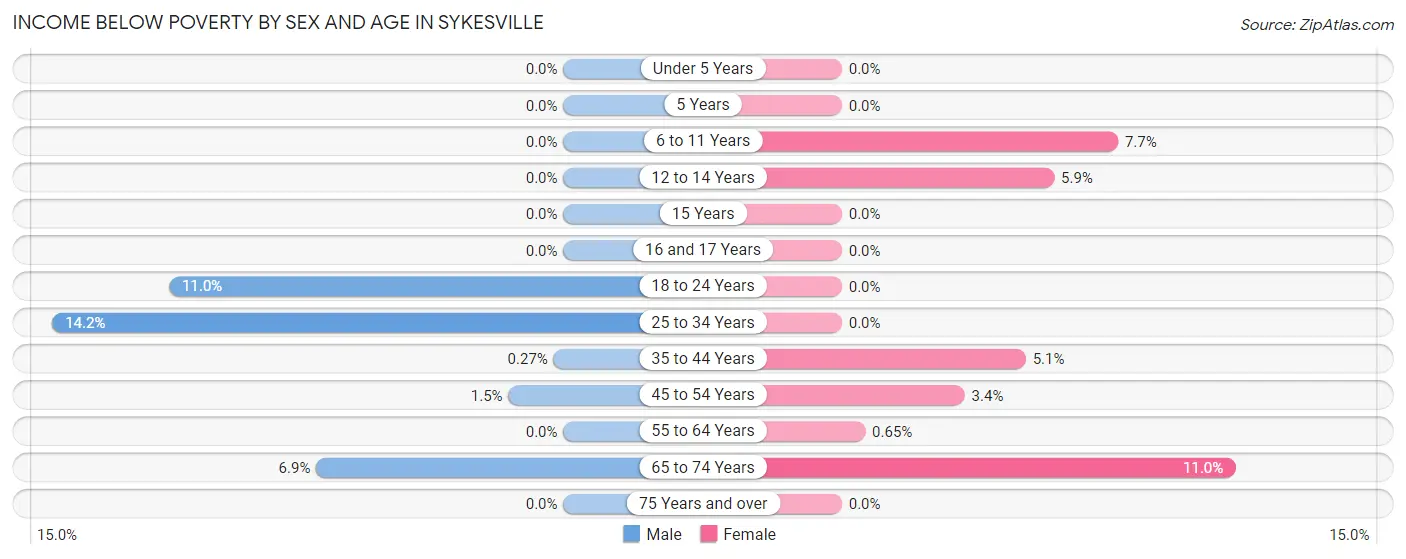
| Age Bracket | Male | Female |
| Under 5 Years | 0 (0.0%) | 0 (0.0%) |
| 5 Years | 0 (0.0%) | 0 (0.0%) |
| 6 to 11 Years | 0 (0.0%) | 13 (7.7%) |
| 12 to 14 Years | 0 (0.0%) | 12 (5.9%) |
| 15 Years | 0 (0.0%) | 0 (0.0%) |
| 16 and 17 Years | 0 (0.0%) | 0 (0.0%) |
| 18 to 24 Years | 28 (11.0%) | 0 (0.0%) |
| 25 to 34 Years | 36 (14.2%) | 0 (0.0%) |
| 35 to 44 Years | 1 (0.3%) | 15 (5.1%) |
| 45 to 54 Years | 6 (1.5%) | 11 (3.4%) |
| 55 to 64 Years | 0 (0.0%) | 1 (0.6%) |
| 65 to 74 Years | 11 (6.9%) | 15 (11.0%) |
| 75 Years and over | 0 (0.0%) | 0 (0.0%) |
| Total | 82 (3.9%) | 67 (3.2%) |
Income Above Poverty by Sex and Age in Sykesville
According to the poverty statistics in Sykesville, males aged under 5 years and females aged under 5 years are the age groups that are most secure financially, with 100.0% of males and 100.0% of females in these age groups living above the poverty line.
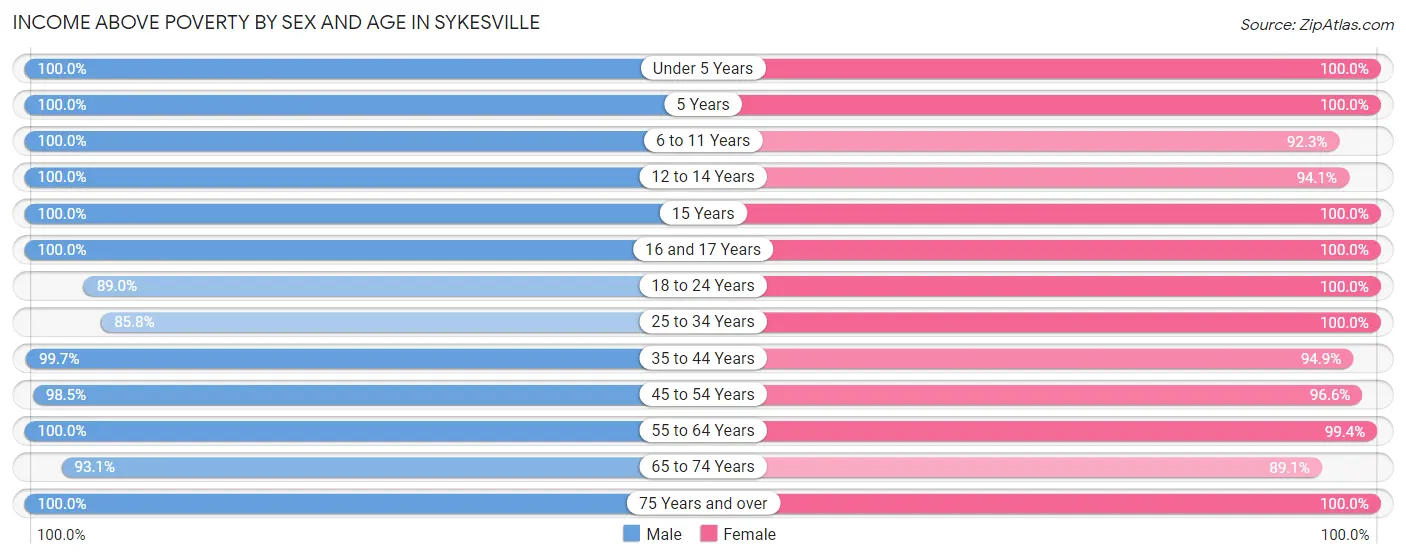
| Age Bracket | Male | Female |
| Under 5 Years | 120 (100.0%) | 187 (100.0%) |
| 5 Years | 5 (100.0%) | 73 (100.0%) |
| 6 to 11 Years | 168 (100.0%) | 156 (92.3%) |
| 12 to 14 Years | 57 (100.0%) | 191 (94.1%) |
| 15 Years | 35 (100.0%) | 4 (100.0%) |
| 16 and 17 Years | 177 (100.0%) | 32 (100.0%) |
| 18 to 24 Years | 227 (89.0%) | 183 (100.0%) |
| 25 to 34 Years | 217 (85.8%) | 239 (100.0%) |
| 35 to 44 Years | 370 (99.7%) | 278 (94.9%) |
| 45 to 54 Years | 386 (98.5%) | 311 (96.6%) |
| 55 to 64 Years | 108 (100.0%) | 153 (99.4%) |
| 65 to 74 Years | 149 (93.1%) | 122 (89.0%) |
| 75 Years and over | 7 (100.0%) | 87 (100.0%) |
| Total | 2,026 (96.1%) | 2,016 (96.8%) |
Income Below Poverty Among Married-Couple Families in Sykesville
The poverty statistics for married-couple families in Sykesville show that 0.7% or 6 of the total 860 families live below the poverty line. Families with no children have the highest poverty rate of 2.1%, comprising of 6 families. On the other hand, families with 1 or 2 children have the lowest poverty rate of 0.0%, which includes 0 families.
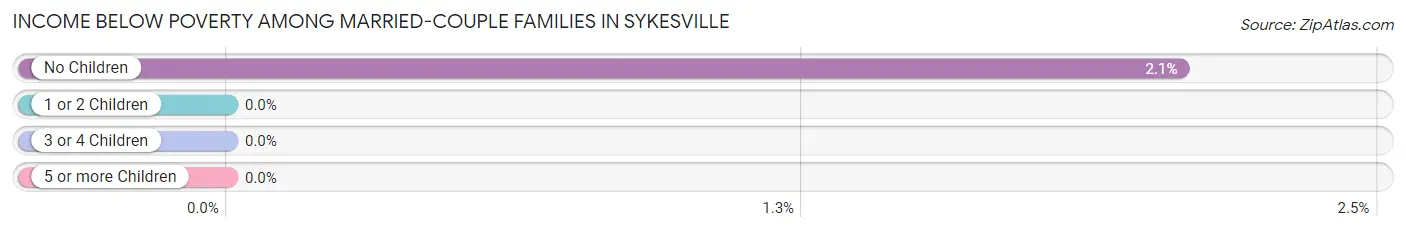
| Children | Above Poverty | Below Poverty |
| No Children | 284 (97.9%) | 6 (2.1%) |
| 1 or 2 Children | 375 (100.0%) | 0 (0.0%) |
| 3 or 4 Children | 195 (100.0%) | 0 (0.0%) |
| 5 or more Children | 0 (0.0%) | 0 (0.0%) |
| Total | 854 (99.3%) | 6 (0.7%) |
Income Below Poverty Among Single-Parent Households in Sykesville
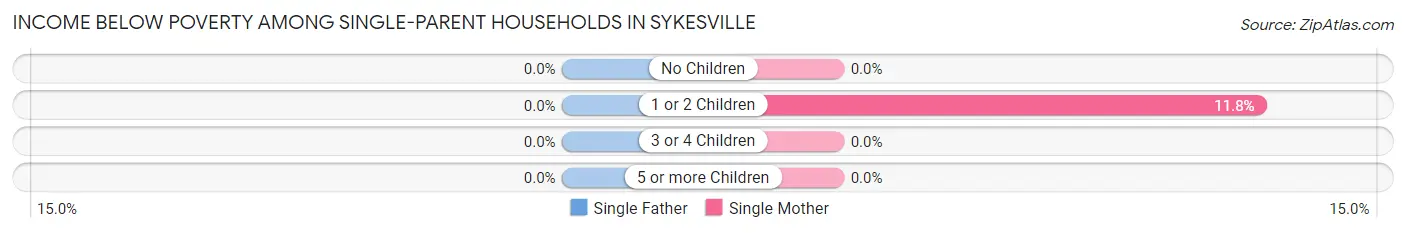
| Children | Single Father | Single Mother |
| No Children | 0 (0.0%) | 0 (0.0%) |
| 1 or 2 Children | 0 (0.0%) | 15 (11.8%) |
| 3 or 4 Children | 0 (0.0%) | 0 (0.0%) |
| 5 or more Children | 0 (0.0%) | 0 (0.0%) |
| Total | 0 (0.0%) | 15 (7.6%) |
Income Below Poverty Among Married-Couple vs Single-Parent Households in Sykesville
The poverty data for Sykesville shows that 6 of the married-couple family households (0.7%) and 15 of the single-parent households (7.2%) are living below the poverty level. Within the married-couple family households, those with no children have the highest poverty rate, with 6 households (2.1%) falling below the poverty line. Among the single-parent households, those with 1 or 2 children have the highest poverty rate, with 15 household (11.4%) living below poverty.
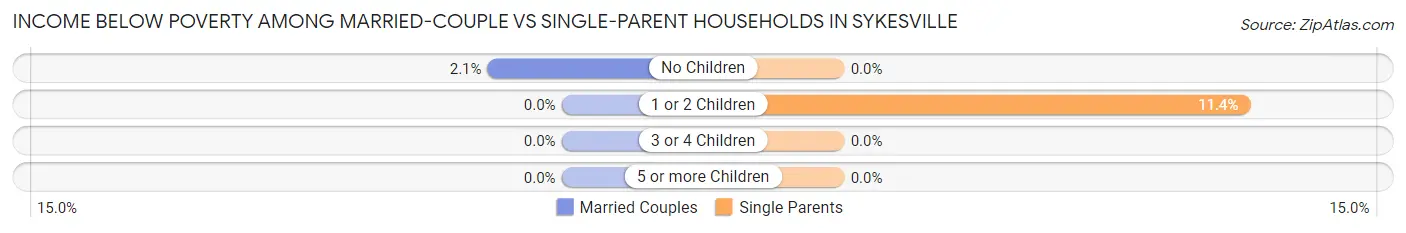
| Children | Married-Couple Families | Single-Parent Households |
| No Children | 6 (2.1%) | 0 (0.0%) |
| 1 or 2 Children | 0 (0.0%) | 15 (11.4%) |
| 3 or 4 Children | 0 (0.0%) | 0 (0.0%) |
| 5 or more Children | 0 (0.0%) | 0 (0.0%) |
| Total | 6 (0.7%) | 15 (7.2%) |
Race in Sykesville
The most populous races in Sykesville are White / Caucasian (3,211 | 74.6%), Black / African American (720 | 16.7%), and Two or more Races (247 | 5.7%).
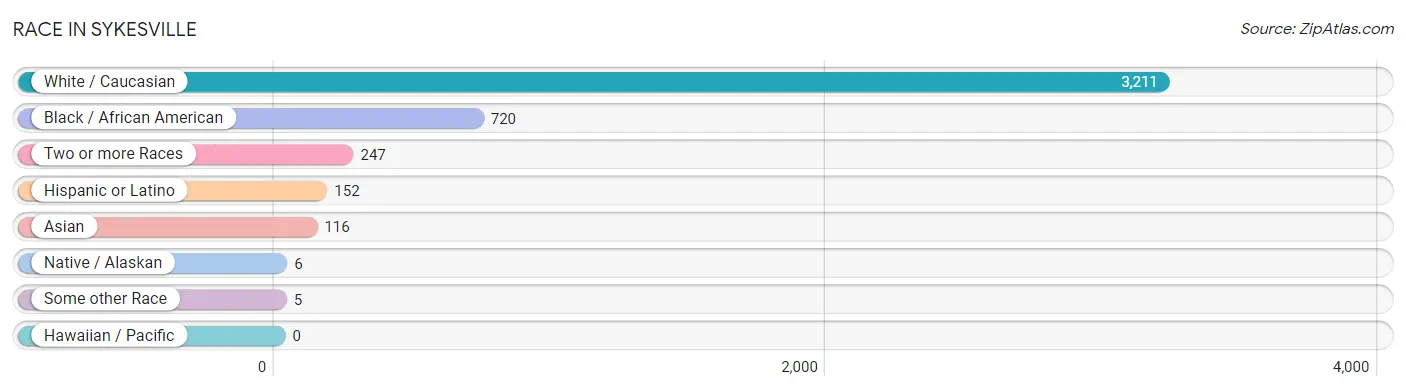
| Race | # Population | % Population |
| Asian | 116 | 2.7% |
| Black / African American | 720 | 16.7% |
| Hawaiian / Pacific | 0 | 0.0% |
| Hispanic or Latino | 152 | 3.5% |
| Native / Alaskan | 6 | 0.1% |
| White / Caucasian | 3,211 | 74.6% |
| Two or more Races | 247 | 5.7% |
| Some other Race | 5 | 0.1% |
| Total | 4,305 | 100.0% |
Ancestry in Sykesville
The most populous ancestries reported in Sykesville are American (812 | 18.9%), German (733 | 17.0%), Irish (729 | 16.9%), Italian (568 | 13.2%), and English (317 | 7.4%), together accounting for 73.4% of all Sykesville residents.
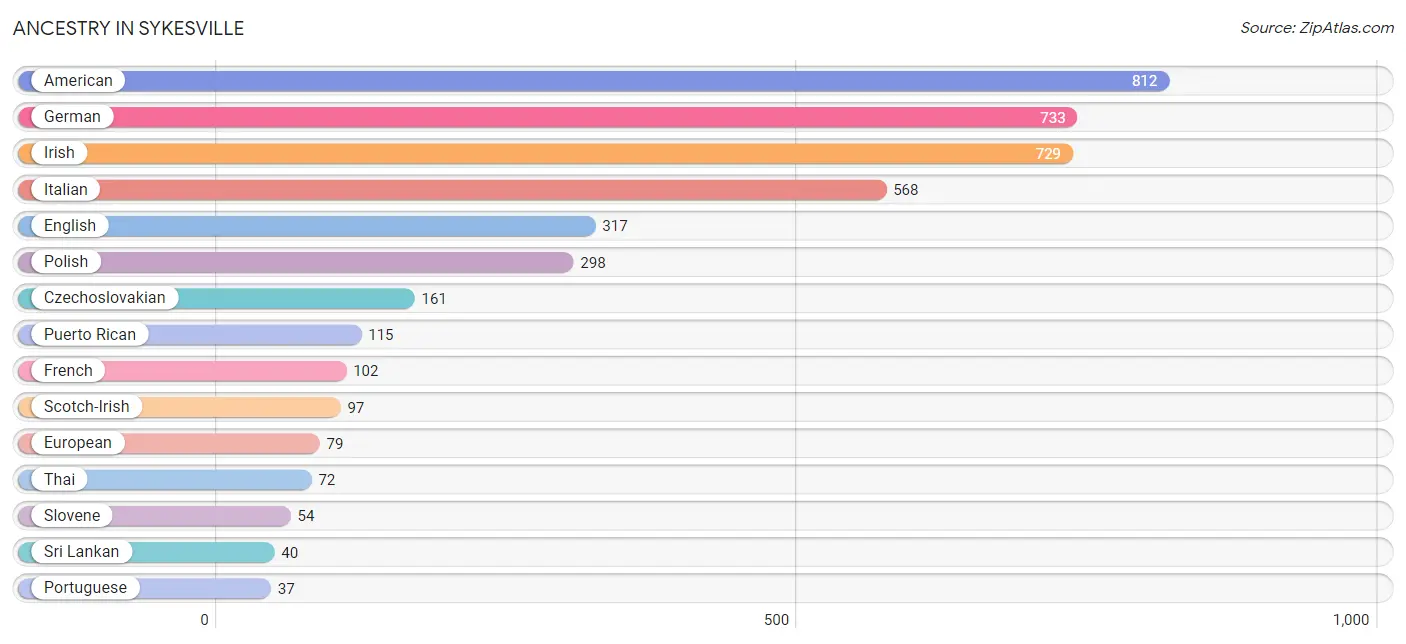
| Ancestry | # Population | % Population |
| American | 812 | 18.9% |
| Arab | 15 | 0.4% |
| Belgian | 10 | 0.2% |
| Blackfeet | 33 | 0.8% |
| Brazilian | 7 | 0.2% |
| British | 10 | 0.2% |
| Cherokee | 26 | 0.6% |
| Cuban | 13 | 0.3% |
| Czechoslovakian | 161 | 3.7% |
| Danish | 7 | 0.2% |
| Eastern European | 32 | 0.7% |
| English | 317 | 7.4% |
| European | 79 | 1.8% |
| French | 102 | 2.4% |
| German | 733 | 17.0% |
| Indian (Asian) | 32 | 0.7% |
| Irish | 729 | 16.9% |
| Italian | 568 | 13.2% |
| Korean | 5 | 0.1% |
| Lebanese | 15 | 0.4% |
| Lithuanian | 15 | 0.4% |
| Mexican | 19 | 0.4% |
| Navajo | 6 | 0.1% |
| Northern European | 7 | 0.2% |
| Norwegian | 3 | 0.1% |
| Peruvian | 5 | 0.1% |
| Polish | 298 | 6.9% |
| Portuguese | 37 | 0.9% |
| Puerto Rican | 115 | 2.7% |
| Russian | 18 | 0.4% |
| Scotch-Irish | 97 | 2.2% |
| Scottish | 34 | 0.8% |
| Slovak | 9 | 0.2% |
| Slovene | 54 | 1.3% |
| South American | 5 | 0.1% |
| Sri Lankan | 40 | 0.9% |
| Swiss | 6 | 0.1% |
| Thai | 72 | 1.7% |
| Ukrainian | 24 | 0.6% |
| Welsh | 20 | 0.5% | View All 40 Rows |
Immigrants in Sykesville
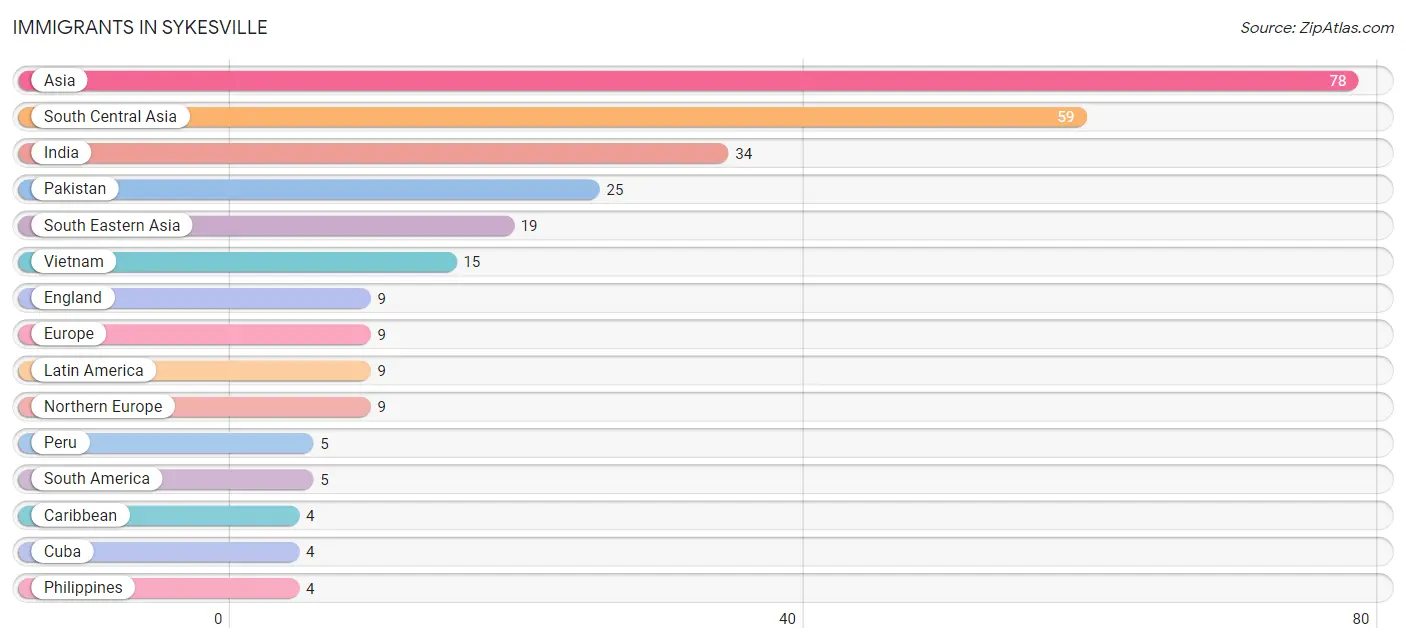
The most numerous immigrant groups reported in Sykesville came from Asia (78 | 1.8%), South Central Asia (59 | 1.4%), India (34 | 0.8%), Pakistan (25 | 0.6%), and South Eastern Asia (19 | 0.4%), together accounting for 5.0% of all Sykesville residents.
| Immigration Origin | # Population | % Population |
| Asia | 78 | 1.8% |
| Canada | 3 | 0.1% |
| Caribbean | 4 | 0.1% |
| Cuba | 4 | 0.1% |
| England | 9 | 0.2% |
| Europe | 9 | 0.2% |
| India | 34 | 0.8% |
| Latin America | 9 | 0.2% |
| Northern Europe | 9 | 0.2% |
| Pakistan | 25 | 0.6% |
| Peru | 5 | 0.1% |
| Philippines | 4 | 0.1% |
| South America | 5 | 0.1% |
| South Central Asia | 59 | 1.4% |
| South Eastern Asia | 19 | 0.4% |
| Vietnam | 15 | 0.4% | View All 16 Rows |
Sex and Age in Sykesville
Sex and Age in Sykesville
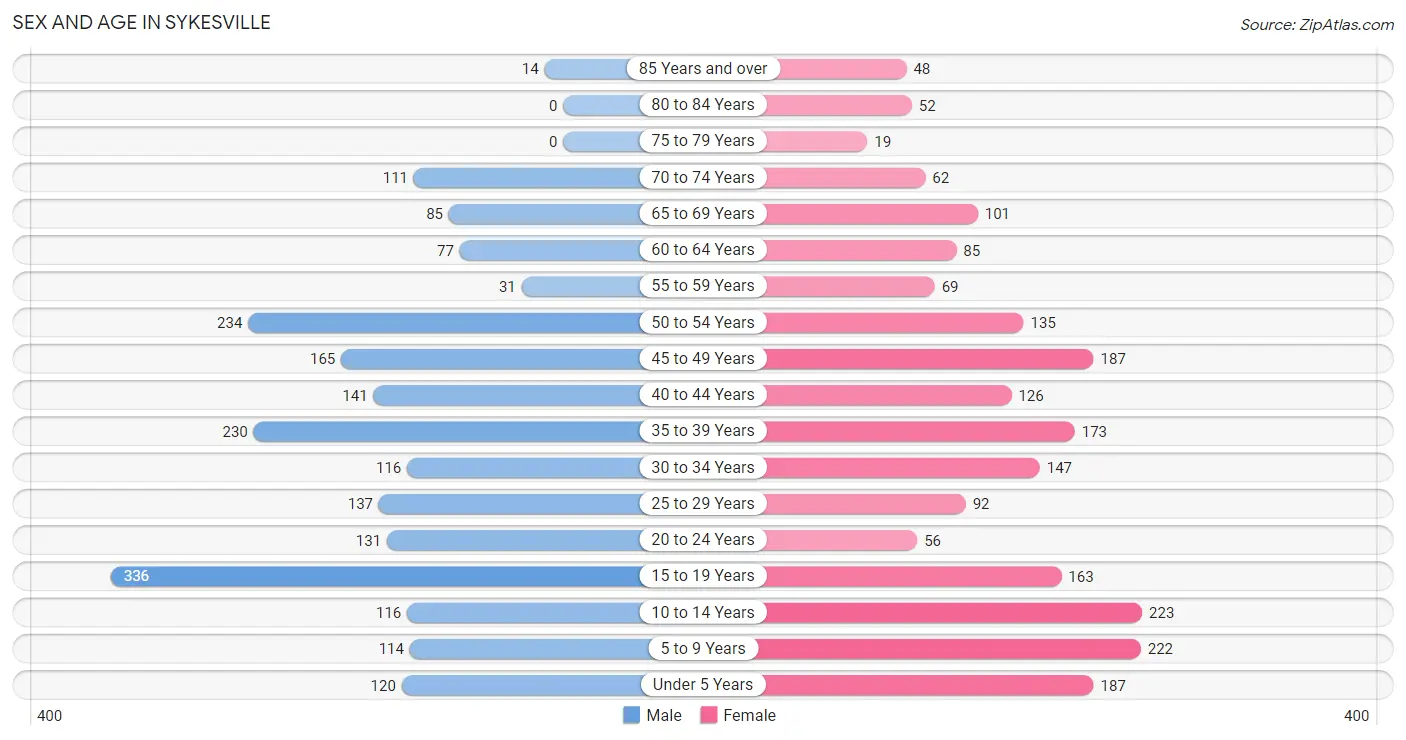
The most populous age groups in Sykesville are 15 to 19 Years (336 | 15.6%) for men and 10 to 14 Years (223 | 10.4%) for women.
| Age Bracket | Male | Female |
| Under 5 Years | 120 (5.6%) | 187 (8.7%) |
| 5 to 9 Years | 114 (5.3%) | 222 (10.3%) |
| 10 to 14 Years | 116 (5.4%) | 223 (10.4%) |
| 15 to 19 Years | 336 (15.6%) | 163 (7.6%) |
| 20 to 24 Years | 131 (6.1%) | 56 (2.6%) |
| 25 to 29 Years | 137 (6.4%) | 92 (4.3%) |
| 30 to 34 Years | 116 (5.4%) | 147 (6.9%) |
| 35 to 39 Years | 230 (10.7%) | 173 (8.1%) |
| 40 to 44 Years | 141 (6.5%) | 126 (5.9%) |
| 45 to 49 Years | 165 (7.6%) | 187 (8.7%) |
| 50 to 54 Years | 234 (10.8%) | 135 (6.3%) |
| 55 to 59 Years | 31 (1.4%) | 69 (3.2%) |
| 60 to 64 Years | 77 (3.6%) | 85 (4.0%) |
| 65 to 69 Years | 85 (3.9%) | 101 (4.7%) |
| 70 to 74 Years | 111 (5.1%) | 62 (2.9%) |
| 75 to 79 Years | 0 (0.0%) | 19 (0.9%) |
| 80 to 84 Years | 0 (0.0%) | 52 (2.4%) |
| 85 Years and over | 14 (0.6%) | 48 (2.2%) |
| Total | 2,158 (100.0%) | 2,147 (100.0%) |
Families and Households in Sykesville
Median Family Size in Sykesville
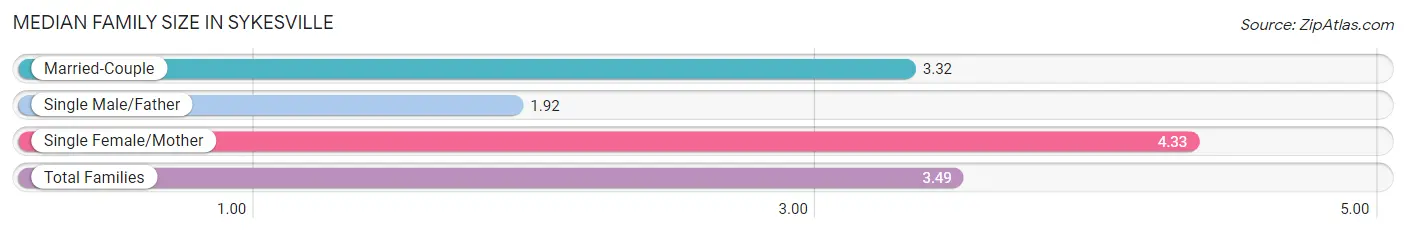
The median family size in Sykesville is 3.49 persons per family, with single female/mother families (197 | 18.4%) accounting for the largest median family size of 4.33 persons per family. On the other hand, single male/father families (12 | 1.1%) represent the smallest median family size with 1.92 persons per family.
| Family Type | # Families | Family Size |
| Married-Couple | 860 (80.4%) | 3.32 |
| Single Male/Father | 12 (1.1%) | 1.92 |
| Single Female/Mother | 197 (18.4%) | 4.33 |
| Total Families | 1,069 (100.0%) | 3.49 |
Median Household Size in Sykesville
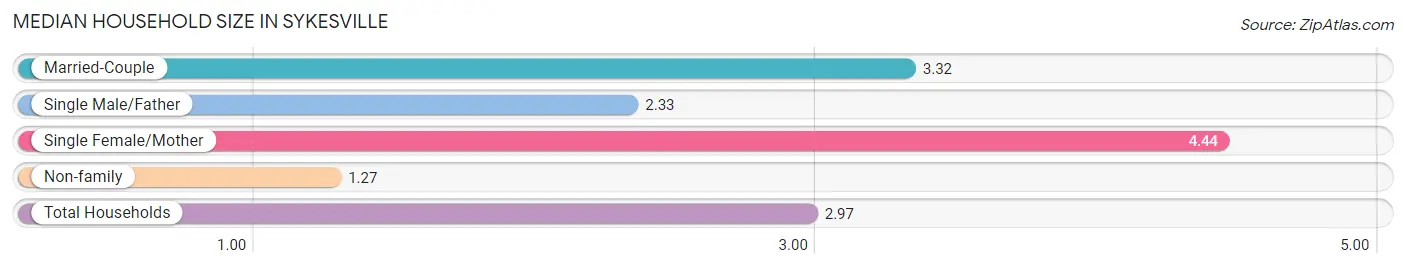
The median household size in Sykesville is 2.97 persons per household, with single female/mother households (197 | 14.0%) accounting for the largest median household size of 4.44 persons per household. non-family households (340 | 24.1%) represent the smallest median household size with 1.27 persons per household.
| Household Type | # Households | Household Size |
| Married-Couple | 860 (61.0%) | 3.32 |
| Single Male/Father | 12 (0.9%) | 2.33 |
| Single Female/Mother | 197 (14.0%) | 4.44 |
| Non-family | 340 (24.1%) | 1.27 |
| Total Households | 1,409 (100.0%) | 2.97 |
Household Size by Marriage Status in Sykesville
Out of a total of 1,409 households in Sykesville, 1,069 (75.9%) are family households, while 340 (24.1%) are nonfamily households. The most numerous type of family households are 2-person households, comprising 273, and the most common type of nonfamily households are 1-person households, comprising 253.
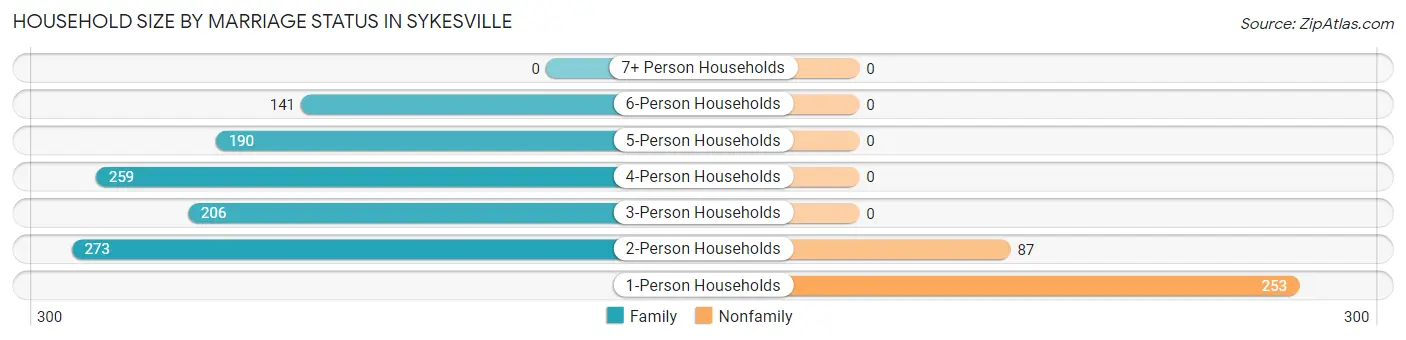
| Household Size | Family Households | Nonfamily Households |
| 1-Person Households | - | 253 (18.0%) |
| 2-Person Households | 273 (19.4%) | 87 (6.2%) |
| 3-Person Households | 206 (14.6%) | 0 (0.0%) |
| 4-Person Households | 259 (18.4%) | 0 (0.0%) |
| 5-Person Households | 190 (13.5%) | 0 (0.0%) |
| 6-Person Households | 141 (10.0%) | 0 (0.0%) |
| 7+ Person Households | 0 (0.0%) | 0 (0.0%) |
| Total | 1,069 (75.9%) | 340 (24.1%) |
Female Fertility in Sykesville
Fertility by Age in Sykesville
Average fertility rate in Sykesville is 65.0 births per 1,000 women. Women in the age bracket of 15 to 19 years have the highest fertility rate with 74.0 births per 1,000 women. Women in the age bracket of 35 to 50 years acount for 50.0% of all women with births.
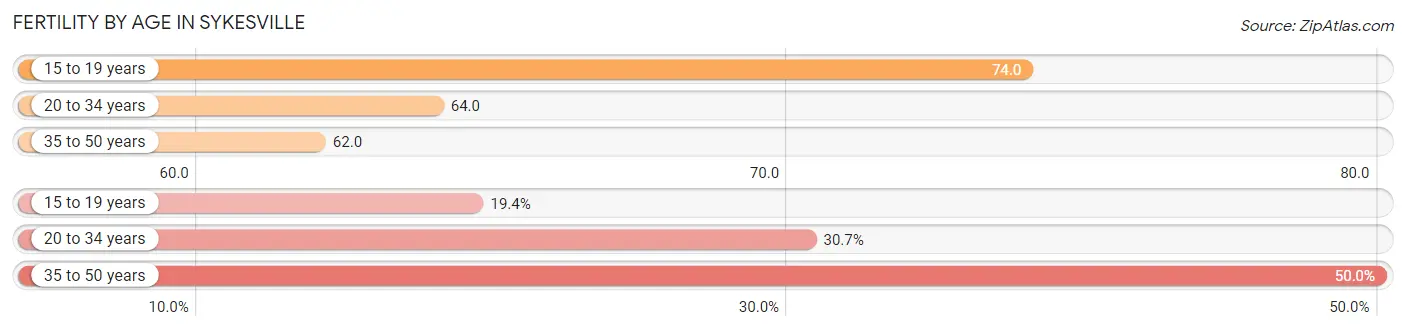
| Age Bracket | Women with Births | Births / 1,000 Women |
| 15 to 19 years | 12 (19.4%) | 74.0 |
| 20 to 34 years | 19 (30.6%) | 64.0 |
| 35 to 50 years | 31 (50.0%) | 62.0 |
| Total | 62 (100.0%) | 65.0 |
Fertility by Age by Marriage Status in Sykesville
80.6% of women with births (62) in Sykesville are married. The highest percentage of unmarried women with births falls into 15 to 19 years age bracket with 100.0% of them unmarried at the time of birth, while the lowest percentage of unmarried women with births belong to 20 to 34 years age bracket with 0.0% of them unmarried.
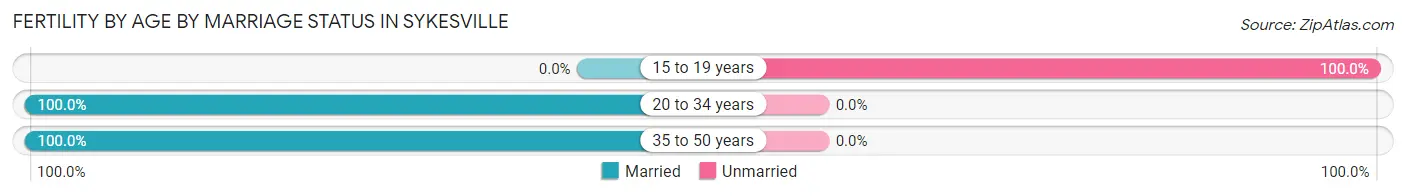
| Age Bracket | Married | Unmarried |
| 15 to 19 years | 0 (0.0%) | 12 (100.0%) |
| 20 to 34 years | 19 (100.0%) | 0 (0.0%) |
| 35 to 50 years | 31 (100.0%) | 0 (0.0%) |
| Total | 50 (80.6%) | 12 (19.4%) |
Fertility by Education in Sykesville
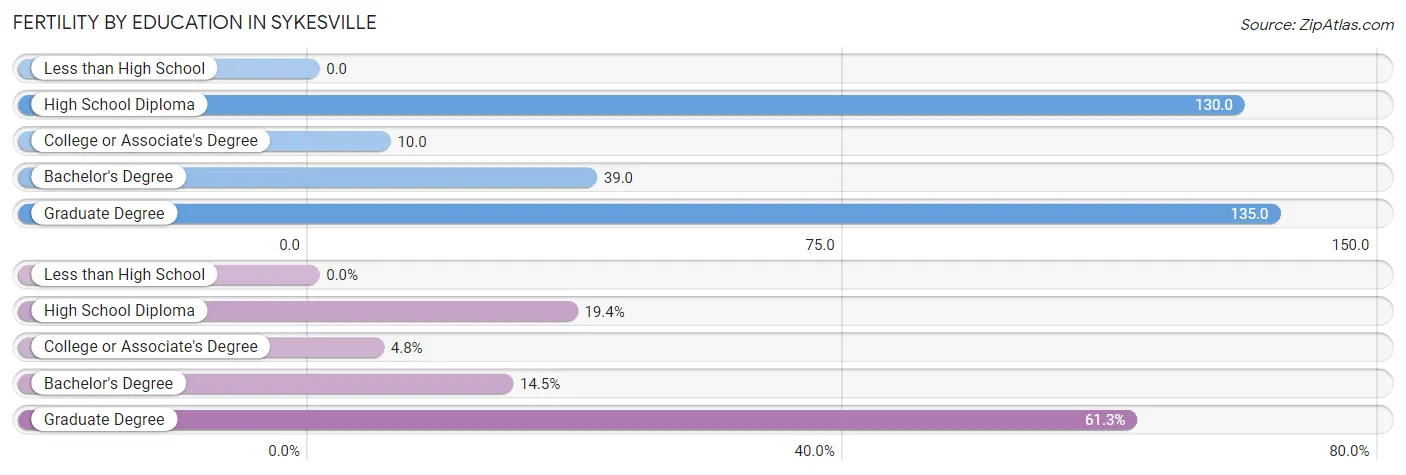
| Educational Attainment | Women with Births | Births / 1,000 Women |
| Less than High School | 0 (0.0%) | 0.0 |
| High School Diploma | 12 (19.4%) | 130.0 |
| College or Associate's Degree | 3 (4.8%) | 10.0 |
| Bachelor's Degree | 9 (14.5%) | 39.0 |
| Graduate Degree | 38 (61.3%) | 135.0 |
| Total | 62 (100.0%) | 65.0 |
Fertility by Education by Marriage Status in Sykesville
19.4% of women with births in Sykesville are unmarried. Women with the educational attainment of college or associate's degree are most likely to be married with 100.0% of them married at childbirth, while women with the educational attainment of high school diploma are least likely to be married with 100.0% of them unmarried at childbirth.
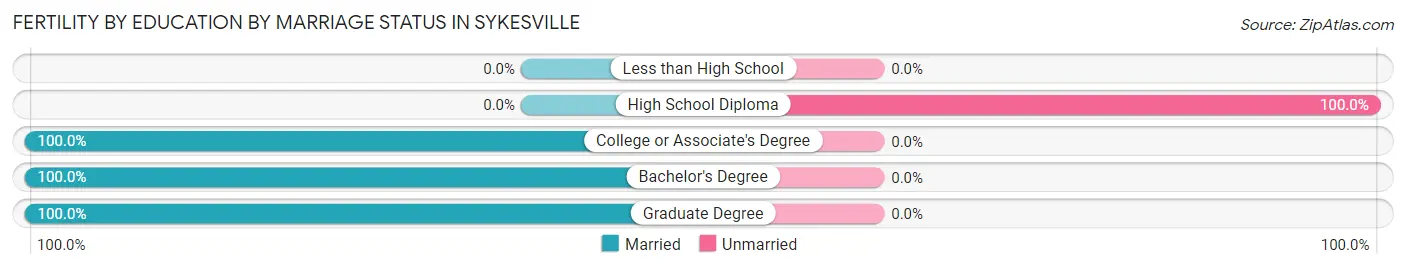
| Educational Attainment | Married | Unmarried |
| Less than High School | 0 (0.0%) | 0 (0.0%) |
| High School Diploma | 0 (0.0%) | 12 (100.0%) |
| College or Associate's Degree | 3 (100.0%) | 0 (0.0%) |
| Bachelor's Degree | 9 (100.0%) | 0 (0.0%) |
| Graduate Degree | 38 (100.0%) | 0 (0.0%) |
| Total | 50 (80.6%) | 12 (19.4%) |
Employment Characteristics in Sykesville
Employment by Class of Employer in Sykesville
Among the 2,198 employed individuals in Sykesville, private company employees (1,455 | 66.2%), local government employees (280 | 12.7%), and federal government employees (218 | 9.9%) make up the most common classes of employment.
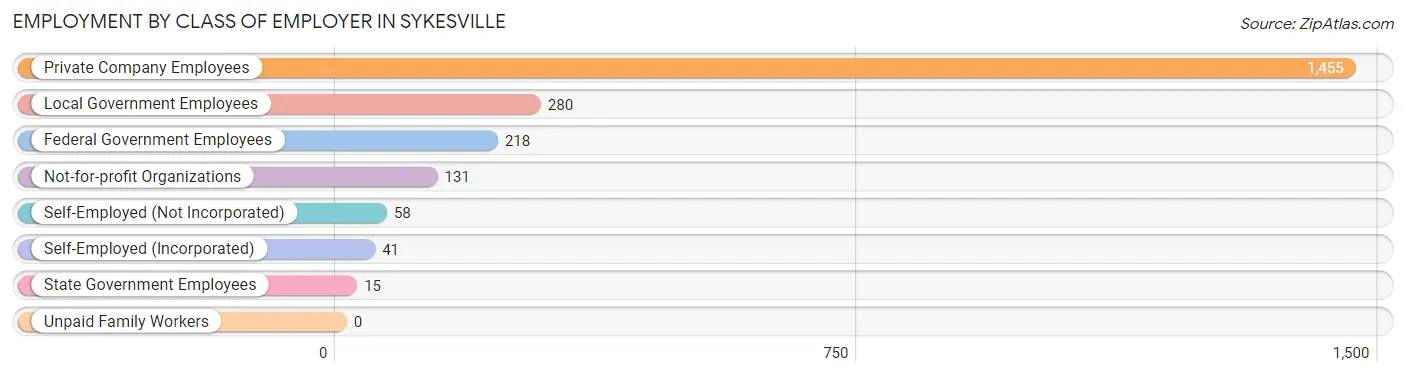
| Employer Class | # Employees | % Employees |
| Private Company Employees | 1,455 | 66.2% |
| Self-Employed (Incorporated) | 41 | 1.9% |
| Self-Employed (Not Incorporated) | 58 | 2.6% |
| Not-for-profit Organizations | 131 | 6.0% |
| Local Government Employees | 280 | 12.7% |
| State Government Employees | 15 | 0.7% |
| Federal Government Employees | 218 | 9.9% |
| Unpaid Family Workers | 0 | 0.0% |
| Total | 2,198 | 100.0% |
Employment Status by Age in Sykesville
According to the labor force statistics for Sykesville, out of the total population over 16 years of age (3,284), 71.5% or 2,348 individuals are in the labor force, with 1.7% or 40 of them unemployed. The age group with the highest labor force participation rate is 25 to 29 years, with 100.0% or 229 individuals in the labor force. Within the labor force, the 60 to 64 years age range has the highest percentage of unemployed individuals, with 12.5% or 14 of them being unemployed.
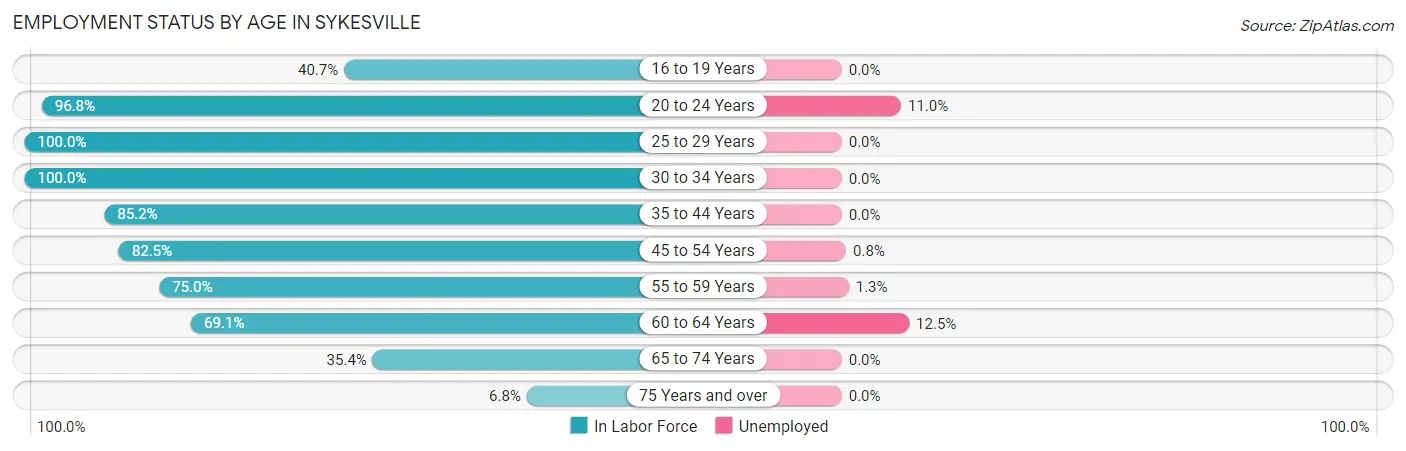
| Age Bracket | In Labor Force | Unemployed |
| 16 to 19 Years | 187 (40.7%) | 0 (0.0%) |
| 20 to 24 Years | 181 (96.8%) | 20 (11.0%) |
| 25 to 29 Years | 229 (100.0%) | 0 (0.0%) |
| 30 to 34 Years | 263 (100.0%) | 0 (0.0%) |
| 35 to 44 Years | 571 (85.2%) | 0 (0.0%) |
| 45 to 54 Years | 595 (82.5%) | 5 (0.8%) |
| 55 to 59 Years | 75 (75.0%) | 1 (1.3%) |
| 60 to 64 Years | 112 (69.1%) | 14 (12.5%) |
| 65 to 74 Years | 127 (35.4%) | 0 (0.0%) |
| 75 Years and over | 9 (6.8%) | 0 (0.0%) |
| Total | 2,348 (71.5%) | 40 (1.7%) |
Employment Status by Educational Attainment in Sykesville
According to labor force statistics for Sykesville, 86.0% of individuals (1,845) out of the total population between 25 and 64 years of age (2,145) are in the labor force, with 1.1% or 20 of them being unemployed. The group with the highest labor force participation rate are those with the educational attainment of bachelor's degree or higher, with 95.5% or 1,205 individuals in the labor force. Within the labor force, individuals with college / associate degree education have the highest percentage of unemployment, with 4.3% or 19 of them being unemployed.
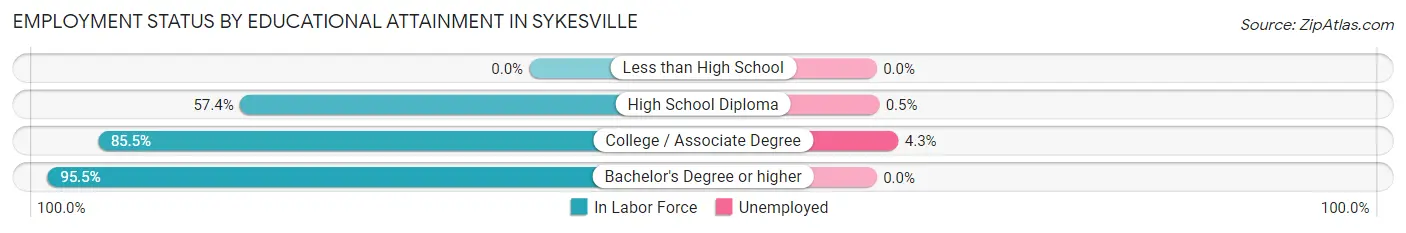
| Educational Attainment | In Labor Force | Unemployed |
| Less than High School | 0 (0.0%) | 0 (0.0%) |
| High School Diploma | 197 (57.4%) | 2 (0.5%) |
| College / Associate Degree | 443 (85.5%) | 22 (4.3%) |
| Bachelor's Degree or higher | 1,205 (95.5%) | 0 (0.0%) |
| Total | 1,845 (86.0%) | 24 (1.1%) |
Employment Occupations by Sex in Sykesville
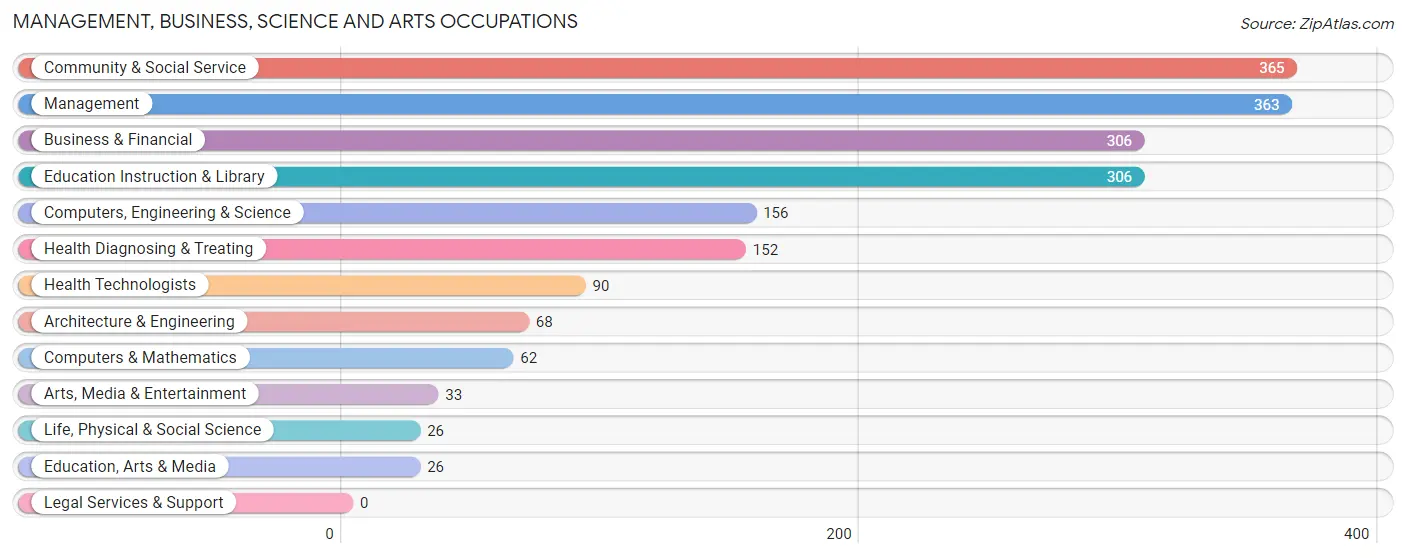
Management, Business, Science and Arts Occupations
The most common Management, Business, Science and Arts occupations in Sykesville are Community & Social Service (365 | 15.8%), Management (363 | 15.7%), Business & Financial (306 | 13.3%), Education Instruction & Library (306 | 13.3%), and Computers, Engineering & Science (156 | 6.8%).
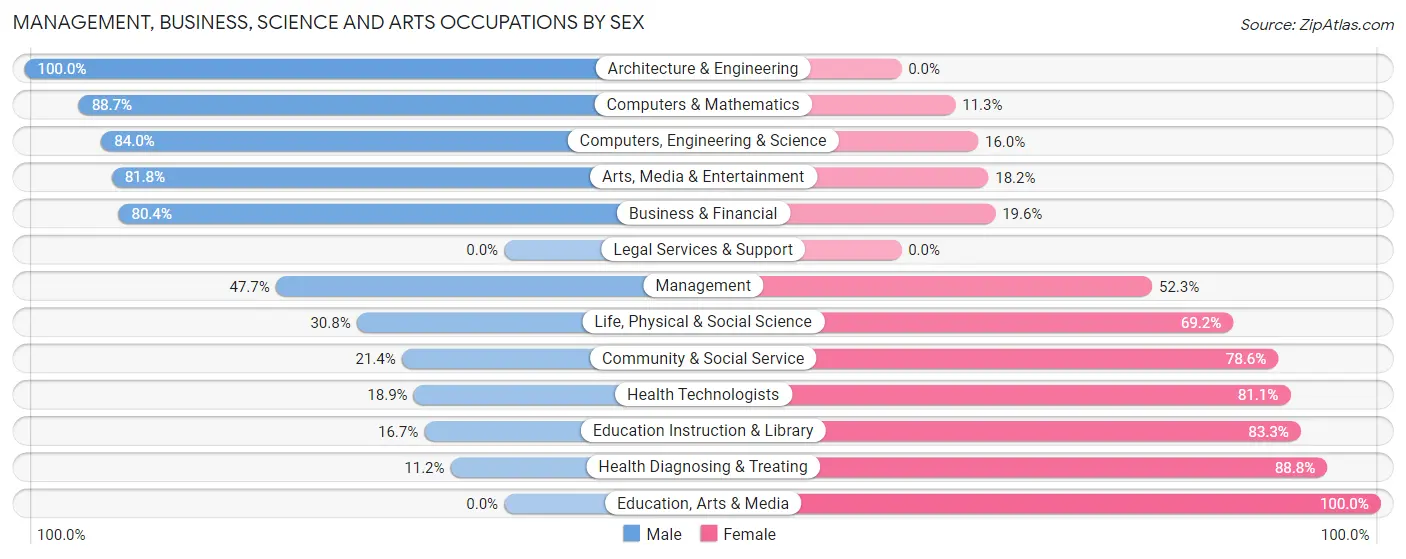
Management, Business, Science and Arts Occupations by Sex
Within the Management, Business, Science and Arts occupations in Sykesville, the most male-oriented occupations are Architecture & Engineering (100.0%), Computers & Mathematics (88.7%), and Computers, Engineering & Science (84.0%), while the most female-oriented occupations are Education, Arts & Media (100.0%), Health Diagnosing & Treating (88.8%), and Education Instruction & Library (83.3%).
| Occupation | Male | Female |
| Management | 173 (47.7%) | 190 (52.3%) |
| Business & Financial | 246 (80.4%) | 60 (19.6%) |
| Computers, Engineering & Science | 131 (84.0%) | 25 (16.0%) |
| Computers & Mathematics | 55 (88.7%) | 7 (11.3%) |
| Architecture & Engineering | 68 (100.0%) | 0 (0.0%) |
| Life, Physical & Social Science | 8 (30.8%) | 18 (69.2%) |
| Community & Social Service | 78 (21.4%) | 287 (78.6%) |
| Education, Arts & Media | 0 (0.0%) | 26 (100.0%) |
| Legal Services & Support | 0 (0.0%) | 0 (0.0%) |
| Education Instruction & Library | 51 (16.7%) | 255 (83.3%) |
| Arts, Media & Entertainment | 27 (81.8%) | 6 (18.2%) |
| Health Diagnosing & Treating | 17 (11.2%) | 135 (88.8%) |
| Health Technologists | 17 (18.9%) | 73 (81.1%) |
| Total (Category) | 645 (48.1%) | 697 (51.9%) |
| Total (Overall) | 1,373 (59.5%) | 936 (40.5%) |
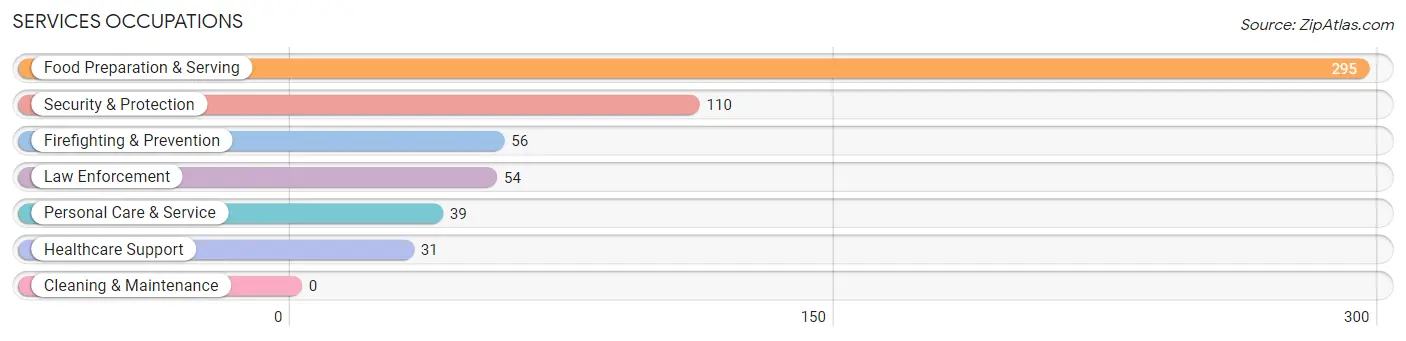
Services Occupations
The most common Services occupations in Sykesville are Food Preparation & Serving (295 | 12.8%), Security & Protection (110 | 4.8%), Firefighting & Prevention (56 | 2.4%), Law Enforcement (54 | 2.3%), and Personal Care & Service (39 | 1.7%).
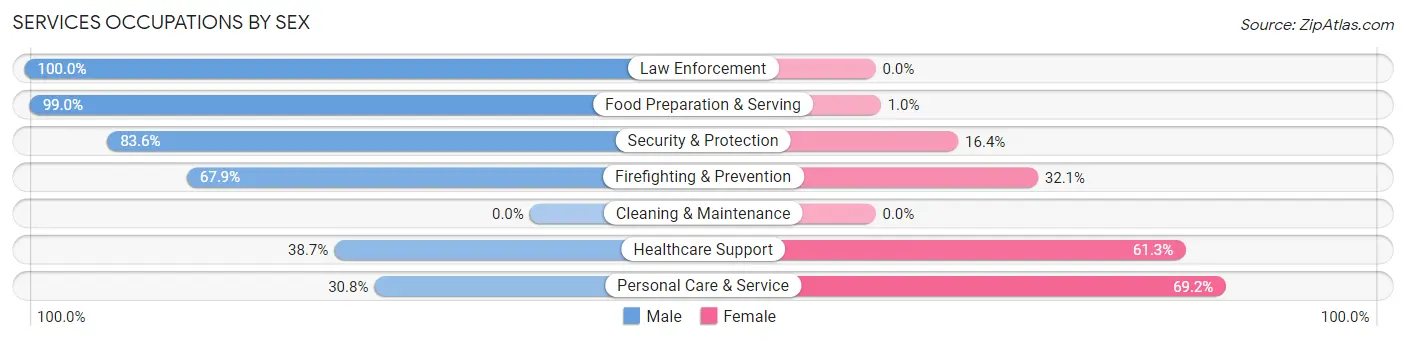
Services Occupations by Sex
Within the Services occupations in Sykesville, the most male-oriented occupations are Law Enforcement (100.0%), Food Preparation & Serving (99.0%), and Security & Protection (83.6%), while the most female-oriented occupations are Personal Care & Service (69.2%), Healthcare Support (61.3%), and Firefighting & Prevention (32.1%).
| Occupation | Male | Female |
| Healthcare Support | 12 (38.7%) | 19 (61.3%) |
| Security & Protection | 92 (83.6%) | 18 (16.4%) |
| Firefighting & Prevention | 38 (67.9%) | 18 (32.1%) |
| Law Enforcement | 54 (100.0%) | 0 (0.0%) |
| Food Preparation & Serving | 292 (99.0%) | 3 (1.0%) |
| Cleaning & Maintenance | 0 (0.0%) | 0 (0.0%) |
| Personal Care & Service | 12 (30.8%) | 27 (69.2%) |
| Total (Category) | 408 (85.9%) | 67 (14.1%) |
| Total (Overall) | 1,373 (59.5%) | 936 (40.5%) |
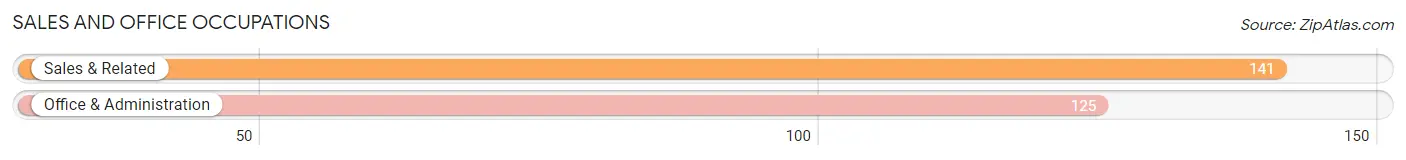
Sales and Office Occupations
The most common Sales and Office occupations in Sykesville are Sales & Related (141 | 6.1%), and Office & Administration (125 | 5.4%).
Sales and Office Occupations by Sex
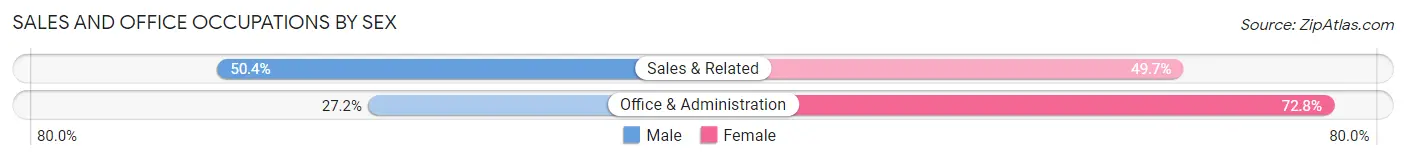
| Occupation | Male | Female |
| Sales & Related | 71 (50.3%) | 70 (49.6%) |
| Office & Administration | 34 (27.2%) | 91 (72.8%) |
| Total (Category) | 105 (39.5%) | 161 (60.5%) |
| Total (Overall) | 1,373 (59.5%) | 936 (40.5%) |
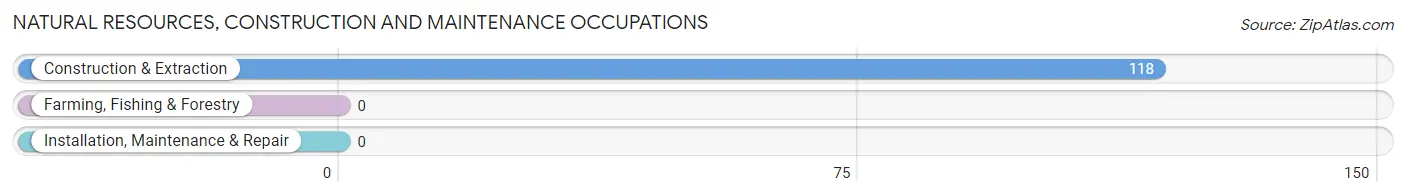
Natural Resources, Construction and Maintenance Occupations
The most common Natural Resources, Construction and Maintenance occupations in Sykesville are , and Construction & Extraction (118 | 5.1%).
Natural Resources, Construction and Maintenance Occupations by Sex
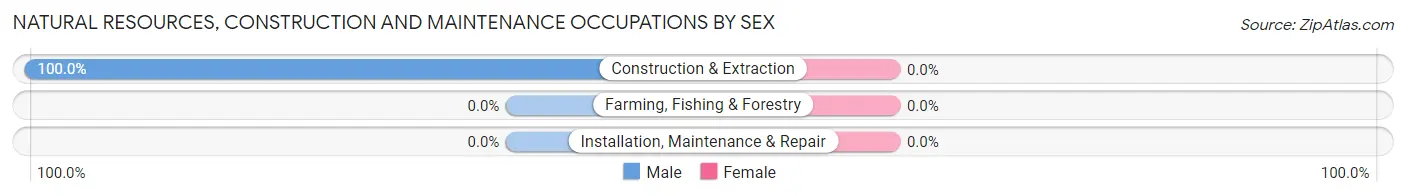
| Occupation | Male | Female |
| Farming, Fishing & Forestry | 0 (0.0%) | 0 (0.0%) |
| Construction & Extraction | 118 (100.0%) | 0 (0.0%) |
| Installation, Maintenance & Repair | 0 (0.0%) | 0 (0.0%) |
| Total (Category) | 118 (100.0%) | 0 (0.0%) |
| Total (Overall) | 1,373 (59.5%) | 936 (40.5%) |
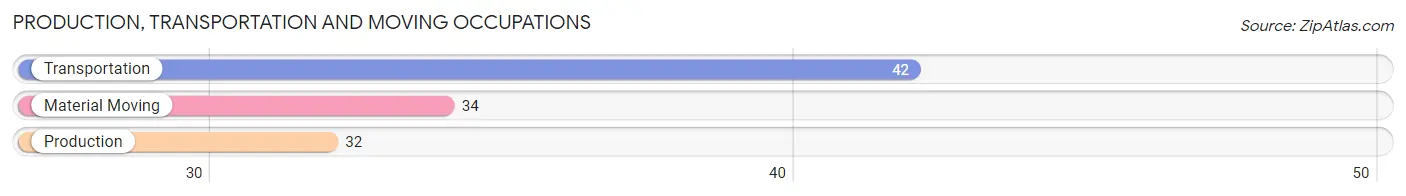
Production, Transportation and Moving Occupations
The most common Production, Transportation and Moving occupations in Sykesville are Transportation (42 | 1.8%), Material Moving (34 | 1.5%), and Production (32 | 1.4%).
Production, Transportation and Moving Occupations by Sex
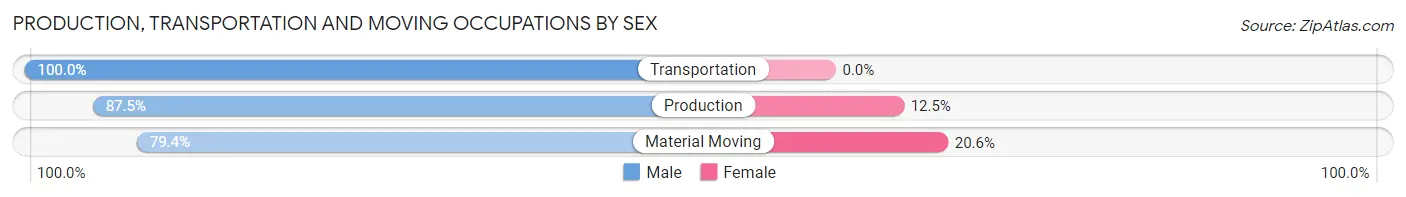
| Occupation | Male | Female |
| Production | 28 (87.5%) | 4 (12.5%) |
| Transportation | 42 (100.0%) | 0 (0.0%) |
| Material Moving | 27 (79.4%) | 7 (20.6%) |
| Total (Category) | 97 (89.8%) | 11 (10.2%) |
| Total (Overall) | 1,373 (59.5%) | 936 (40.5%) |
Employment Industries by Sex in Sykesville
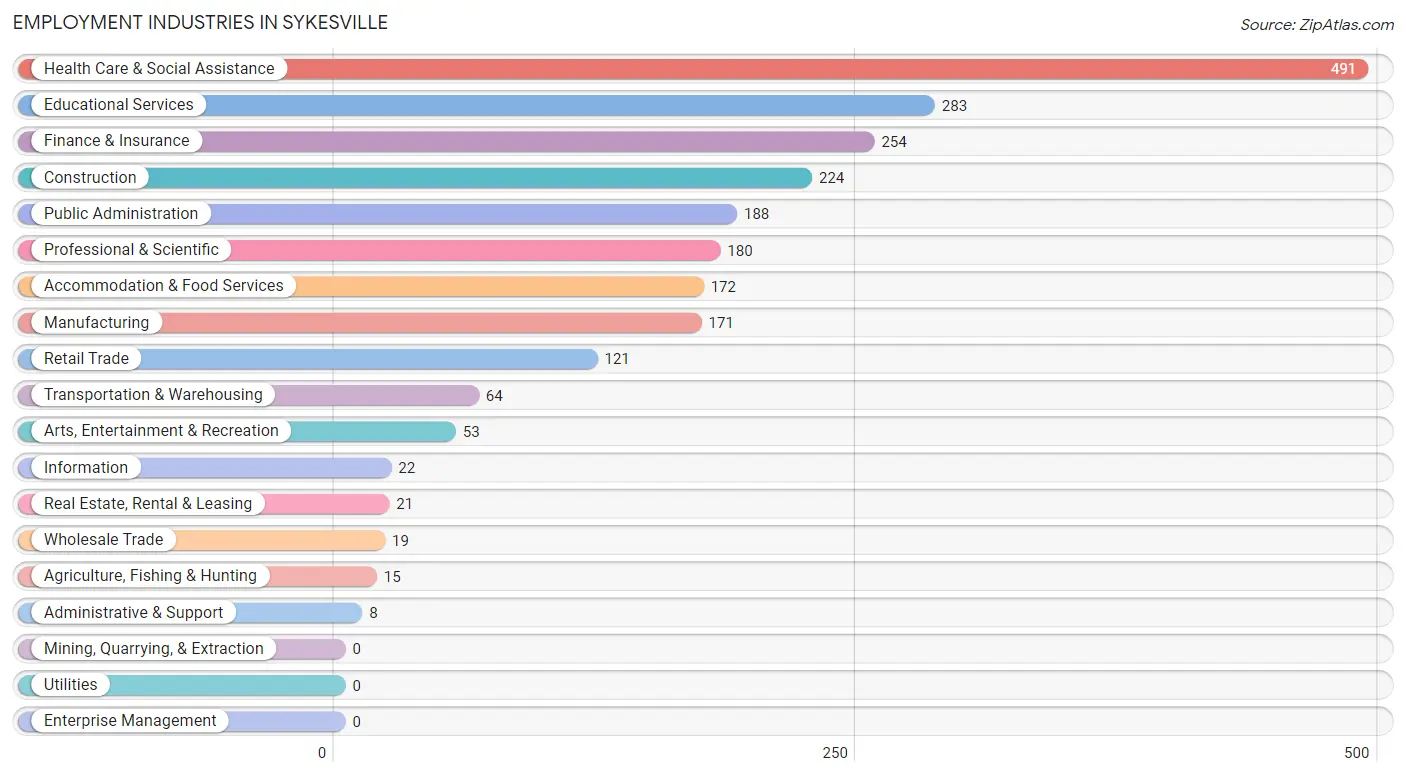
Employment Industries in Sykesville
The major employment industries in Sykesville include Health Care & Social Assistance (491 | 21.3%), Educational Services (283 | 12.3%), Finance & Insurance (254 | 11.0%), Construction (224 | 9.7%), and Public Administration (188 | 8.1%).
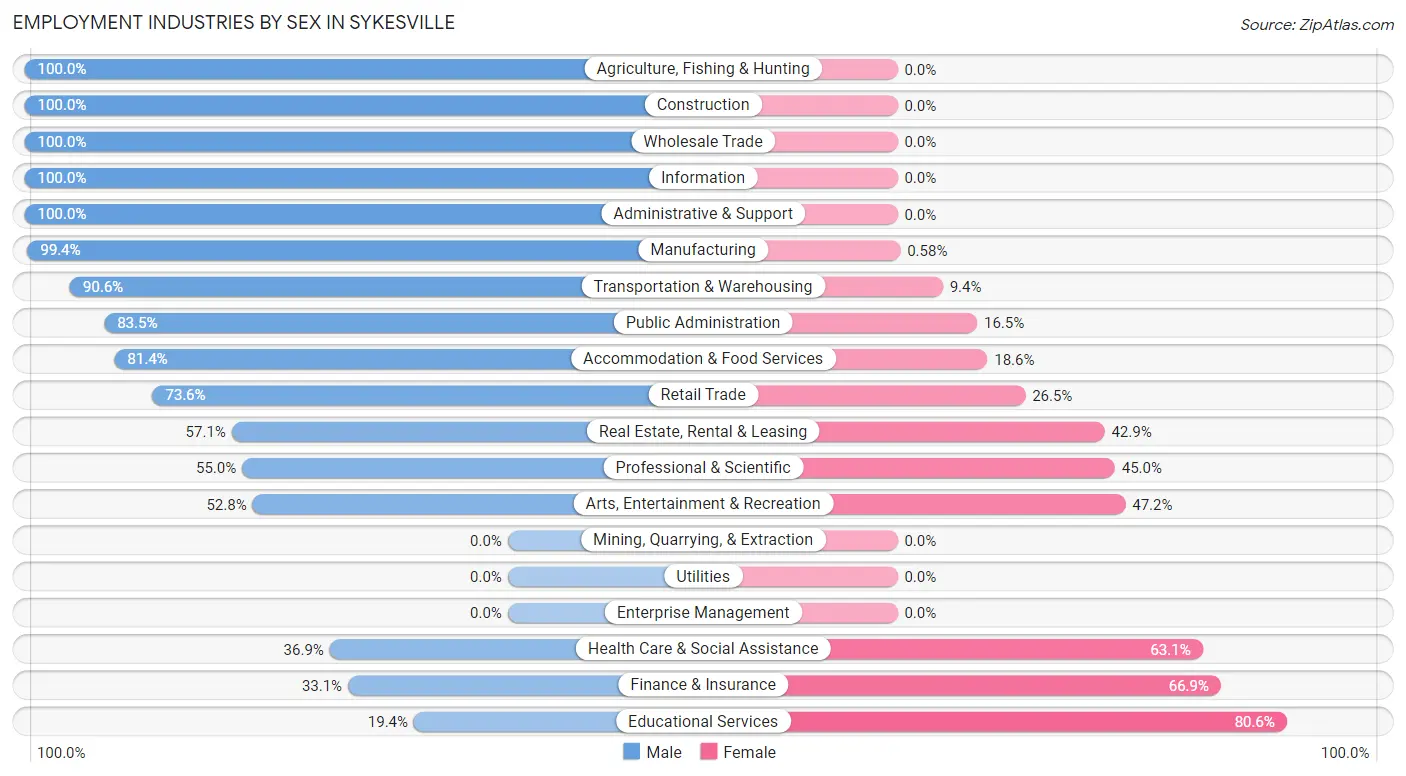
Employment Industries by Sex in Sykesville
The Sykesville industries that see more men than women are Agriculture, Fishing & Hunting (100.0%), Construction (100.0%), and Wholesale Trade (100.0%), whereas the industries that tend to have a higher number of women are Educational Services (80.6%), Finance & Insurance (66.9%), and Health Care & Social Assistance (63.1%).
| Industry | Male | Female |
| Agriculture, Fishing & Hunting | 15 (100.0%) | 0 (0.0%) |
| Mining, Quarrying, & Extraction | 0 (0.0%) | 0 (0.0%) |
| Construction | 224 (100.0%) | 0 (0.0%) |
| Manufacturing | 170 (99.4%) | 1 (0.6%) |
| Wholesale Trade | 19 (100.0%) | 0 (0.0%) |
| Retail Trade | 89 (73.6%) | 32 (26.5%) |
| Transportation & Warehousing | 58 (90.6%) | 6 (9.4%) |
| Utilities | 0 (0.0%) | 0 (0.0%) |
| Information | 22 (100.0%) | 0 (0.0%) |
| Finance & Insurance | 84 (33.1%) | 170 (66.9%) |
| Real Estate, Rental & Leasing | 12 (57.1%) | 9 (42.9%) |
| Professional & Scientific | 99 (55.0%) | 81 (45.0%) |
| Enterprise Management | 0 (0.0%) | 0 (0.0%) |
| Administrative & Support | 8 (100.0%) | 0 (0.0%) |
| Educational Services | 55 (19.4%) | 228 (80.6%) |
| Health Care & Social Assistance | 181 (36.9%) | 310 (63.1%) |
| Arts, Entertainment & Recreation | 28 (52.8%) | 25 (47.2%) |
| Accommodation & Food Services | 140 (81.4%) | 32 (18.6%) |
| Public Administration | 157 (83.5%) | 31 (16.5%) |
| Total | 1,373 (59.5%) | 936 (40.5%) |
Education in Sykesville
School Enrollment in Sykesville
The most common levels of schooling among the 1,676 students in Sykesville are college / undergraduate (448 | 26.7%), high school (342 | 20.4%), and middle school (312 | 18.6%).
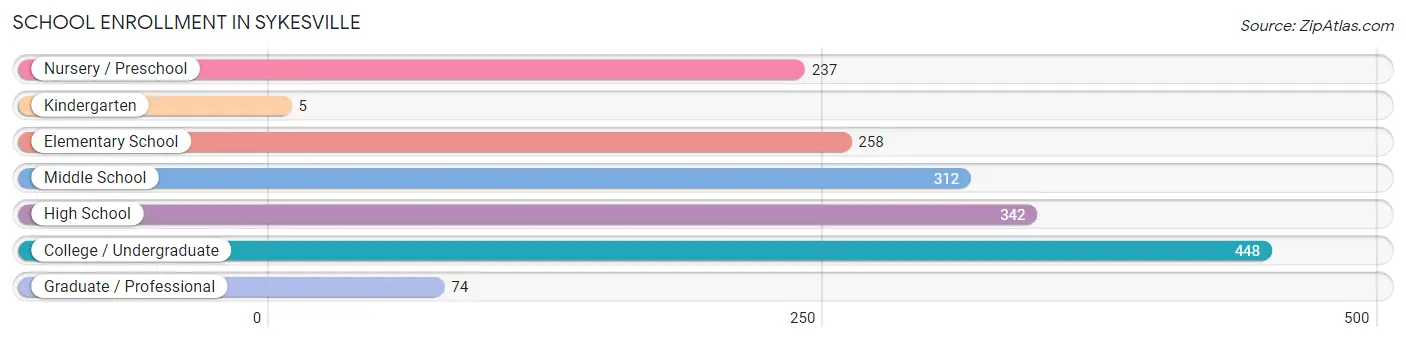
| School Level | # Students | % Students |
| Nursery / Preschool | 237 | 14.1% |
| Kindergarten | 5 | 0.3% |
| Elementary School | 258 | 15.4% |
| Middle School | 312 | 18.6% |
| High School | 342 | 20.4% |
| College / Undergraduate | 448 | 26.7% |
| Graduate / Professional | 74 | 4.4% |
| Total | 1,676 | 100.0% |
School Enrollment by Age by Funding Source in Sykesville
Out of a total of 1,676 students who are enrolled in schools in Sykesville, 426 (25.4%) attend a private institution, while the remaining 1,250 (74.6%) are enrolled in public schools. The age group of 3 to 4 year olds has the highest likelihood of being enrolled in private schools, with 96 (58.5% in the age bracket) enrolled. Conversely, the age group of 15 to 17 year olds has the lowest likelihood of being enrolled in a private school, with 244 (98.4% in the age bracket) attending a public institution.
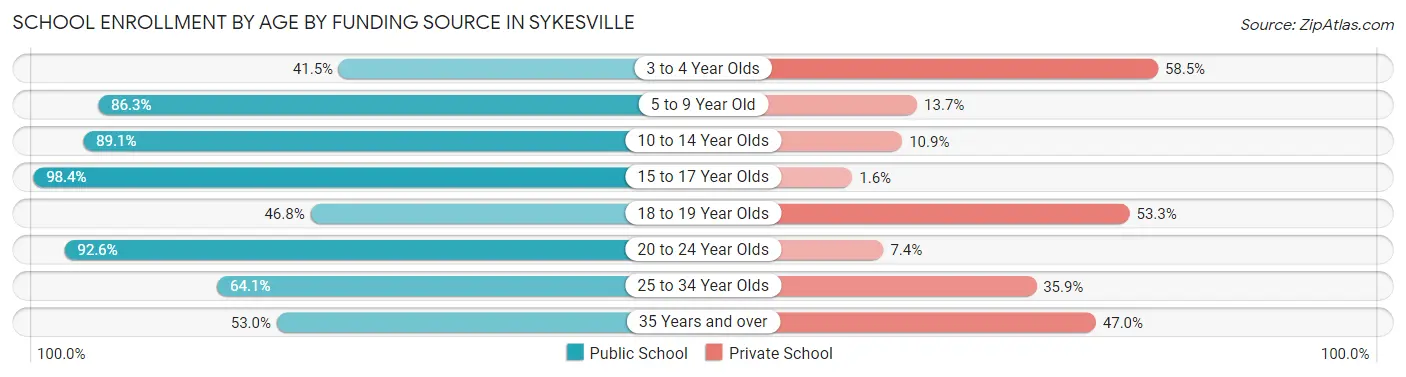
| Age Bracket | Public School | Private School |
| 3 to 4 Year Olds | 68 (41.5%) | 96 (58.5%) |
| 5 to 9 Year Old | 290 (86.3%) | 46 (13.7%) |
| 10 to 14 Year Olds | 302 (89.1%) | 37 (10.9%) |
| 15 to 17 Year Olds | 244 (98.4%) | 4 (1.6%) |
| 18 to 19 Year Olds | 108 (46.8%) | 123 (53.2%) |
| 20 to 24 Year Olds | 75 (92.6%) | 6 (7.4%) |
| 25 to 34 Year Olds | 93 (64.1%) | 52 (35.9%) |
| 35 Years and over | 70 (53.0%) | 62 (47.0%) |
| Total | 1,250 (74.6%) | 426 (25.4%) |
Educational Attainment by Field of Study in Sykesville
Business (333 | 23.2%), bio, nature & agricultural (202 | 14.1%), education (198 | 13.8%), engineering (133 | 9.3%), and physical & health sciences (130 | 9.0%) are the most common fields of study among 1,437 individuals in Sykesville who have obtained a bachelor's degree or higher.
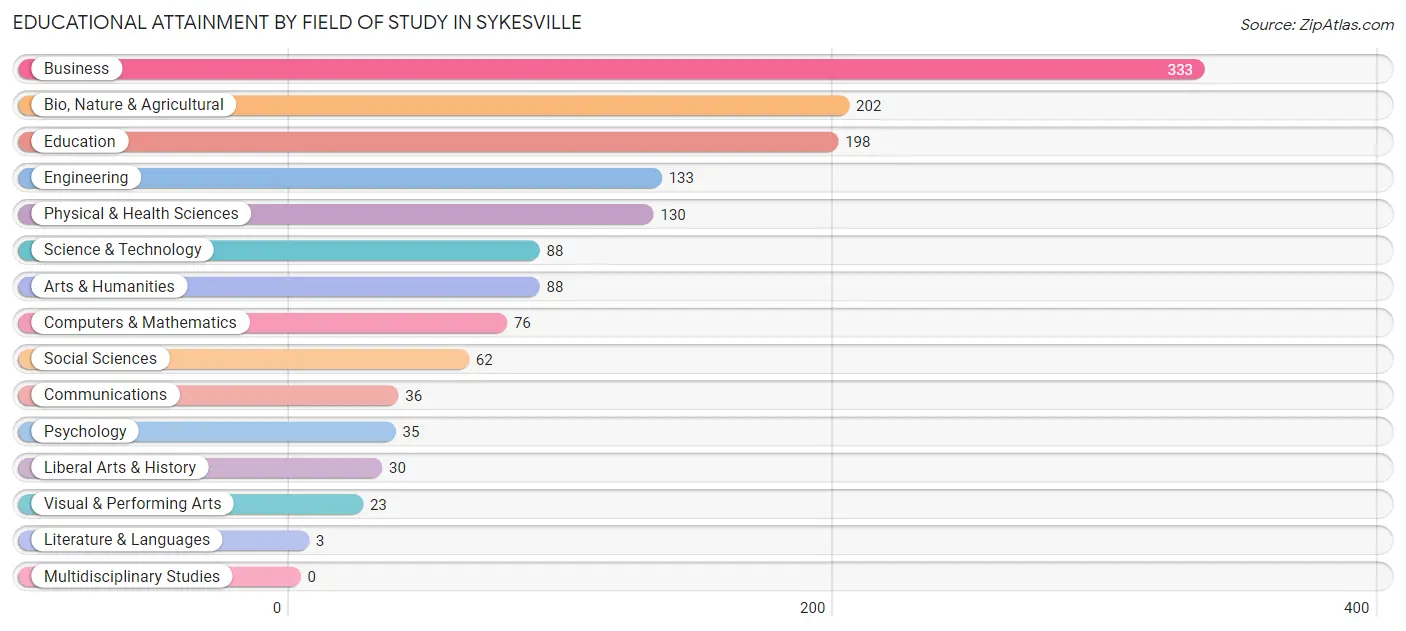
| Field of Study | # Graduates | % Graduates |
| Computers & Mathematics | 76 | 5.3% |
| Bio, Nature & Agricultural | 202 | 14.1% |
| Physical & Health Sciences | 130 | 9.0% |
| Psychology | 35 | 2.4% |
| Social Sciences | 62 | 4.3% |
| Engineering | 133 | 9.3% |
| Multidisciplinary Studies | 0 | 0.0% |
| Science & Technology | 88 | 6.1% |
| Business | 333 | 23.2% |
| Education | 198 | 13.8% |
| Literature & Languages | 3 | 0.2% |
| Liberal Arts & History | 30 | 2.1% |
| Visual & Performing Arts | 23 | 1.6% |
| Communications | 36 | 2.5% |
| Arts & Humanities | 88 | 6.1% |
| Total | 1,437 | 100.0% |
Transportation & Commute in Sykesville
Vehicle Availability by Sex in Sykesville
The most prevalent vehicle ownership categories in Sykesville are males with 2 vehicles (583, accounting for 45.9%) and females with 2 vehicles (485, making up 62.9%).
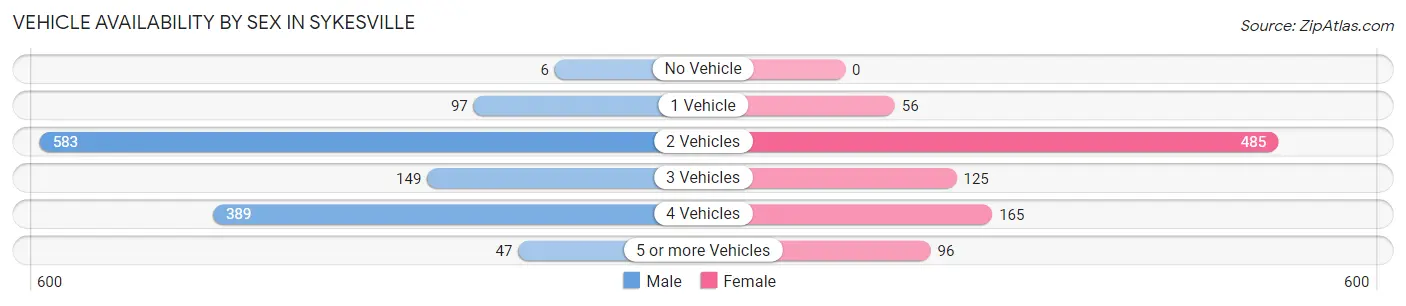
| Vehicles Available | Male | Female |
| No Vehicle | 6 (0.5%) | 0 (0.0%) |
| 1 Vehicle | 97 (7.6%) | 56 (6.0%) |
| 2 Vehicles | 583 (45.9%) | 485 (52.3%) |
| 3 Vehicles | 149 (11.7%) | 125 (13.5%) |
| 4 Vehicles | 389 (30.6%) | 165 (17.8%) |
| 5 or more Vehicles | 47 (3.7%) | 96 (10.4%) |
| Total | 1,271 (100.0%) | 927 (100.0%) |
Commute Time in Sykesville
The most frequently occuring commute durations in Sykesville are 45 to 59 minutes (533 commuters, 26.2%), 20 to 24 minutes (308 commuters, 15.1%), and 30 to 34 minutes (241 commuters, 11.8%).
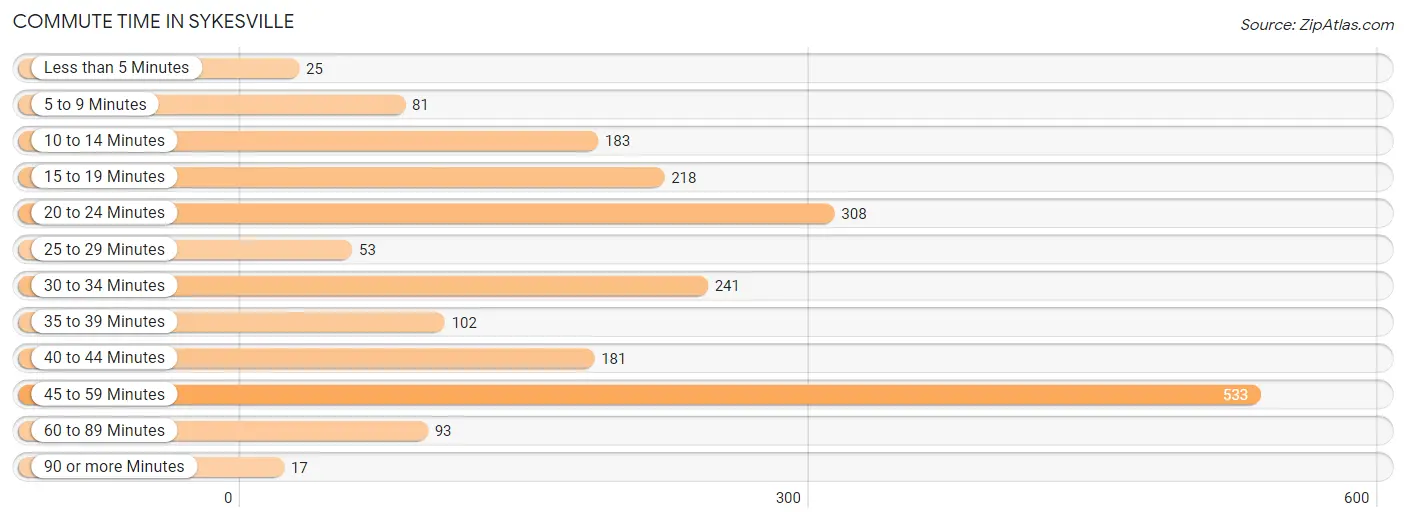
| Commute Time | # Commuters | % Commuters |
| Less than 5 Minutes | 25 | 1.2% |
| 5 to 9 Minutes | 81 | 4.0% |
| 10 to 14 Minutes | 183 | 9.0% |
| 15 to 19 Minutes | 218 | 10.7% |
| 20 to 24 Minutes | 308 | 15.1% |
| 25 to 29 Minutes | 53 | 2.6% |
| 30 to 34 Minutes | 241 | 11.8% |
| 35 to 39 Minutes | 102 | 5.0% |
| 40 to 44 Minutes | 181 | 8.9% |
| 45 to 59 Minutes | 533 | 26.2% |
| 60 to 89 Minutes | 93 | 4.6% |
| 90 or more Minutes | 17 | 0.8% |
Commute Time by Sex in Sykesville
The most common commute times in Sykesville are 45 to 59 minutes (366 commuters, 30.3%) for males and 45 to 59 minutes (167 commuters, 20.2%) for females.
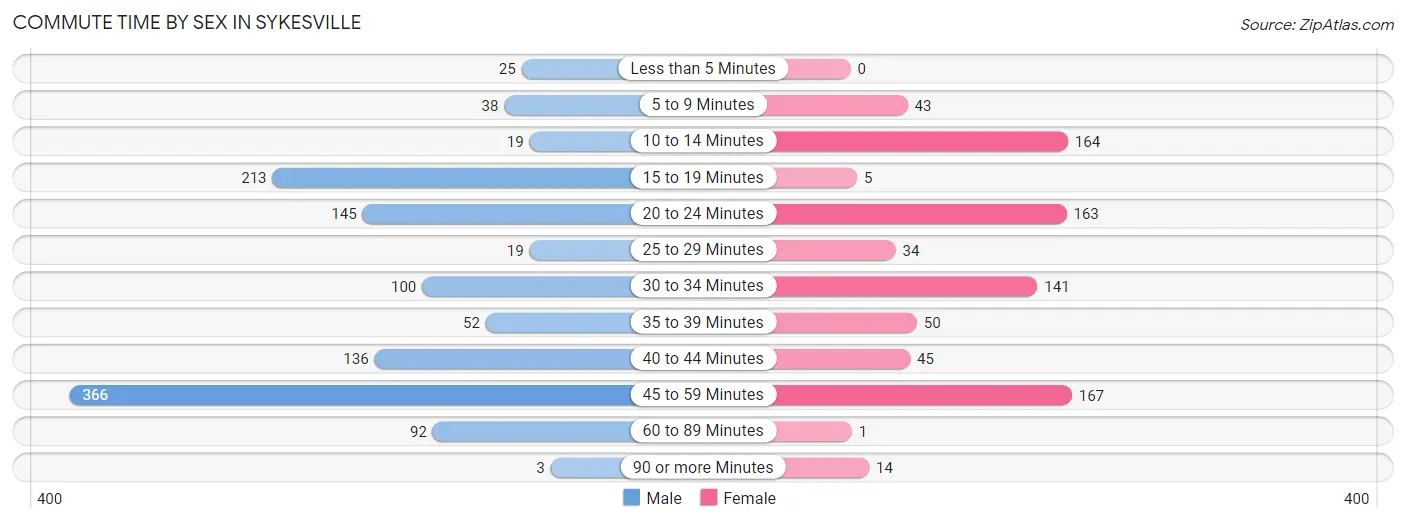
| Commute Time | Male | Female |
| Less than 5 Minutes | 25 (2.1%) | 0 (0.0%) |
| 5 to 9 Minutes | 38 (3.2%) | 43 (5.2%) |
| 10 to 14 Minutes | 19 (1.6%) | 164 (19.8%) |
| 15 to 19 Minutes | 213 (17.6%) | 5 (0.6%) |
| 20 to 24 Minutes | 145 (12.0%) | 163 (19.7%) |
| 25 to 29 Minutes | 19 (1.6%) | 34 (4.1%) |
| 30 to 34 Minutes | 100 (8.3%) | 141 (17.1%) |
| 35 to 39 Minutes | 52 (4.3%) | 50 (6.0%) |
| 40 to 44 Minutes | 136 (11.3%) | 45 (5.4%) |
| 45 to 59 Minutes | 366 (30.3%) | 167 (20.2%) |
| 60 to 89 Minutes | 92 (7.6%) | 1 (0.1%) |
| 90 or more Minutes | 3 (0.3%) | 14 (1.7%) |
Time of Departure to Work by Sex in Sykesville
The most frequent times of departure to work in Sykesville are 12:00 PM to 3:59 PM (191, 15.8%) for males and 7:00 AM to 7:29 AM (129, 15.6%) for females.
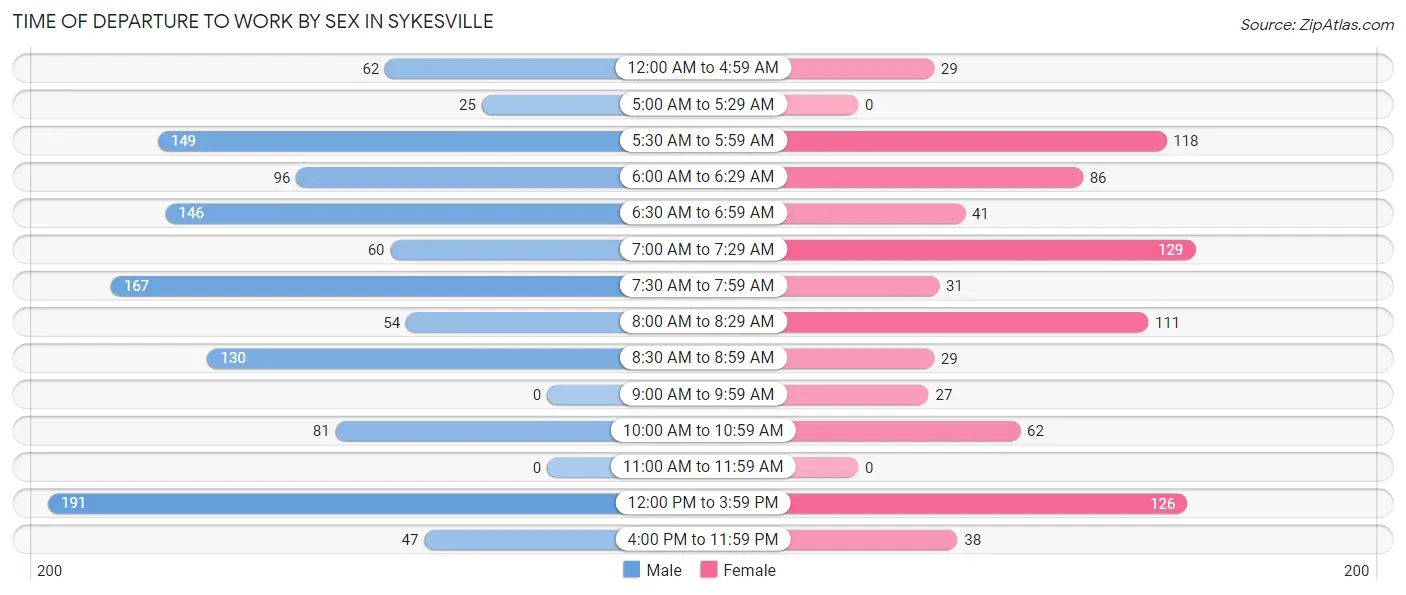
| Time of Departure | Male | Female |
| 12:00 AM to 4:59 AM | 62 (5.1%) | 29 (3.5%) |
| 5:00 AM to 5:29 AM | 25 (2.1%) | 0 (0.0%) |
| 5:30 AM to 5:59 AM | 149 (12.3%) | 118 (14.3%) |
| 6:00 AM to 6:29 AM | 96 (8.0%) | 86 (10.4%) |
| 6:30 AM to 6:59 AM | 146 (12.1%) | 41 (5.0%) |
| 7:00 AM to 7:29 AM | 60 (5.0%) | 129 (15.6%) |
| 7:30 AM to 7:59 AM | 167 (13.8%) | 31 (3.7%) |
| 8:00 AM to 8:29 AM | 54 (4.5%) | 111 (13.4%) |
| 8:30 AM to 8:59 AM | 130 (10.8%) | 29 (3.5%) |
| 9:00 AM to 9:59 AM | 0 (0.0%) | 27 (3.3%) |
| 10:00 AM to 10:59 AM | 81 (6.7%) | 62 (7.5%) |
| 11:00 AM to 11:59 AM | 0 (0.0%) | 0 (0.0%) |
| 12:00 PM to 3:59 PM | 191 (15.8%) | 126 (15.2%) |
| 4:00 PM to 11:59 PM | 47 (3.9%) | 38 (4.6%) |
| Total | 1,208 (100.0%) | 827 (100.0%) |
Housing Occupancy in Sykesville
Occupancy by Ownership in Sykesville
Of the total 1,409 dwellings in Sykesville, owner-occupied units account for 953 (67.6%), while renter-occupied units make up 456 (32.4%).
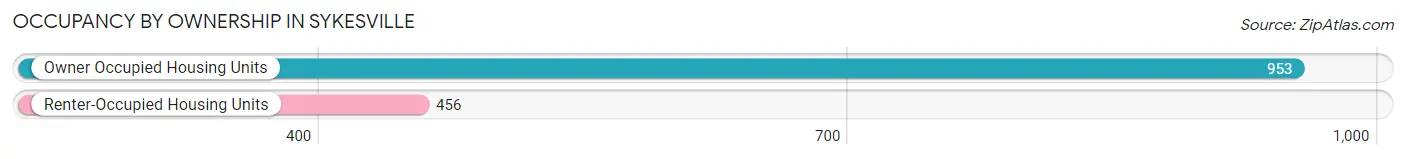
| Occupancy | # Housing Units | % Housing Units |
| Owner Occupied Housing Units | 953 | 67.6% |
| Renter-Occupied Housing Units | 456 | 32.4% |
| Total Occupied Housing Units | 1,409 | 100.0% |
Occupancy by Household Size in Sykesville
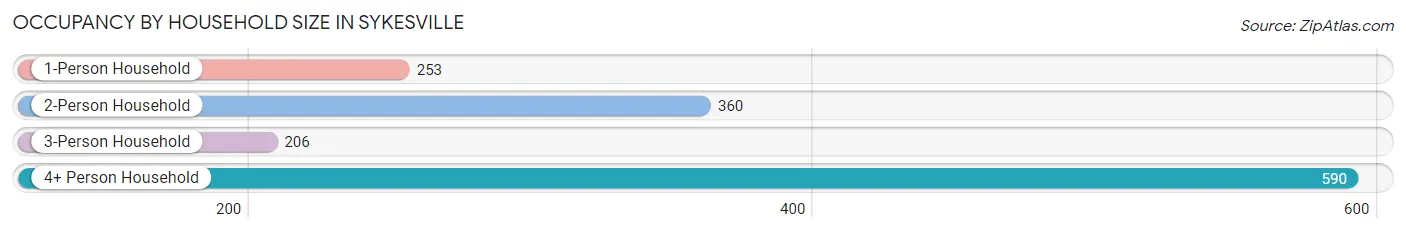
| Household Size | # Housing Units | % Housing Units |
| 1-Person Household | 253 | 18.0% |
| 2-Person Household | 360 | 25.6% |
| 3-Person Household | 206 | 14.6% |
| 4+ Person Household | 590 | 41.9% |
| Total Housing Units | 1,409 | 100.0% |
Occupancy by Ownership by Household Size in Sykesville
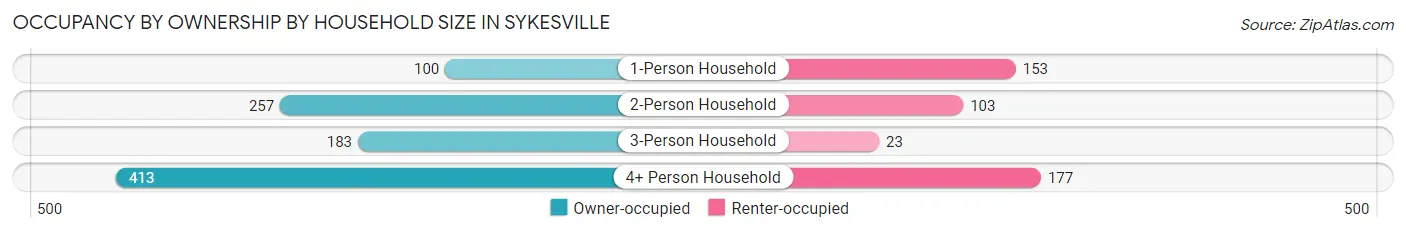
| Household Size | Owner-occupied | Renter-occupied |
| 1-Person Household | 100 (39.5%) | 153 (60.5%) |
| 2-Person Household | 257 (71.4%) | 103 (28.6%) |
| 3-Person Household | 183 (88.8%) | 23 (11.2%) |
| 4+ Person Household | 413 (70.0%) | 177 (30.0%) |
| Total Housing Units | 953 (67.6%) | 456 (32.4%) |
Occupancy by Educational Attainment in Sykesville
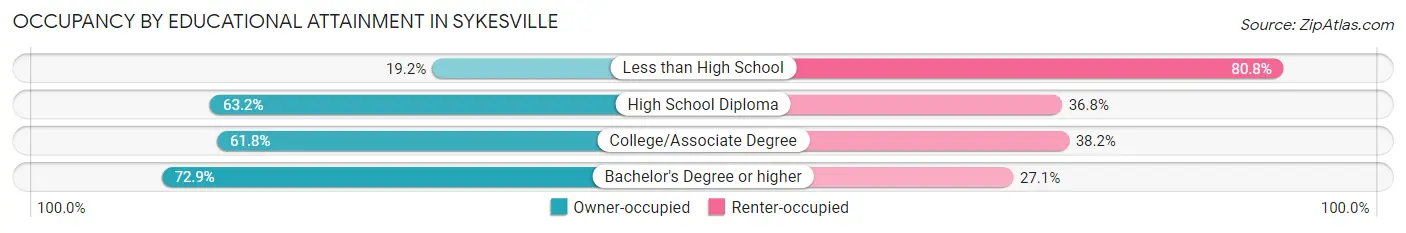
| Household Size | Owner-occupied | Renter-occupied |
| Less than High School | 5 (19.2%) | 21 (80.8%) |
| High School Diploma | 122 (63.2%) | 71 (36.8%) |
| College/Associate Degree | 230 (61.8%) | 142 (38.2%) |
| Bachelor's Degree or higher | 596 (72.9%) | 222 (27.1%) |
Occupancy by Age of Householder in Sykesville
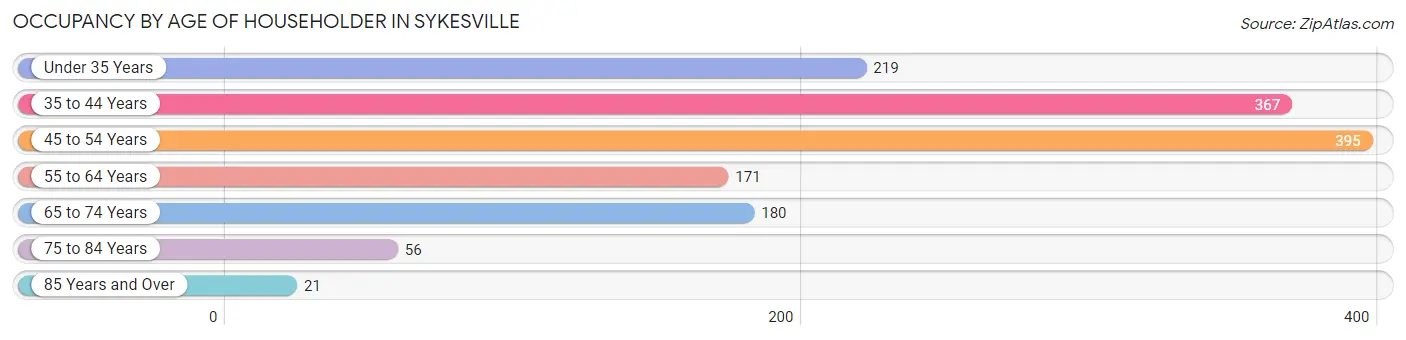
| Age Bracket | # Households | % Households |
| Under 35 Years | 219 | 15.5% |
| 35 to 44 Years | 367 | 26.1% |
| 45 to 54 Years | 395 | 28.0% |
| 55 to 64 Years | 171 | 12.1% |
| 65 to 74 Years | 180 | 12.8% |
| 75 to 84 Years | 56 | 4.0% |
| 85 Years and Over | 21 | 1.5% |
| Total | 1,409 | 100.0% |
Housing Finances in Sykesville
Median Income by Occupancy in Sykesville
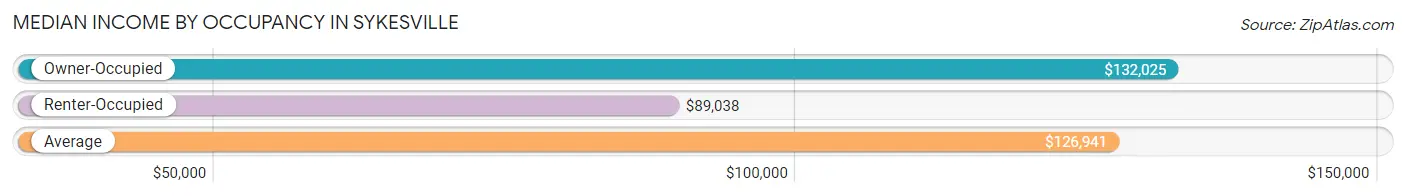
| Occupancy Type | # Households | Median Income |
| Owner-Occupied | 953 (67.6%) | $132,025 |
| Renter-Occupied | 456 (32.4%) | $89,038 |
| Average | 1,409 (100.0%) | $126,941 |
Occupancy by Householder Income Bracket in Sykesville
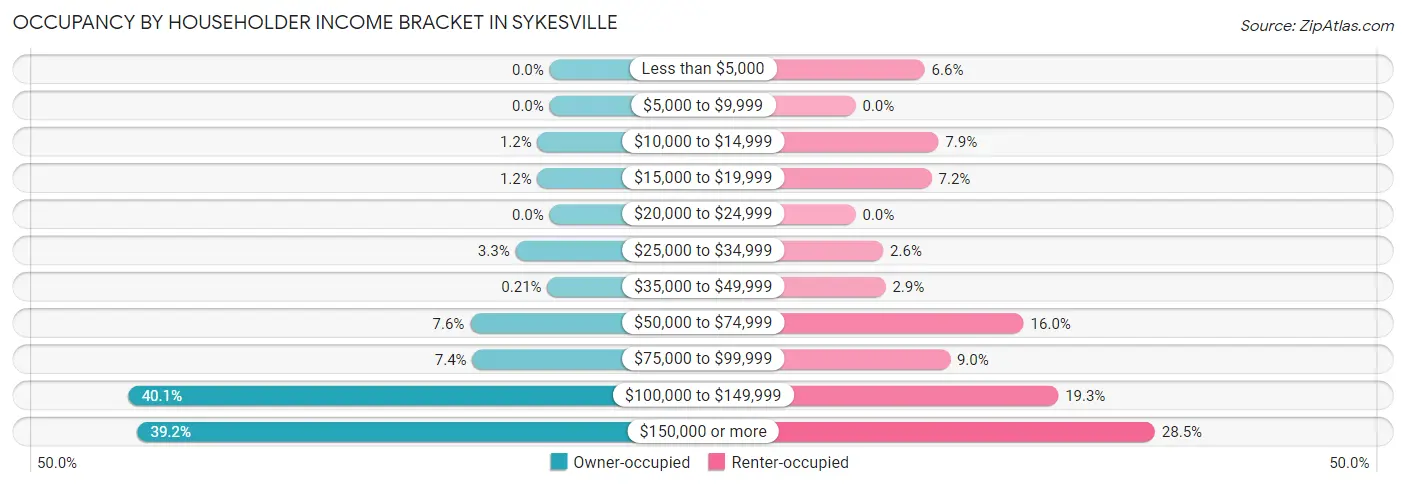
| Income Bracket | Owner-occupied | Renter-occupied |
| Less than $5,000 | 0 (0.0%) | 30 (6.6%) |
| $5,000 to $9,999 | 0 (0.0%) | 0 (0.0%) |
| $10,000 to $14,999 | 11 (1.1%) | 36 (7.9%) |
| $15,000 to $19,999 | 11 (1.1%) | 33 (7.2%) |
| $20,000 to $24,999 | 0 (0.0%) | 0 (0.0%) |
| $25,000 to $34,999 | 31 (3.3%) | 12 (2.6%) |
| $35,000 to $49,999 | 2 (0.2%) | 13 (2.9%) |
| $50,000 to $74,999 | 72 (7.6%) | 73 (16.0%) |
| $75,000 to $99,999 | 70 (7.3%) | 41 (9.0%) |
| $100,000 to $149,999 | 382 (40.1%) | 88 (19.3%) |
| $150,000 or more | 374 (39.2%) | 130 (28.5%) |
| Total | 953 (100.0%) | 456 (100.0%) |
Monthly Housing Cost Tiers in Sykesville
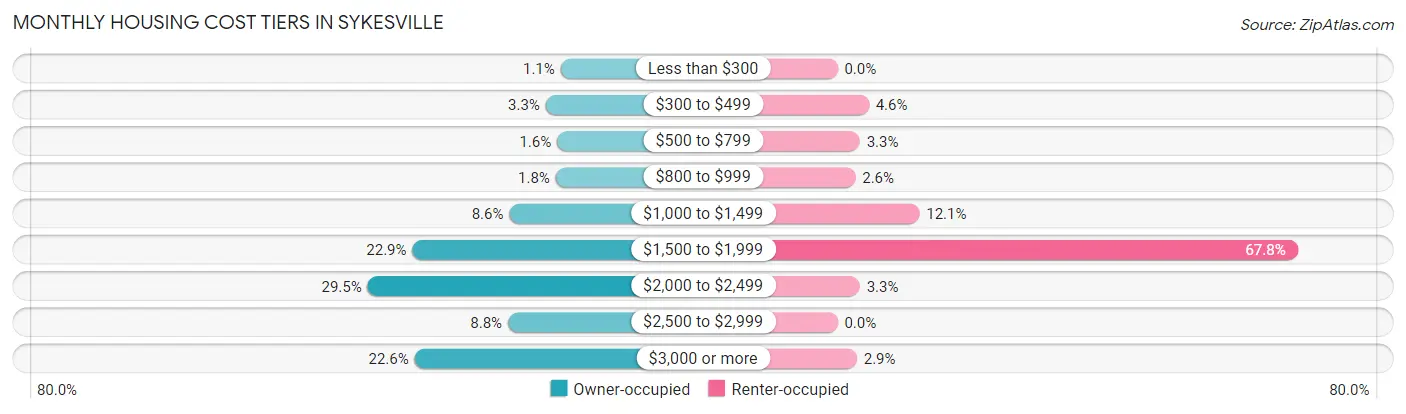
| Monthly Cost | Owner-occupied | Renter-occupied |
| Less than $300 | 10 (1.1%) | 0 (0.0%) |
| $300 to $499 | 31 (3.3%) | 21 (4.6%) |
| $500 to $799 | 15 (1.6%) | 15 (3.3%) |
| $800 to $999 | 17 (1.8%) | 12 (2.6%) |
| $1,000 to $1,499 | 82 (8.6%) | 55 (12.1%) |
| $1,500 to $1,999 | 218 (22.9%) | 309 (67.8%) |
| $2,000 to $2,499 | 281 (29.5%) | 15 (3.3%) |
| $2,500 to $2,999 | 84 (8.8%) | 0 (0.0%) |
| $3,000 or more | 215 (22.6%) | 13 (2.9%) |
| Total | 953 (100.0%) | 456 (100.0%) |
Physical Housing Characteristics in Sykesville
Housing Structures in Sykesville
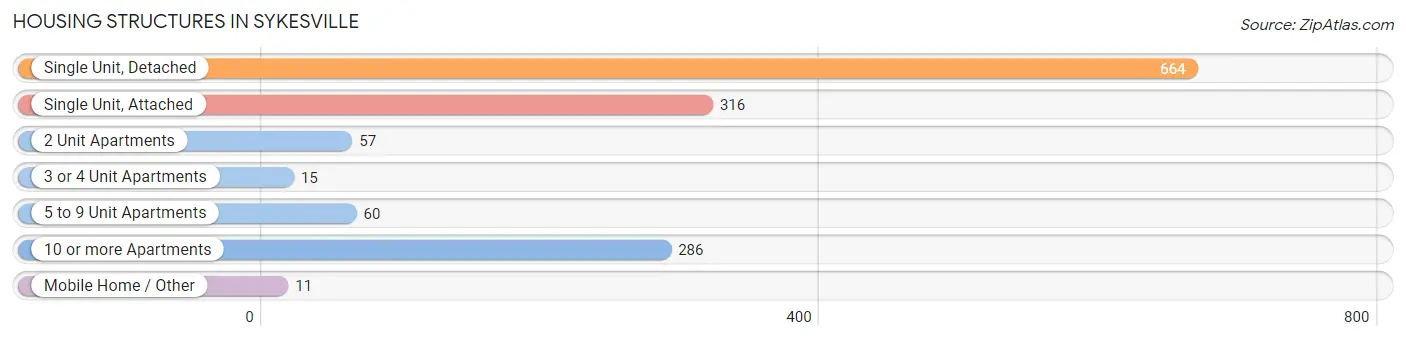
| Structure Type | # Housing Units | % Housing Units |
| Single Unit, Detached | 664 | 47.1% |
| Single Unit, Attached | 316 | 22.4% |
| 2 Unit Apartments | 57 | 4.1% |
| 3 or 4 Unit Apartments | 15 | 1.1% |
| 5 to 9 Unit Apartments | 60 | 4.3% |
| 10 or more Apartments | 286 | 20.3% |
| Mobile Home / Other | 11 | 0.8% |
| Total | 1,409 | 100.0% |
Housing Structures by Occupancy in Sykesville
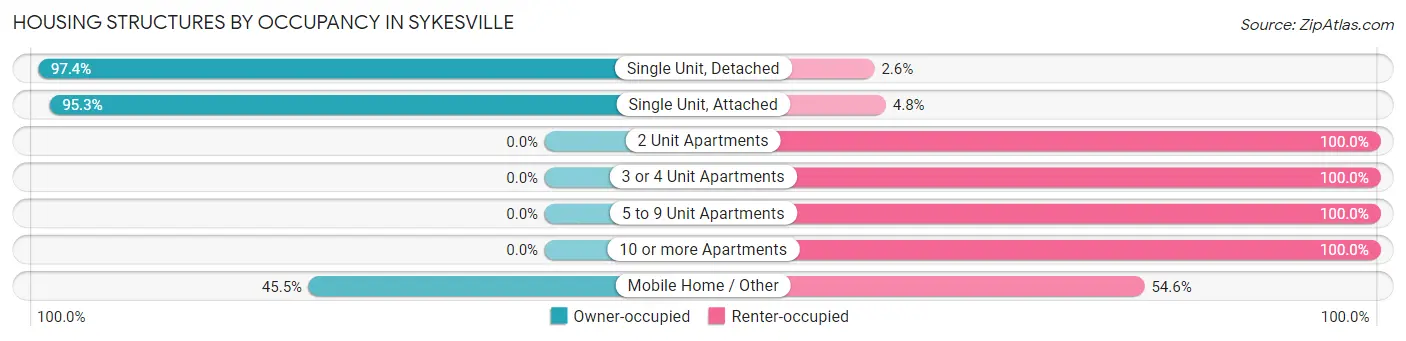
| Structure Type | Owner-occupied | Renter-occupied |
| Single Unit, Detached | 647 (97.4%) | 17 (2.6%) |
| Single Unit, Attached | 301 (95.3%) | 15 (4.8%) |
| 2 Unit Apartments | 0 (0.0%) | 57 (100.0%) |
| 3 or 4 Unit Apartments | 0 (0.0%) | 15 (100.0%) |
| 5 to 9 Unit Apartments | 0 (0.0%) | 60 (100.0%) |
| 10 or more Apartments | 0 (0.0%) | 286 (100.0%) |
| Mobile Home / Other | 5 (45.5%) | 6 (54.5%) |
| Total | 953 (67.6%) | 456 (32.4%) |
Housing Structures by Number of Rooms in Sykesville
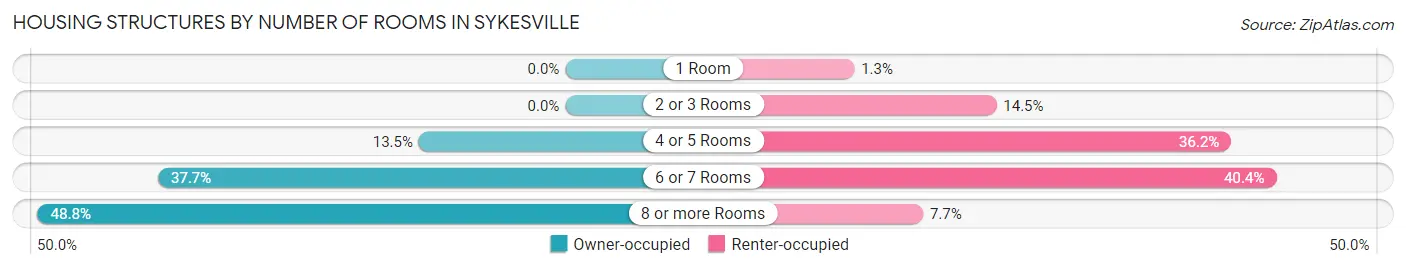
| Number of Rooms | Owner-occupied | Renter-occupied |
| 1 Room | 0 (0.0%) | 6 (1.3%) |
| 2 or 3 Rooms | 0 (0.0%) | 66 (14.5%) |
| 4 or 5 Rooms | 129 (13.5%) | 165 (36.2%) |
| 6 or 7 Rooms | 359 (37.7%) | 184 (40.4%) |
| 8 or more Rooms | 465 (48.8%) | 35 (7.7%) |
| Total | 953 (100.0%) | 456 (100.0%) |
Housing Structure by Heating Type in Sykesville
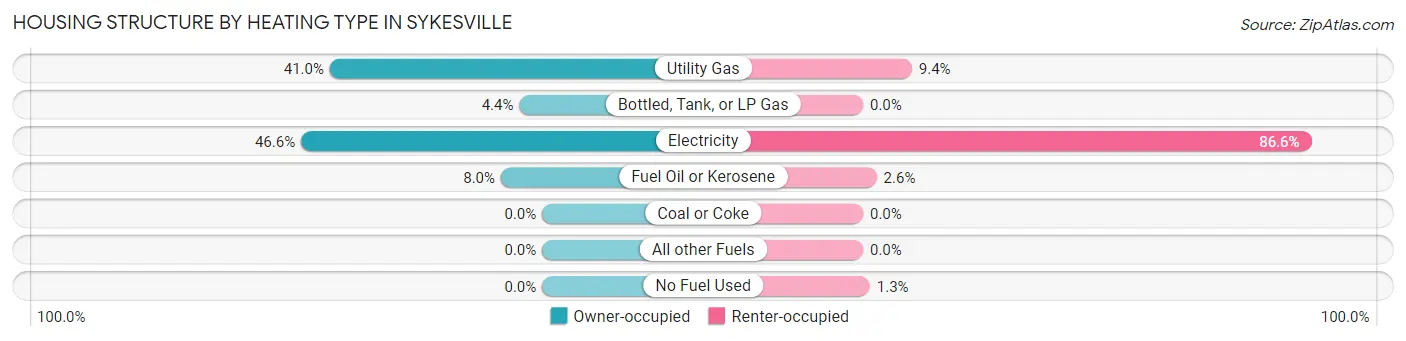
| Heating Type | Owner-occupied | Renter-occupied |
| Utility Gas | 391 (41.0%) | 43 (9.4%) |
| Bottled, Tank, or LP Gas | 42 (4.4%) | 0 (0.0%) |
| Electricity | 444 (46.6%) | 395 (86.6%) |
| Fuel Oil or Kerosene | 76 (8.0%) | 12 (2.6%) |
| Coal or Coke | 0 (0.0%) | 0 (0.0%) |
| All other Fuels | 0 (0.0%) | 0 (0.0%) |
| No Fuel Used | 0 (0.0%) | 6 (1.3%) |
| Total | 953 (100.0%) | 456 (100.0%) |
Household Vehicle Usage in Sykesville
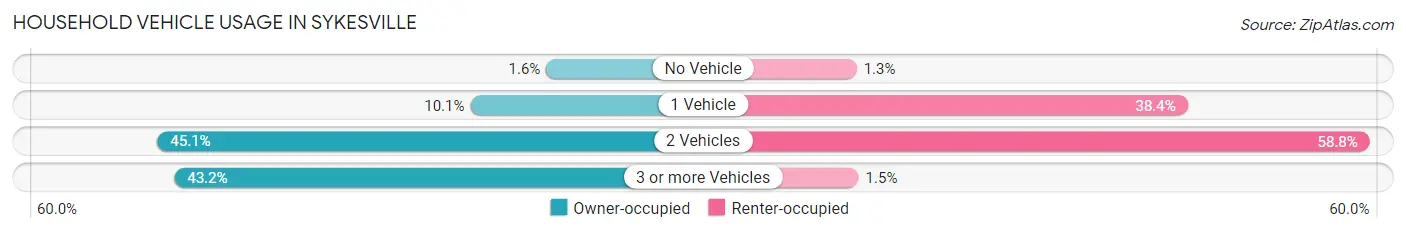
| Vehicles per Household | Owner-occupied | Renter-occupied |
| No Vehicle | 15 (1.6%) | 6 (1.3%) |
| 1 Vehicle | 96 (10.1%) | 175 (38.4%) |
| 2 Vehicles | 430 (45.1%) | 268 (58.8%) |
| 3 or more Vehicles | 412 (43.2%) | 7 (1.5%) |
| Total | 953 (100.0%) | 456 (100.0%) |
Real Estate & Mortgages in Sykesville
Real Estate and Mortgage Overview in Sykesville
| Characteristic | Without Mortgage | With Mortgage |
| Housing Units | 80 | 873 |
| Median Property Value | $377,400 | $392,200 |
| Median Household Income | $96,875 | $354 |
| Monthly Housing Costs | $495 | $215 |
| Real Estate Taxes | $3,824 | $0 |
Property Value by Mortgage Status in Sykesville
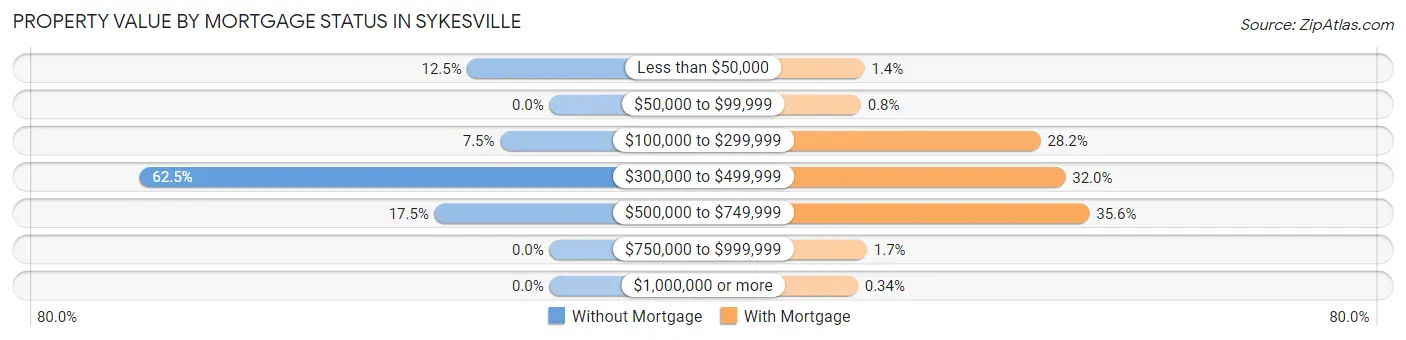
| Property Value | Without Mortgage | With Mortgage |
| Less than $50,000 | 10 (12.5%) | 12 (1.4%) |
| $50,000 to $99,999 | 0 (0.0%) | 7 (0.8%) |
| $100,000 to $299,999 | 6 (7.5%) | 246 (28.2%) |
| $300,000 to $499,999 | 50 (62.5%) | 279 (32.0%) |
| $500,000 to $749,999 | 14 (17.5%) | 311 (35.6%) |
| $750,000 to $999,999 | 0 (0.0%) | 15 (1.7%) |
| $1,000,000 or more | 0 (0.0%) | 3 (0.3%) |
| Total | 80 (100.0%) | 873 (100.0%) |
Household Income by Mortgage Status in Sykesville
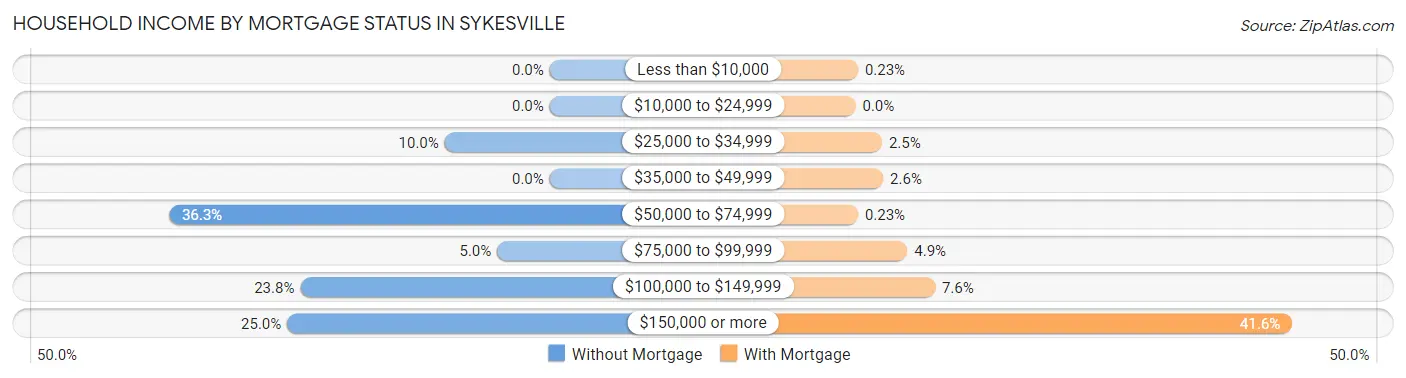
| Household Income | Without Mortgage | With Mortgage |
| Less than $10,000 | 0 (0.0%) | 2 (0.2%) |
| $10,000 to $24,999 | 0 (0.0%) | 0 (0.0%) |
| $25,000 to $34,999 | 8 (10.0%) | 22 (2.5%) |
| $35,000 to $49,999 | 0 (0.0%) | 23 (2.6%) |
| $50,000 to $74,999 | 29 (36.2%) | 2 (0.2%) |
| $75,000 to $99,999 | 4 (5.0%) | 43 (4.9%) |
| $100,000 to $149,999 | 19 (23.7%) | 66 (7.6%) |
| $150,000 or more | 20 (25.0%) | 363 (41.6%) |
| Total | 80 (100.0%) | 873 (100.0%) |
Property Value to Household Income Ratio in Sykesville
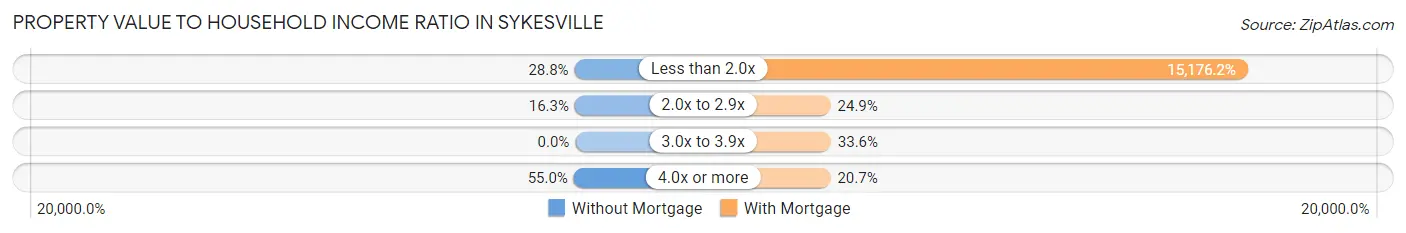
| Value-to-Income Ratio | Without Mortgage | With Mortgage |
| Less than 2.0x | 23 (28.7%) | 132,488 (15,176.2%) |
| 2.0x to 2.9x | 13 (16.3%) | 217 (24.9%) |
| 3.0x to 3.9x | 0 (0.0%) | 293 (33.6%) |
| 4.0x or more | 44 (55.0%) | 181 (20.7%) |
| Total | 80 (100.0%) | 873 (100.0%) |
Real Estate Taxes by Mortgage Status in Sykesville
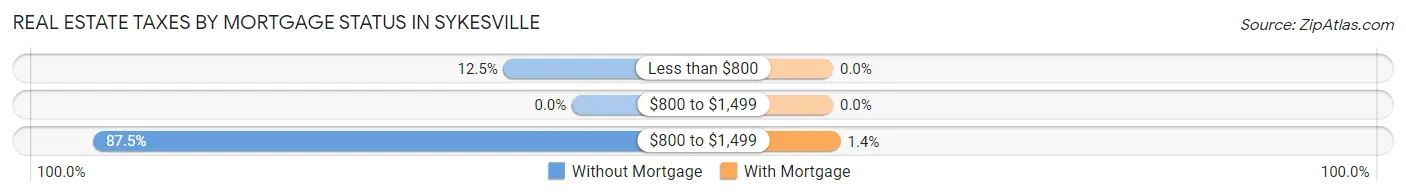
| Property Taxes | Without Mortgage | With Mortgage |
| Less than $800 | 10 (12.5%) | 0 (0.0%) |
| $800 to $1,499 | 0 (0.0%) | 0 (0.0%) |
| $800 to $1,499 | 70 (87.5%) | 12 (1.4%) |
| Total | 80 (100.0%) | 873 (100.0%) |
Health & Disability in Sykesville
Health Insurance Coverage by Age in Sykesville
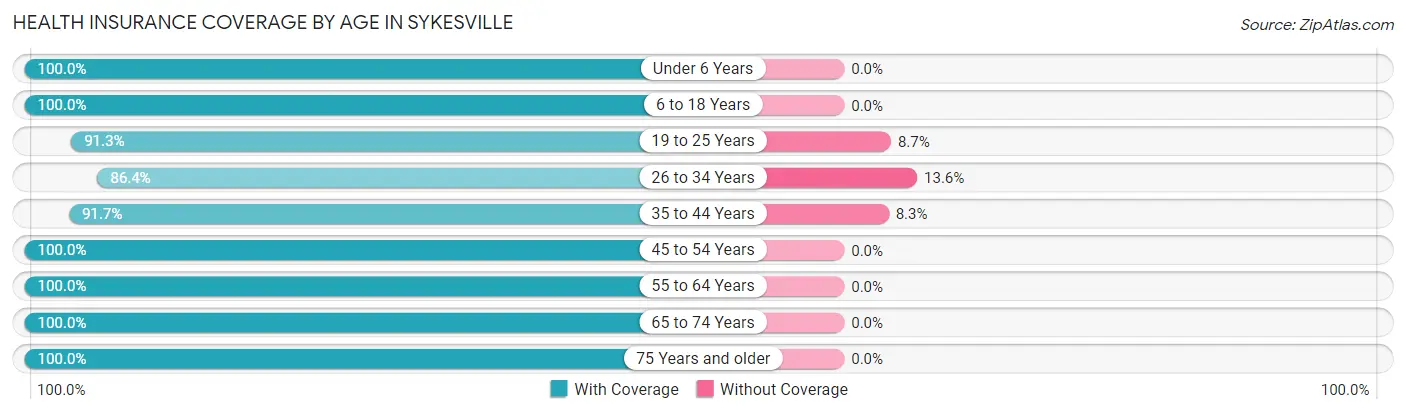
| Age Bracket | With Coverage | Without Coverage |
| Under 6 Years | 385 (100.0%) | 0 (0.0%) |
| 6 to 18 Years | 921 (100.0%) | 0 (0.0%) |
| 19 to 25 Years | 336 (91.3%) | 32 (8.7%) |
| 26 to 34 Years | 420 (86.4%) | 66 (13.6%) |
| 35 to 44 Years | 609 (91.7%) | 55 (8.3%) |
| 45 to 54 Years | 714 (100.0%) | 0 (0.0%) |
| 55 to 64 Years | 262 (100.0%) | 0 (0.0%) |
| 65 to 74 Years | 297 (100.0%) | 0 (0.0%) |
| 75 Years and older | 94 (100.0%) | 0 (0.0%) |
| Total | 4,038 (96.4%) | 153 (3.6%) |
Health Insurance Coverage by Citizenship Status in Sykesville
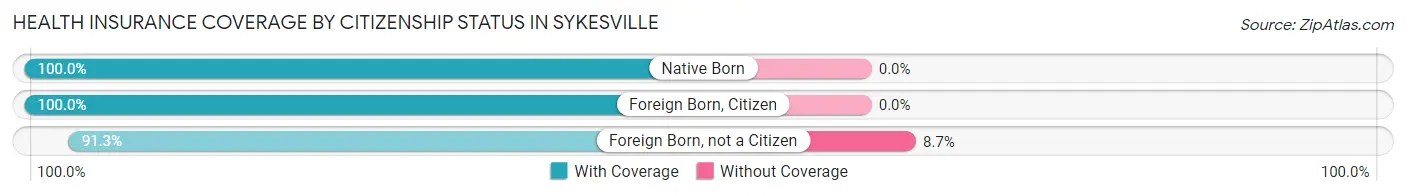
| Citizenship Status | With Coverage | Without Coverage |
| Native Born | 385 (100.0%) | 0 (0.0%) |
| Foreign Born, Citizen | 921 (100.0%) | 0 (0.0%) |
| Foreign Born, not a Citizen | 336 (91.3%) | 32 (8.7%) |
Health Insurance Coverage by Household Income in Sykesville
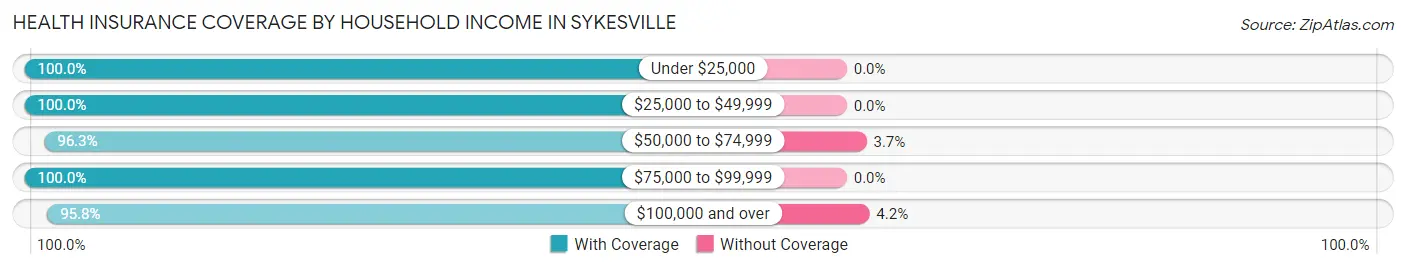
| Household Income | With Coverage | Without Coverage |
| Under $25,000 | 146 (100.0%) | 0 (0.0%) |
| $25,000 to $49,999 | 105 (100.0%) | 0 (0.0%) |
| $50,000 to $74,999 | 312 (96.3%) | 12 (3.7%) |
| $75,000 to $99,999 | 286 (100.0%) | 0 (0.0%) |
| $100,000 and over | 3,188 (95.8%) | 141 (4.2%) |
Public vs Private Health Insurance Coverage by Age in Sykesville
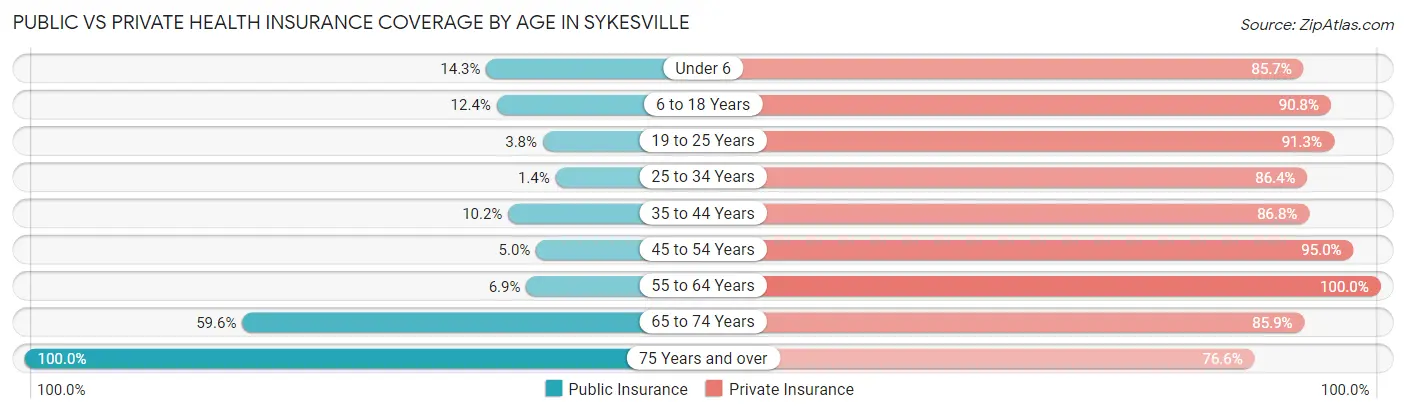
| Age Bracket | Public Insurance | Private Insurance |
| Under 6 | 55 (14.3%) | 330 (85.7%) |
| 6 to 18 Years | 114 (12.4%) | 836 (90.8%) |
| 19 to 25 Years | 14 (3.8%) | 336 (91.3%) |
| 25 to 34 Years | 7 (1.4%) | 420 (86.4%) |
| 35 to 44 Years | 68 (10.2%) | 576 (86.8%) |
| 45 to 54 Years | 36 (5.0%) | 678 (95.0%) |
| 55 to 64 Years | 18 (6.9%) | 262 (100.0%) |
| 65 to 74 Years | 177 (59.6%) | 255 (85.9%) |
| 75 Years and over | 94 (100.0%) | 72 (76.6%) |
| Total | 583 (13.9%) | 3,765 (89.8%) |
Disability Status by Sex by Age in Sykesville
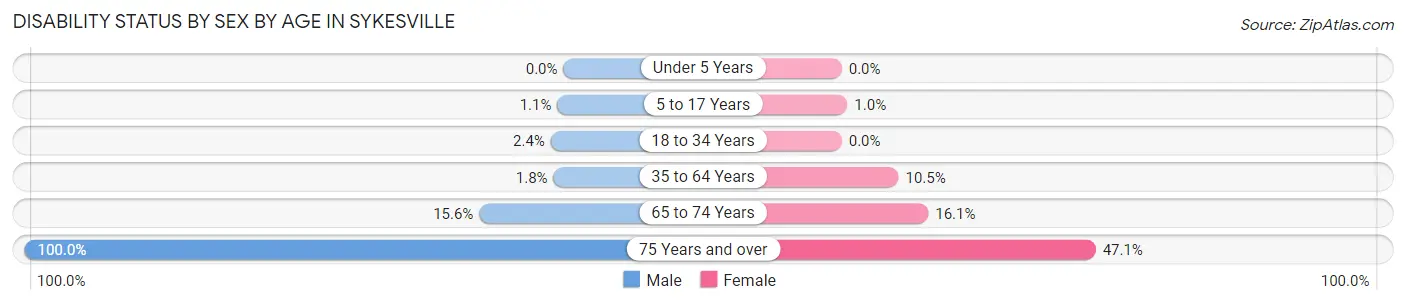
| Age Bracket | Male | Female |
| Under 5 Years | 0 (0.0%) | 0 (0.0%) |
| 5 to 17 Years | 5 (1.1%) | 5 (1.0%) |
| 18 to 34 Years | 12 (2.4%) | 0 (0.0%) |
| 35 to 64 Years | 16 (1.8%) | 81 (10.5%) |
| 65 to 74 Years | 25 (15.6%) | 22 (16.1%) |
| 75 Years and over | 7 (100.0%) | 41 (47.1%) |
Disability Class by Sex by Age in Sykesville
Disability Class: Hearing Difficulty
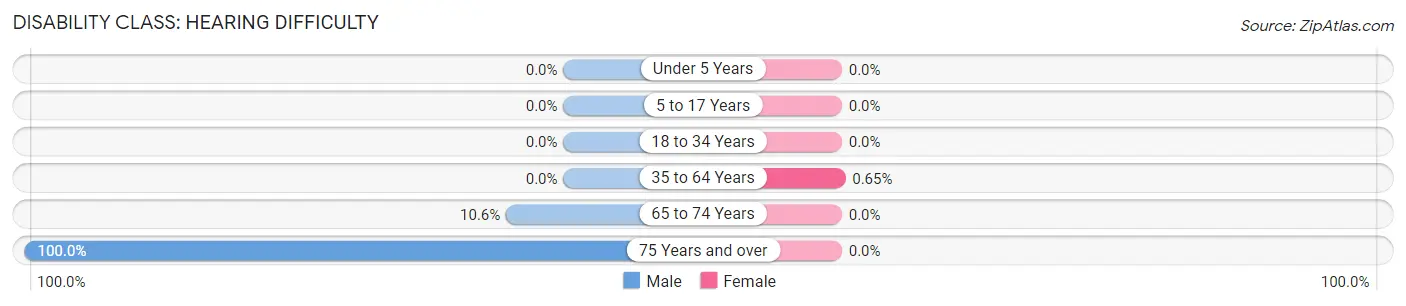
| Age Bracket | Male | Female |
| Under 5 Years | 0 (0.0%) | 0 (0.0%) |
| 5 to 17 Years | 0 (0.0%) | 0 (0.0%) |
| 18 to 34 Years | 0 (0.0%) | 0 (0.0%) |
| 35 to 64 Years | 0 (0.0%) | 5 (0.6%) |
| 65 to 74 Years | 17 (10.6%) | 0 (0.0%) |
| 75 Years and over | 7 (100.0%) | 0 (0.0%) |
Disability Class: Vision Difficulty
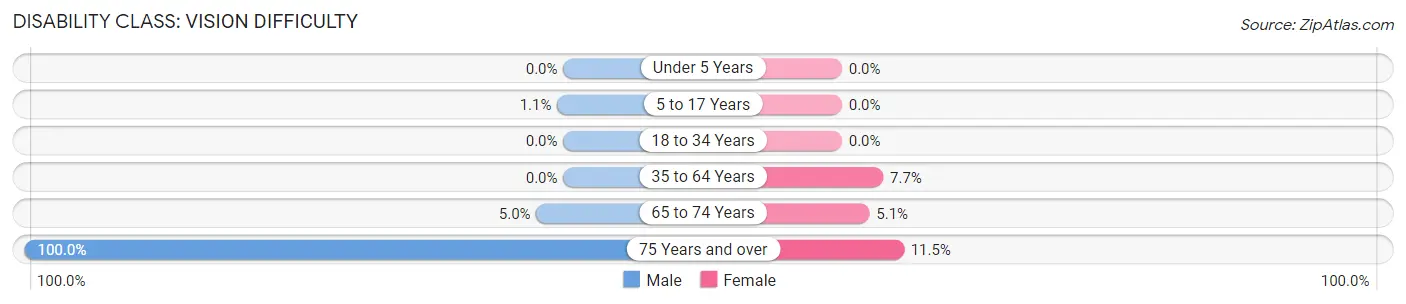
| Age Bracket | Male | Female |
| Under 5 Years | 0 (0.0%) | 0 (0.0%) |
| 5 to 17 Years | 5 (1.1%) | 0 (0.0%) |
| 18 to 34 Years | 0 (0.0%) | 0 (0.0%) |
| 35 to 64 Years | 0 (0.0%) | 59 (7.7%) |
| 65 to 74 Years | 8 (5.0%) | 7 (5.1%) |
| 75 Years and over | 7 (100.0%) | 10 (11.5%) |
Disability Class: Cognitive Difficulty
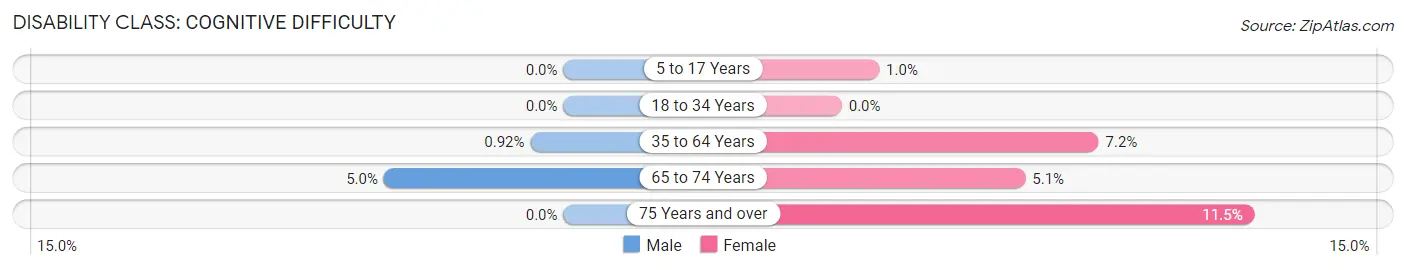
| Age Bracket | Male | Female |
| 5 to 17 Years | 0 (0.0%) | 5 (1.0%) |
| 18 to 34 Years | 0 (0.0%) | 0 (0.0%) |
| 35 to 64 Years | 8 (0.9%) | 55 (7.1%) |
| 65 to 74 Years | 8 (5.0%) | 7 (5.1%) |
| 75 Years and over | 0 (0.0%) | 10 (11.5%) |
Disability Class: Ambulatory Difficulty
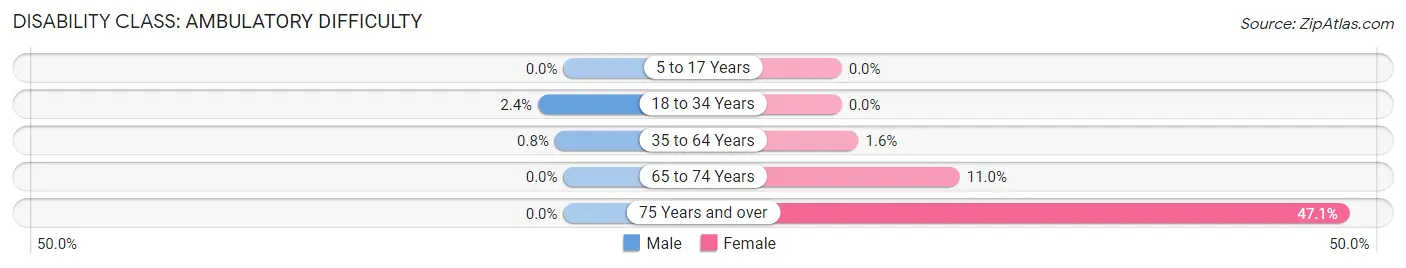
| Age Bracket | Male | Female |
| 5 to 17 Years | 0 (0.0%) | 0 (0.0%) |
| 18 to 34 Years | 12 (2.4%) | 0 (0.0%) |
| 35 to 64 Years | 7 (0.8%) | 12 (1.6%) |
| 65 to 74 Years | 0 (0.0%) | 15 (11.0%) |
| 75 Years and over | 0 (0.0%) | 41 (47.1%) |
Disability Class: Self-Care Difficulty
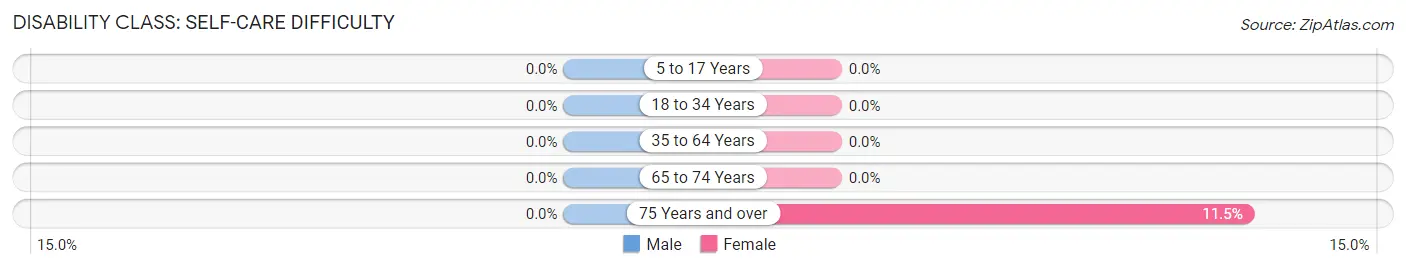
| Age Bracket | Male | Female |
| 5 to 17 Years | 0 (0.0%) | 0 (0.0%) |
| 18 to 34 Years | 0 (0.0%) | 0 (0.0%) |
| 35 to 64 Years | 0 (0.0%) | 0 (0.0%) |
| 65 to 74 Years | 0 (0.0%) | 0 (0.0%) |
| 75 Years and over | 0 (0.0%) | 10 (11.5%) |
Technology Access in Sykesville
Computing Device Access in Sykesville
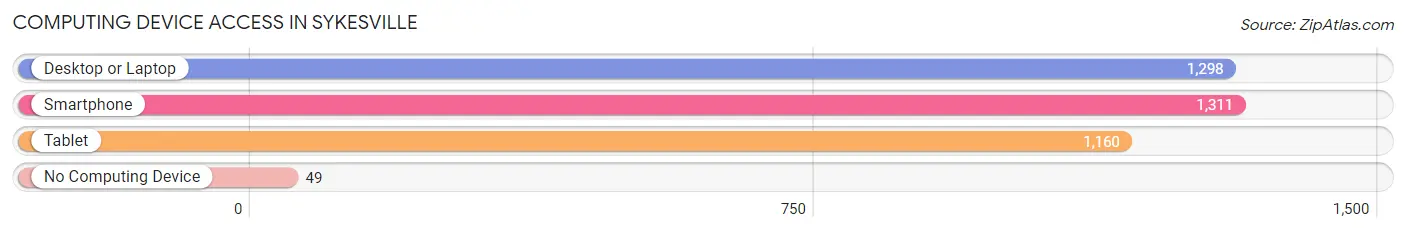
| Device Type | # Households | % Households |
| Desktop or Laptop | 1,298 | 92.1% |
| Smartphone | 1,311 | 93.0% |
| Tablet | 1,160 | 82.3% |
| No Computing Device | 49 | 3.5% |
| Total | 1,409 | 100.0% |
Internet Access in Sykesville
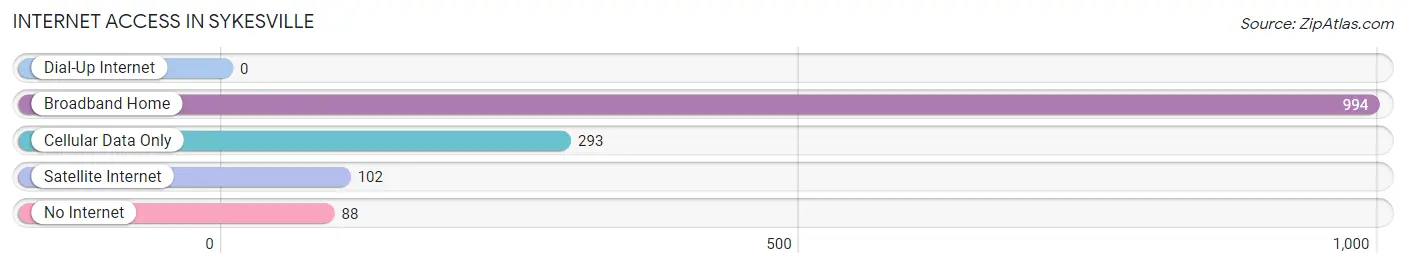
| Internet Type | # Households | % Households |
| Dial-Up Internet | 0 | 0.0% |
| Broadband Home | 994 | 70.6% |
| Cellular Data Only | 293 | 20.8% |
| Satellite Internet | 102 | 7.2% |
| No Internet | 88 | 6.2% |
| Total | 1,409 | 100.0% |
Sykesville Summary
Sykesville, Maryland is a small town located in Carroll County, Maryland, about 30 miles northwest of Baltimore. It is situated along the Patapsco River, and is part of the Baltimore-Washington Metropolitan Area. The town has a population of approximately 4,000 people, and is known for its historic downtown area, which is listed on the National Register of Historic Places.
History
Sykesville was founded in 1822 by William Sykes, a local landowner. The town was originally known as Sykesville Station, and was a stop on the Baltimore and Ohio Railroad. The town was officially incorporated in 1887, and the name was changed to Sykesville.
The town grew rapidly in the late 19th and early 20th centuries, and was home to a variety of businesses, including a flour mill, a cannery, and a brickyard. The town also had a thriving agricultural industry, and was home to several farms.
In the late 20th century, the town began to experience a decline in population and economic activity. However, in recent years, the town has seen a resurgence in population and economic activity.
Geography
Sykesville is located in Carroll County, Maryland, about 30 miles northwest of Baltimore. The town is situated along the Patapsco River, and is part of the Baltimore-Washington Metropolitan Area. The town has a total area of 2.2 square miles, all of which is land.
The town is located in a rural area, and is surrounded by rolling hills and farmland. The town is also home to several parks, including Freedom Park, which is located along the Patapsco River.
Economy
Sykesville has a diverse economy, with a variety of businesses and industries. The town is home to several small businesses, including restaurants, retail stores, and professional services. The town is also home to several large employers, including the Sykesville-Freedom District Fire Department, the Sykesville-Freedom District Police Department, and the Sykesville-Freedom District Public Schools.
The town is also home to several manufacturing companies, including a furniture manufacturer, a printing company, and a plastics manufacturer. The town is also home to several technology companies, including a software development company and a web design company.
Demographics
As of the 2010 census, Sykesville had a population of 4,000 people. The town has a median household income of $68,000, and a median home value of $250,000. The town is predominantly white, with a small African American population. The town also has a small Hispanic population, and a small Asian population.
Sykesville is a small town with a rich history and a diverse economy. The town is home to a variety of businesses, and is a great place to live and work. The town is also home to several parks and recreational areas, making it a great place to visit and explore.
Common Questions
What is Per Capita Income in Sykesville?
Per Capita income in Sykesville is $48,450.
What is the Median Family Income in Sykesville?
Median Family Income in Sykesville is $133,542.
What is the Median Household income in Sykesville?
Median Household Income in Sykesville is $126,941.
What is Income or Wage Gap in Sykesville?
Income or Wage Gap in Sykesville is 20.3%.
Women in Sykesville earn 79.7 cents for every dollar earned by a man.
What is Inequality or Gini Index in Sykesville?
Inequality or Gini Index in Sykesville is 0.37.
What is the Total Population of Sykesville?
Total Population of Sykesville is 4,305.
What is the Total Male Population of Sykesville?
Total Male Population of Sykesville is 2,158.
What is the Total Female Population of Sykesville?
Total Female Population of Sykesville is 2,147.
What is the Ratio of Males per 100 Females in Sykesville?
There are 100.51 Males per 100 Females in Sykesville.
What is the Ratio of Females per 100 Males in Sykesville?
There are 99.49 Females per 100 Males in Sykesville.
What is the Median Population Age in Sykesville?
Median Population Age in Sykesville is 34.9 Years.
What is the Average Family Size in Sykesville
Average Family Size in Sykesville is 3.5 People.
What is the Average Household Size in Sykesville
Average Household Size in Sykesville is 3.0 People.
How Large is the Labor Force in Sykesville?
There are 2,348 People in the Labor Forcein in Sykesville.
What is the Percentage of People in the Labor Force in Sykesville?
71.5% of People are in the Labor Force in Sykesville.
What is the Unemployment Rate in Sykesville?
Unemployment Rate in Sykesville is 1.7%.