Berlin, MD Map & Demographics
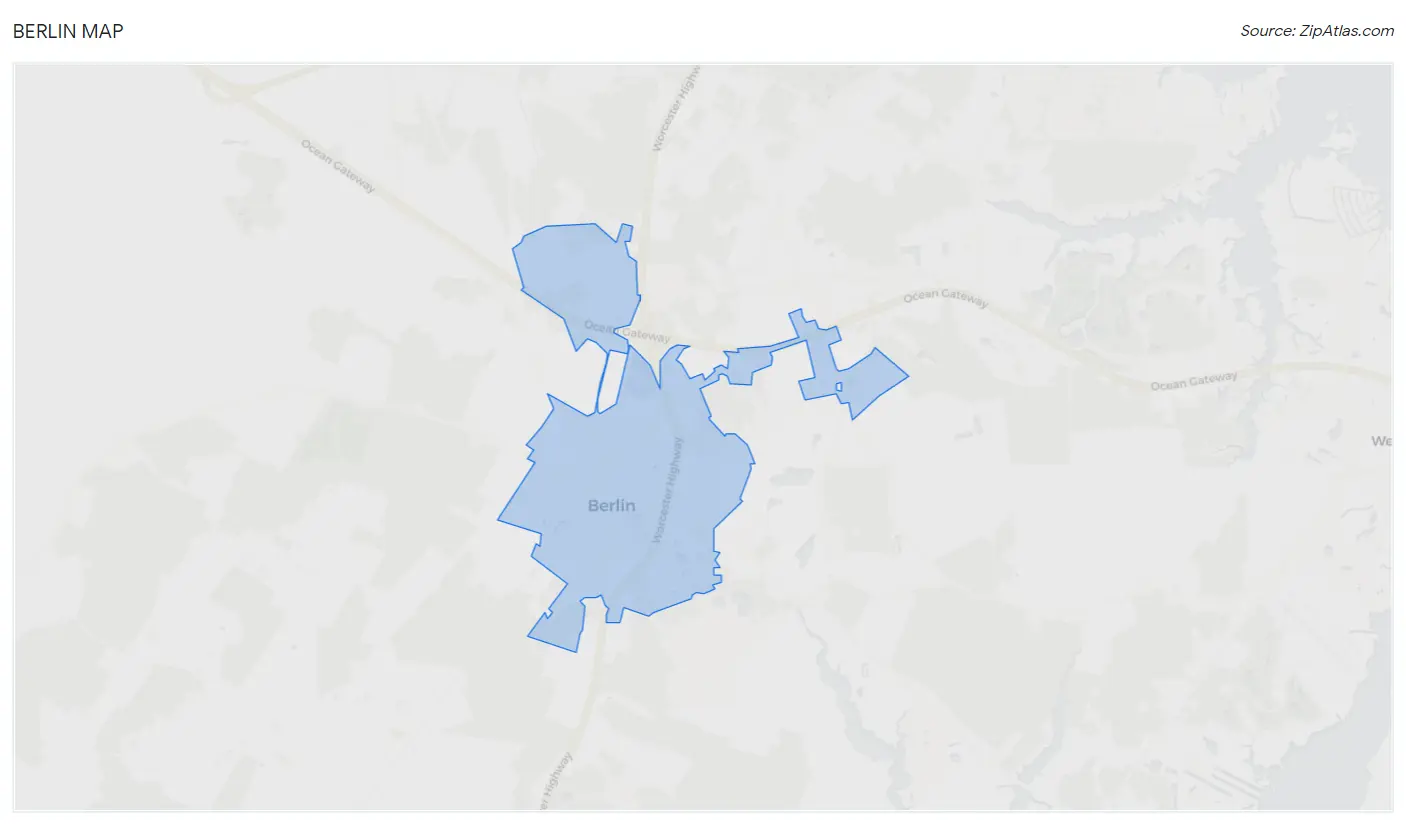
Berlin Map
Berlin Overview
$37,113
PER CAPITA INCOME
$97,232
AVG FAMILY INCOME
$80,465
AVG HOUSEHOLD INCOME
28.8%
WAGE / INCOME GAP [ % ]
71.2¢/ $1
WAGE / INCOME GAP [ $ ]
0.45
INEQUALITY / GINI INDEX
5,056
TOTAL POPULATION
2,242
MALE POPULATION
2,814
FEMALE POPULATION
79.67
MALES / 100 FEMALES
125.51
FEMALES / 100 MALES
40.1
MEDIAN AGE
3.1
AVG FAMILY SIZE
2.8
AVG HOUSEHOLD SIZE
2,436
LABOR FORCE [ PEOPLE ]
63.3%
PERCENT IN LABOR FORCE
2.8%
UNEMPLOYMENT RATE
Berlin Zip Codes
Income in Berlin
Income Overview in Berlin
Per Capita Income in Berlin is $37,113, while median incomes of families and households are $97,232 and $80,465 respectively.
| Characteristic | Number | Measure |
| Per Capita Income | 5,056 | $37,113 |
| Median Family Income | 1,359 | $97,232 |
| Mean Family Income | 1,359 | $114,883 |
| Median Household Income | 1,766 | $80,465 |
| Mean Household Income | 1,766 | $102,476 |
| Income Deficit | 1,359 | $0 |
| Wage / Income Gap (%) | 5,056 | 28.79% |
| Wage / Income Gap ($) | 5,056 | 71.21¢ per $1 |
| Gini / Inequality Index | 5,056 | 0.45 |
Earnings by Sex in Berlin
Average Earnings in Berlin are $44,886, $49,866 for men and $35,509 for women, a difference of 28.8%.
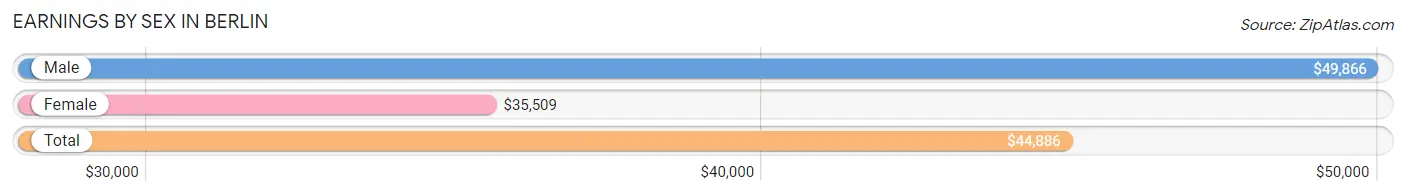
| Sex | Number | Average Earnings |
| Male | 1,197 (45.2%) | $49,866 |
| Female | 1,452 (54.8%) | $35,509 |
| Total | 2,649 (100.0%) | $44,886 |
Earnings by Sex by Income Bracket in Berlin
The most common earnings brackets in Berlin are $100,000+ for men (206 | 17.2%) and $100,000+ for women (171 | 11.8%).
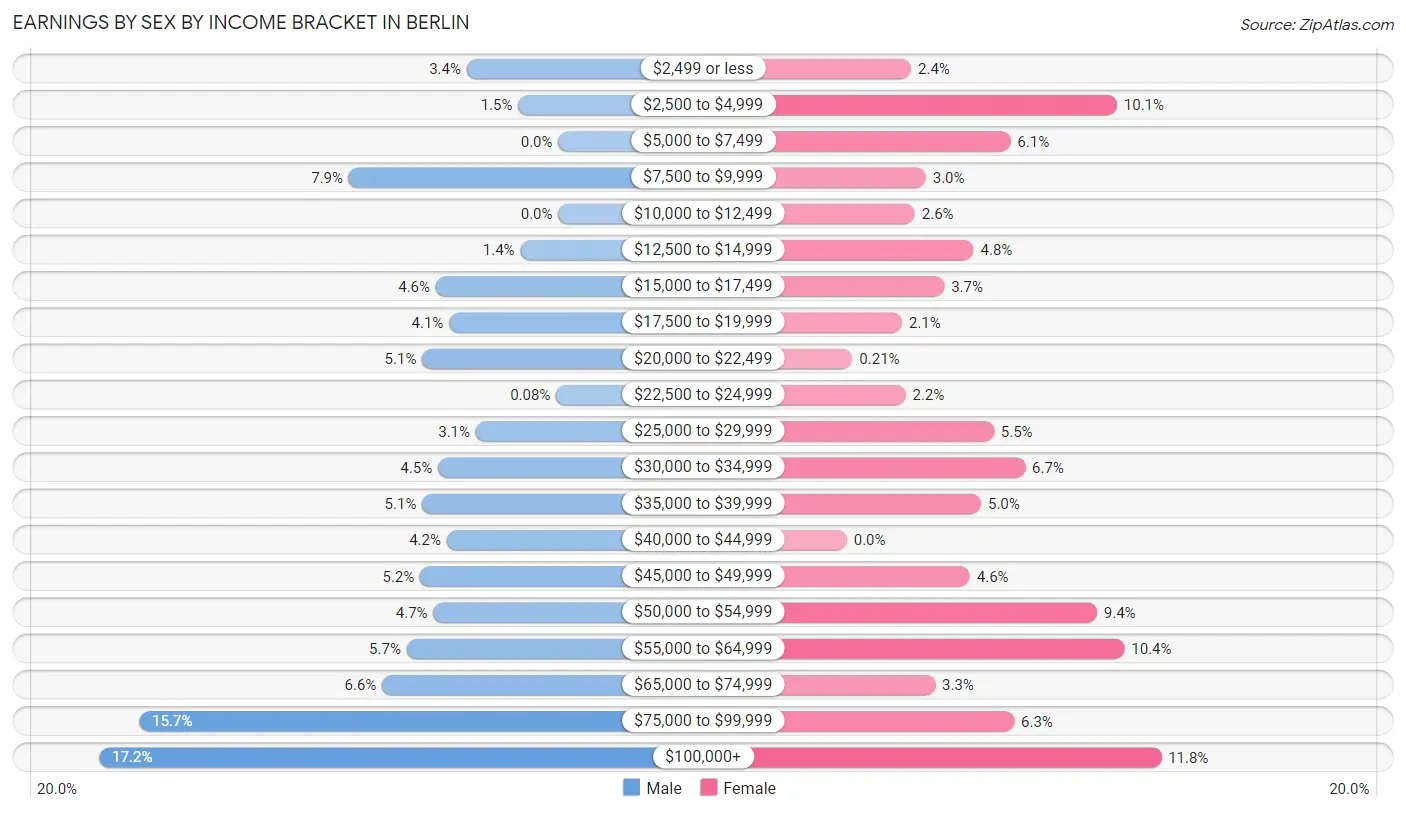
| Income | Male | Female |
| $2,499 or less | 41 (3.4%) | 35 (2.4%) |
| $2,500 to $4,999 | 18 (1.5%) | 147 (10.1%) |
| $5,000 to $7,499 | 0 (0.0%) | 89 (6.1%) |
| $7,500 to $9,999 | 94 (7.9%) | 43 (3.0%) |
| $10,000 to $12,499 | 0 (0.0%) | 37 (2.5%) |
| $12,500 to $14,999 | 17 (1.4%) | 69 (4.8%) |
| $15,000 to $17,499 | 55 (4.6%) | 53 (3.6%) |
| $17,500 to $19,999 | 49 (4.1%) | 30 (2.1%) |
| $20,000 to $22,499 | 61 (5.1%) | 3 (0.2%) |
| $22,500 to $24,999 | 1 (0.1%) | 32 (2.2%) |
| $25,000 to $29,999 | 37 (3.1%) | 80 (5.5%) |
| $30,000 to $34,999 | 54 (4.5%) | 97 (6.7%) |
| $35,000 to $39,999 | 61 (5.1%) | 73 (5.0%) |
| $40,000 to $44,999 | 50 (4.2%) | 0 (0.0%) |
| $45,000 to $49,999 | 62 (5.2%) | 67 (4.6%) |
| $50,000 to $54,999 | 56 (4.7%) | 136 (9.4%) |
| $55,000 to $64,999 | 68 (5.7%) | 151 (10.4%) |
| $65,000 to $74,999 | 79 (6.6%) | 48 (3.3%) |
| $75,000 to $99,999 | 188 (15.7%) | 91 (6.3%) |
| $100,000+ | 206 (17.2%) | 171 (11.8%) |
| Total | 1,197 (100.0%) | 1,452 (100.0%) |
Earnings by Sex by Educational Attainment in Berlin
Average earnings in Berlin are $59,375 for men and $50,777 for women, a difference of 14.5%. Men with an educational attainment of graduate degree enjoy the highest average annual earnings of $123,125, while those with college or associate's degree education earn the least with $49,554. Women with an educational attainment of graduate degree earn the most with the average annual earnings of $61,696, while those with high school diploma education have the smallest earnings of $28,438.
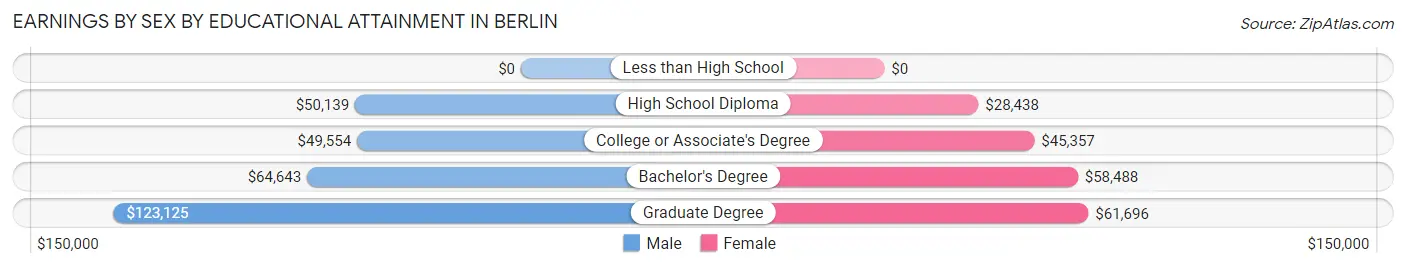
| Educational Attainment | Male Income | Female Income |
| Less than High School | - | - |
| High School Diploma | $50,139 | $28,438 |
| College or Associate's Degree | $49,554 | $45,357 |
| Bachelor's Degree | $64,643 | $58,488 |
| Graduate Degree | $123,125 | $61,696 |
| Total | $59,375 | $50,777 |
Family Income in Berlin
Family Income Brackets in Berlin
According to the Berlin family income data, there are 351 families falling into the $100,000 to $149,999 income range, which is the most common income bracket and makes up 25.8% of all families. Conversely, the $10,000 to $14,999 income bracket is the least frequent group with only 27 families (2.0%) belonging to this category.
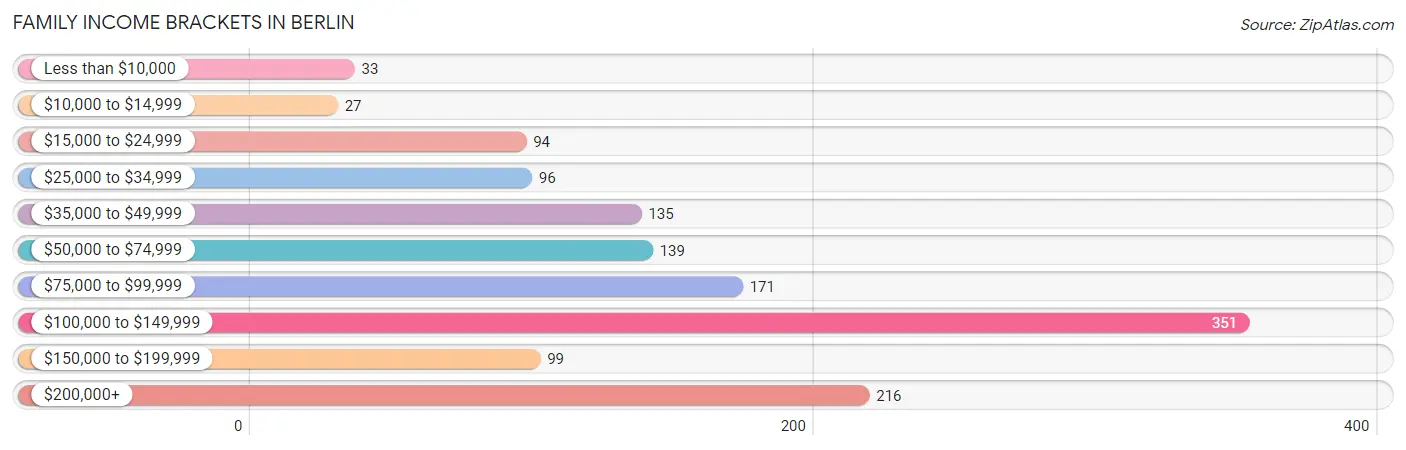
| Income Bracket | # Families | % Families |
| Less than $10,000 | 33 | 2.4% |
| $10,000 to $14,999 | 27 | 2.0% |
| $15,000 to $24,999 | 94 | 6.9% |
| $25,000 to $34,999 | 96 | 7.1% |
| $35,000 to $49,999 | 135 | 9.9% |
| $50,000 to $74,999 | 139 | 10.2% |
| $75,000 to $99,999 | 171 | 12.6% |
| $100,000 to $149,999 | 351 | 25.8% |
| $150,000 to $199,999 | 99 | 7.3% |
| $200,000+ | 216 | 15.9% |
Family Income by Famaliy Size in Berlin
5-person families (138 | 10.2%) account for the highest median family income in Berlin with $250,001 per family, while 5-person families (138 | 10.2%) have the highest median income of $50,000 per family member.
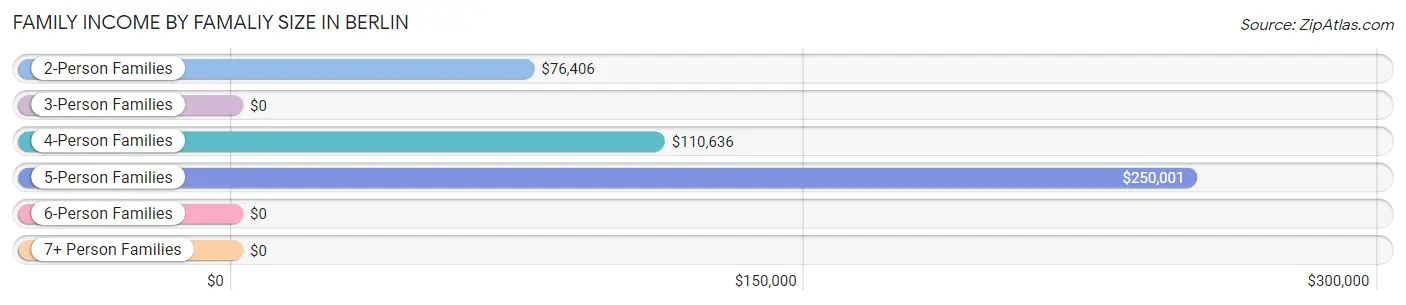
| Income Bracket | # Families | Median Income |
| 2-Person Families | 646 (47.5%) | $76,406 |
| 3-Person Families | 307 (22.6%) | $0 |
| 4-Person Families | 241 (17.7%) | $110,636 |
| 5-Person Families | 138 (10.2%) | $250,001 |
| 6-Person Families | 8 (0.6%) | $0 |
| 7+ Person Families | 19 (1.4%) | $0 |
| Total | 1,359 (100.0%) | $97,232 |
Family Income by Number of Earners in Berlin
The median family income in Berlin is $97,232, with families comprising 2 earners (690) having the highest median family income of $112,368, while families with no earners (183) have the lowest median family income of $29,107, accounting for 50.8% and 13.5% of families, respectively.
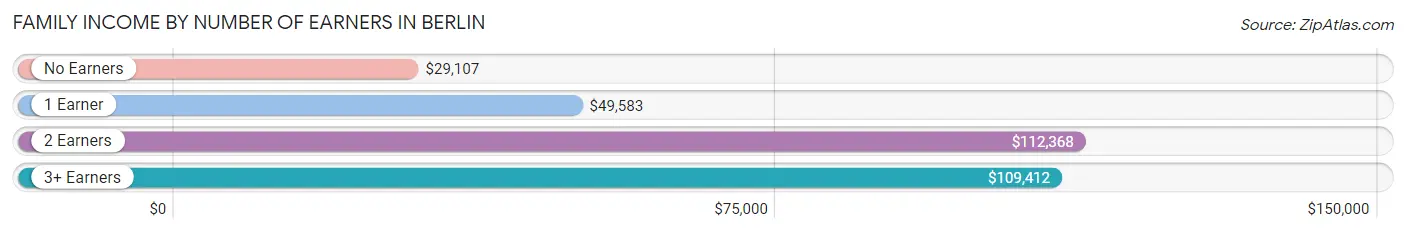
| Number of Earners | # Families | Median Income |
| No Earners | 183 (13.5%) | $29,107 |
| 1 Earner | 386 (28.4%) | $49,583 |
| 2 Earners | 690 (50.8%) | $112,368 |
| 3+ Earners | 100 (7.4%) | $109,412 |
| Total | 1,359 (100.0%) | $97,232 |
Household Income in Berlin
Household Income Brackets in Berlin
With 387 households falling in the category, the $100,000 to $149,999 income range is the most frequent in Berlin, accounting for 21.9% of all households. In contrast, only 39 households (2.2%) fall into the $10,000 to $14,999 income bracket, making it the least populous group.
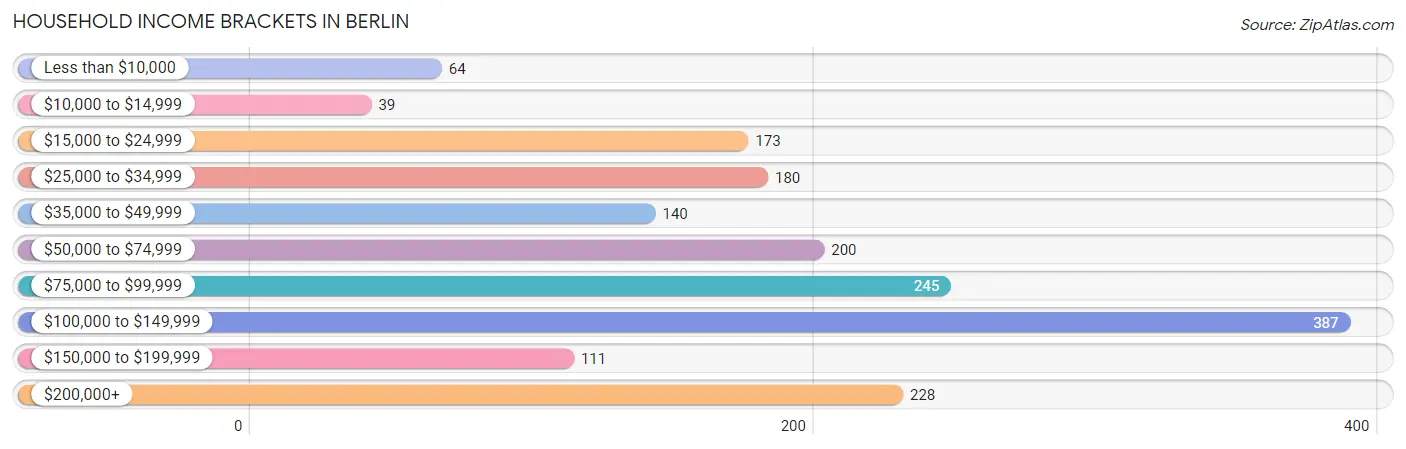
| Income Bracket | # Households | % Households |
| Less than $10,000 | 64 | 3.6% |
| $10,000 to $14,999 | 39 | 2.2% |
| $15,000 to $24,999 | 173 | 9.8% |
| $25,000 to $34,999 | 180 | 10.2% |
| $35,000 to $49,999 | 140 | 7.9% |
| $50,000 to $74,999 | 200 | 11.3% |
| $75,000 to $99,999 | 245 | 13.9% |
| $100,000 to $149,999 | 387 | 21.9% |
| $150,000 to $199,999 | 111 | 6.3% |
| $200,000+ | 228 | 12.9% |
Household Income by Householder Age in Berlin
The median household income in Berlin is $80,465, with the highest median household income of $95,577 found in the 45 to 64 years age bracket for the primary householder. A total of 680 households (38.5%) fall into this category. Meanwhile, the 15 to 24 years age bracket for the primary householder has the lowest median household income of $0, with 38 households (2.1%) in this group.
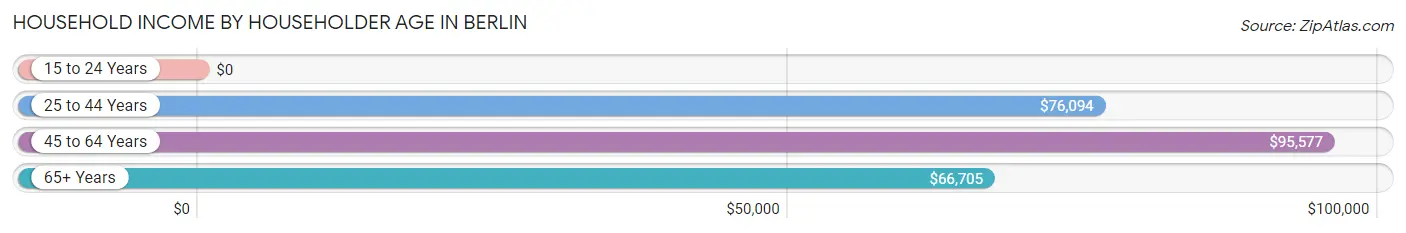
| Income Bracket | # Households | Median Income |
| 15 to 24 Years | 38 (2.1%) | $0 |
| 25 to 44 Years | 545 (30.9%) | $76,094 |
| 45 to 64 Years | 680 (38.5%) | $95,577 |
| 65+ Years | 503 (28.5%) | $66,705 |
| Total | 1,766 (100.0%) | $80,465 |
Poverty in Berlin
Income Below Poverty by Sex and Age in Berlin
With 7.5% poverty level for males and 10.8% for females among the residents of Berlin, 12 to 14 year old males and 6 to 11 year old females are the most vulnerable to poverty, with 79 males (36.4%) and 88 females (32.5%) in their respective age groups living below the poverty level.
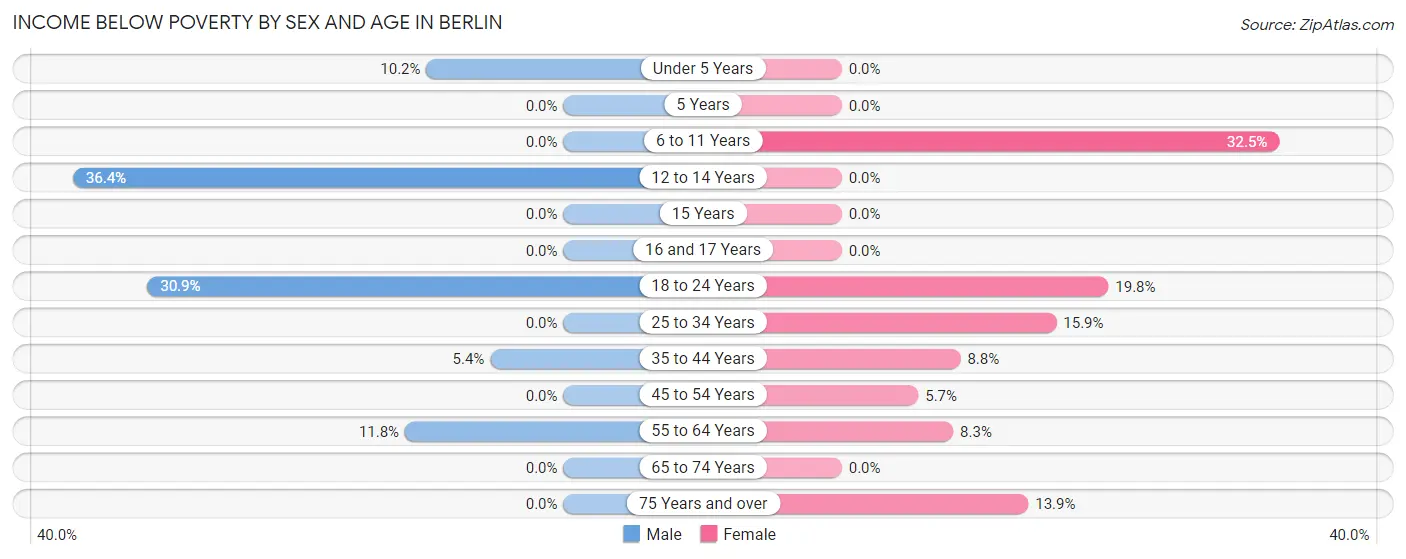
| Age Bracket | Male | Female |
| Under 5 Years | 6 (10.2%) | 0 (0.0%) |
| 5 Years | 0 (0.0%) | 0 (0.0%) |
| 6 to 11 Years | 0 (0.0%) | 88 (32.5%) |
| 12 to 14 Years | 79 (36.4%) | 0 (0.0%) |
| 15 Years | 0 (0.0%) | 0 (0.0%) |
| 16 and 17 Years | 0 (0.0%) | 0 (0.0%) |
| 18 to 24 Years | 38 (30.9%) | 38 (19.8%) |
| 25 to 34 Years | 0 (0.0%) | 36 (15.9%) |
| 35 to 44 Years | 17 (5.4%) | 34 (8.8%) |
| 45 to 54 Years | 0 (0.0%) | 22 (5.7%) |
| 55 to 64 Years | 24 (11.8%) | 22 (8.3%) |
| 65 to 74 Years | 0 (0.0%) | 0 (0.0%) |
| 75 Years and over | 0 (0.0%) | 50 (13.9%) |
| Total | 164 (7.5%) | 290 (10.8%) |
Income Above Poverty by Sex and Age in Berlin
According to the poverty statistics in Berlin, males aged 5 years and females aged under 5 years are the age groups that are most secure financially, with 100.0% of males and 100.0% of females in these age groups living above the poverty line.
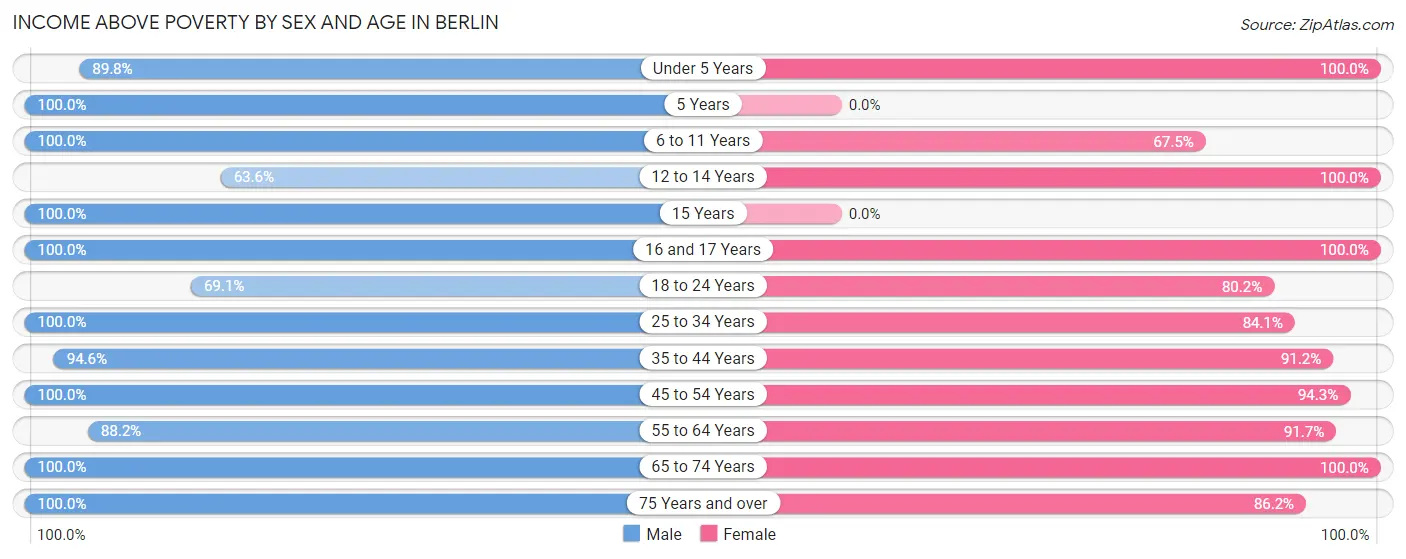
| Age Bracket | Male | Female |
| Under 5 Years | 53 (89.8%) | 115 (100.0%) |
| 5 Years | 17 (100.0%) | 0 (0.0%) |
| 6 to 11 Years | 285 (100.0%) | 183 (67.5%) |
| 12 to 14 Years | 138 (63.6%) | 198 (100.0%) |
| 15 Years | 36 (100.0%) | 0 (0.0%) |
| 16 and 17 Years | 86 (100.0%) | 144 (100.0%) |
| 18 to 24 Years | 85 (69.1%) | 154 (80.2%) |
| 25 to 34 Years | 172 (100.0%) | 190 (84.1%) |
| 35 to 44 Years | 296 (94.6%) | 352 (91.2%) |
| 45 to 54 Years | 357 (100.0%) | 365 (94.3%) |
| 55 to 64 Years | 180 (88.2%) | 244 (91.7%) |
| 65 to 74 Years | 155 (100.0%) | 136 (100.0%) |
| 75 Years and over | 174 (100.0%) | 311 (86.2%) |
| Total | 2,034 (92.5%) | 2,392 (89.2%) |
Income Below Poverty Among Married-Couple Families in Berlin
The poverty statistics for married-couple families in Berlin show that 3.3% or 31 of the total 941 families live below the poverty line. Families with 1 or 2 children have the highest poverty rate of 4.1%, comprising of 17 families. On the other hand, families with 3 or 4 children have the lowest poverty rate of 0.0%, which includes 0 families.
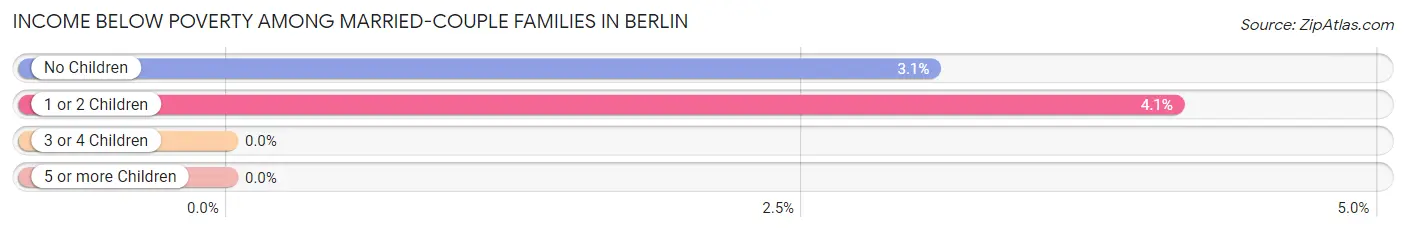
| Children | Above Poverty | Below Poverty |
| No Children | 444 (96.9%) | 14 (3.1%) |
| 1 or 2 Children | 396 (95.9%) | 17 (4.1%) |
| 3 or 4 Children | 65 (100.0%) | 0 (0.0%) |
| 5 or more Children | 5 (100.0%) | 0 (0.0%) |
| Total | 910 (96.7%) | 31 (3.3%) |
Income Below Poverty Among Single-Parent Households in Berlin
According to the poverty data in Berlin, 48.1% or 38 single-father households and 18.6% or 63 single-mother households are living below the poverty line. Among single-father households, those with 1 or 2 children have the highest poverty rate, with 38 households (57.6%) experiencing poverty. Likewise, among single-mother households, those with 1 or 2 children have the highest poverty rate, with 61 households (32.6%) falling below the poverty line.
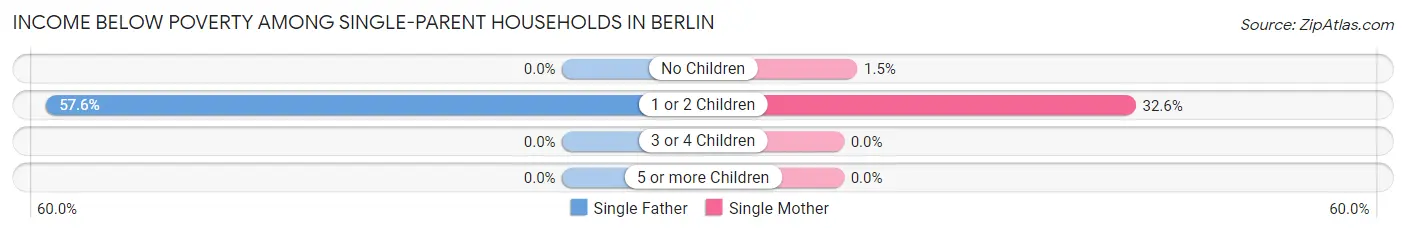
| Children | Single Father | Single Mother |
| No Children | 0 (0.0%) | 2 (1.5%) |
| 1 or 2 Children | 38 (57.6%) | 61 (32.6%) |
| 3 or 4 Children | 0 (0.0%) | 0 (0.0%) |
| 5 or more Children | 0 (0.0%) | 0 (0.0%) |
| Total | 38 (48.1%) | 63 (18.6%) |
Income Below Poverty Among Married-Couple vs Single-Parent Households in Berlin
The poverty data for Berlin shows that 31 of the married-couple family households (3.3%) and 101 of the single-parent households (24.2%) are living below the poverty level. Within the married-couple family households, those with 1 or 2 children have the highest poverty rate, with 17 households (4.1%) falling below the poverty line. Among the single-parent households, those with 1 or 2 children have the highest poverty rate, with 99 household (39.1%) living below poverty.
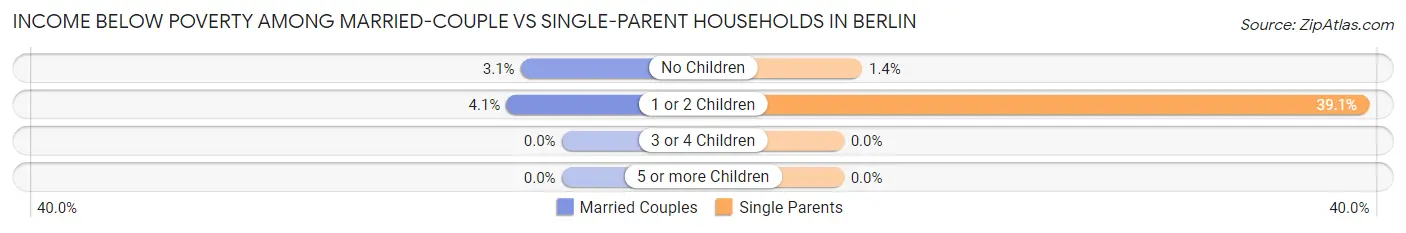
| Children | Married-Couple Families | Single-Parent Households |
| No Children | 14 (3.1%) | 2 (1.4%) |
| 1 or 2 Children | 17 (4.1%) | 99 (39.1%) |
| 3 or 4 Children | 0 (0.0%) | 0 (0.0%) |
| 5 or more Children | 0 (0.0%) | 0 (0.0%) |
| Total | 31 (3.3%) | 101 (24.2%) |
Race in Berlin
The most populous races in Berlin are White / Caucasian (3,908 | 77.3%), Black / African American (851 | 16.8%), and Two or more Races (254 | 5.0%).
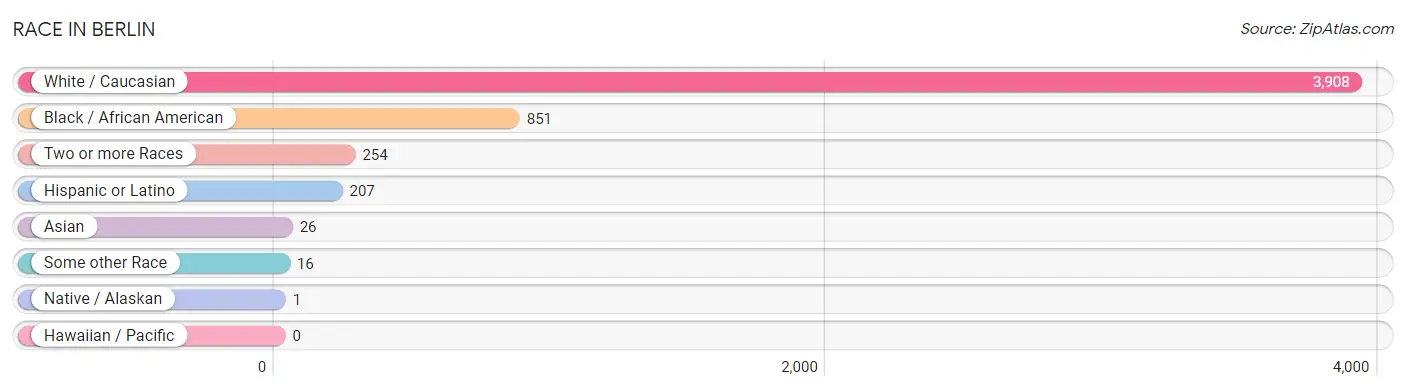
| Race | # Population | % Population |
| Asian | 26 | 0.5% |
| Black / African American | 851 | 16.8% |
| Hawaiian / Pacific | 0 | 0.0% |
| Hispanic or Latino | 207 | 4.1% |
| Native / Alaskan | 1 | 0.0% |
| White / Caucasian | 3,908 | 77.3% |
| Two or more Races | 254 | 5.0% |
| Some other Race | 16 | 0.3% |
| Total | 5,056 | 100.0% |
Ancestry in Berlin
The most populous ancestries reported in Berlin are German (914 | 18.1%), English (759 | 15.0%), Italian (612 | 12.1%), Irish (521 | 10.3%), and American (159 | 3.1%), together accounting for 58.6% of all Berlin residents.
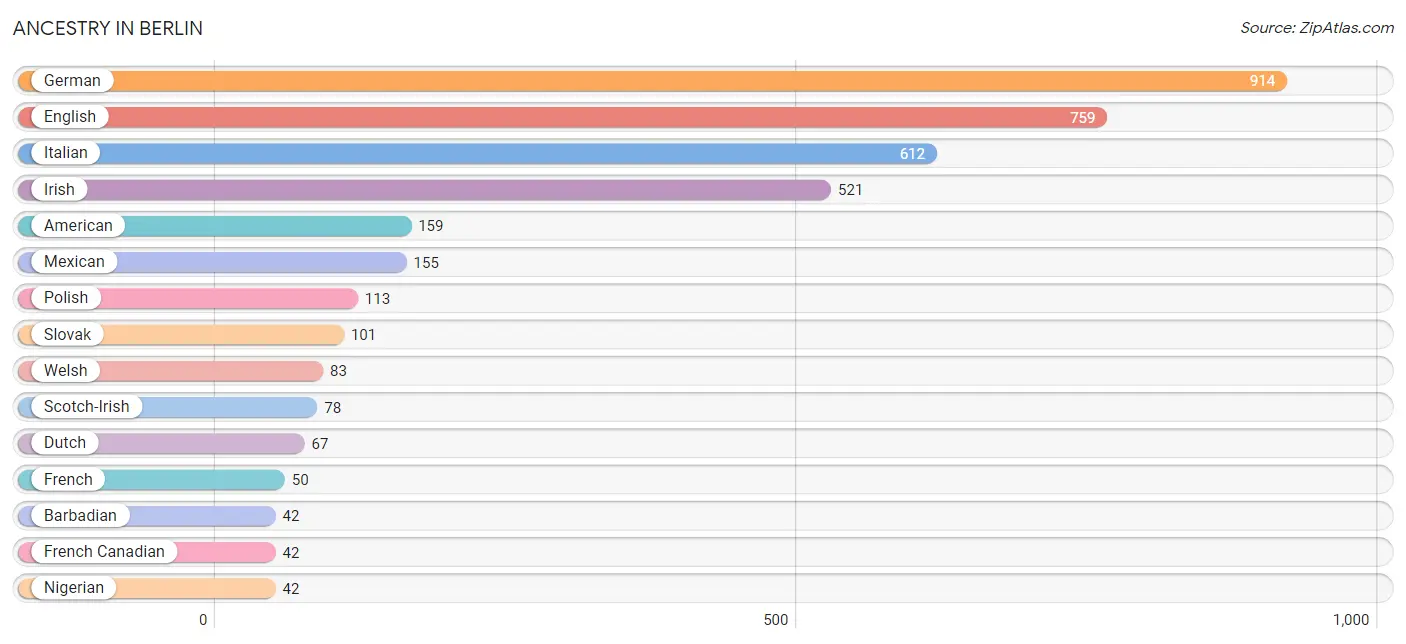
| Ancestry | # Population | % Population |
| American | 159 | 3.1% |
| Arab | 8 | 0.2% |
| Barbadian | 42 | 0.8% |
| British | 27 | 0.5% |
| Cuban | 26 | 0.5% |
| Czechoslovakian | 32 | 0.6% |
| Dutch | 67 | 1.3% |
| English | 759 | 15.0% |
| European | 27 | 0.5% |
| Finnish | 22 | 0.4% |
| French | 50 | 1.0% |
| French Canadian | 42 | 0.8% |
| German | 914 | 18.1% |
| Hungarian | 11 | 0.2% |
| Irish | 521 | 10.3% |
| Italian | 612 | 12.1% |
| Lebanese | 8 | 0.2% |
| Lithuanian | 33 | 0.6% |
| Mexican | 155 | 3.1% |
| Nigerian | 42 | 0.8% |
| Norwegian | 10 | 0.2% |
| Pennsylvania German | 29 | 0.6% |
| Polish | 113 | 2.2% |
| Puerto Rican | 13 | 0.3% |
| Romanian | 12 | 0.2% |
| Scotch-Irish | 78 | 1.5% |
| Scottish | 11 | 0.2% |
| Slovak | 101 | 2.0% |
| Spanish | 13 | 0.3% |
| Sri Lankan | 20 | 0.4% |
| Subsaharan African | 42 | 0.8% |
| Swedish | 10 | 0.2% |
| Thai | 6 | 0.1% |
| Ukrainian | 7 | 0.1% |
| Welsh | 83 | 1.6% | View All 35 Rows |
Immigrants in Berlin
The most numerous immigrant groups reported in Berlin came from Europe (143 | 2.8%), Eastern Europe (58 | 1.1%), Northern Europe (54 | 1.1%), Romania (51 | 1.0%), and Latin America (44 | 0.9%), together accounting for 6.9% of all Berlin residents.
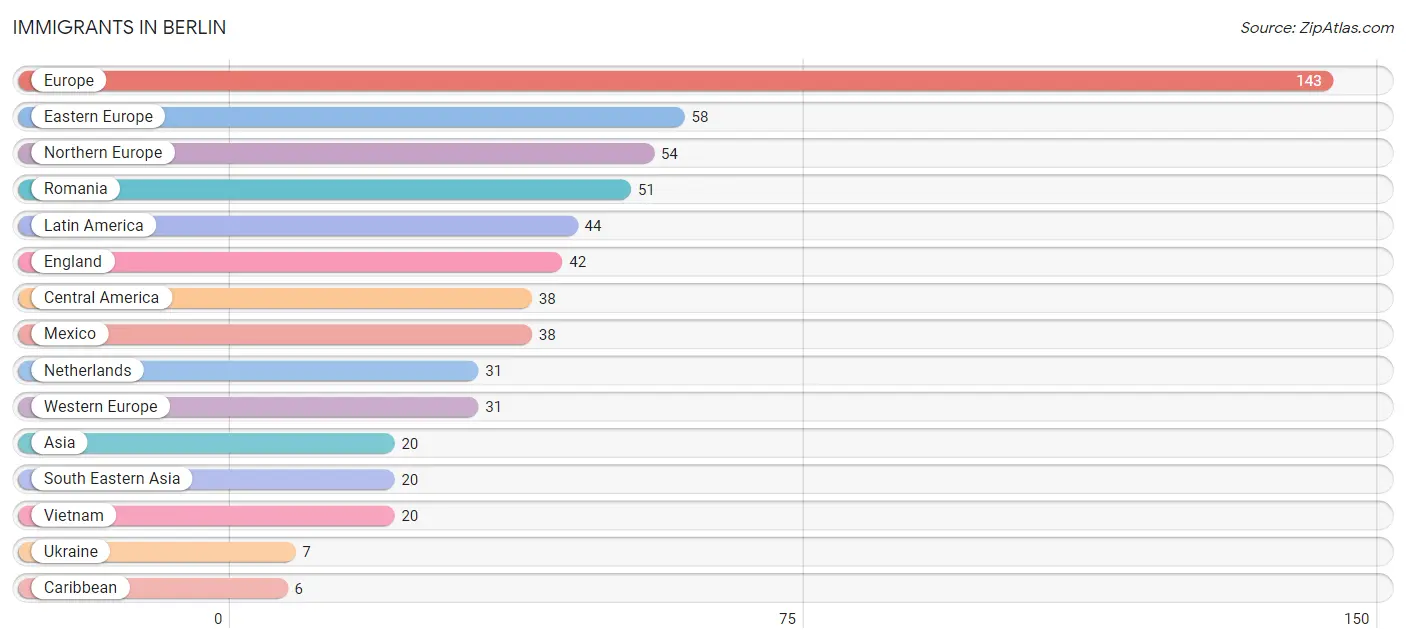
| Immigration Origin | # Population | % Population |
| Asia | 20 | 0.4% |
| Caribbean | 6 | 0.1% |
| Central America | 38 | 0.7% |
| Eastern Europe | 58 | 1.1% |
| England | 42 | 0.8% |
| Europe | 143 | 2.8% |
| Latin America | 44 | 0.9% |
| Mexico | 38 | 0.7% |
| Netherlands | 31 | 0.6% |
| Northern Europe | 54 | 1.1% |
| Romania | 51 | 1.0% |
| South Eastern Asia | 20 | 0.4% |
| Trinidad and Tobago | 6 | 0.1% |
| Ukraine | 7 | 0.1% |
| Vietnam | 20 | 0.4% |
| Western Europe | 31 | 0.6% | View All 16 Rows |
Sex and Age in Berlin
Sex and Age in Berlin
The most populous age groups in Berlin are 10 to 14 Years (324 | 14.4%) for men and 10 to 14 Years (334 | 11.9%) for women.
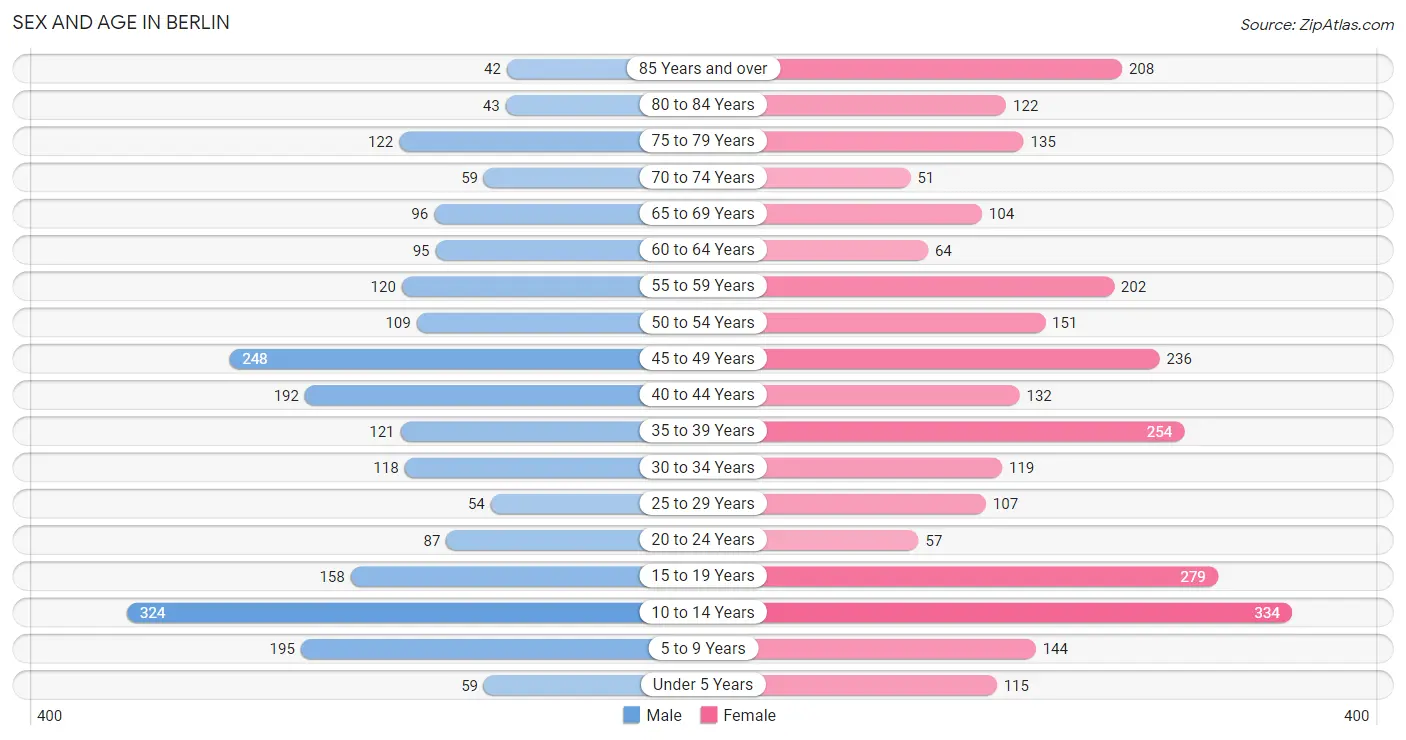
| Age Bracket | Male | Female |
| Under 5 Years | 59 (2.6%) | 115 (4.1%) |
| 5 to 9 Years | 195 (8.7%) | 144 (5.1%) |
| 10 to 14 Years | 324 (14.4%) | 334 (11.9%) |
| 15 to 19 Years | 158 (7.0%) | 279 (9.9%) |
| 20 to 24 Years | 87 (3.9%) | 57 (2.0%) |
| 25 to 29 Years | 54 (2.4%) | 107 (3.8%) |
| 30 to 34 Years | 118 (5.3%) | 119 (4.2%) |
| 35 to 39 Years | 121 (5.4%) | 254 (9.0%) |
| 40 to 44 Years | 192 (8.6%) | 132 (4.7%) |
| 45 to 49 Years | 248 (11.1%) | 236 (8.4%) |
| 50 to 54 Years | 109 (4.9%) | 151 (5.4%) |
| 55 to 59 Years | 120 (5.3%) | 202 (7.2%) |
| 60 to 64 Years | 95 (4.2%) | 64 (2.3%) |
| 65 to 69 Years | 96 (4.3%) | 104 (3.7%) |
| 70 to 74 Years | 59 (2.6%) | 51 (1.8%) |
| 75 to 79 Years | 122 (5.4%) | 135 (4.8%) |
| 80 to 84 Years | 43 (1.9%) | 122 (4.3%) |
| 85 Years and over | 42 (1.9%) | 208 (7.4%) |
| Total | 2,242 (100.0%) | 2,814 (100.0%) |
Families and Households in Berlin
Median Family Size in Berlin
The median family size in Berlin is 3.13 persons per family, with married-couple families (941 | 69.2%) accounting for the largest median family size of 3.35 persons per family. On the other hand, single male/father families (79 | 5.8%) represent the smallest median family size with 2.54 persons per family.
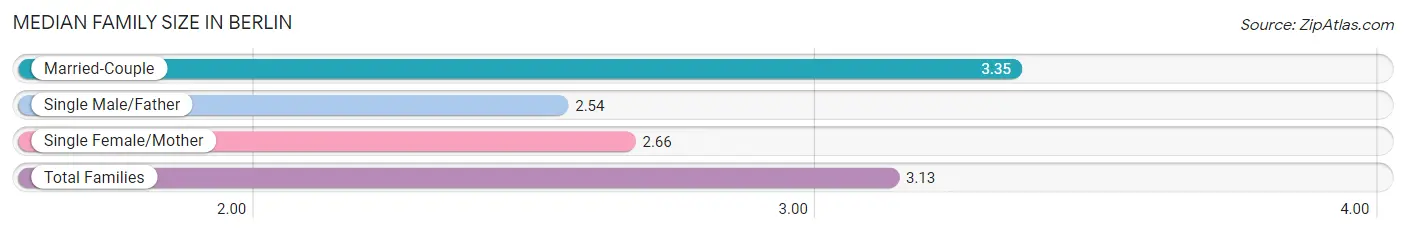
| Family Type | # Families | Family Size |
| Married-Couple | 941 (69.2%) | 3.35 |
| Single Male/Father | 79 (5.8%) | 2.54 |
| Single Female/Mother | 339 (24.9%) | 2.66 |
| Total Families | 1,359 (100.0%) | 3.13 |
Median Household Size in Berlin
The median household size in Berlin is 2.77 persons per household, with married-couple households (941 | 53.3%) accounting for the largest median household size of 3.35 persons per household. non-family households (407 | 23.1%) represent the smallest median household size with 1.30 persons per household.
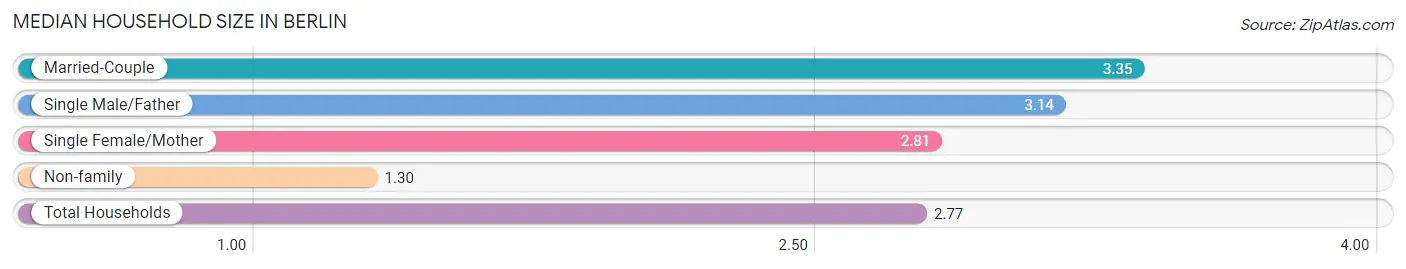
| Household Type | # Households | Household Size |
| Married-Couple | 941 (53.3%) | 3.35 |
| Single Male/Father | 79 (4.5%) | 3.14 |
| Single Female/Mother | 339 (19.2%) | 2.81 |
| Non-family | 407 (23.1%) | 1.30 |
| Total Households | 1,766 (100.0%) | 2.77 |
Household Size by Marriage Status in Berlin
Out of a total of 1,766 households in Berlin, 1,359 (76.9%) are family households, while 407 (23.1%) are nonfamily households. The most numerous type of family households are 2-person households, comprising 567, and the most common type of nonfamily households are 1-person households, comprising 315.
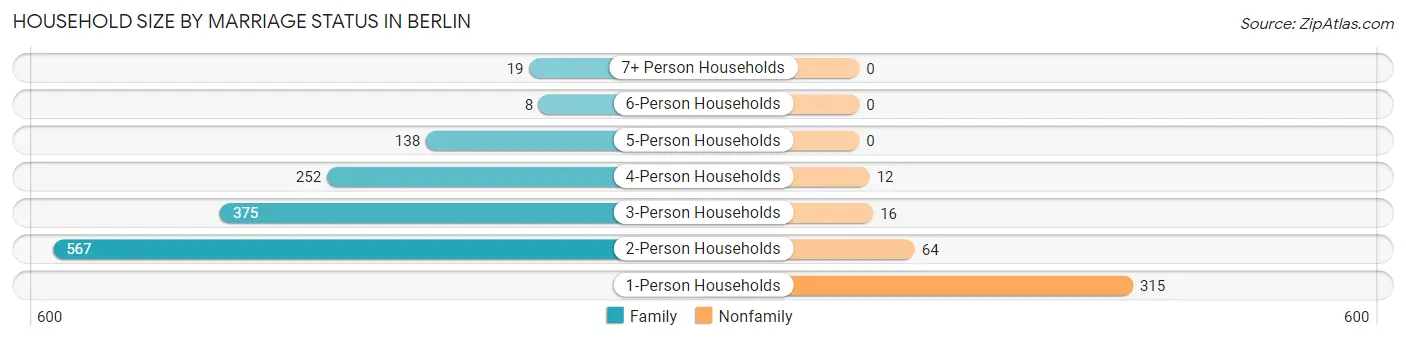
| Household Size | Family Households | Nonfamily Households |
| 1-Person Households | - | 315 (17.8%) |
| 2-Person Households | 567 (32.1%) | 64 (3.6%) |
| 3-Person Households | 375 (21.2%) | 16 (0.9%) |
| 4-Person Households | 252 (14.3%) | 12 (0.7%) |
| 5-Person Households | 138 (7.8%) | 0 (0.0%) |
| 6-Person Households | 8 (0.4%) | 0 (0.0%) |
| 7+ Person Households | 19 (1.1%) | 0 (0.0%) |
| Total | 1,359 (76.9%) | 407 (23.1%) |
Female Fertility in Berlin
Fertility by Age in Berlin
Average fertility rate in Berlin is 11.0 births per 1,000 women. Women in the age bracket of 20 to 34 years have the highest fertility rate with 46.0 births per 1,000 women. Women in the age bracket of 20 to 34 years acount for 100.0% of all women with births.
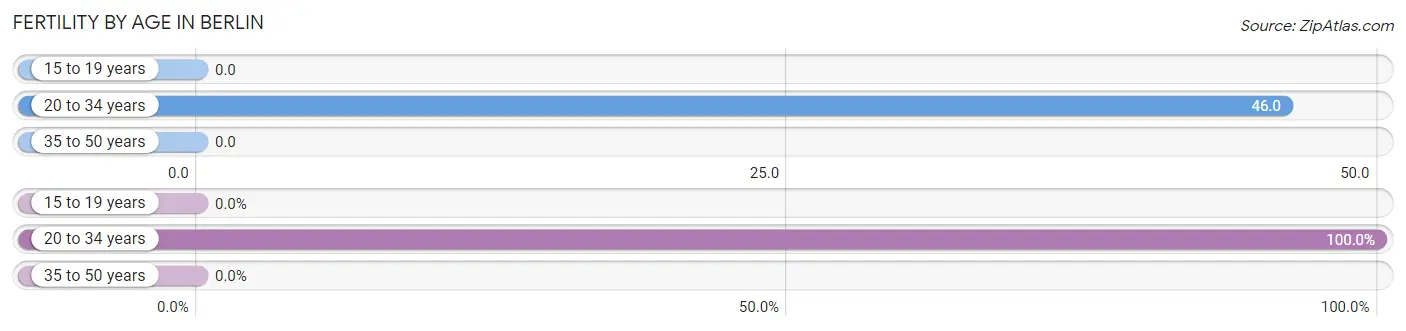
| Age Bracket | Women with Births | Births / 1,000 Women |
| 15 to 19 years | 0 (0.0%) | 0.0 |
| 20 to 34 years | 13 (100.0%) | 46.0 |
| 35 to 50 years | 0 (0.0%) | 0.0 |
| Total | 13 (100.0%) | 11.0 |
Fertility by Age by Marriage Status in Berlin
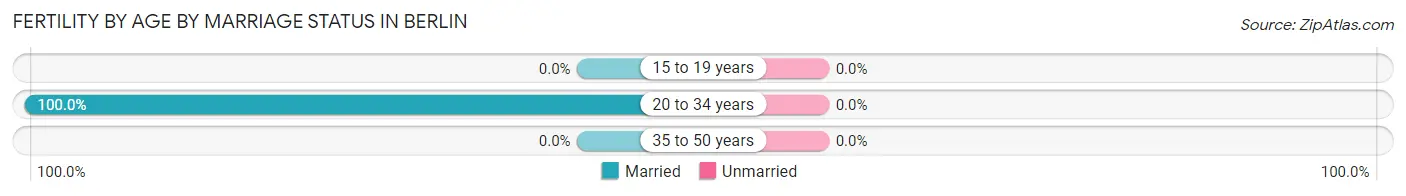
| Age Bracket | Married | Unmarried |
| 15 to 19 years | 0 (0.0%) | 0 (0.0%) |
| 20 to 34 years | 13 (100.0%) | 0 (0.0%) |
| 35 to 50 years | 0 (0.0%) | 0 (0.0%) |
| Total | 13 (100.0%) | 0 (0.0%) |
Fertility by Education in Berlin
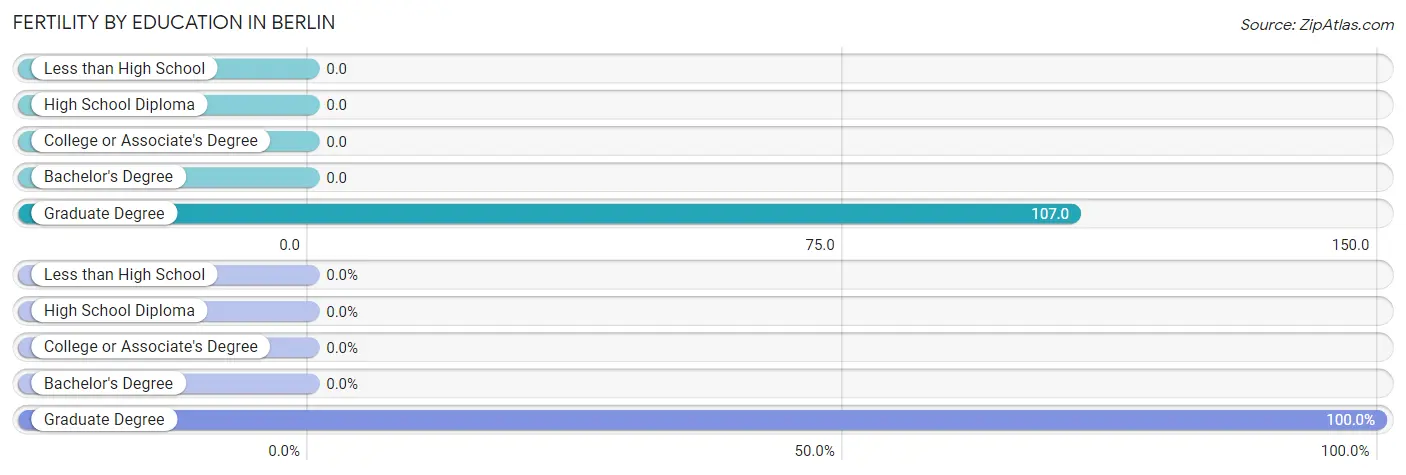
| Educational Attainment | Women with Births | Births / 1,000 Women |
| Less than High School | 0 (0.0%) | 0.0 |
| High School Diploma | 0 (0.0%) | 0.0 |
| College or Associate's Degree | 0 (0.0%) | 0.0 |
| Bachelor's Degree | 0 (0.0%) | 0.0 |
| Graduate Degree | 13 (100.0%) | 107.0 |
| Total | 13 (100.0%) | 11.0 |
Fertility by Education by Marriage Status in Berlin
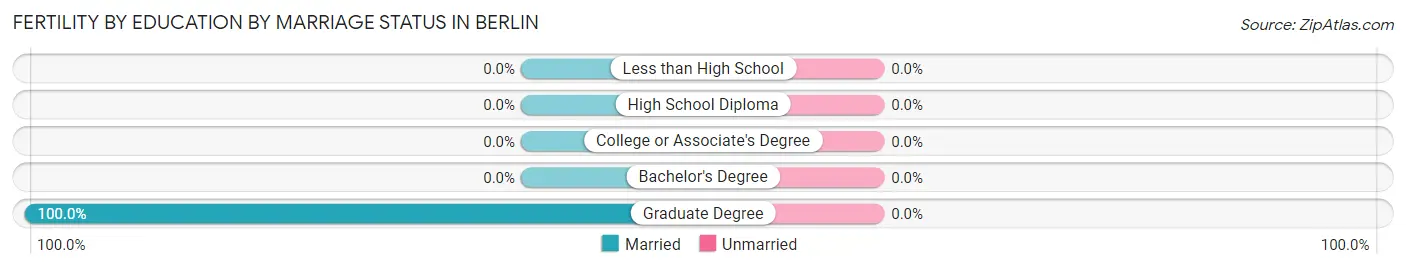
| Educational Attainment | Married | Unmarried |
| Less than High School | 0 (0.0%) | 0 (0.0%) |
| High School Diploma | 0 (0.0%) | 0 (0.0%) |
| College or Associate's Degree | 0 (0.0%) | 0 (0.0%) |
| Bachelor's Degree | 0 (0.0%) | 0 (0.0%) |
| Graduate Degree | 13 (100.0%) | 0 (0.0%) |
| Total | 13 (100.0%) | 0 (0.0%) |
Employment Characteristics in Berlin
Employment by Class of Employer in Berlin
Among the 2,369 employed individuals in Berlin, private company employees (1,440 | 60.8%), self-employed (incorporated) (183 | 7.7%), and self-employed (not incorporated) (178 | 7.5%) make up the most common classes of employment.
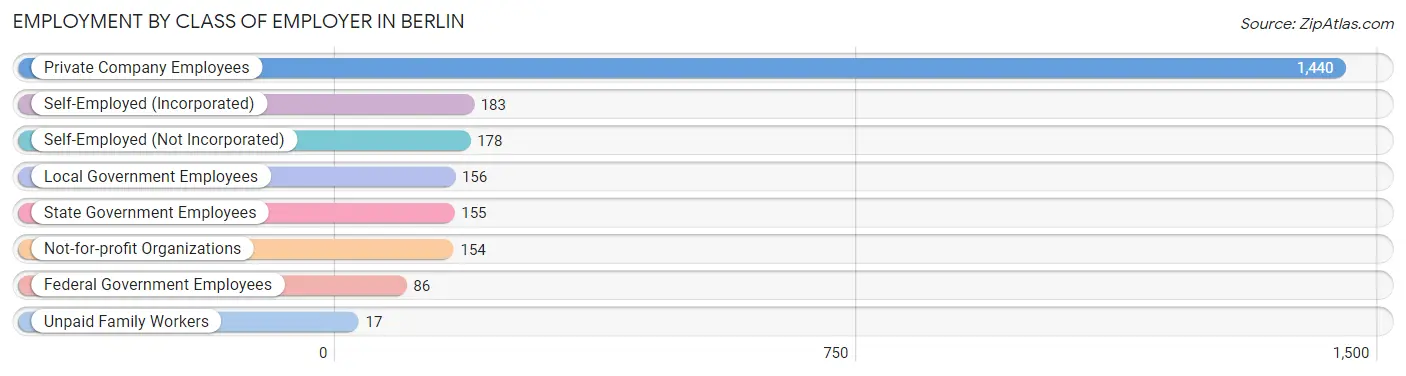
| Employer Class | # Employees | % Employees |
| Private Company Employees | 1,440 | 60.8% |
| Self-Employed (Incorporated) | 183 | 7.7% |
| Self-Employed (Not Incorporated) | 178 | 7.5% |
| Not-for-profit Organizations | 154 | 6.5% |
| Local Government Employees | 156 | 6.6% |
| State Government Employees | 155 | 6.5% |
| Federal Government Employees | 86 | 3.6% |
| Unpaid Family Workers | 17 | 0.7% |
| Total | 2,369 | 100.0% |
Employment Status by Age in Berlin
According to the labor force statistics for Berlin, out of the total population over 16 years of age (3,849), 63.3% or 2,436 individuals are in the labor force, with 2.8% or 68 of them unemployed. The age group with the highest labor force participation rate is 25 to 29 years, with 93.2% or 150 individuals in the labor force. Within the labor force, the 16 to 19 years age range has the highest percentage of unemployed individuals, with 8.7% or 18 of them being unemployed.
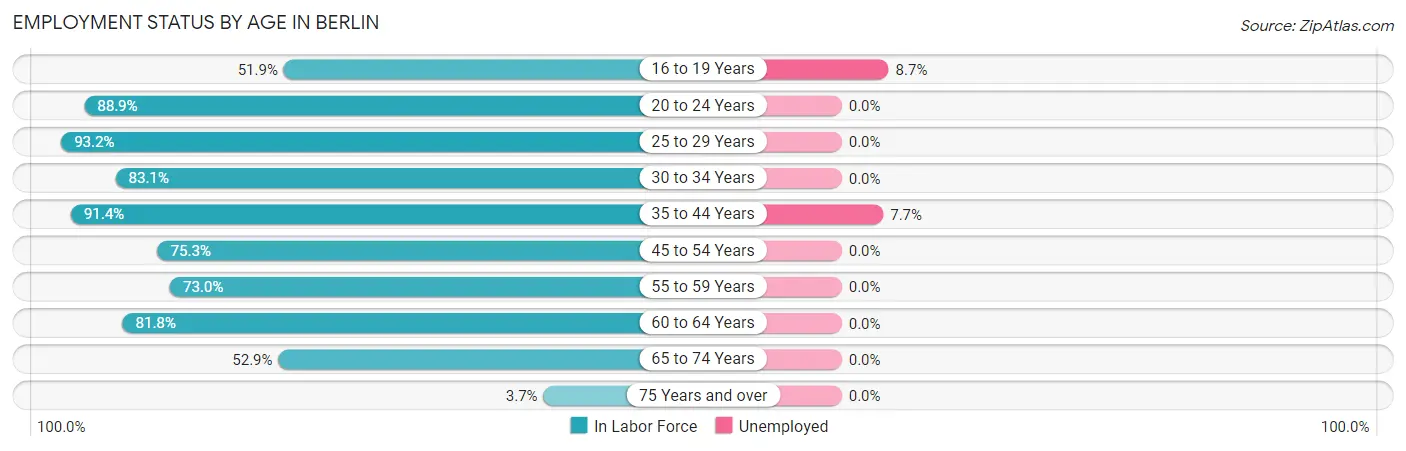
| Age Bracket | In Labor Force | Unemployed |
| 16 to 19 Years | 208 (51.9%) | 18 (8.7%) |
| 20 to 24 Years | 128 (88.9%) | 0 (0.0%) |
| 25 to 29 Years | 150 (93.2%) | 0 (0.0%) |
| 30 to 34 Years | 197 (83.1%) | 0 (0.0%) |
| 35 to 44 Years | 639 (91.4%) | 49 (7.7%) |
| 45 to 54 Years | 560 (75.3%) | 0 (0.0%) |
| 55 to 59 Years | 235 (73.0%) | 0 (0.0%) |
| 60 to 64 Years | 130 (81.8%) | 0 (0.0%) |
| 65 to 74 Years | 164 (52.9%) | 0 (0.0%) |
| 75 Years and over | 25 (3.7%) | 0 (0.0%) |
| Total | 2,436 (63.3%) | 68 (2.8%) |
Employment Status by Educational Attainment in Berlin
According to labor force statistics for Berlin, 82.3% of individuals (1,911) out of the total population between 25 and 64 years of age (2,322) are in the labor force, with 2.6% or 50 of them being unemployed. The group with the highest labor force participation rate are those with the educational attainment of bachelor's degree or higher, with 89.4% or 668 individuals in the labor force. Within the labor force, individuals with high school diploma education have the highest percentage of unemployment, with 7.2% or 32 of them being unemployed.
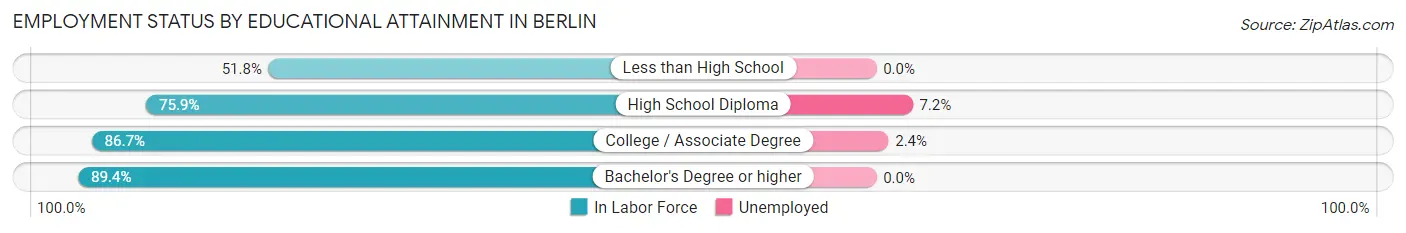
| Educational Attainment | In Labor Force | Unemployed |
| Less than High School | 87 (51.8%) | 0 (0.0%) |
| High School Diploma | 446 (75.9%) | 42 (7.2%) |
| College / Associate Degree | 710 (86.7%) | 20 (2.4%) |
| Bachelor's Degree or higher | 668 (89.4%) | 0 (0.0%) |
| Total | 1,911 (82.3%) | 60 (2.6%) |
Employment Occupations by Sex in Berlin
Management, Business, Science and Arts Occupations
The most common Management, Business, Science and Arts occupations in Berlin are Management (310 | 13.4%), Community & Social Service (238 | 10.3%), Health Diagnosing & Treating (184 | 7.9%), Education Instruction & Library (148 | 6.4%), and Computers, Engineering & Science (103 | 4.4%).
Management, Business, Science and Arts Occupations by Sex
Within the Management, Business, Science and Arts occupations in Berlin, the most male-oriented occupations are Architecture & Engineering (100.0%), Health Technologists (62.5%), and Management (61.9%), while the most female-oriented occupations are Arts, Media & Entertainment (100.0%), Health Diagnosing & Treating (75.5%), and Community & Social Service (72.3%).
| Occupation | Male | Female |
| Management | 192 (61.9%) | 118 (38.1%) |
| Business & Financial | 28 (33.3%) | 56 (66.7%) |
| Computers, Engineering & Science | 61 (59.2%) | 42 (40.8%) |
| Computers & Mathematics | 33 (44.0%) | 42 (56.0%) |
| Architecture & Engineering | 28 (100.0%) | 0 (0.0%) |
| Life, Physical & Social Science | 0 (0.0%) | 0 (0.0%) |
| Community & Social Service | 66 (27.7%) | 172 (72.3%) |
| Education, Arts & Media | 22 (28.6%) | 55 (71.4%) |
| Legal Services & Support | 0 (0.0%) | 0 (0.0%) |
| Education Instruction & Library | 44 (29.7%) | 104 (70.3%) |
| Arts, Media & Entertainment | 0 (0.0%) | 13 (100.0%) |
| Health Diagnosing & Treating | 45 (24.5%) | 139 (75.5%) |
| Health Technologists | 45 (62.5%) | 27 (37.5%) |
| Total (Category) | 392 (42.7%) | 527 (57.3%) |
| Total (Overall) | 1,087 (46.9%) | 1,232 (53.1%) |
Services Occupations
The most common Services occupations in Berlin are Food Preparation & Serving (323 | 13.9%), Healthcare Support (128 | 5.5%), Cleaning & Maintenance (121 | 5.2%), Security & Protection (27 | 1.2%), and Firefighting & Prevention (27 | 1.2%).
Services Occupations by Sex
Within the Services occupations in Berlin, the most male-oriented occupations are Security & Protection (100.0%), Firefighting & Prevention (100.0%), and Cleaning & Maintenance (71.9%), while the most female-oriented occupations are Healthcare Support (100.0%), Personal Care & Service (100.0%), and Food Preparation & Serving (51.7%).
| Occupation | Male | Female |
| Healthcare Support | 0 (0.0%) | 128 (100.0%) |
| Security & Protection | 27 (100.0%) | 0 (0.0%) |
| Firefighting & Prevention | 27 (100.0%) | 0 (0.0%) |
| Law Enforcement | 0 (0.0%) | 0 (0.0%) |
| Food Preparation & Serving | 156 (48.3%) | 167 (51.7%) |
| Cleaning & Maintenance | 87 (71.9%) | 34 (28.1%) |
| Personal Care & Service | 0 (0.0%) | 6 (100.0%) |
| Total (Category) | 270 (44.6%) | 335 (55.4%) |
| Total (Overall) | 1,087 (46.9%) | 1,232 (53.1%) |
Sales and Office Occupations
The most common Sales and Office occupations in Berlin are Office & Administration (302 | 13.0%), and Sales & Related (200 | 8.6%).

Sales and Office Occupations by Sex

| Occupation | Male | Female |
| Sales & Related | 75 (37.5%) | 125 (62.5%) |
| Office & Administration | 59 (19.5%) | 243 (80.5%) |
| Total (Category) | 134 (26.7%) | 368 (73.3%) |
| Total (Overall) | 1,087 (46.9%) | 1,232 (53.1%) |
Natural Resources, Construction and Maintenance Occupations
The most common Natural Resources, Construction and Maintenance occupations in Berlin are Construction & Extraction (110 | 4.7%), and Installation, Maintenance & Repair (93 | 4.0%).
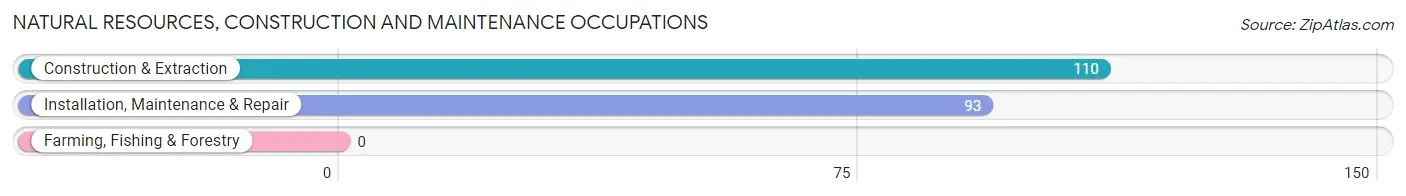
Natural Resources, Construction and Maintenance Occupations by Sex
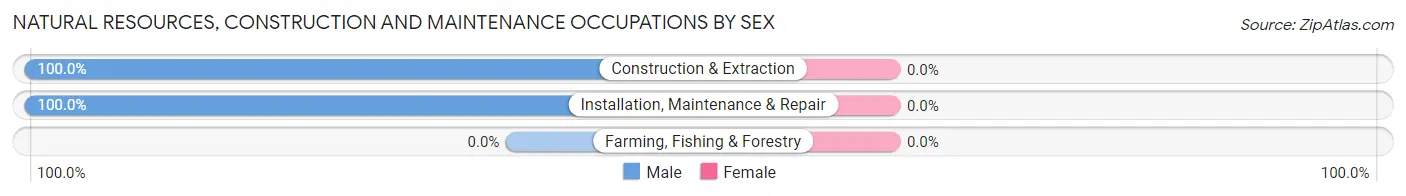
| Occupation | Male | Female |
| Farming, Fishing & Forestry | 0 (0.0%) | 0 (0.0%) |
| Construction & Extraction | 110 (100.0%) | 0 (0.0%) |
| Installation, Maintenance & Repair | 93 (100.0%) | 0 (0.0%) |
| Total (Category) | 203 (100.0%) | 0 (0.0%) |
| Total (Overall) | 1,087 (46.9%) | 1,232 (53.1%) |
Production, Transportation and Moving Occupations
The most common Production, Transportation and Moving occupations in Berlin are Material Moving (42 | 1.8%), Production (36 | 1.5%), and Transportation (12 | 0.5%).
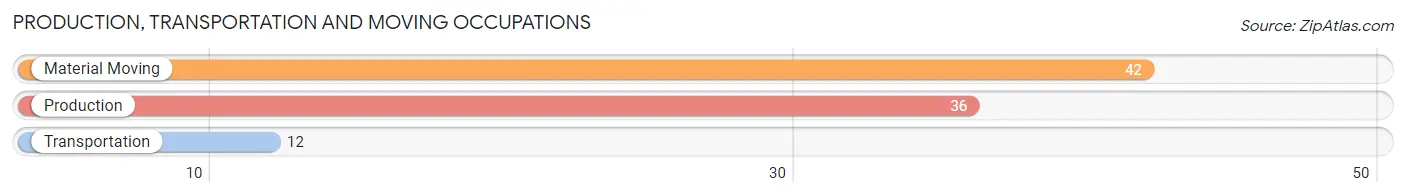
Production, Transportation and Moving Occupations by Sex
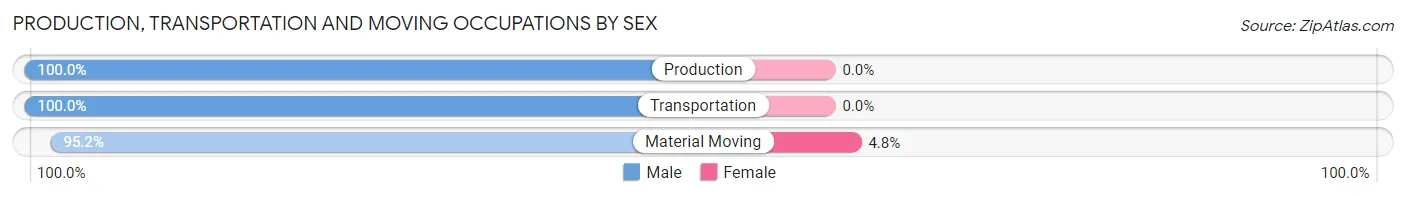
| Occupation | Male | Female |
| Production | 36 (100.0%) | 0 (0.0%) |
| Transportation | 12 (100.0%) | 0 (0.0%) |
| Material Moving | 40 (95.2%) | 2 (4.8%) |
| Total (Category) | 88 (97.8%) | 2 (2.2%) |
| Total (Overall) | 1,087 (46.9%) | 1,232 (53.1%) |
Employment Industries by Sex in Berlin
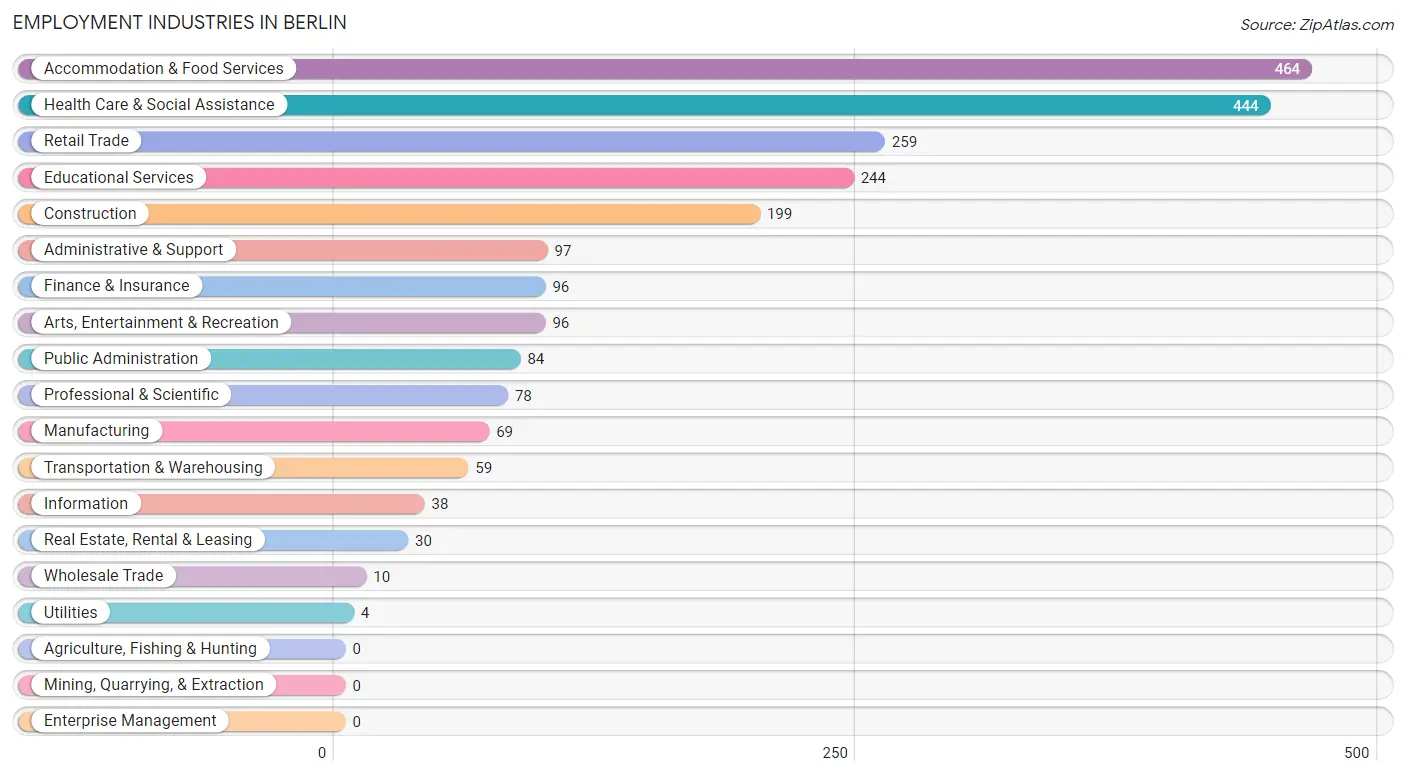
Employment Industries in Berlin
The major employment industries in Berlin include Accommodation & Food Services (464 | 20.0%), Health Care & Social Assistance (444 | 19.2%), Retail Trade (259 | 11.2%), Educational Services (244 | 10.5%), and Construction (199 | 8.6%).
Employment Industries by Sex in Berlin
The Berlin industries that see more men than women are Wholesale Trade (100.0%), Utilities (100.0%), and Real Estate, Rental & Leasing (100.0%), whereas the industries that tend to have a higher number of women are Information (100.0%), Manufacturing (78.3%), and Health Care & Social Assistance (77.0%).
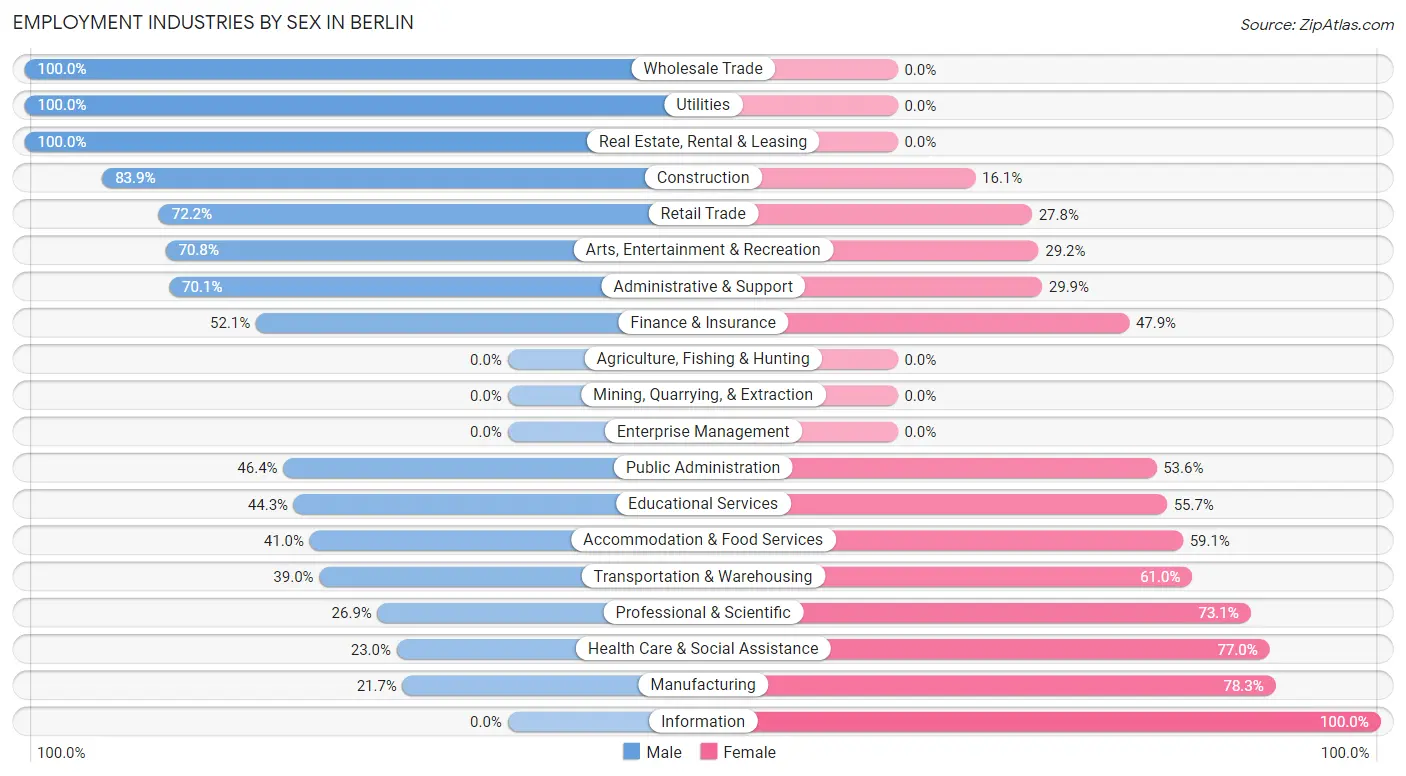
| Industry | Male | Female |
| Agriculture, Fishing & Hunting | 0 (0.0%) | 0 (0.0%) |
| Mining, Quarrying, & Extraction | 0 (0.0%) | 0 (0.0%) |
| Construction | 167 (83.9%) | 32 (16.1%) |
| Manufacturing | 15 (21.7%) | 54 (78.3%) |
| Wholesale Trade | 10 (100.0%) | 0 (0.0%) |
| Retail Trade | 187 (72.2%) | 72 (27.8%) |
| Transportation & Warehousing | 23 (39.0%) | 36 (61.0%) |
| Utilities | 4 (100.0%) | 0 (0.0%) |
| Information | 0 (0.0%) | 38 (100.0%) |
| Finance & Insurance | 50 (52.1%) | 46 (47.9%) |
| Real Estate, Rental & Leasing | 30 (100.0%) | 0 (0.0%) |
| Professional & Scientific | 21 (26.9%) | 57 (73.1%) |
| Enterprise Management | 0 (0.0%) | 0 (0.0%) |
| Administrative & Support | 68 (70.1%) | 29 (29.9%) |
| Educational Services | 108 (44.3%) | 136 (55.7%) |
| Health Care & Social Assistance | 102 (23.0%) | 342 (77.0%) |
| Arts, Entertainment & Recreation | 68 (70.8%) | 28 (29.2%) |
| Accommodation & Food Services | 190 (40.9%) | 274 (59.1%) |
| Public Administration | 39 (46.4%) | 45 (53.6%) |
| Total | 1,087 (46.9%) | 1,232 (53.1%) |
Education in Berlin
School Enrollment in Berlin
The most common levels of schooling among the 1,587 students in Berlin are high school (547 | 34.5%), middle school (352 | 22.2%), and elementary school (334 | 21.0%).
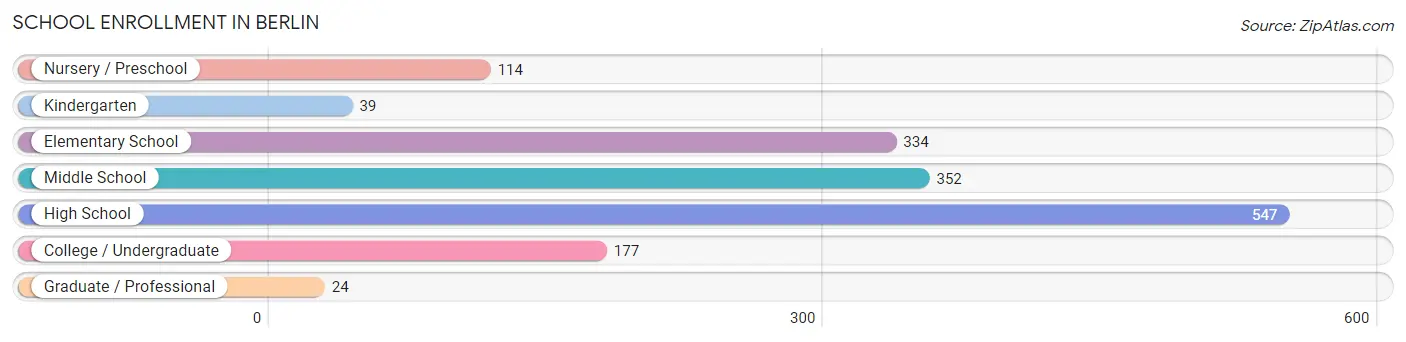
| School Level | # Students | % Students |
| Nursery / Preschool | 114 | 7.2% |
| Kindergarten | 39 | 2.5% |
| Elementary School | 334 | 21.0% |
| Middle School | 352 | 22.2% |
| High School | 547 | 34.5% |
| College / Undergraduate | 177 | 11.2% |
| Graduate / Professional | 24 | 1.5% |
| Total | 1,587 | 100.0% |
School Enrollment by Age by Funding Source in Berlin
Out of a total of 1,587 students who are enrolled in schools in Berlin, 140 (8.8%) attend a private institution, while the remaining 1,447 (91.2%) are enrolled in public schools. The age group of 10 to 14 year olds has the highest likelihood of being enrolled in private schools, with 75 (11.4% in the age bracket) enrolled. Conversely, the age group of 18 to 19 year olds has the lowest likelihood of being enrolled in a private school, with 120 (100.0% in the age bracket) attending a public institution.
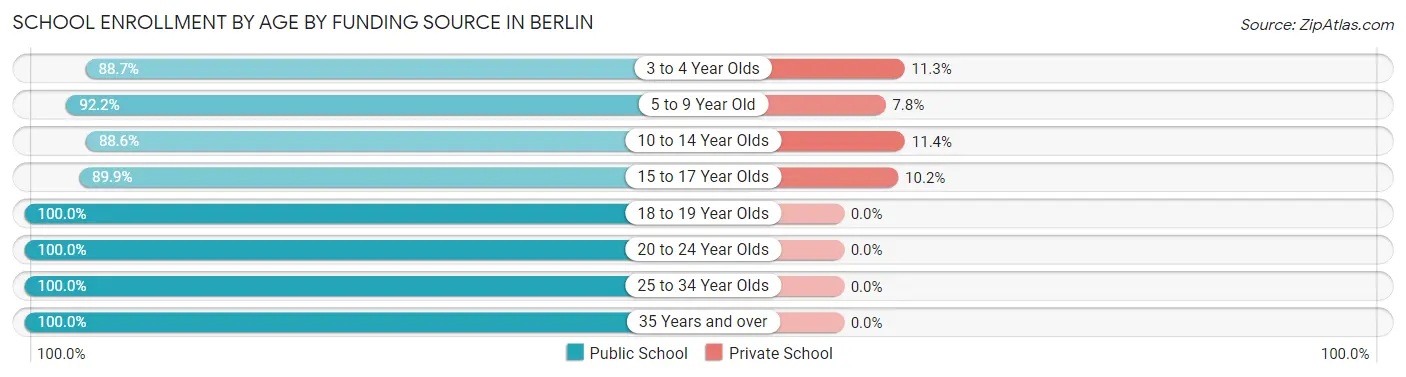
| Age Bracket | Public School | Private School |
| 3 to 4 Year Olds | 86 (88.7%) | 11 (11.3%) |
| 5 to 9 Year Old | 308 (92.2%) | 26 (7.8%) |
| 10 to 14 Year Olds | 583 (88.6%) | 75 (11.4%) |
| 15 to 17 Year Olds | 239 (89.8%) | 27 (10.2%) |
| 18 to 19 Year Olds | 120 (100.0%) | 0 (0.0%) |
| 20 to 24 Year Olds | 16 (100.0%) | 0 (0.0%) |
| 25 to 34 Year Olds | 33 (100.0%) | 0 (0.0%) |
| 35 Years and over | 63 (100.0%) | 0 (0.0%) |
| Total | 1,447 (91.2%) | 140 (8.8%) |
Educational Attainment by Field of Study in Berlin
Education (208 | 18.8%), arts & humanities (161 | 14.5%), business (160 | 14.4%), science & technology (116 | 10.5%), and visual & performing arts (110 | 9.9%) are the most common fields of study among 1,108 individuals in Berlin who have obtained a bachelor's degree or higher.
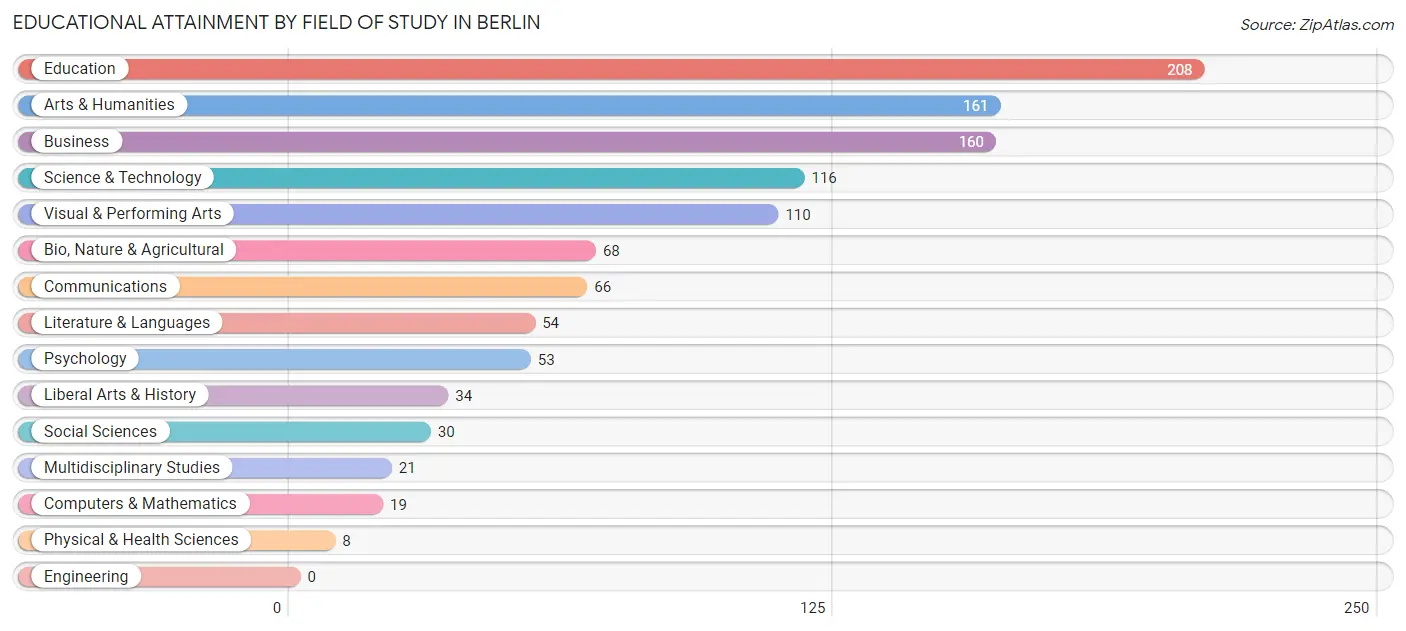
| Field of Study | # Graduates | % Graduates |
| Computers & Mathematics | 19 | 1.7% |
| Bio, Nature & Agricultural | 68 | 6.1% |
| Physical & Health Sciences | 8 | 0.7% |
| Psychology | 53 | 4.8% |
| Social Sciences | 30 | 2.7% |
| Engineering | 0 | 0.0% |
| Multidisciplinary Studies | 21 | 1.9% |
| Science & Technology | 116 | 10.5% |
| Business | 160 | 14.4% |
| Education | 208 | 18.8% |
| Literature & Languages | 54 | 4.9% |
| Liberal Arts & History | 34 | 3.1% |
| Visual & Performing Arts | 110 | 9.9% |
| Communications | 66 | 6.0% |
| Arts & Humanities | 161 | 14.5% |
| Total | 1,108 | 100.0% |
Transportation & Commute in Berlin
Vehicle Availability by Sex in Berlin
The most prevalent vehicle ownership categories in Berlin are males with 2 vehicles (563, accounting for 49.5%) and females with 2 vehicles (511, making up 45.7%).
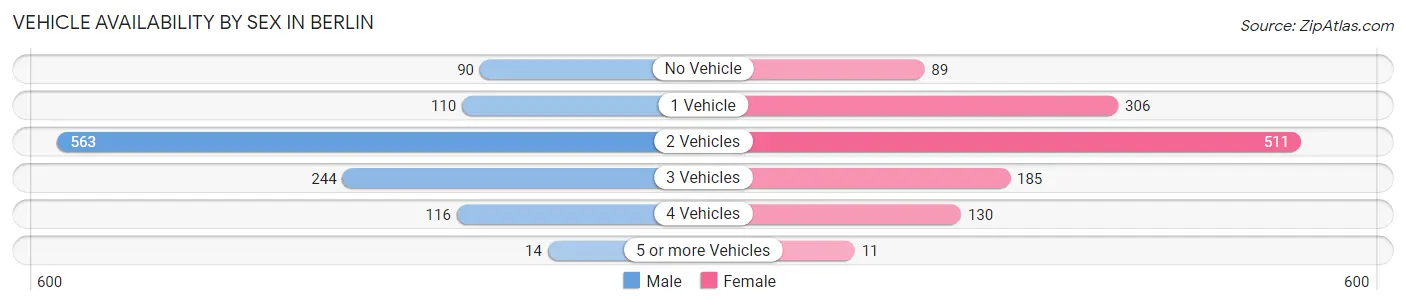
| Vehicles Available | Male | Female |
| No Vehicle | 90 (7.9%) | 89 (7.2%) |
| 1 Vehicle | 110 (9.7%) | 306 (24.8%) |
| 2 Vehicles | 563 (49.5%) | 511 (41.5%) |
| 3 Vehicles | 244 (21.5%) | 185 (15.0%) |
| 4 Vehicles | 116 (10.2%) | 130 (10.5%) |
| 5 or more Vehicles | 14 (1.2%) | 11 (0.9%) |
| Total | 1,137 (100.0%) | 1,232 (100.0%) |
Commute Time in Berlin
The most frequently occuring commute durations in Berlin are 15 to 19 minutes (404 commuters, 18.6%), 5 to 9 minutes (380 commuters, 17.5%), and 20 to 24 minutes (378 commuters, 17.4%).
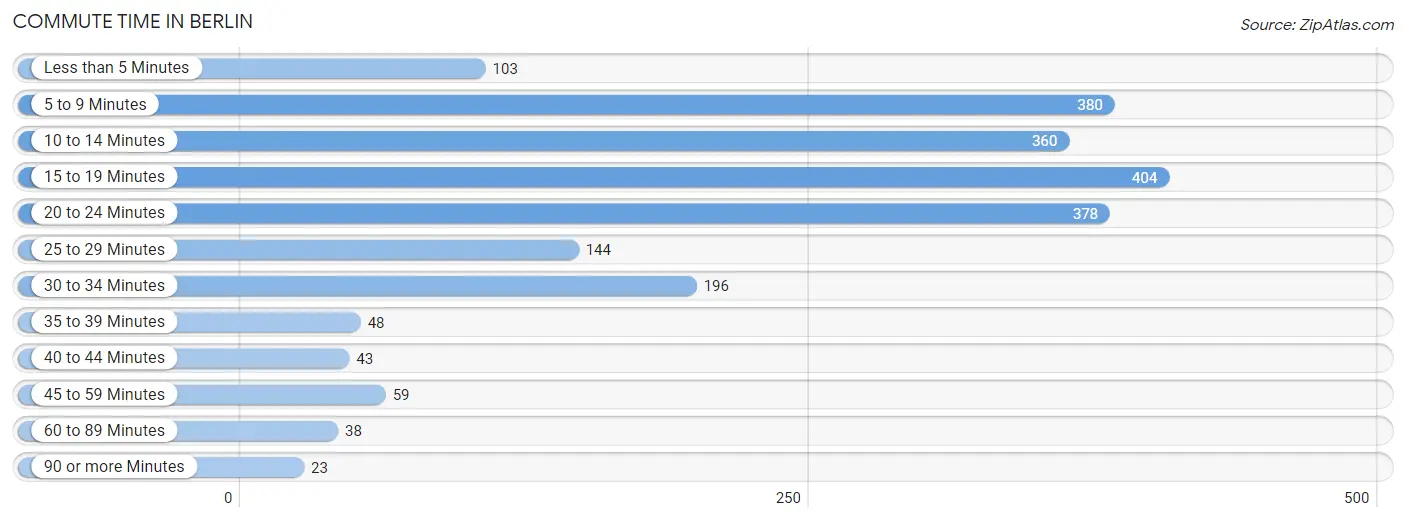
| Commute Time | # Commuters | % Commuters |
| Less than 5 Minutes | 103 | 4.7% |
| 5 to 9 Minutes | 380 | 17.5% |
| 10 to 14 Minutes | 360 | 16.5% |
| 15 to 19 Minutes | 404 | 18.6% |
| 20 to 24 Minutes | 378 | 17.4% |
| 25 to 29 Minutes | 144 | 6.6% |
| 30 to 34 Minutes | 196 | 9.0% |
| 35 to 39 Minutes | 48 | 2.2% |
| 40 to 44 Minutes | 43 | 2.0% |
| 45 to 59 Minutes | 59 | 2.7% |
| 60 to 89 Minutes | 38 | 1.8% |
| 90 or more Minutes | 23 | 1.1% |
Commute Time by Sex in Berlin
The most common commute times in Berlin are 15 to 19 minutes (251 commuters, 23.5%) for males and 5 to 9 minutes (215 commuters, 19.4%) for females.
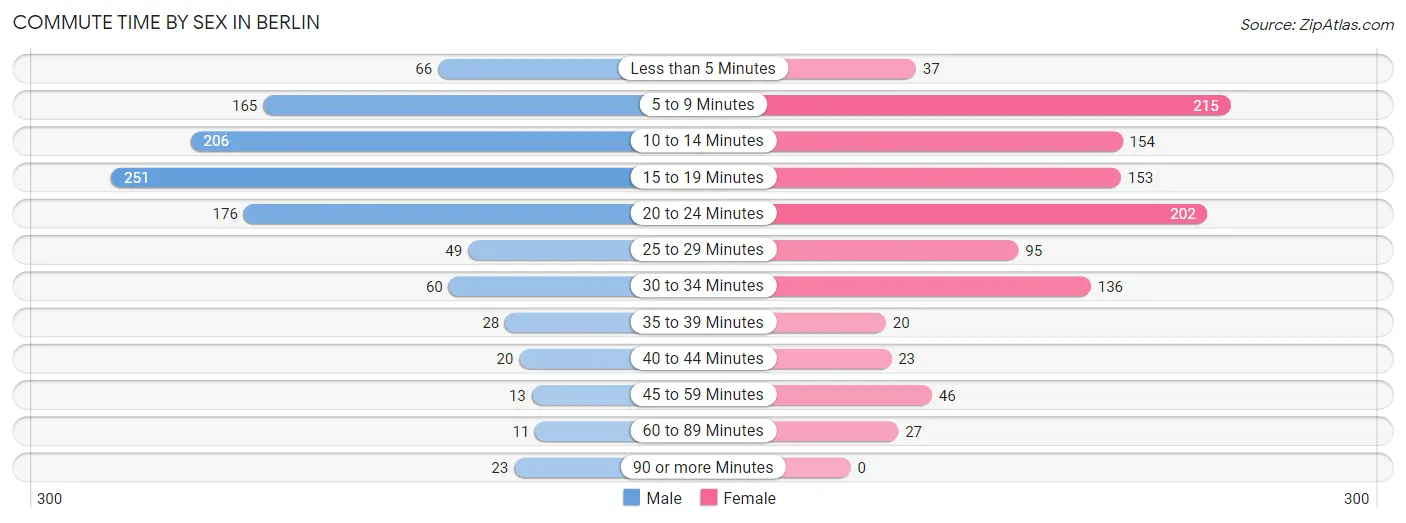
| Commute Time | Male | Female |
| Less than 5 Minutes | 66 (6.2%) | 37 (3.3%) |
| 5 to 9 Minutes | 165 (15.4%) | 215 (19.4%) |
| 10 to 14 Minutes | 206 (19.3%) | 154 (13.9%) |
| 15 to 19 Minutes | 251 (23.5%) | 153 (13.8%) |
| 20 to 24 Minutes | 176 (16.5%) | 202 (18.2%) |
| 25 to 29 Minutes | 49 (4.6%) | 95 (8.6%) |
| 30 to 34 Minutes | 60 (5.6%) | 136 (12.3%) |
| 35 to 39 Minutes | 28 (2.6%) | 20 (1.8%) |
| 40 to 44 Minutes | 20 (1.9%) | 23 (2.1%) |
| 45 to 59 Minutes | 13 (1.2%) | 46 (4.2%) |
| 60 to 89 Minutes | 11 (1.0%) | 27 (2.4%) |
| 90 or more Minutes | 23 (2.1%) | 0 (0.0%) |
Time of Departure to Work by Sex in Berlin
The most frequent times of departure to work in Berlin are 7:00 AM to 7:29 AM (205, 19.2%) for males and 7:00 AM to 7:29 AM (219, 19.8%) for females.
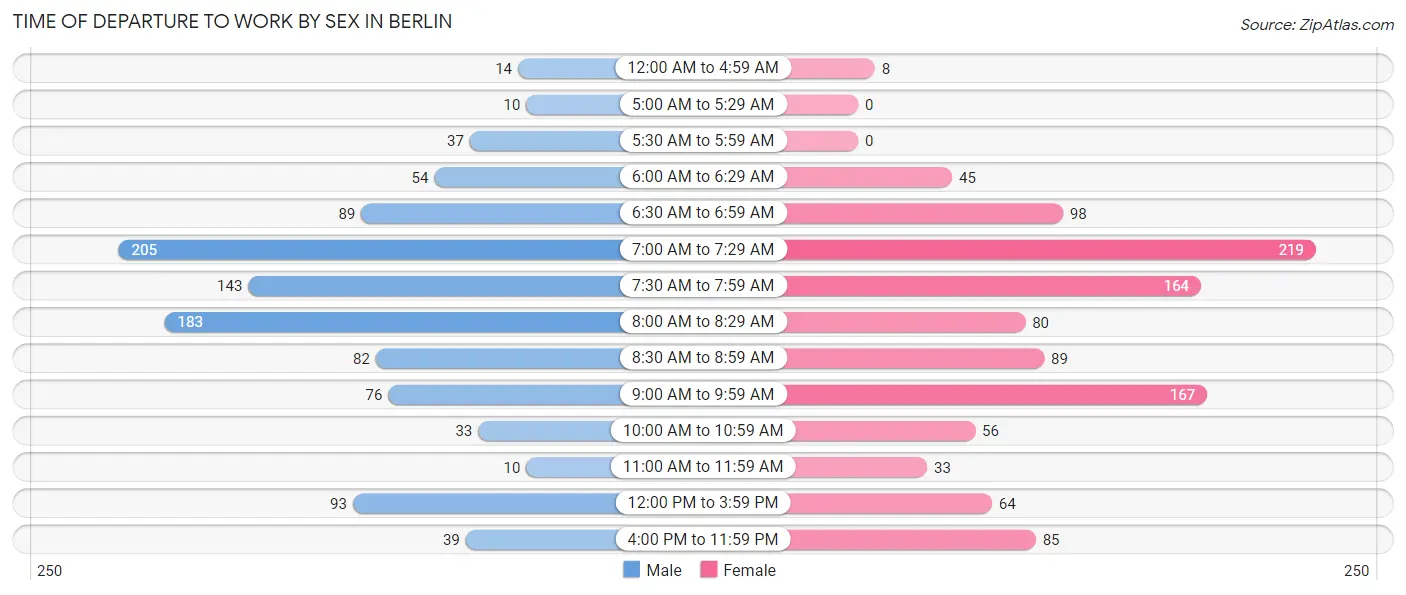
| Time of Departure | Male | Female |
| 12:00 AM to 4:59 AM | 14 (1.3%) | 8 (0.7%) |
| 5:00 AM to 5:29 AM | 10 (0.9%) | 0 (0.0%) |
| 5:30 AM to 5:59 AM | 37 (3.5%) | 0 (0.0%) |
| 6:00 AM to 6:29 AM | 54 (5.1%) | 45 (4.1%) |
| 6:30 AM to 6:59 AM | 89 (8.3%) | 98 (8.8%) |
| 7:00 AM to 7:29 AM | 205 (19.2%) | 219 (19.8%) |
| 7:30 AM to 7:59 AM | 143 (13.4%) | 164 (14.8%) |
| 8:00 AM to 8:29 AM | 183 (17.1%) | 80 (7.2%) |
| 8:30 AM to 8:59 AM | 82 (7.7%) | 89 (8.0%) |
| 9:00 AM to 9:59 AM | 76 (7.1%) | 167 (15.1%) |
| 10:00 AM to 10:59 AM | 33 (3.1%) | 56 (5.1%) |
| 11:00 AM to 11:59 AM | 10 (0.9%) | 33 (3.0%) |
| 12:00 PM to 3:59 PM | 93 (8.7%) | 64 (5.8%) |
| 4:00 PM to 11:59 PM | 39 (3.6%) | 85 (7.7%) |
| Total | 1,068 (100.0%) | 1,108 (100.0%) |
Housing Occupancy in Berlin
Occupancy by Ownership in Berlin
Of the total 1,766 dwellings in Berlin, owner-occupied units account for 992 (56.2%), while renter-occupied units make up 774 (43.8%).
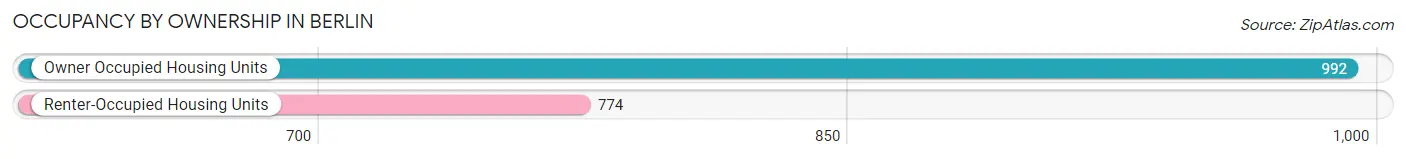
| Occupancy | # Housing Units | % Housing Units |
| Owner Occupied Housing Units | 992 | 56.2% |
| Renter-Occupied Housing Units | 774 | 43.8% |
| Total Occupied Housing Units | 1,766 | 100.0% |
Occupancy by Household Size in Berlin
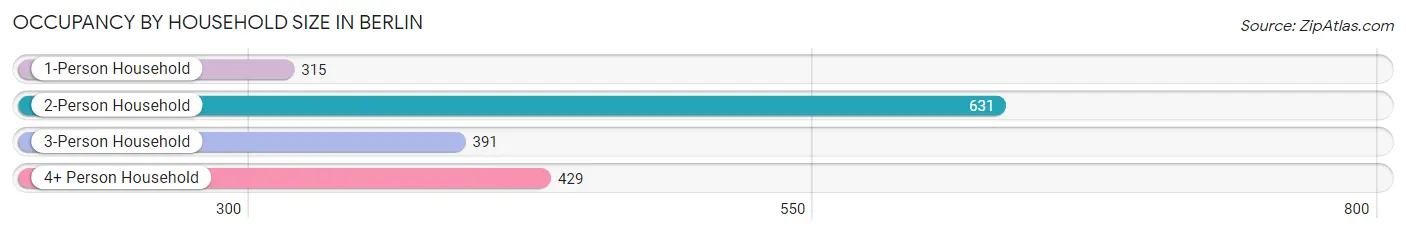
| Household Size | # Housing Units | % Housing Units |
| 1-Person Household | 315 | 17.8% |
| 2-Person Household | 631 | 35.7% |
| 3-Person Household | 391 | 22.1% |
| 4+ Person Household | 429 | 24.3% |
| Total Housing Units | 1,766 | 100.0% |
Occupancy by Ownership by Household Size in Berlin
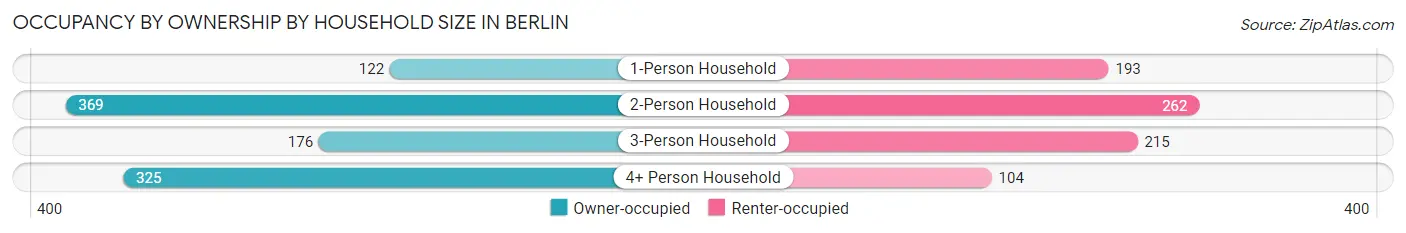
| Household Size | Owner-occupied | Renter-occupied |
| 1-Person Household | 122 (38.7%) | 193 (61.3%) |
| 2-Person Household | 369 (58.5%) | 262 (41.5%) |
| 3-Person Household | 176 (45.0%) | 215 (55.0%) |
| 4+ Person Household | 325 (75.8%) | 104 (24.2%) |
| Total Housing Units | 992 (56.2%) | 774 (43.8%) |
Occupancy by Educational Attainment in Berlin
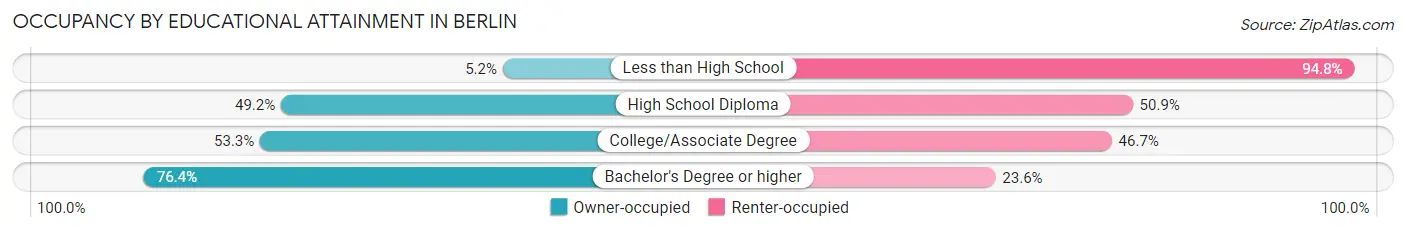
| Household Size | Owner-occupied | Renter-occupied |
| Less than High School | 8 (5.2%) | 146 (94.8%) |
| High School Diploma | 232 (49.1%) | 240 (50.8%) |
| College/Associate Degree | 274 (53.3%) | 240 (46.7%) |
| Bachelor's Degree or higher | 478 (76.4%) | 148 (23.6%) |
Occupancy by Age of Householder in Berlin
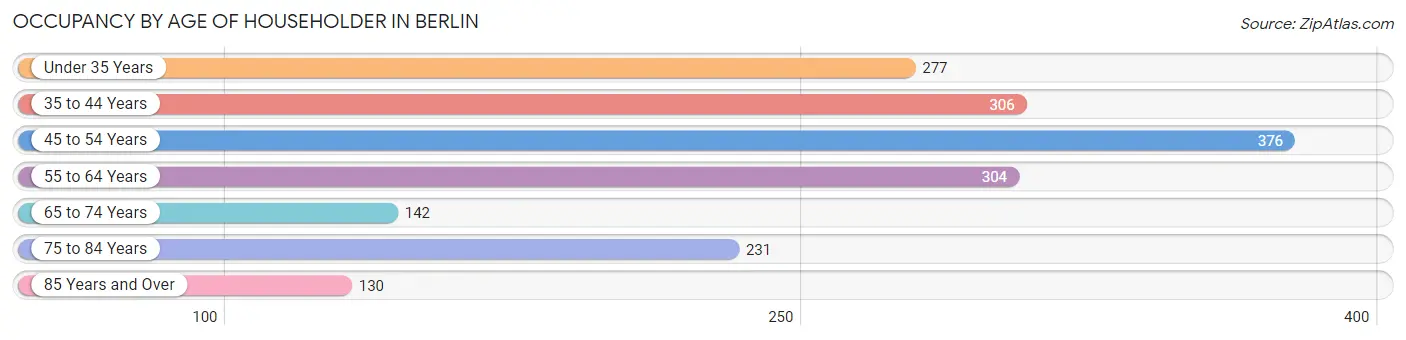
| Age Bracket | # Households | % Households |
| Under 35 Years | 277 | 15.7% |
| 35 to 44 Years | 306 | 17.3% |
| 45 to 54 Years | 376 | 21.3% |
| 55 to 64 Years | 304 | 17.2% |
| 65 to 74 Years | 142 | 8.0% |
| 75 to 84 Years | 231 | 13.1% |
| 85 Years and Over | 130 | 7.4% |
| Total | 1,766 | 100.0% |
Housing Finances in Berlin
Median Income by Occupancy in Berlin
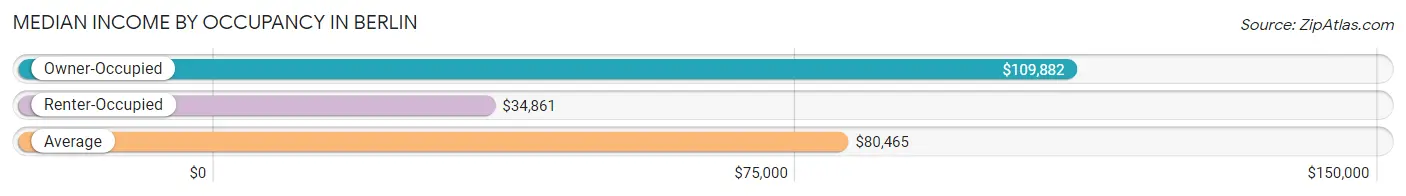
| Occupancy Type | # Households | Median Income |
| Owner-Occupied | 992 (56.2%) | $109,882 |
| Renter-Occupied | 774 (43.8%) | $34,861 |
| Average | 1,766 (100.0%) | $80,465 |
Occupancy by Householder Income Bracket in Berlin
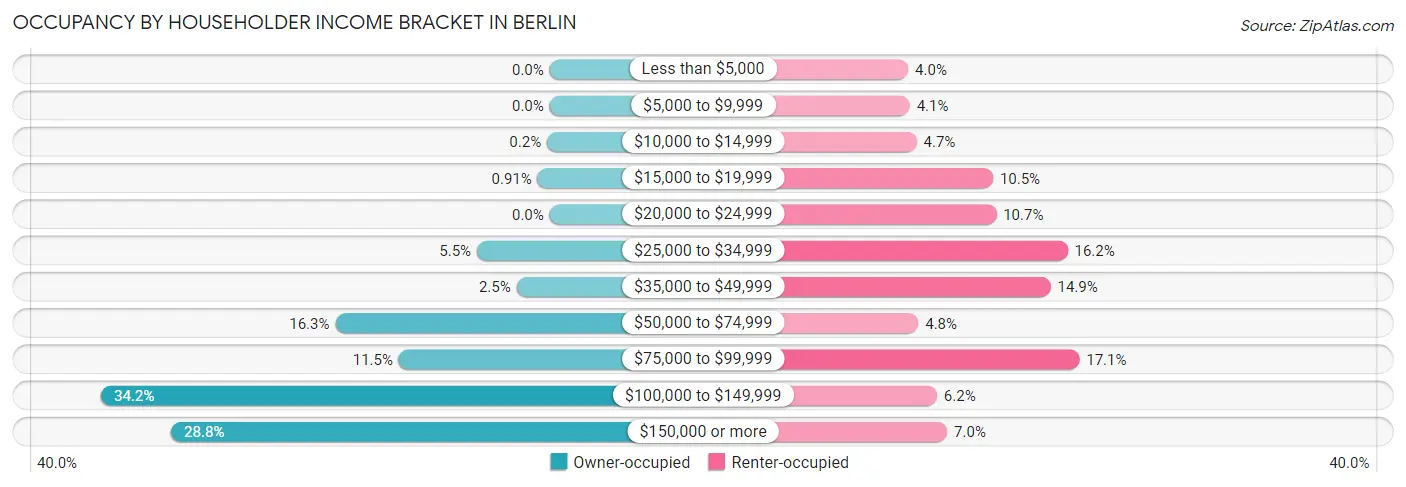
| Income Bracket | Owner-occupied | Renter-occupied |
| Less than $5,000 | 0 (0.0%) | 31 (4.0%) |
| $5,000 to $9,999 | 0 (0.0%) | 32 (4.1%) |
| $10,000 to $14,999 | 2 (0.2%) | 36 (4.6%) |
| $15,000 to $19,999 | 9 (0.9%) | 81 (10.5%) |
| $20,000 to $24,999 | 0 (0.0%) | 83 (10.7%) |
| $25,000 to $34,999 | 55 (5.5%) | 125 (16.2%) |
| $35,000 to $49,999 | 25 (2.5%) | 115 (14.9%) |
| $50,000 to $74,999 | 162 (16.3%) | 37 (4.8%) |
| $75,000 to $99,999 | 114 (11.5%) | 132 (17.1%) |
| $100,000 to $149,999 | 339 (34.2%) | 48 (6.2%) |
| $150,000 or more | 286 (28.8%) | 54 (7.0%) |
| Total | 992 (100.0%) | 774 (100.0%) |
Monthly Housing Cost Tiers in Berlin
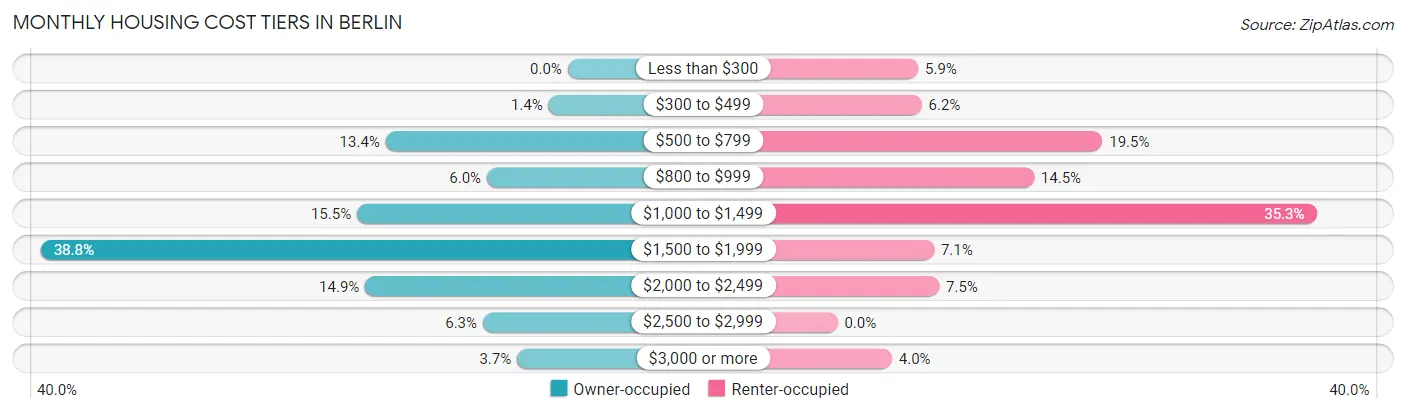
| Monthly Cost | Owner-occupied | Renter-occupied |
| Less than $300 | 0 (0.0%) | 46 (5.9%) |
| $300 to $499 | 14 (1.4%) | 48 (6.2%) |
| $500 to $799 | 133 (13.4%) | 151 (19.5%) |
| $800 to $999 | 59 (5.9%) | 112 (14.5%) |
| $1,000 to $1,499 | 154 (15.5%) | 273 (35.3%) |
| $1,500 to $1,999 | 385 (38.8%) | 55 (7.1%) |
| $2,000 to $2,499 | 148 (14.9%) | 58 (7.5%) |
| $2,500 to $2,999 | 62 (6.2%) | 0 (0.0%) |
| $3,000 or more | 37 (3.7%) | 31 (4.0%) |
| Total | 992 (100.0%) | 774 (100.0%) |
Physical Housing Characteristics in Berlin
Housing Structures in Berlin
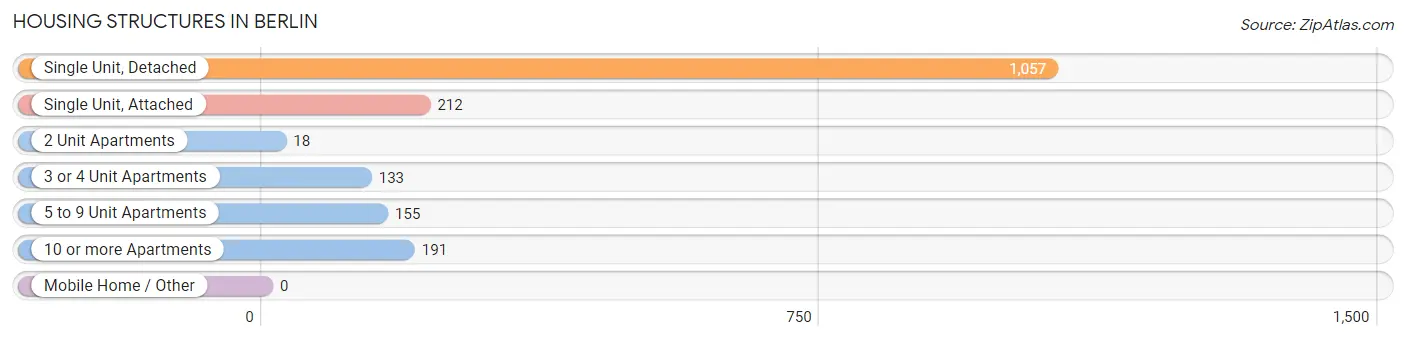
| Structure Type | # Housing Units | % Housing Units |
| Single Unit, Detached | 1,057 | 59.9% |
| Single Unit, Attached | 212 | 12.0% |
| 2 Unit Apartments | 18 | 1.0% |
| 3 or 4 Unit Apartments | 133 | 7.5% |
| 5 to 9 Unit Apartments | 155 | 8.8% |
| 10 or more Apartments | 191 | 10.8% |
| Mobile Home / Other | 0 | 0.0% |
| Total | 1,766 | 100.0% |
Housing Structures by Occupancy in Berlin
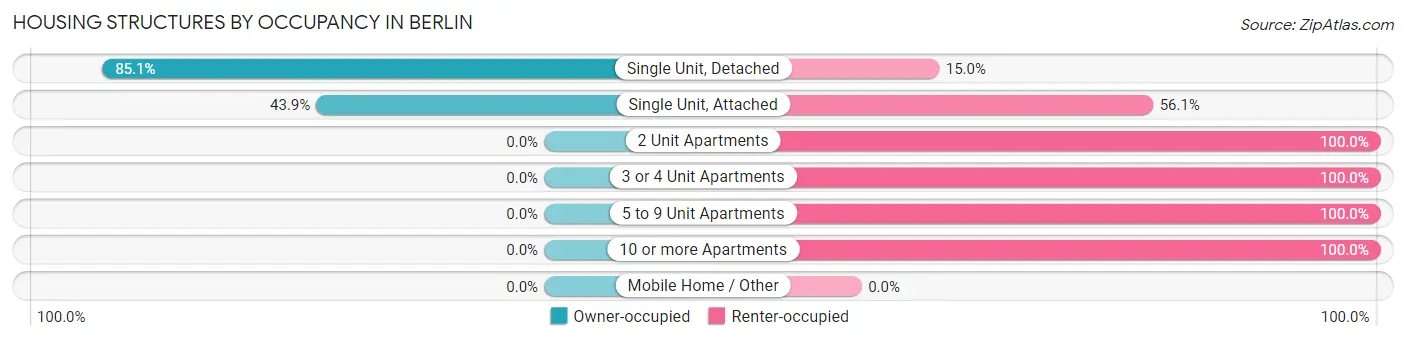
| Structure Type | Owner-occupied | Renter-occupied |
| Single Unit, Detached | 899 (85.1%) | 158 (14.9%) |
| Single Unit, Attached | 93 (43.9%) | 119 (56.1%) |
| 2 Unit Apartments | 0 (0.0%) | 18 (100.0%) |
| 3 or 4 Unit Apartments | 0 (0.0%) | 133 (100.0%) |
| 5 to 9 Unit Apartments | 0 (0.0%) | 155 (100.0%) |
| 10 or more Apartments | 0 (0.0%) | 191 (100.0%) |
| Mobile Home / Other | 0 (0.0%) | 0 (0.0%) |
| Total | 992 (56.2%) | 774 (43.8%) |
Housing Structures by Number of Rooms in Berlin
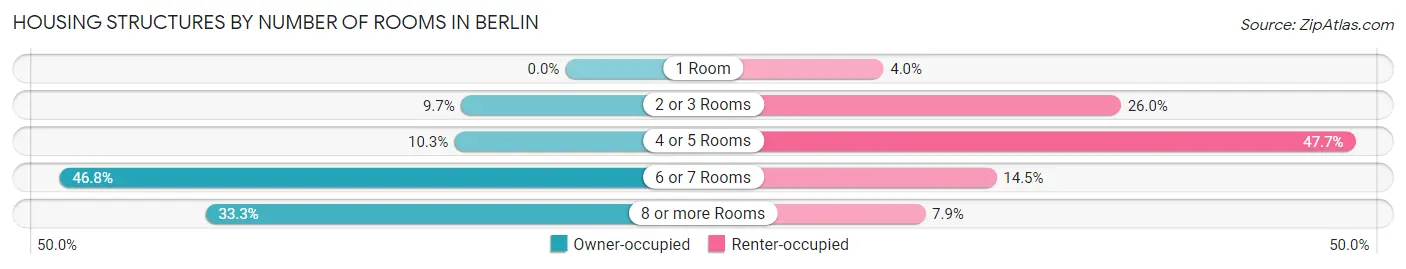
| Number of Rooms | Owner-occupied | Renter-occupied |
| 1 Room | 0 (0.0%) | 31 (4.0%) |
| 2 or 3 Rooms | 96 (9.7%) | 201 (26.0%) |
| 4 or 5 Rooms | 102 (10.3%) | 369 (47.7%) |
| 6 or 7 Rooms | 464 (46.8%) | 112 (14.5%) |
| 8 or more Rooms | 330 (33.3%) | 61 (7.9%) |
| Total | 992 (100.0%) | 774 (100.0%) |
Housing Structure by Heating Type in Berlin
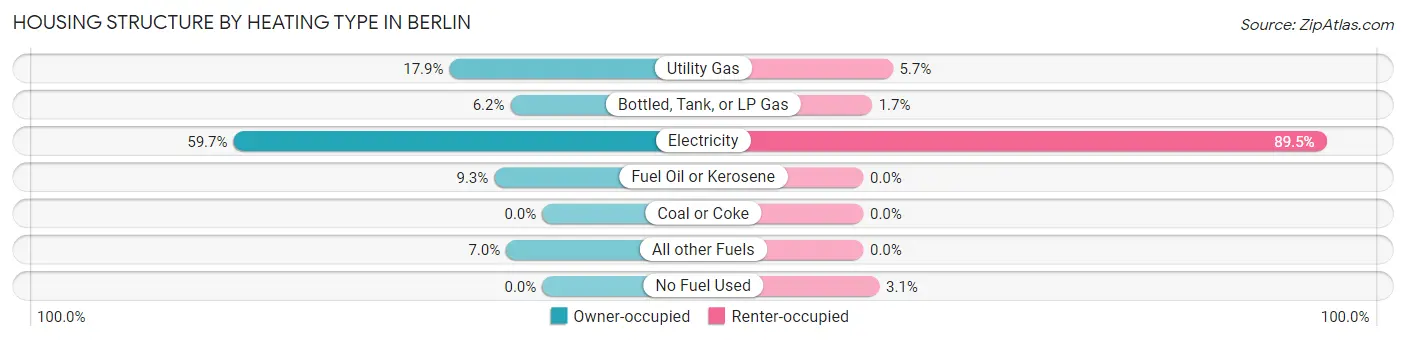
| Heating Type | Owner-occupied | Renter-occupied |
| Utility Gas | 178 (17.9%) | 44 (5.7%) |
| Bottled, Tank, or LP Gas | 61 (6.1%) | 13 (1.7%) |
| Electricity | 592 (59.7%) | 693 (89.5%) |
| Fuel Oil or Kerosene | 92 (9.3%) | 0 (0.0%) |
| Coal or Coke | 0 (0.0%) | 0 (0.0%) |
| All other Fuels | 69 (7.0%) | 0 (0.0%) |
| No Fuel Used | 0 (0.0%) | 24 (3.1%) |
| Total | 992 (100.0%) | 774 (100.0%) |
Household Vehicle Usage in Berlin
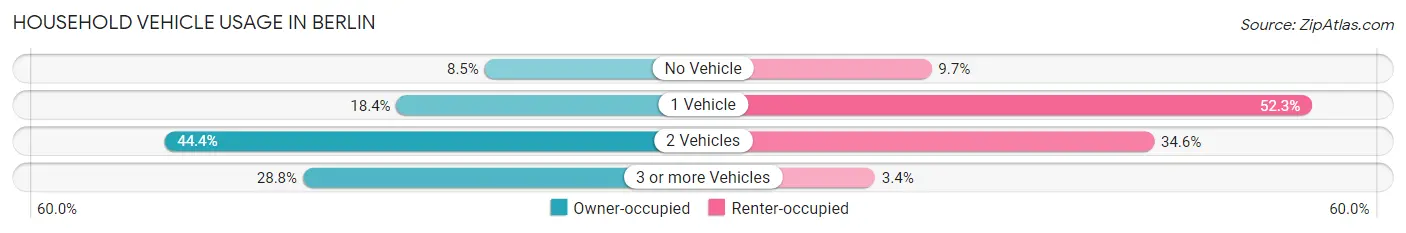
| Vehicles per Household | Owner-occupied | Renter-occupied |
| No Vehicle | 84 (8.5%) | 75 (9.7%) |
| 1 Vehicle | 182 (18.3%) | 405 (52.3%) |
| 2 Vehicles | 440 (44.4%) | 268 (34.6%) |
| 3 or more Vehicles | 286 (28.8%) | 26 (3.4%) |
| Total | 992 (100.0%) | 774 (100.0%) |
Real Estate & Mortgages in Berlin
Real Estate and Mortgage Overview in Berlin
| Characteristic | Without Mortgage | With Mortgage |
| Housing Units | 238 | 754 |
| Median Property Value | $380,000 | $286,200 |
| Median Household Income | $110,272 | $240 |
| Monthly Housing Costs | $753 | $37 |
| Real Estate Taxes | $3,663 | $88 |
Property Value by Mortgage Status in Berlin
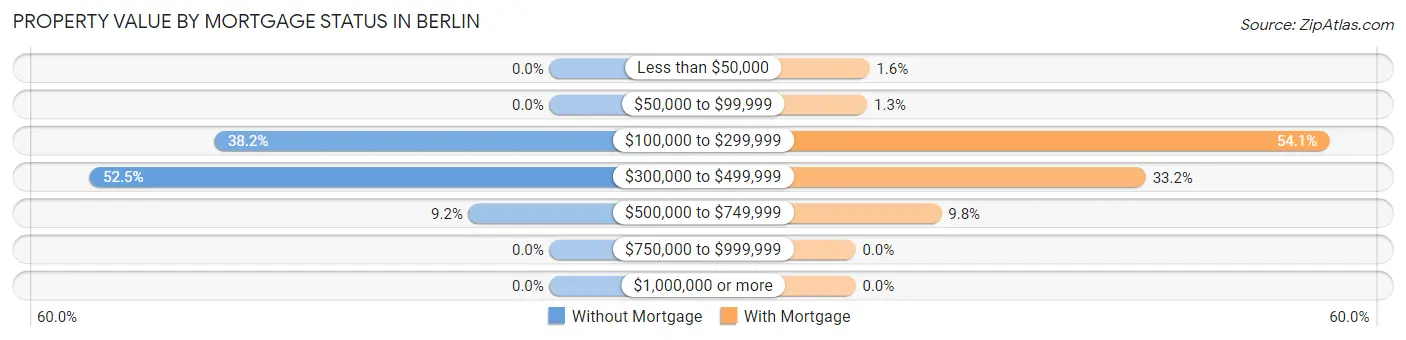
| Property Value | Without Mortgage | With Mortgage |
| Less than $50,000 | 0 (0.0%) | 12 (1.6%) |
| $50,000 to $99,999 | 0 (0.0%) | 10 (1.3%) |
| $100,000 to $299,999 | 91 (38.2%) | 408 (54.1%) |
| $300,000 to $499,999 | 125 (52.5%) | 250 (33.2%) |
| $500,000 to $749,999 | 22 (9.2%) | 74 (9.8%) |
| $750,000 to $999,999 | 0 (0.0%) | 0 (0.0%) |
| $1,000,000 or more | 0 (0.0%) | 0 (0.0%) |
| Total | 238 (100.0%) | 754 (100.0%) |
Household Income by Mortgage Status in Berlin
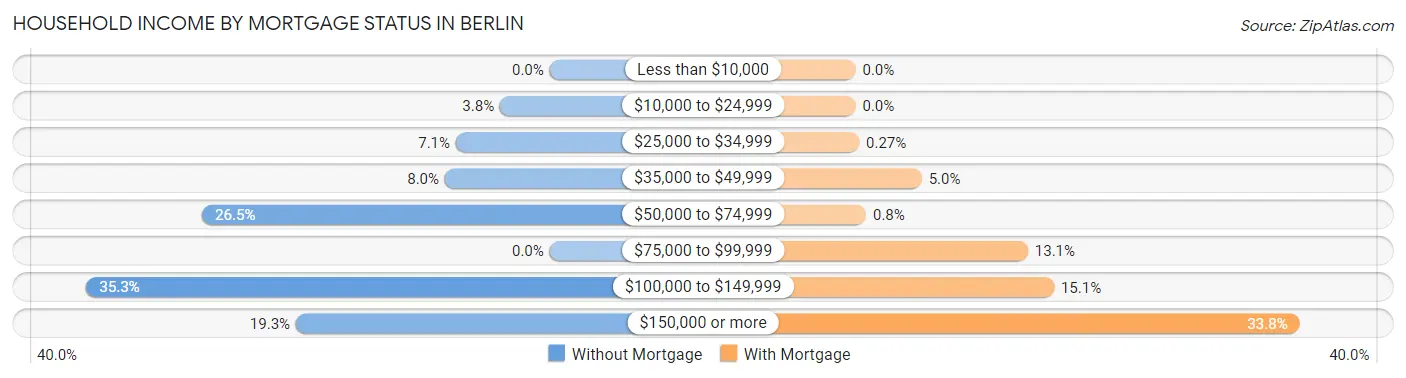
| Household Income | Without Mortgage | With Mortgage |
| Less than $10,000 | 0 (0.0%) | 0 (0.0%) |
| $10,000 to $24,999 | 9 (3.8%) | 0 (0.0%) |
| $25,000 to $34,999 | 17 (7.1%) | 2 (0.3%) |
| $35,000 to $49,999 | 19 (8.0%) | 38 (5.0%) |
| $50,000 to $74,999 | 63 (26.5%) | 6 (0.8%) |
| $75,000 to $99,999 | 0 (0.0%) | 99 (13.1%) |
| $100,000 to $149,999 | 84 (35.3%) | 114 (15.1%) |
| $150,000 or more | 46 (19.3%) | 255 (33.8%) |
| Total | 238 (100.0%) | 754 (100.0%) |
Property Value to Household Income Ratio in Berlin
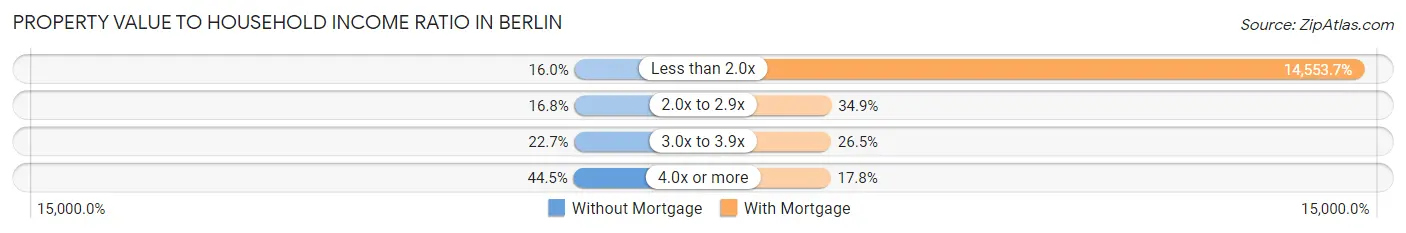
| Value-to-Income Ratio | Without Mortgage | With Mortgage |
| Less than 2.0x | 38 (16.0%) | 109,735 (14,553.7%) |
| 2.0x to 2.9x | 40 (16.8%) | 263 (34.9%) |
| 3.0x to 3.9x | 54 (22.7%) | 200 (26.5%) |
| 4.0x or more | 106 (44.5%) | 134 (17.8%) |
| Total | 238 (100.0%) | 754 (100.0%) |
Real Estate Taxes by Mortgage Status in Berlin
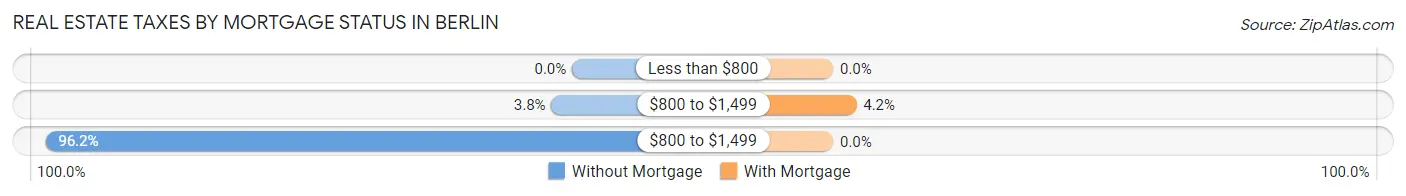
| Property Taxes | Without Mortgage | With Mortgage |
| Less than $800 | 0 (0.0%) | 0 (0.0%) |
| $800 to $1,499 | 9 (3.8%) | 32 (4.2%) |
| $800 to $1,499 | 229 (96.2%) | 0 (0.0%) |
| Total | 238 (100.0%) | 754 (100.0%) |
Health & Disability in Berlin
Health Insurance Coverage by Age in Berlin
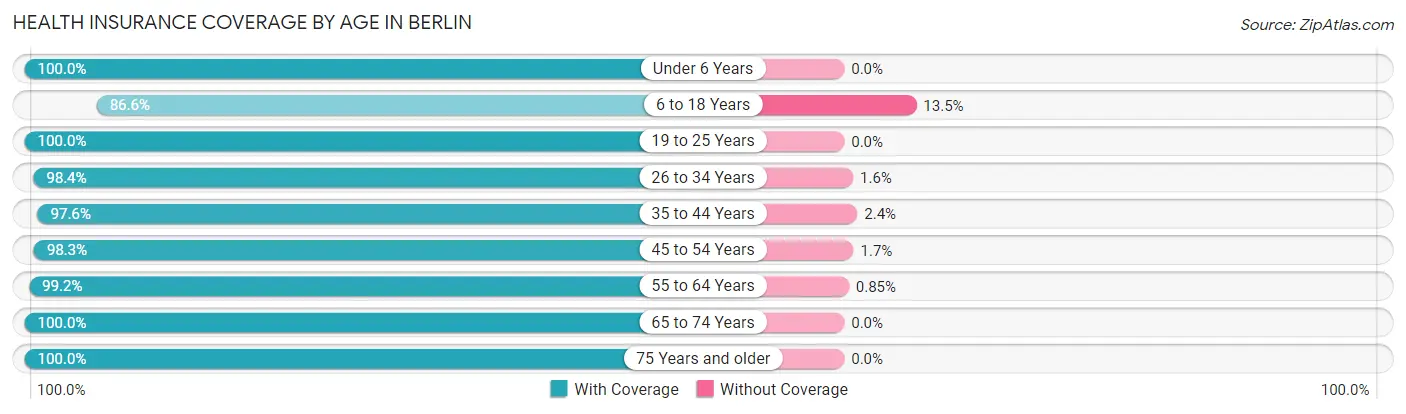
| Age Bracket | With Coverage | Without Coverage |
| Under 6 Years | 191 (100.0%) | 0 (0.0%) |
| 6 to 18 Years | 1,107 (86.6%) | 172 (13.5%) |
| 19 to 25 Years | 315 (100.0%) | 0 (0.0%) |
| 26 to 34 Years | 359 (98.4%) | 6 (1.6%) |
| 35 to 44 Years | 682 (97.6%) | 17 (2.4%) |
| 45 to 54 Years | 682 (98.3%) | 12 (1.7%) |
| 55 to 64 Years | 466 (99.2%) | 4 (0.9%) |
| 65 to 74 Years | 291 (100.0%) | 0 (0.0%) |
| 75 Years and older | 535 (100.0%) | 0 (0.0%) |
| Total | 4,628 (95.6%) | 211 (4.4%) |
Health Insurance Coverage by Citizenship Status in Berlin
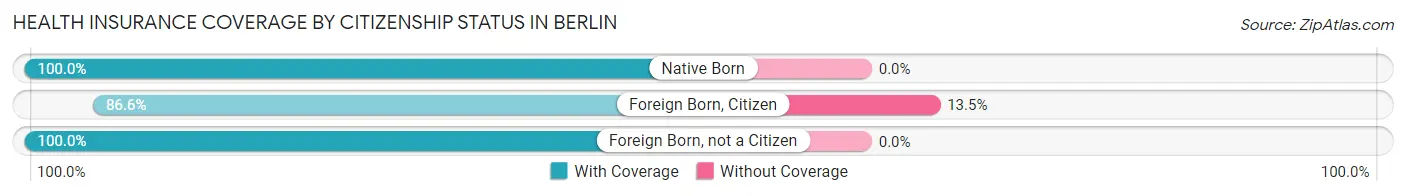
| Citizenship Status | With Coverage | Without Coverage |
| Native Born | 191 (100.0%) | 0 (0.0%) |
| Foreign Born, Citizen | 1,107 (86.6%) | 172 (13.5%) |
| Foreign Born, not a Citizen | 315 (100.0%) | 0 (0.0%) |
Health Insurance Coverage by Household Income in Berlin
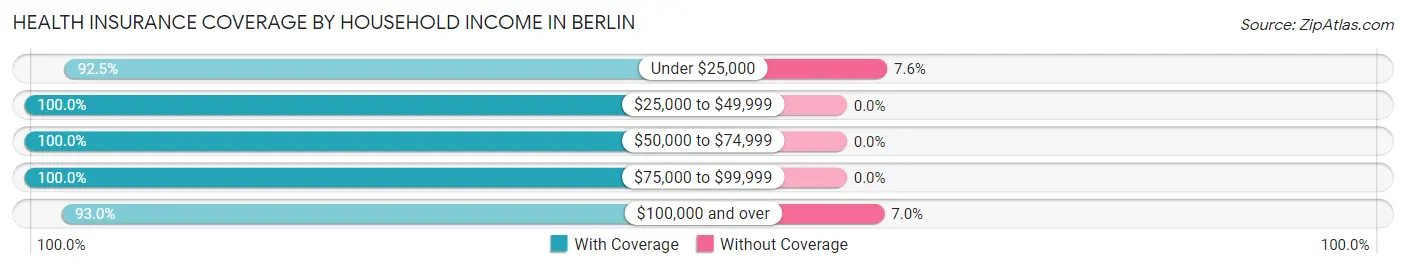
| Household Income | With Coverage | Without Coverage |
| Under $25,000 | 465 (92.4%) | 38 (7.5%) |
| $25,000 to $49,999 | 746 (100.0%) | 0 (0.0%) |
| $50,000 to $74,999 | 380 (100.0%) | 0 (0.0%) |
| $75,000 to $99,999 | 745 (100.0%) | 0 (0.0%) |
| $100,000 and over | 2,286 (93.0%) | 173 (7.0%) |
Public vs Private Health Insurance Coverage by Age in Berlin
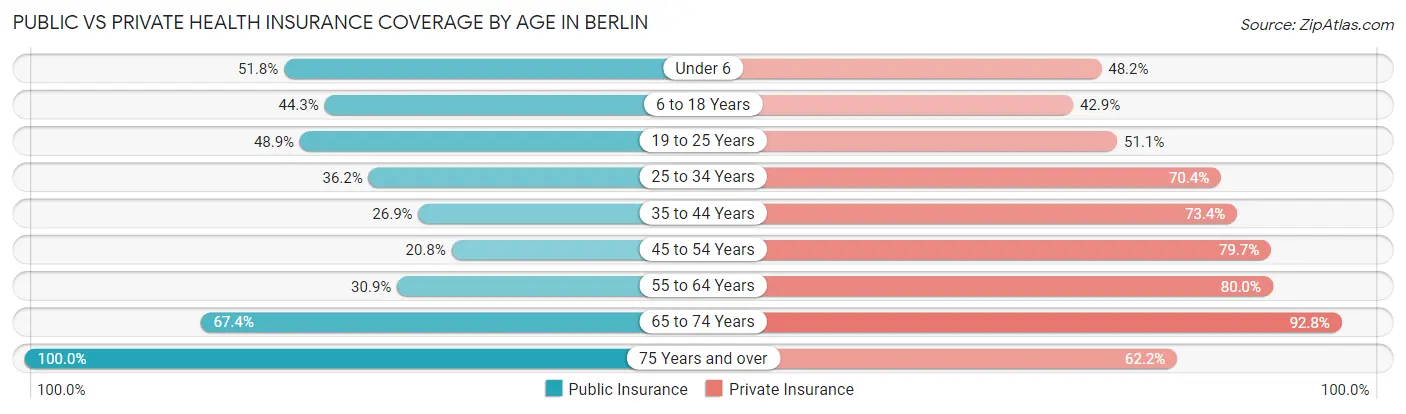
| Age Bracket | Public Insurance | Private Insurance |
| Under 6 | 99 (51.8%) | 92 (48.2%) |
| 6 to 18 Years | 567 (44.3%) | 549 (42.9%) |
| 19 to 25 Years | 154 (48.9%) | 161 (51.1%) |
| 25 to 34 Years | 132 (36.2%) | 257 (70.4%) |
| 35 to 44 Years | 188 (26.9%) | 513 (73.4%) |
| 45 to 54 Years | 144 (20.7%) | 553 (79.7%) |
| 55 to 64 Years | 145 (30.8%) | 376 (80.0%) |
| 65 to 74 Years | 196 (67.3%) | 270 (92.8%) |
| 75 Years and over | 535 (100.0%) | 333 (62.2%) |
| Total | 2,160 (44.6%) | 3,104 (64.1%) |
Disability Status by Sex by Age in Berlin
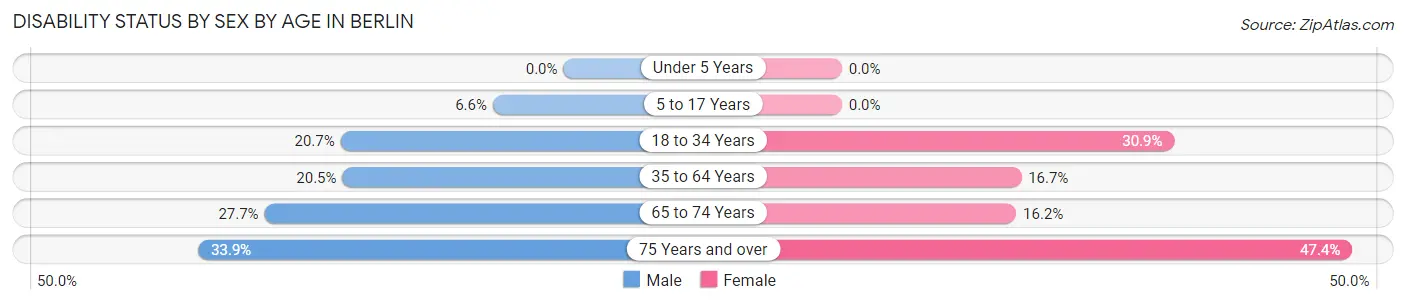
| Age Bracket | Male | Female |
| Under 5 Years | 0 (0.0%) | 0 (0.0%) |
| 5 to 17 Years | 42 (6.6%) | 0 (0.0%) |
| 18 to 34 Years | 61 (20.7%) | 129 (30.9%) |
| 35 to 64 Years | 169 (20.5%) | 173 (16.7%) |
| 65 to 74 Years | 43 (27.7%) | 22 (16.2%) |
| 75 Years and over | 59 (33.9%) | 171 (47.4%) |
Disability Class by Sex by Age in Berlin
Disability Class: Hearing Difficulty
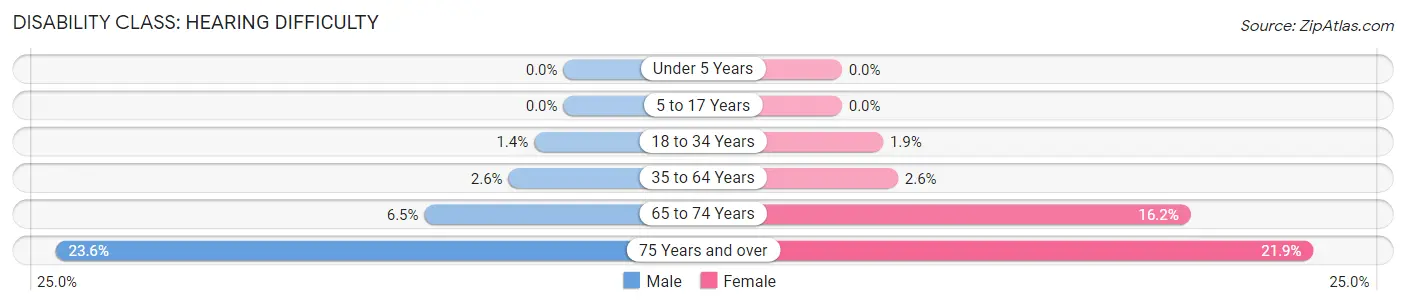
| Age Bracket | Male | Female |
| Under 5 Years | 0 (0.0%) | 0 (0.0%) |
| 5 to 17 Years | 0 (0.0%) | 0 (0.0%) |
| 18 to 34 Years | 4 (1.4%) | 8 (1.9%) |
| 35 to 64 Years | 21 (2.5%) | 27 (2.6%) |
| 65 to 74 Years | 10 (6.5%) | 22 (16.2%) |
| 75 Years and over | 41 (23.6%) | 79 (21.9%) |
Disability Class: Vision Difficulty
| Age Bracket | Male | Female |
| Under 5 Years | 0 (0.0%) | 0 (0.0%) |
| 5 to 17 Years | 0 (0.0%) | 0 (0.0%) |
| 18 to 34 Years | 0 (0.0%) | 0 (0.0%) |
| 35 to 64 Years | 42 (5.1%) | 0 (0.0%) |
| 65 to 74 Years | 0 (0.0%) | 0 (0.0%) |
| 75 Years and over | 0 (0.0%) | 0 (0.0%) |
Disability Class: Cognitive Difficulty
| Age Bracket | Male | Female |
| 5 to 17 Years | 42 (6.6%) | 0 (0.0%) |
| 18 to 34 Years | 41 (13.9%) | 129 (30.9%) |
| 35 to 64 Years | 61 (7.4%) | 90 (8.7%) |
| 65 to 74 Years | 0 (0.0%) | 13 (9.6%) |
| 75 Years and over | 0 (0.0%) | 31 (8.6%) |
Disability Class: Ambulatory Difficulty
| Age Bracket | Male | Female |
| 5 to 17 Years | 0 (0.0%) | 0 (0.0%) |
| 18 to 34 Years | 0 (0.0%) | 0 (0.0%) |
| 35 to 64 Years | 45 (5.5%) | 68 (6.5%) |
| 65 to 74 Years | 33 (21.3%) | 0 (0.0%) |
| 75 Years and over | 18 (10.3%) | 123 (34.1%) |
Disability Class: Self-Care Difficulty
| Age Bracket | Male | Female |
| 5 to 17 Years | 0 (0.0%) | 0 (0.0%) |
| 18 to 34 Years | 3 (1.0%) | 0 (0.0%) |
| 35 to 64 Years | 15 (1.8%) | 26 (2.5%) |
| 65 to 74 Years | 0 (0.0%) | 0 (0.0%) |
| 75 Years and over | 10 (5.8%) | 39 (10.8%) |
Technology Access in Berlin
Computing Device Access in Berlin
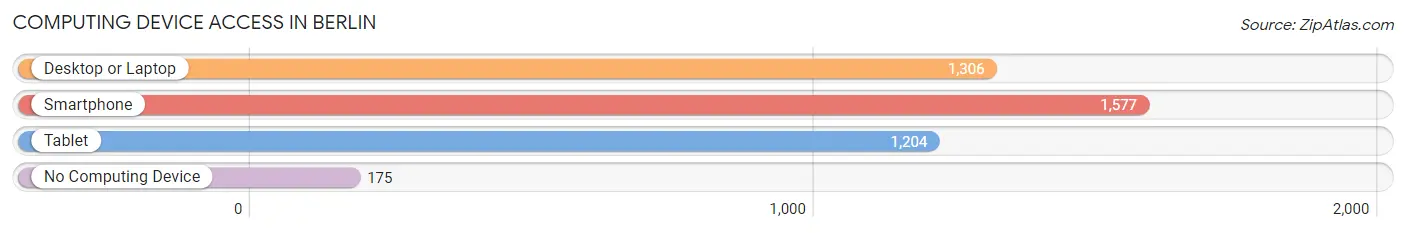
| Device Type | # Households | % Households |
| Desktop or Laptop | 1,306 | 74.0% |
| Smartphone | 1,577 | 89.3% |
| Tablet | 1,204 | 68.2% |
| No Computing Device | 175 | 9.9% |
| Total | 1,766 | 100.0% |
Internet Access in Berlin
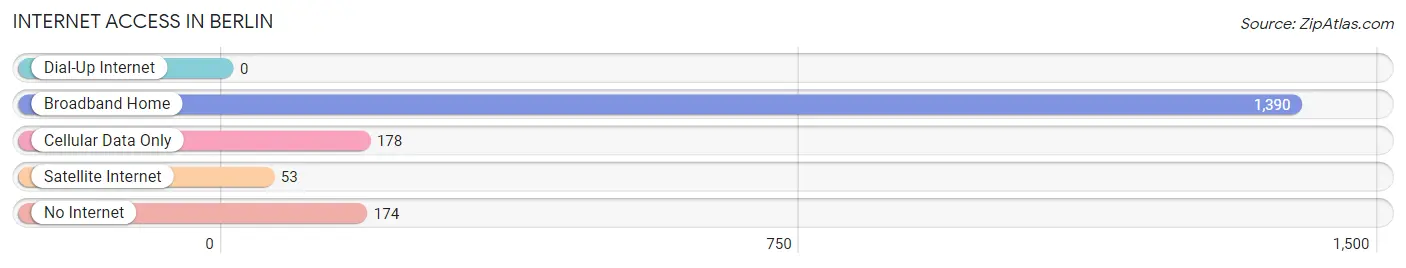
| Internet Type | # Households | % Households |
| Dial-Up Internet | 0 | 0.0% |
| Broadband Home | 1,390 | 78.7% |
| Cellular Data Only | 178 | 10.1% |
| Satellite Internet | 53 | 3.0% |
| No Internet | 174 | 9.9% |
| Total | 1,766 | 100.0% |
Berlin Summary
Berlin, Maryland is a small town located in Worcester County on the Eastern Shore of Maryland. It is situated on the Atlantic Coastal Plain, approximately 10 miles west of Ocean City and about 30 miles south of Salisbury. The town has a population of 4,485 as of the 2010 census, and is the county seat of Worcester County.
History
Berlin was founded in 1783 by a group of German settlers who had come to the area from Pennsylvania. The town was named after the German city of Berlin, and was incorporated in 1868. The town was a major center of the agricultural and seafood industries in the 19th century, and was home to several large canneries.
In the early 20th century, Berlin began to experience a period of growth and development. The town was home to several large businesses, including a furniture factory, a brickyard, and a sawmill. The town also became a popular tourist destination, and was home to several large hotels.
Geography
Berlin is located at 38°20'N 75°14'W (38.33, -75.23). The town is situated on the Atlantic Coastal Plain, and is bordered by the Pocomoke River to the east and the Assawoman Bay to the west. The town has a total area of 2.3 square miles, all of which is land.
Economy
Berlin’s economy is largely based on tourism and retail. The town is home to several large hotels, restaurants, and shops. The town is also home to several manufacturing companies, including a furniture factory, a brickyard, and a sawmill.
Demographics
As of the 2010 census, there were 4,485 people, 1,845 households, and 1,093 families residing in the town. The population density was 1,945.3 people per square mile. The racial makeup of the town was 79.2% White, 15.3% African American, 0.4% Native American, 0.7% Asian, 0.1% Pacific Islander, 2.2% from other races, and 2.1% from two or more races. Hispanic or Latino of any race were 4.2% of the population.
The median income for a household in the town was $41,944, and the median income for a family was $50,938. The per capita income for the town was $20,945. About 11.2% of families and 14.2% of the population were below the poverty line, including 19.2% of those under age 18 and 8.2% of those age 65 or over.
Common Questions
What is Per Capita Income in Berlin?
Per Capita income in Berlin is $37,113.
What is the Median Family Income in Berlin?
Median Family Income in Berlin is $97,232.
What is the Median Household income in Berlin?
Median Household Income in Berlin is $80,465.
What is Income or Wage Gap in Berlin?
Income or Wage Gap in Berlin is 28.8%.
Women in Berlin earn 71.2 cents for every dollar earned by a man.
What is Inequality or Gini Index in Berlin?
Inequality or Gini Index in Berlin is 0.45.
What is the Total Population of Berlin?
Total Population of Berlin is 5,056.
What is the Total Male Population of Berlin?
Total Male Population of Berlin is 2,242.
What is the Total Female Population of Berlin?
Total Female Population of Berlin is 2,814.
What is the Ratio of Males per 100 Females in Berlin?
There are 79.67 Males per 100 Females in Berlin.
What is the Ratio of Females per 100 Males in Berlin?
There are 125.51 Females per 100 Males in Berlin.
What is the Median Population Age in Berlin?
Median Population Age in Berlin is 40.1 Years.
What is the Average Family Size in Berlin
Average Family Size in Berlin is 3.1 People.
What is the Average Household Size in Berlin
Average Household Size in Berlin is 2.8 People.
How Large is the Labor Force in Berlin?
There are 2,436 People in the Labor Forcein in Berlin.
What is the Percentage of People in the Labor Force in Berlin?
63.3% of People are in the Labor Force in Berlin.
What is the Unemployment Rate in Berlin?
Unemployment Rate in Berlin is 2.8%.