Bishopville, MD Map & Demographics
Bishopville Map
Bishopville Overview
$27,919
PER CAPITA INCOME
$73,274
AVG FAMILY INCOME
$73,690
AVG HOUSEHOLD INCOME
5.4%
WAGE / INCOME GAP [ % ]
94.6¢/ $1
WAGE / INCOME GAP [ $ ]
0.25
INEQUALITY / GINI INDEX
548
TOTAL POPULATION
199
MALE POPULATION
349
FEMALE POPULATION
57.02
MALES / 100 FEMALES
175.38
FEMALES / 100 MALES
42.3
MEDIAN AGE
3.2
AVG FAMILY SIZE
3.1
AVG HOUSEHOLD SIZE
285
LABOR FORCE [ PEOPLE ]
69.5%
PERCENT IN LABOR FORCE
Bishopville Zip Codes
Income in Bishopville
Income Overview in Bishopville
Per Capita Income in Bishopville is $27,919, while median incomes of families and households are $73,274 and $73,690 respectively.
| Characteristic | Number | Measure |
| Per Capita Income | 548 | $27,919 |
| Median Family Income | 165 | $73,274 |
| Mean Family Income | 165 | $83,016 |
| Median Household Income | 174 | $73,690 |
| Mean Household Income | 174 | $88,591 |
| Income Deficit | 165 | $0 |
| Wage / Income Gap (%) | 548 | 5.41% |
| Wage / Income Gap ($) | 548 | 94.59¢ per $1 |
| Gini / Inequality Index | 548 | 0.25 |
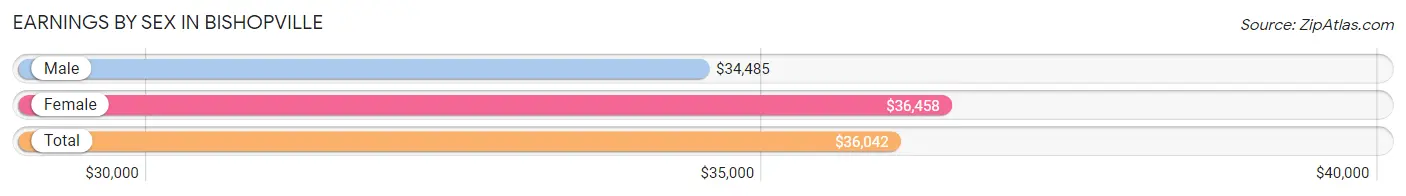
Earnings by Sex in Bishopville
Average Earnings in Bishopville are $36,042, $34,485 for men and $36,458 for women, a difference of 5.4%.
| Sex | Number | Average Earnings |
| Male | 128 (44.9%) | $34,485 |
| Female | 157 (55.1%) | $36,458 |
| Total | 285 (100.0%) | $36,042 |
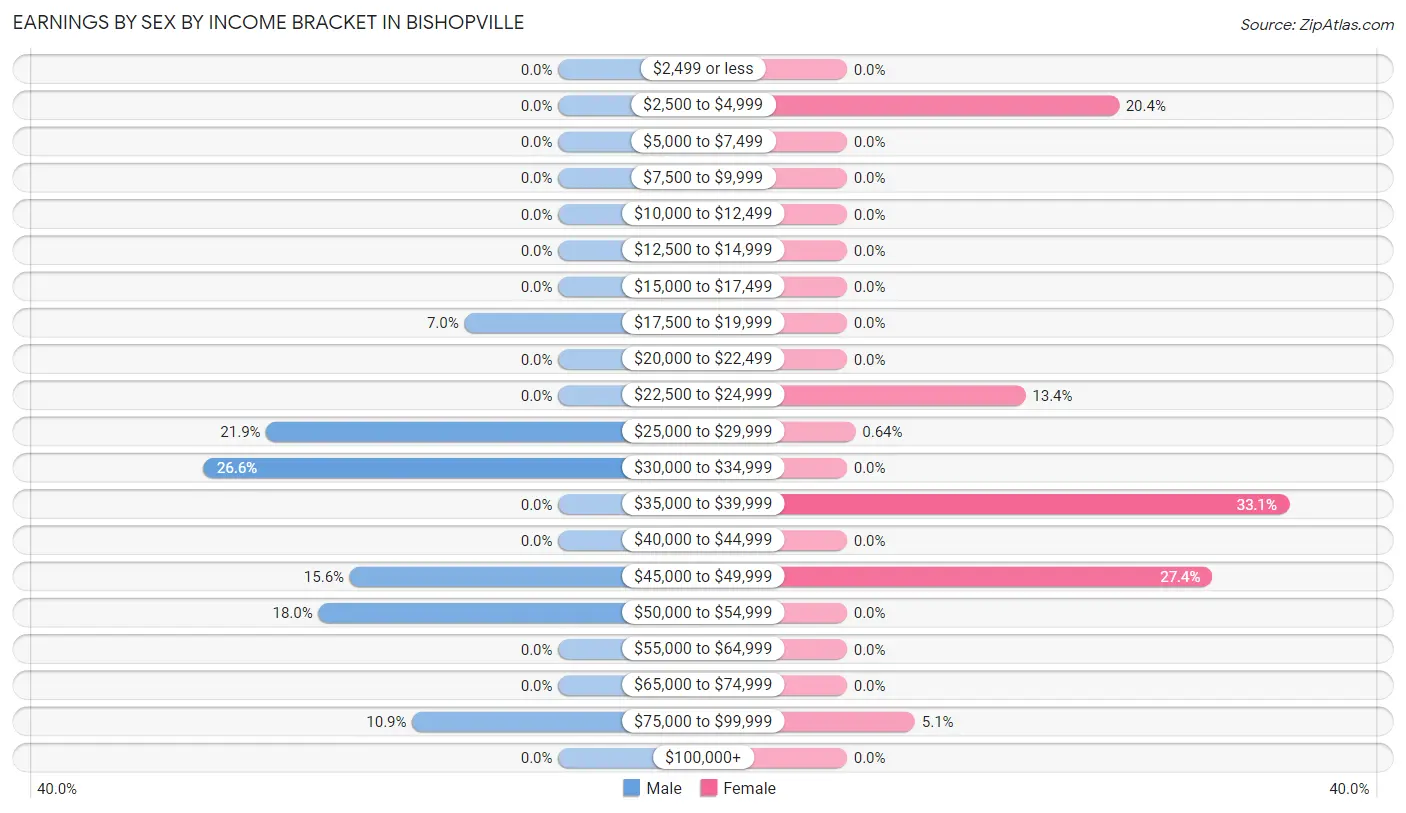
Earnings by Sex by Income Bracket in Bishopville
The most common earnings brackets in Bishopville are $30,000 to $34,999 for men (34 | 26.6%) and $35,000 to $39,999 for women (52 | 33.1%).
| Income | Male | Female |
| $2,499 or less | 0 (0.0%) | 0 (0.0%) |
| $2,500 to $4,999 | 0 (0.0%) | 32 (20.4%) |
| $5,000 to $7,499 | 0 (0.0%) | 0 (0.0%) |
| $7,500 to $9,999 | 0 (0.0%) | 0 (0.0%) |
| $10,000 to $12,499 | 0 (0.0%) | 0 (0.0%) |
| $12,500 to $14,999 | 0 (0.0%) | 0 (0.0%) |
| $15,000 to $17,499 | 0 (0.0%) | 0 (0.0%) |
| $17,500 to $19,999 | 9 (7.0%) | 0 (0.0%) |
| $20,000 to $22,499 | 0 (0.0%) | 0 (0.0%) |
| $22,500 to $24,999 | 0 (0.0%) | 21 (13.4%) |
| $25,000 to $29,999 | 28 (21.9%) | 1 (0.6%) |
| $30,000 to $34,999 | 34 (26.6%) | 0 (0.0%) |
| $35,000 to $39,999 | 0 (0.0%) | 52 (33.1%) |
| $40,000 to $44,999 | 0 (0.0%) | 0 (0.0%) |
| $45,000 to $49,999 | 20 (15.6%) | 43 (27.4%) |
| $50,000 to $54,999 | 23 (18.0%) | 0 (0.0%) |
| $55,000 to $64,999 | 0 (0.0%) | 0 (0.0%) |
| $65,000 to $74,999 | 0 (0.0%) | 0 (0.0%) |
| $75,000 to $99,999 | 14 (10.9%) | 8 (5.1%) |
| $100,000+ | 0 (0.0%) | 0 (0.0%) |
| Total | 128 (100.0%) | 157 (100.0%) |
Earnings by Sex by Educational Attainment in Bishopville
| Educational Attainment | Male Income | Female Income |
| Less than High School | - | - |
| High School Diploma | - | - |
| College or Associate's Degree | - | - |
| Bachelor's Degree | - | - |
| Graduate Degree | - | - |
| Total | $34,485 | $36,458 |
Family Income in Bishopville
Family Income Brackets in Bishopville
According to the Bishopville family income data, there are 91 families falling into the $50,000 to $74,999 income range, which is the most common income bracket and makes up 55.1% of all families.
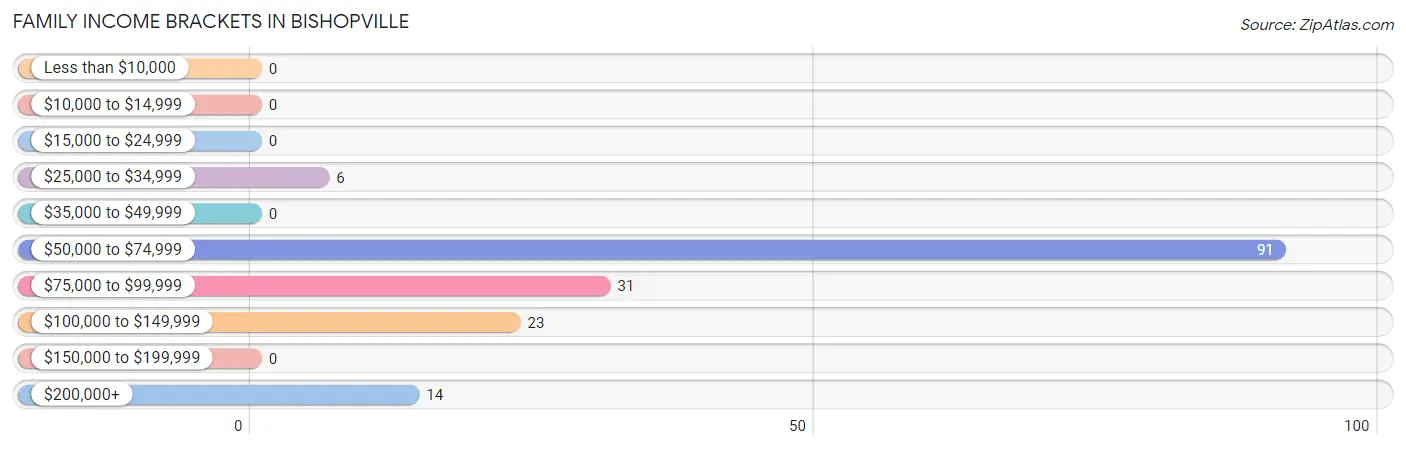
| Income Bracket | # Families | % Families |
| Less than $10,000 | 0 | 0.0% |
| $10,000 to $14,999 | 0 | 0.0% |
| $15,000 to $24,999 | 0 | 0.0% |
| $25,000 to $34,999 | 6 | 3.6% |
| $35,000 to $49,999 | 0 | 0.0% |
| $50,000 to $74,999 | 91 | 55.2% |
| $75,000 to $99,999 | 31 | 18.8% |
| $100,000 to $149,999 | 23 | 13.9% |
| $150,000 to $199,999 | 0 | 0.0% |
| $200,000+ | 14 | 8.5% |
Family Income by Famaliy Size in Bishopville
2-person families (76 | 46.1%) account for the highest median family income in Bishopville with $60,000 per family, while 2-person families (76 | 46.1%) have the highest median income of $30,000 per family member.
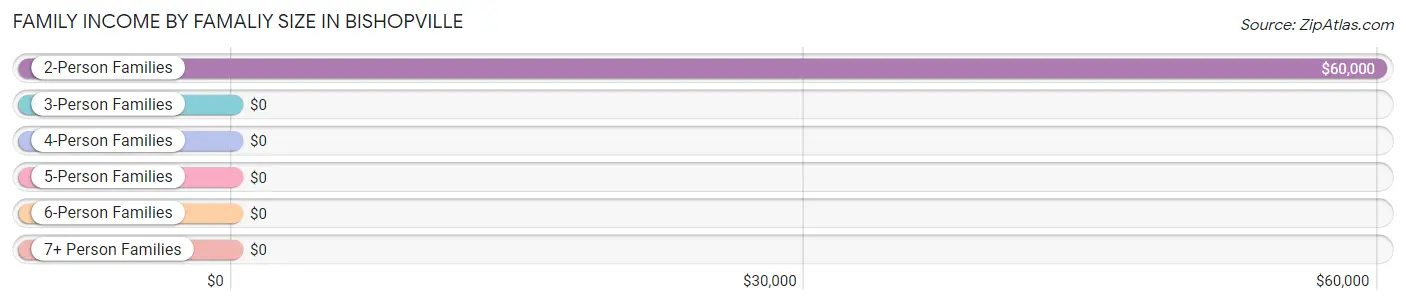
| Income Bracket | # Families | Median Income |
| 2-Person Families | 76 (46.1%) | $60,000 |
| 3-Person Families | 31 (18.8%) | $0 |
| 4-Person Families | 37 (22.4%) | $0 |
| 5-Person Families | 0 (0.0%) | $0 |
| 6-Person Families | 21 (12.7%) | $0 |
| 7+ Person Families | 0 (0.0%) | $0 |
| Total | 165 (100.0%) | $73,274 |
Family Income by Number of Earners in Bishopville
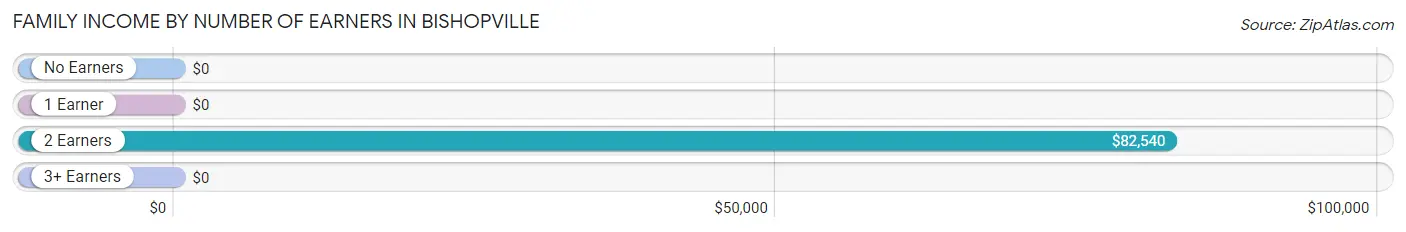
| Number of Earners | # Families | Median Income |
| No Earners | 44 (26.7%) | $0 |
| 1 Earner | 0 (0.0%) | $0 |
| 2 Earners | 107 (64.8%) | $82,540 |
| 3+ Earners | 14 (8.5%) | $0 |
| Total | 165 (100.0%) | $73,274 |
Household Income in Bishopville
Household Income Brackets in Bishopville
With 91 households falling in the category, the $50,000 to $74,999 income range is the most frequent in Bishopville, accounting for 52.3% of all households.
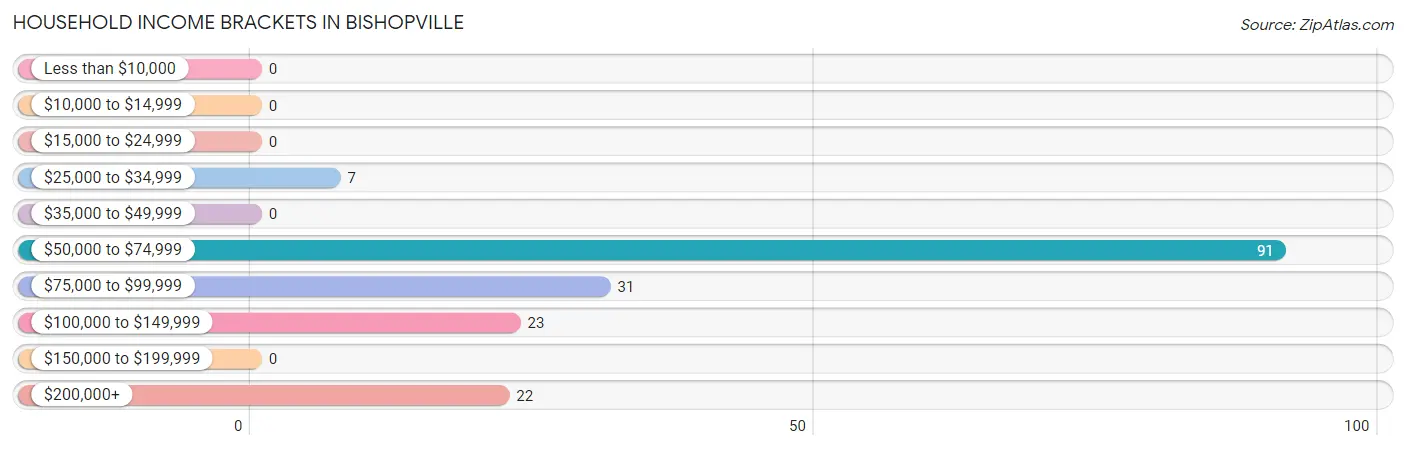
| Income Bracket | # Households | % Households |
| Less than $10,000 | 0 | 0.0% |
| $10,000 to $14,999 | 0 | 0.0% |
| $15,000 to $24,999 | 0 | 0.0% |
| $25,000 to $34,999 | 7 | 4.0% |
| $35,000 to $49,999 | 0 | 0.0% |
| $50,000 to $74,999 | 91 | 52.3% |
| $75,000 to $99,999 | 31 | 17.8% |
| $100,000 to $149,999 | 23 | 13.2% |
| $150,000 to $199,999 | 0 | 0.0% |
| $200,000+ | 22 | 12.6% |
Household Income by Householder Age in Bishopville
| Income Bracket | # Households | Median Income |
| 15 to 24 Years | 0 (0.0%) | $0 |
| 25 to 44 Years | 21 (12.1%) | $0 |
| 45 to 64 Years | 63 (36.2%) | $0 |
| 65+ Years | 90 (51.7%) | $0 |
| Total | 174 (100.0%) | $73,690 |
Poverty in Bishopville
Income Below Poverty by Sex and Age in Bishopville
| Age Bracket | Male | Female |
| Under 5 Years | 0 (0.0%) | 0 (0.0%) |
| 5 Years | 0 (0.0%) | 0 (0.0%) |
| 6 to 11 Years | 0 (0.0%) | 0 (0.0%) |
| 12 to 14 Years | 0 (0.0%) | 0 (0.0%) |
| 15 Years | 0 (0.0%) | 0 (0.0%) |
| 16 and 17 Years | 0 (0.0%) | 0 (0.0%) |
| 18 to 24 Years | 0 (0.0%) | 0 (0.0%) |
| 25 to 34 Years | 0 (0.0%) | 0 (0.0%) |
| 35 to 44 Years | 0 (0.0%) | 0 (0.0%) |
| 45 to 54 Years | 0 (0.0%) | 0 (0.0%) |
| 55 to 64 Years | 0 (0.0%) | 0 (0.0%) |
| 65 to 74 Years | 0 (0.0%) | 0 (0.0%) |
| 75 Years and over | 0 (0.0%) | 0 (0.0%) |
| Total | 0 (0.0%) | 0 (0.0%) |
Income Above Poverty by Sex and Age in Bishopville
According to the poverty statistics in Bishopville, males aged 6 to 11 years and females aged under 5 years are the age groups that are most secure financially, with 100.0% of males and 100.0% of females in these age groups living above the poverty line.
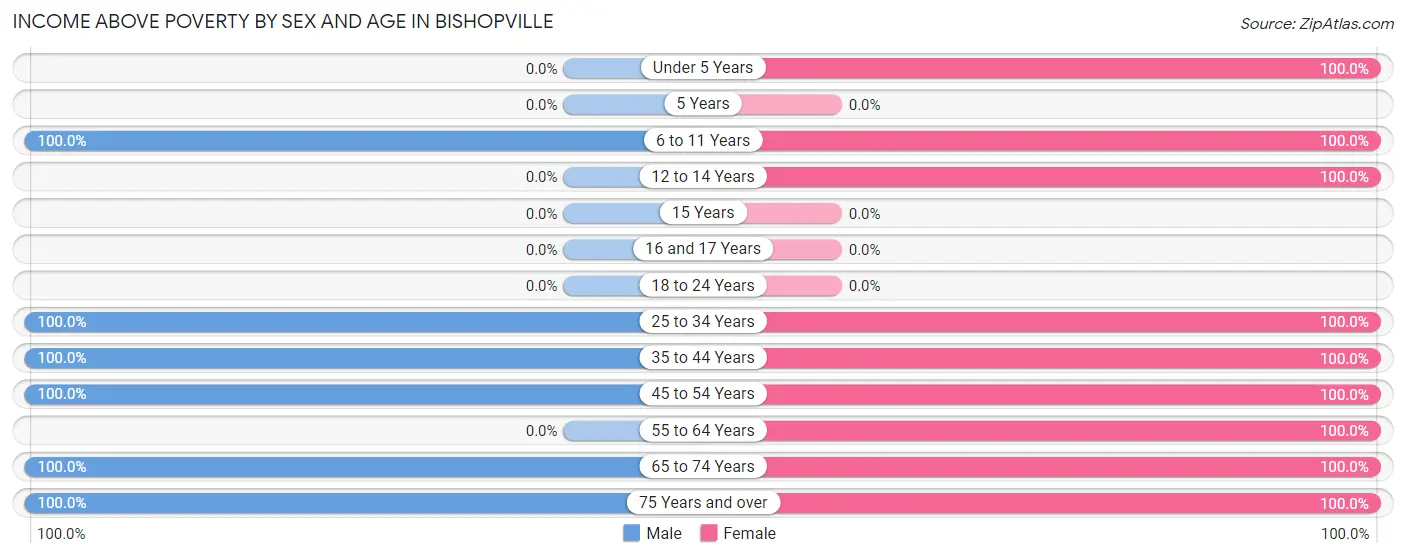
| Age Bracket | Male | Female |
| Under 5 Years | 0 (0.0%) | 54 (100.0%) |
| 5 Years | 0 (0.0%) | 0 (0.0%) |
| 6 to 11 Years | 26 (100.0%) | 25 (100.0%) |
| 12 to 14 Years | 0 (0.0%) | 33 (100.0%) |
| 15 Years | 0 (0.0%) | 0 (0.0%) |
| 16 and 17 Years | 0 (0.0%) | 0 (0.0%) |
| 18 to 24 Years | 0 (0.0%) | 0 (0.0%) |
| 25 to 34 Years | 29 (100.0%) | 73 (100.0%) |
| 35 to 44 Years | 28 (100.0%) | 18 (100.0%) |
| 45 to 54 Years | 34 (100.0%) | 31 (100.0%) |
| 55 to 64 Years | 0 (0.0%) | 63 (100.0%) |
| 65 to 74 Years | 44 (100.0%) | 15 (100.0%) |
| 75 Years and over | 38 (100.0%) | 37 (100.0%) |
| Total | 199 (100.0%) | 349 (100.0%) |
Income Below Poverty Among Married-Couple Families in Bishopville
| Children | Above Poverty | Below Poverty |
| No Children | 81 (100.0%) | 0 (0.0%) |
| 1 or 2 Children | 31 (100.0%) | 0 (0.0%) |
| 3 or 4 Children | 21 (100.0%) | 0 (0.0%) |
| 5 or more Children | 0 (0.0%) | 0 (0.0%) |
| Total | 133 (100.0%) | 0 (0.0%) |
Income Below Poverty Among Single-Parent Households in Bishopville
| Children | Single Father | Single Mother |
| No Children | 0 (0.0%) | 0 (0.0%) |
| 1 or 2 Children | 0 (0.0%) | 0 (0.0%) |
| 3 or 4 Children | 0 (0.0%) | 0 (0.0%) |
| 5 or more Children | 0 (0.0%) | 0 (0.0%) |
| Total | 0 (0.0%) | 0 (0.0%) |
Income Below Poverty Among Married-Couple vs Single-Parent Households in Bishopville
| Children | Married-Couple Families | Single-Parent Households |
| No Children | 0 (0.0%) | 0 (0.0%) |
| 1 or 2 Children | 0 (0.0%) | 0 (0.0%) |
| 3 or 4 Children | 0 (0.0%) | 0 (0.0%) |
| 5 or more Children | 0 (0.0%) | 0 (0.0%) |
| Total | 0 (0.0%) | 0 (0.0%) |
Race in Bishopville
The most populous races in Bishopville are White / Caucasian (464 | 84.7%), Black / African American (74 | 13.5%), and Hispanic or Latino (9 | 1.6%).
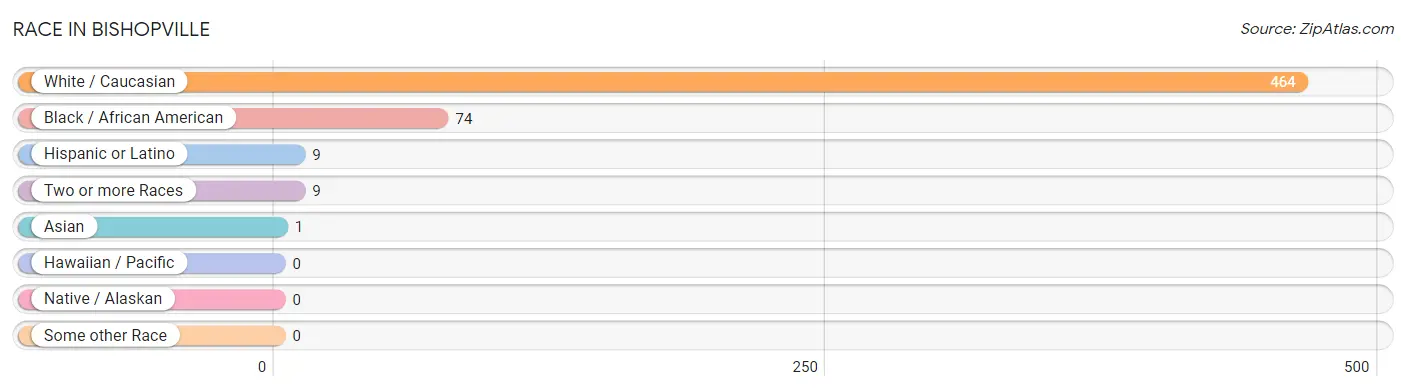
| Race | # Population | % Population |
| Asian | 1 | 0.2% |
| Black / African American | 74 | 13.5% |
| Hawaiian / Pacific | 0 | 0.0% |
| Hispanic or Latino | 9 | 1.6% |
| Native / Alaskan | 0 | 0.0% |
| White / Caucasian | 464 | 84.7% |
| Two or more Races | 9 | 1.6% |
| Some other Race | 0 | 0.0% |
| Total | 548 | 100.0% |
Ancestry in Bishopville
The most populous ancestries reported in Bishopville are English (210 | 38.3%), German (200 | 36.5%), Italian (99 | 18.1%), Irish (87 | 15.9%), and Lithuanian (38 | 6.9%), together accounting for 115.7% of all Bishopville residents.
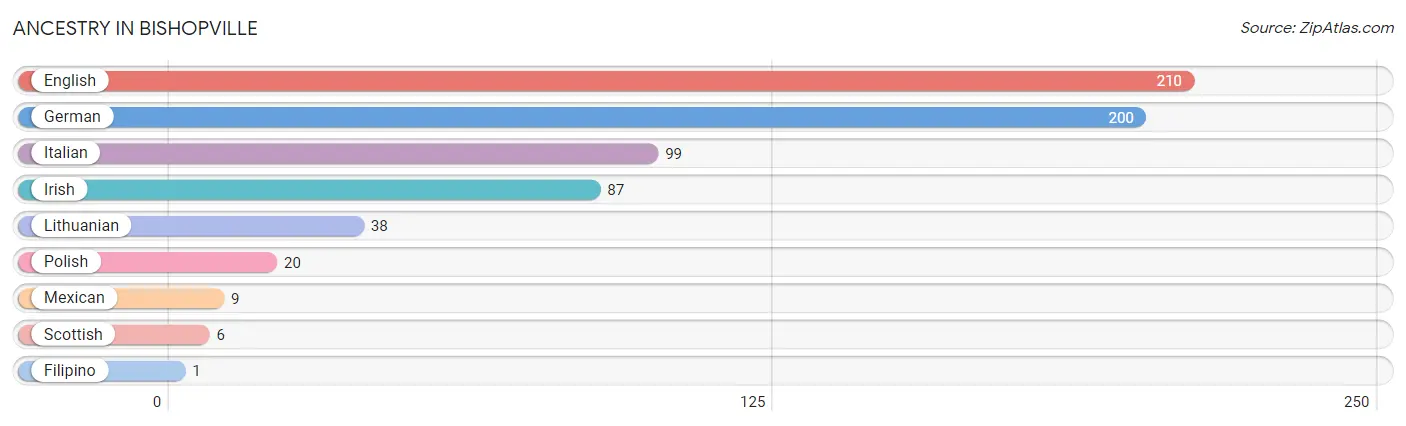
| Ancestry | # Population | % Population |
| English | 210 | 38.3% |
| Filipino | 1 | 0.2% |
| German | 200 | 36.5% |
| Irish | 87 | 15.9% |
| Italian | 99 | 18.1% |
| Lithuanian | 38 | 6.9% |
| Mexican | 9 | 1.6% |
| Polish | 20 | 3.6% |
| Scottish | 6 | 1.1% | View All 9 Rows |
Immigrants in Bishopville
The most numerous immigrant groups reported in Bishopville came from Central America (9 | 1.6%), Latin America (9 | 1.6%), Mexico (9 | 1.6%), Asia (1 | 0.2%), and China (1 | 0.2%), together accounting for 5.3% of all Bishopville residents.
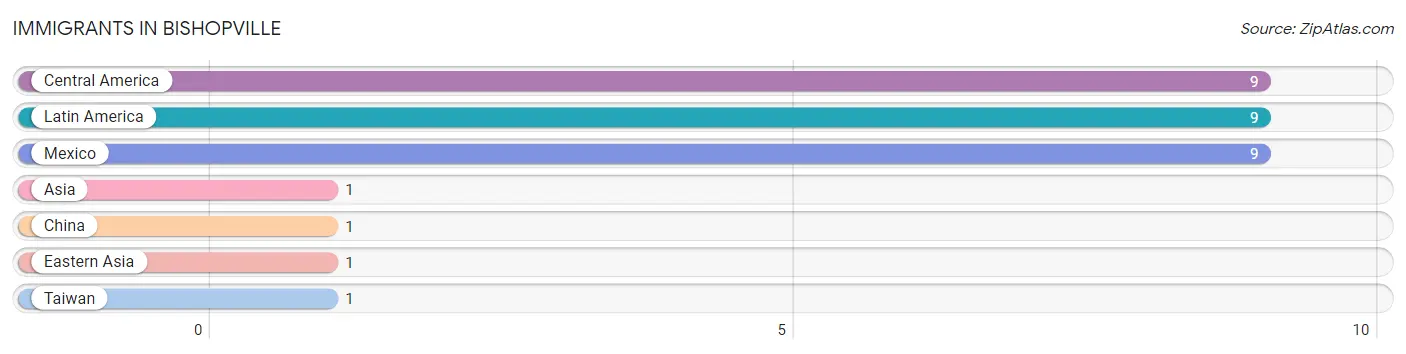
| Immigration Origin | # Population | % Population |
| Asia | 1 | 0.2% |
| Central America | 9 | 1.6% |
| China | 1 | 0.2% |
| Eastern Asia | 1 | 0.2% |
| Latin America | 9 | 1.6% |
| Mexico | 9 | 1.6% |
| Taiwan | 1 | 0.2% | View All 7 Rows |
Sex and Age in Bishopville
Sex and Age in Bishopville
The most populous age groups in Bishopville are 75 to 79 Years (38 | 19.1%) for men and Under 5 Years (54 | 15.5%) for women.
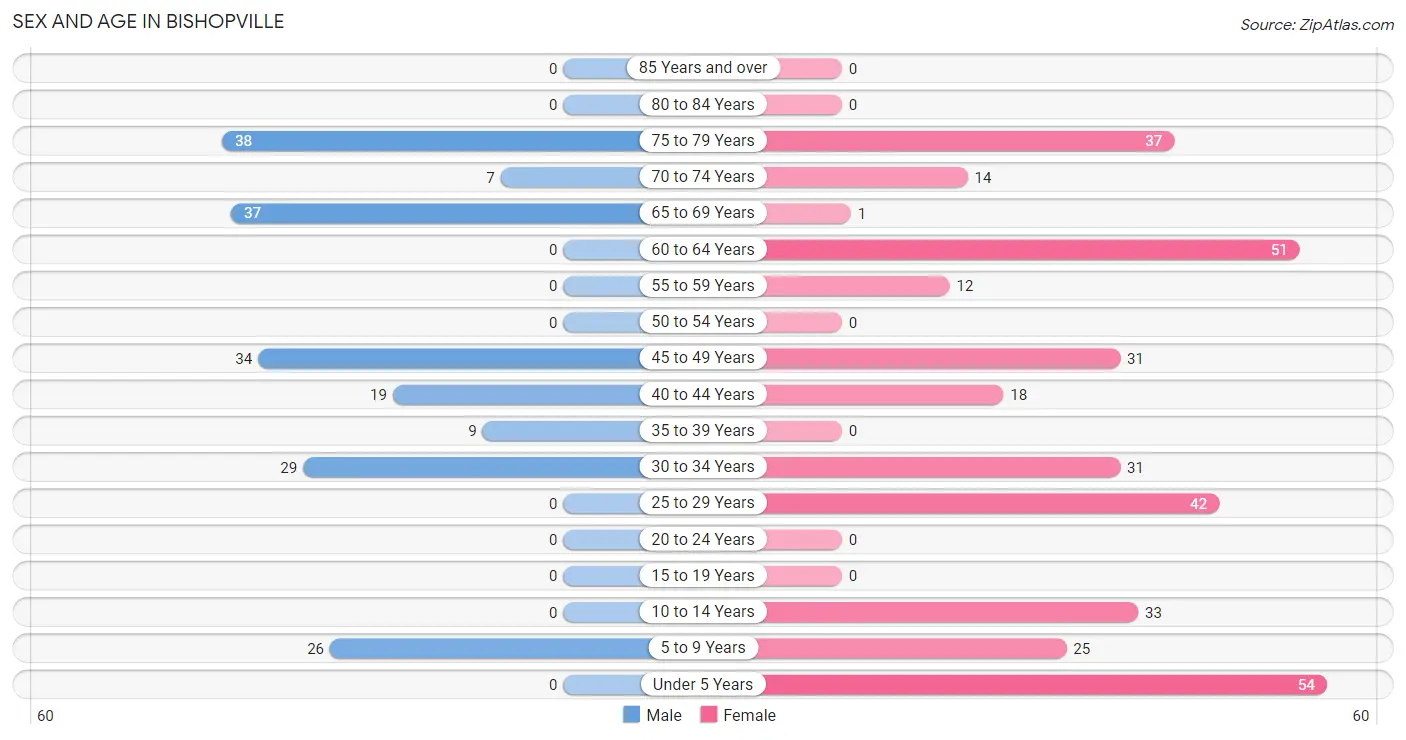
| Age Bracket | Male | Female |
| Under 5 Years | 0 (0.0%) | 54 (15.5%) |
| 5 to 9 Years | 26 (13.1%) | 25 (7.2%) |
| 10 to 14 Years | 0 (0.0%) | 33 (9.5%) |
| 15 to 19 Years | 0 (0.0%) | 0 (0.0%) |
| 20 to 24 Years | 0 (0.0%) | 0 (0.0%) |
| 25 to 29 Years | 0 (0.0%) | 42 (12.0%) |
| 30 to 34 Years | 29 (14.6%) | 31 (8.9%) |
| 35 to 39 Years | 9 (4.5%) | 0 (0.0%) |
| 40 to 44 Years | 19 (9.6%) | 18 (5.2%) |
| 45 to 49 Years | 34 (17.1%) | 31 (8.9%) |
| 50 to 54 Years | 0 (0.0%) | 0 (0.0%) |
| 55 to 59 Years | 0 (0.0%) | 12 (3.4%) |
| 60 to 64 Years | 0 (0.0%) | 51 (14.6%) |
| 65 to 69 Years | 37 (18.6%) | 1 (0.3%) |
| 70 to 74 Years | 7 (3.5%) | 14 (4.0%) |
| 75 to 79 Years | 38 (19.1%) | 37 (10.6%) |
| 80 to 84 Years | 0 (0.0%) | 0 (0.0%) |
| 85 Years and over | 0 (0.0%) | 0 (0.0%) |
| Total | 199 (100.0%) | 349 (100.0%) |
Families and Households in Bishopville
Median Family Size in Bishopville
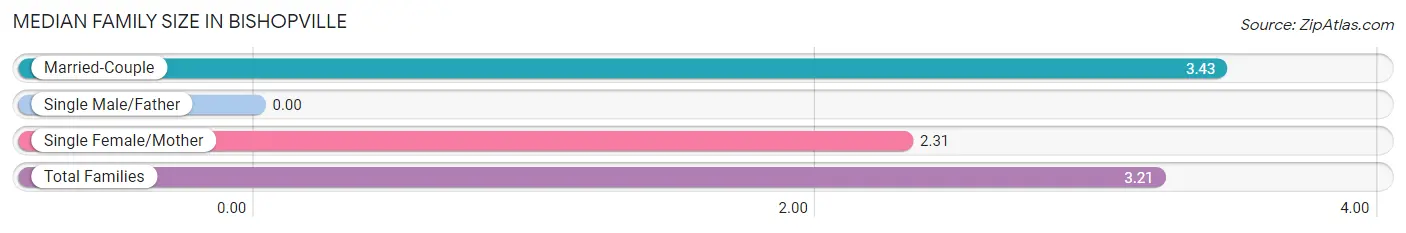
| Family Type | # Families | Family Size |
| Married-Couple | 133 (80.6%) | 3.43 |
| Single Male/Father | 0 (0.0%) | - |
| Single Female/Mother | 32 (19.4%) | 2.31 |
| Total Families | 165 (100.0%) | 3.21 |
Median Household Size in Bishopville
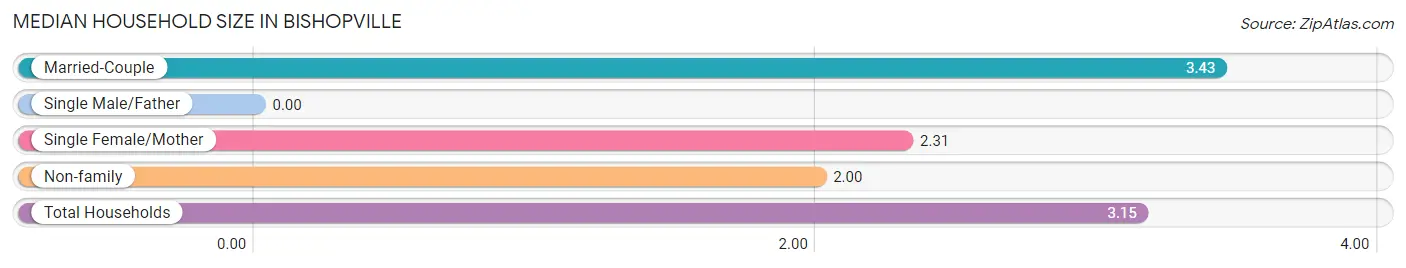
| Household Type | # Households | Household Size |
| Married-Couple | 133 (76.4%) | 3.43 |
| Single Male/Father | 0 (0.0%) | - |
| Single Female/Mother | 32 (18.4%) | 2.31 |
| Non-family | 9 (5.2%) | 2.00 |
| Total Households | 174 (100.0%) | 3.15 |
Household Size by Marriage Status in Bishopville
Out of a total of 174 households in Bishopville, 165 (94.8%) are family households, while 9 (5.2%) are nonfamily households. The most numerous type of family households are 2-person households, comprising 76, and the most common type of nonfamily households are 2-person households, comprising 8.
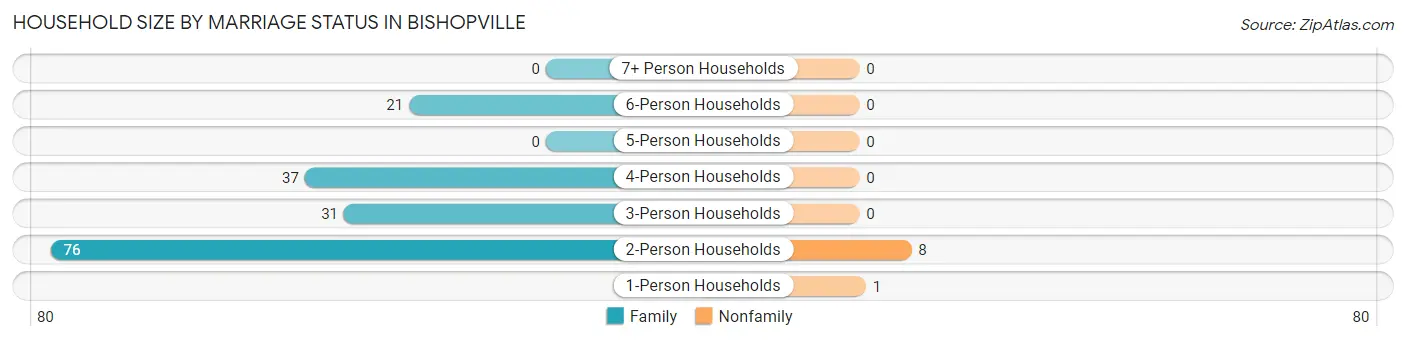
| Household Size | Family Households | Nonfamily Households |
| 1-Person Households | - | 1 (0.6%) |
| 2-Person Households | 76 (43.7%) | 8 (4.6%) |
| 3-Person Households | 31 (17.8%) | 0 (0.0%) |
| 4-Person Households | 37 (21.3%) | 0 (0.0%) |
| 5-Person Households | 0 (0.0%) | 0 (0.0%) |
| 6-Person Households | 21 (12.1%) | 0 (0.0%) |
| 7+ Person Households | 0 (0.0%) | 0 (0.0%) |
| Total | 165 (94.8%) | 9 (5.2%) |
Female Fertility in Bishopville
Fertility by Age in Bishopville
| Age Bracket | Women with Births | Births / 1,000 Women |
| 15 to 19 years | 0 (0.0%) | 0.0 |
| 20 to 34 years | 0 (0.0%) | 0.0 |
| 35 to 50 years | 0 (0.0%) | 0.0 |
| Total | 0 (0.0%) | 0.0 |
Fertility by Age by Marriage Status in Bishopville
| Age Bracket | Married | Unmarried |
| 15 to 19 years | 0 (0.0%) | 0 (0.0%) |
| 20 to 34 years | 0 (0.0%) | 0 (0.0%) |
| 35 to 50 years | 0 (0.0%) | 0 (0.0%) |
| Total | 0 (0.0%) | 0 (0.0%) |
Fertility by Education in Bishopville
| Educational Attainment | Women with Births | Births / 1,000 Women |
| Less than High School | 0 (0.0%) | 0.0 |
| High School Diploma | 0 (0.0%) | 0.0 |
| College or Associate's Degree | 0 (0.0%) | 0.0 |
| Bachelor's Degree | 0 (0.0%) | 0.0 |
| Graduate Degree | 0 (0.0%) | 0.0 |
| Total | 0 (0.0%) | 0.0 |
Fertility by Education by Marriage Status in Bishopville
| Educational Attainment | Married | Unmarried |
| Less than High School | 0 (0.0%) | 0 (0.0%) |
| High School Diploma | 0 (0.0%) | 0 (0.0%) |
| College or Associate's Degree | 0 (0.0%) | 0 (0.0%) |
| Bachelor's Degree | 0 (0.0%) | 0 (0.0%) |
| Graduate Degree | 0 (0.0%) | 0 (0.0%) |
| Total | 0 (0.0%) | 0 (0.0%) |
Employment Characteristics in Bishopville
Employment by Class of Employer in Bishopville
Among the 285 employed individuals in Bishopville, private company employees (170 | 59.7%), not-for-profit organizations (75 | 26.3%), and state government employees (31 | 10.9%) make up the most common classes of employment.
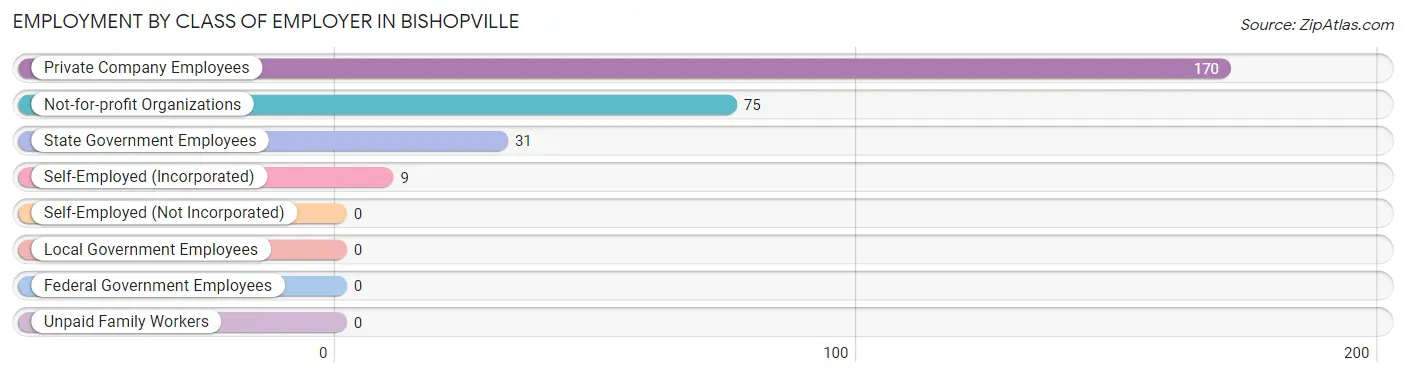
| Employer Class | # Employees | % Employees |
| Private Company Employees | 170 | 59.7% |
| Self-Employed (Incorporated) | 9 | 3.2% |
| Self-Employed (Not Incorporated) | 0 | 0.0% |
| Not-for-profit Organizations | 75 | 26.3% |
| Local Government Employees | 0 | 0.0% |
| State Government Employees | 31 | 10.9% |
| Federal Government Employees | 0 | 0.0% |
| Unpaid Family Workers | 0 | 0.0% |
| Total | 285 | 100.0% |
Employment Status by Age in Bishopville
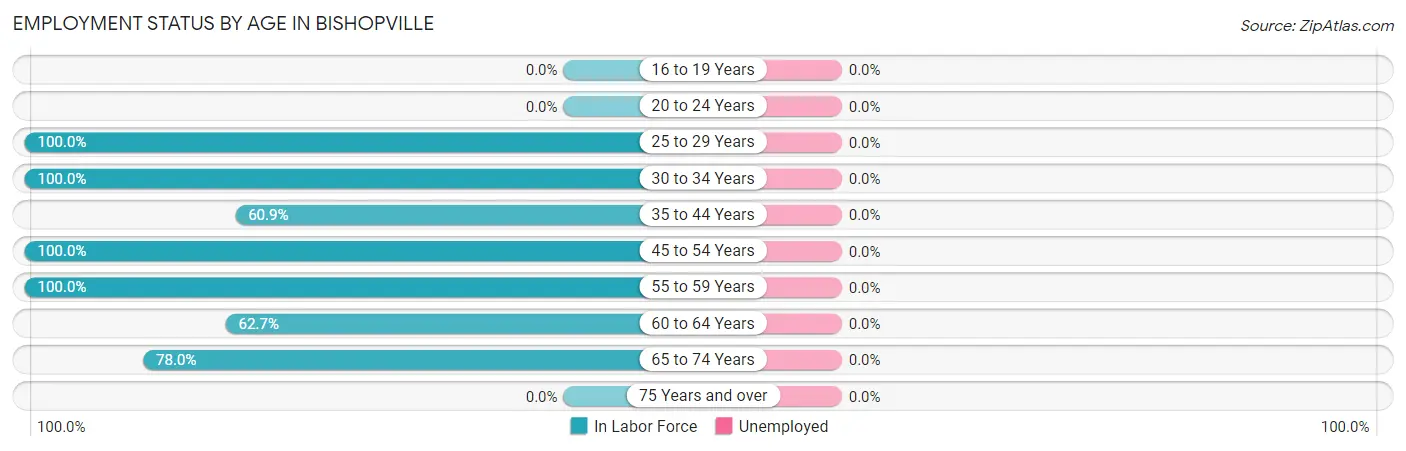
| Age Bracket | In Labor Force | Unemployed |
| 16 to 19 Years | 0 (0.0%) | 0 (0.0%) |
| 20 to 24 Years | 0 (0.0%) | 0 (0.0%) |
| 25 to 29 Years | 42 (100.0%) | 0 (0.0%) |
| 30 to 34 Years | 60 (100.0%) | 0 (0.0%) |
| 35 to 44 Years | 28 (60.9%) | 0 (0.0%) |
| 45 to 54 Years | 65 (100.0%) | 0 (0.0%) |
| 55 to 59 Years | 12 (100.0%) | 0 (0.0%) |
| 60 to 64 Years | 32 (62.7%) | 0 (0.0%) |
| 65 to 74 Years | 46 (78.0%) | 0 (0.0%) |
| 75 Years and over | 0 (0.0%) | 0 (0.0%) |
| Total | 285 (69.5%) | 0 (0.0%) |
Employment Status by Educational Attainment in Bishopville
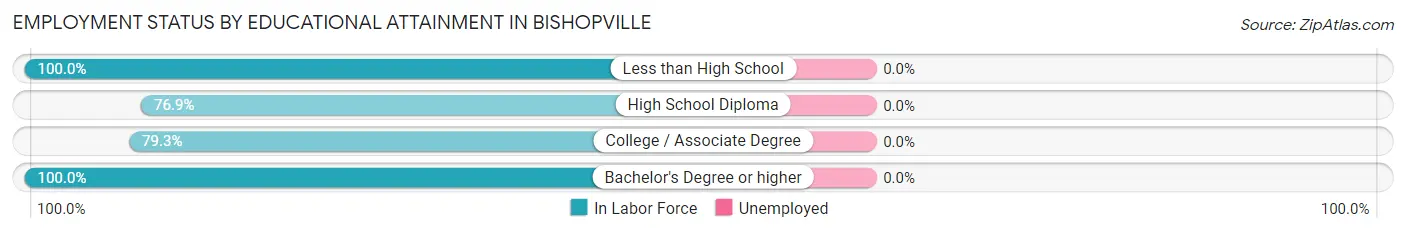
| Educational Attainment | In Labor Force | Unemployed |
| Less than High School | 85 (100.0%) | 0 (0.0%) |
| High School Diploma | 60 (76.9%) | 0 (0.0%) |
| College / Associate Degree | 73 (79.3%) | 0 (0.0%) |
| Bachelor's Degree or higher | 21 (100.0%) | 0 (0.0%) |
| Total | 239 (86.6%) | 0 (0.0%) |
Employment Occupations by Sex in Bishopville
Management, Business, Science and Arts Occupations
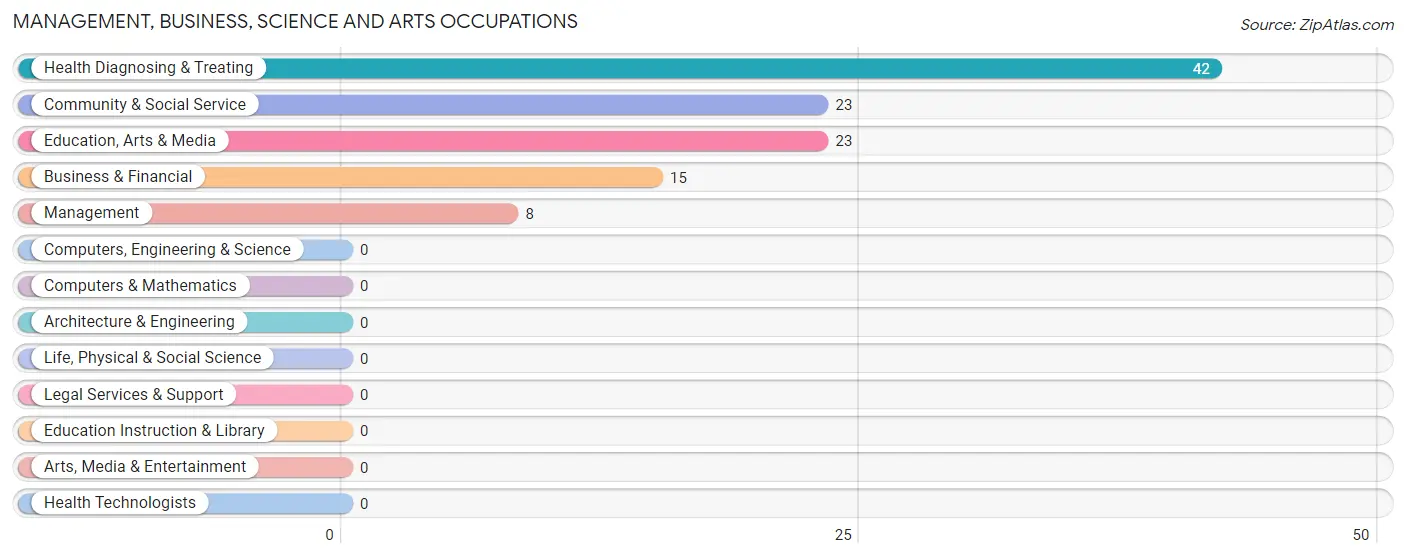
The most common Management, Business, Science and Arts occupations in Bishopville are Health Diagnosing & Treating (42 | 14.7%), Community & Social Service (23 | 8.1%), Education, Arts & Media (23 | 8.1%), Business & Financial (15 | 5.3%), and Management (8 | 2.8%).
Management, Business, Science and Arts Occupations by Sex
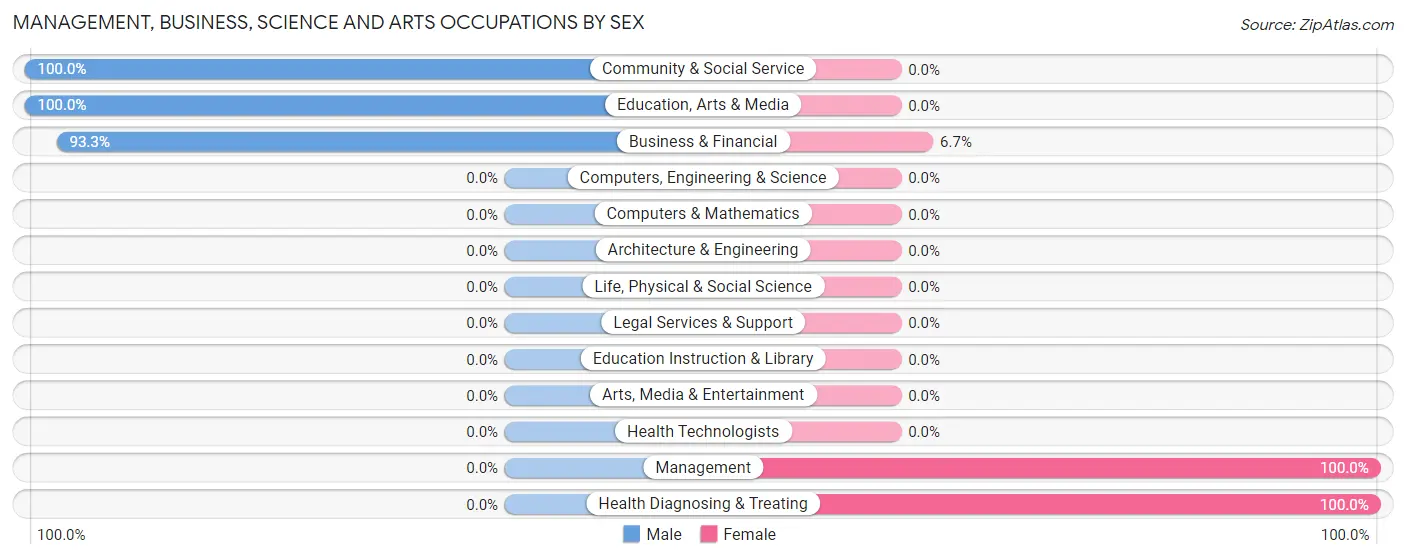
Within the Management, Business, Science and Arts occupations in Bishopville, the most male-oriented occupations are Community & Social Service (100.0%), Education, Arts & Media (100.0%), and Business & Financial (93.3%), while the most female-oriented occupations are Management (100.0%), Health Diagnosing & Treating (100.0%), and Business & Financial (6.7%).
| Occupation | Male | Female |
| Management | 0 (0.0%) | 8 (100.0%) |
| Business & Financial | 14 (93.3%) | 1 (6.7%) |
| Computers, Engineering & Science | 0 (0.0%) | 0 (0.0%) |
| Computers & Mathematics | 0 (0.0%) | 0 (0.0%) |
| Architecture & Engineering | 0 (0.0%) | 0 (0.0%) |
| Life, Physical & Social Science | 0 (0.0%) | 0 (0.0%) |
| Community & Social Service | 23 (100.0%) | 0 (0.0%) |
| Education, Arts & Media | 23 (100.0%) | 0 (0.0%) |
| Legal Services & Support | 0 (0.0%) | 0 (0.0%) |
| Education Instruction & Library | 0 (0.0%) | 0 (0.0%) |
| Arts, Media & Entertainment | 0 (0.0%) | 0 (0.0%) |
| Health Diagnosing & Treating | 0 (0.0%) | 42 (100.0%) |
| Health Technologists | 0 (0.0%) | 0 (0.0%) |
| Total (Category) | 37 (42.0%) | 51 (58.0%) |
| Total (Overall) | 128 (44.9%) | 157 (55.1%) |
Services Occupations
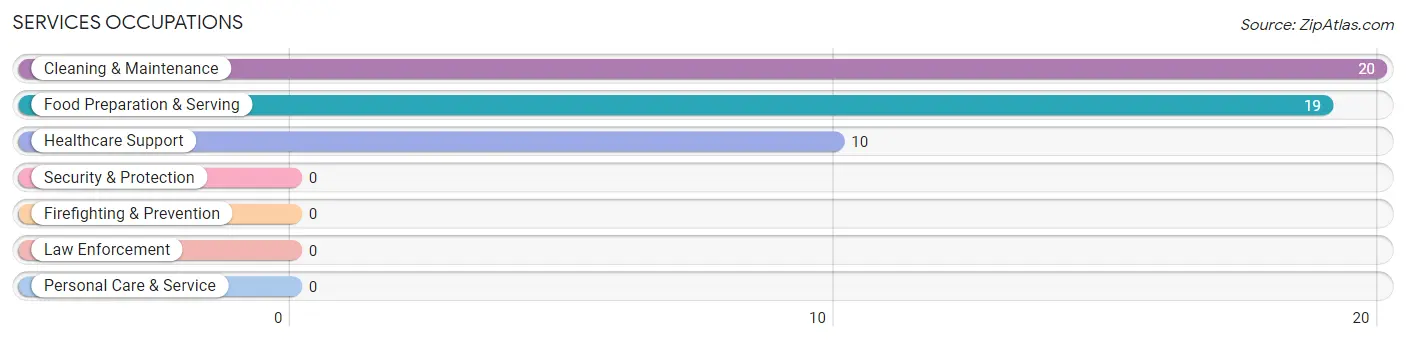
The most common Services occupations in Bishopville are Cleaning & Maintenance (20 | 7.0%), Food Preparation & Serving (19 | 6.7%), and Healthcare Support (10 | 3.5%).
Services Occupations by Sex
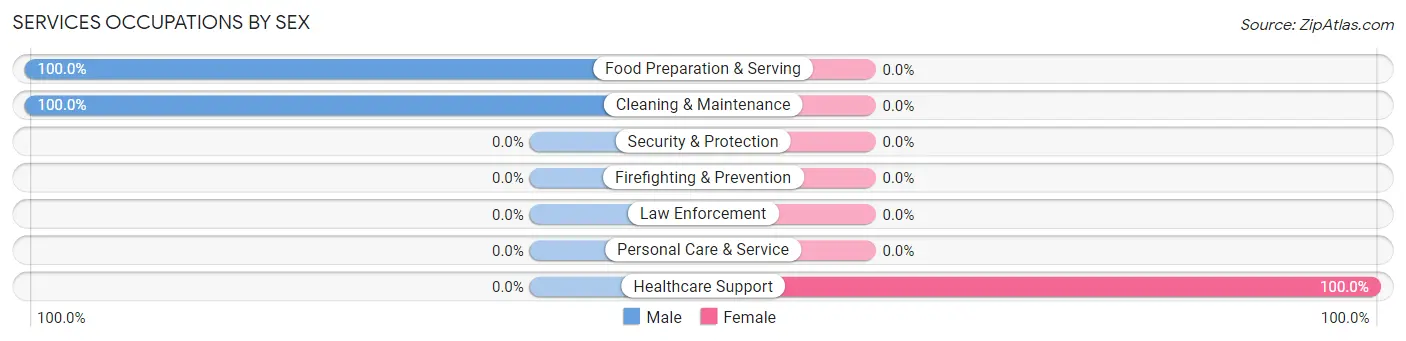
| Occupation | Male | Female |
| Healthcare Support | 0 (0.0%) | 10 (100.0%) |
| Security & Protection | 0 (0.0%) | 0 (0.0%) |
| Firefighting & Prevention | 0 (0.0%) | 0 (0.0%) |
| Law Enforcement | 0 (0.0%) | 0 (0.0%) |
| Food Preparation & Serving | 19 (100.0%) | 0 (0.0%) |
| Cleaning & Maintenance | 20 (100.0%) | 0 (0.0%) |
| Personal Care & Service | 0 (0.0%) | 0 (0.0%) |
| Total (Category) | 39 (79.6%) | 10 (20.4%) |
| Total (Overall) | 128 (44.9%) | 157 (55.1%) |
Sales and Office Occupations
The most common Sales and Office occupations in Bishopville are Office & Administration (52 | 18.2%), and Sales & Related (12 | 4.2%).

Sales and Office Occupations by Sex

| Occupation | Male | Female |
| Sales & Related | 0 (0.0%) | 12 (100.0%) |
| Office & Administration | 0 (0.0%) | 52 (100.0%) |
| Total (Category) | 0 (0.0%) | 64 (100.0%) |
| Total (Overall) | 128 (44.9%) | 157 (55.1%) |
Natural Resources, Construction and Maintenance Occupations
The most common Natural Resources, Construction and Maintenance occupations in Bishopville are Construction & Extraction (34 | 11.9%), and Installation, Maintenance & Repair (9 | 3.2%).
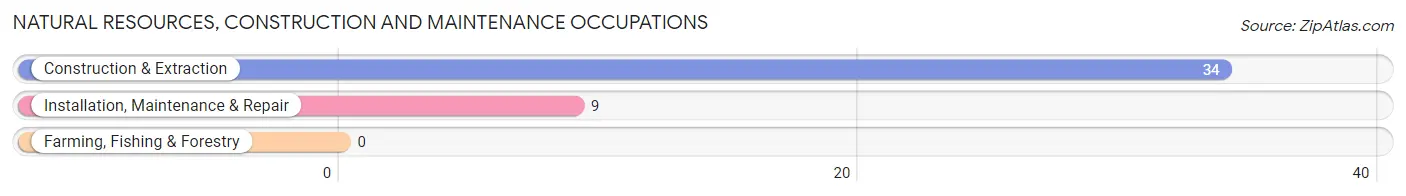
Natural Resources, Construction and Maintenance Occupations by Sex

| Occupation | Male | Female |
| Farming, Fishing & Forestry | 0 (0.0%) | 0 (0.0%) |
| Construction & Extraction | 34 (100.0%) | 0 (0.0%) |
| Installation, Maintenance & Repair | 9 (100.0%) | 0 (0.0%) |
| Total (Category) | 43 (100.0%) | 0 (0.0%) |
| Total (Overall) | 128 (44.9%) | 157 (55.1%) |
Production, Transportation and Moving Occupations
The most common Production, Transportation and Moving occupations in Bishopville are Production (32 | 11.2%), and Material Moving (9 | 3.2%).
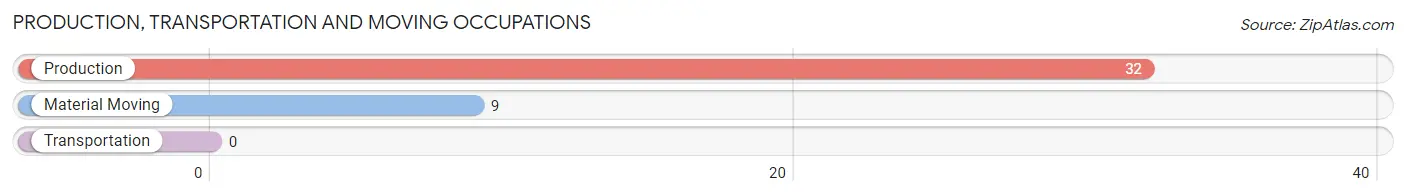
Production, Transportation and Moving Occupations by Sex
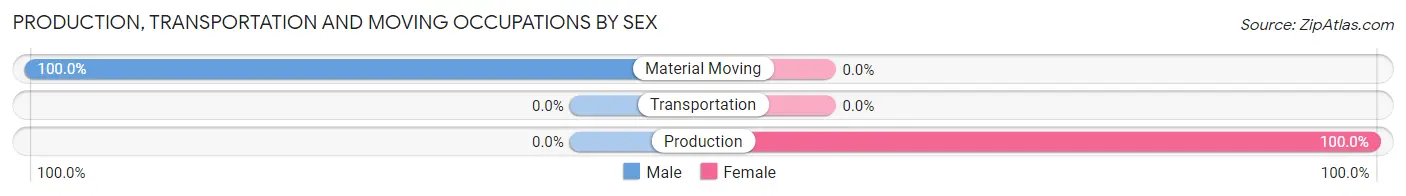
| Occupation | Male | Female |
| Production | 0 (0.0%) | 32 (100.0%) |
| Transportation | 0 (0.0%) | 0 (0.0%) |
| Material Moving | 9 (100.0%) | 0 (0.0%) |
| Total (Category) | 9 (22.0%) | 32 (78.0%) |
| Total (Overall) | 128 (44.9%) | 157 (55.1%) |
Employment Industries by Sex in Bishopville
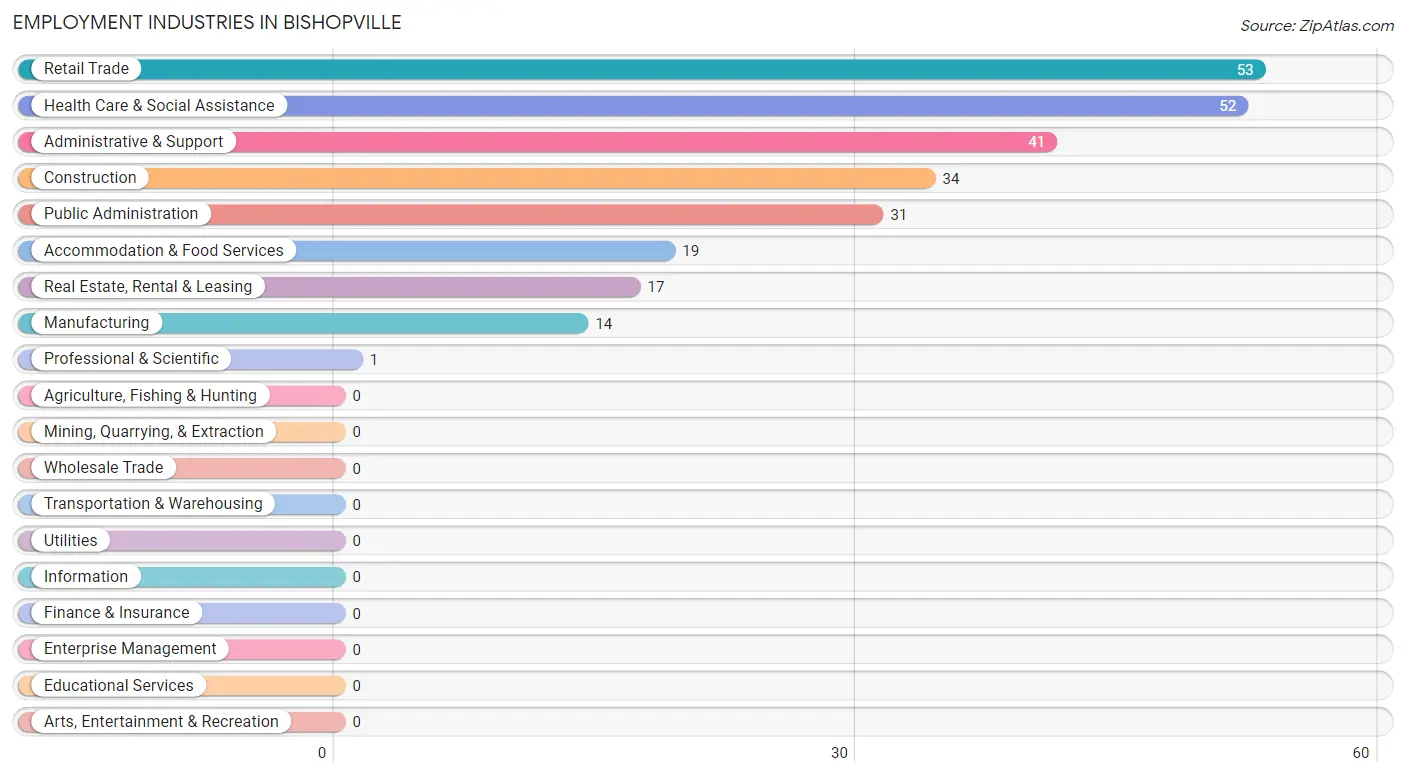
Employment Industries in Bishopville
The major employment industries in Bishopville include Retail Trade (53 | 18.6%), Health Care & Social Assistance (52 | 18.2%), Administrative & Support (41 | 14.4%), Construction (34 | 11.9%), and Public Administration (31 | 10.9%).
Employment Industries by Sex in Bishopville
The Bishopville industries that see more men than women are Construction (100.0%), Manufacturing (100.0%), and Accommodation & Food Services (100.0%), whereas the industries that tend to have a higher number of women are Professional & Scientific (100.0%), Health Care & Social Assistance (100.0%), and Public Administration (100.0%).
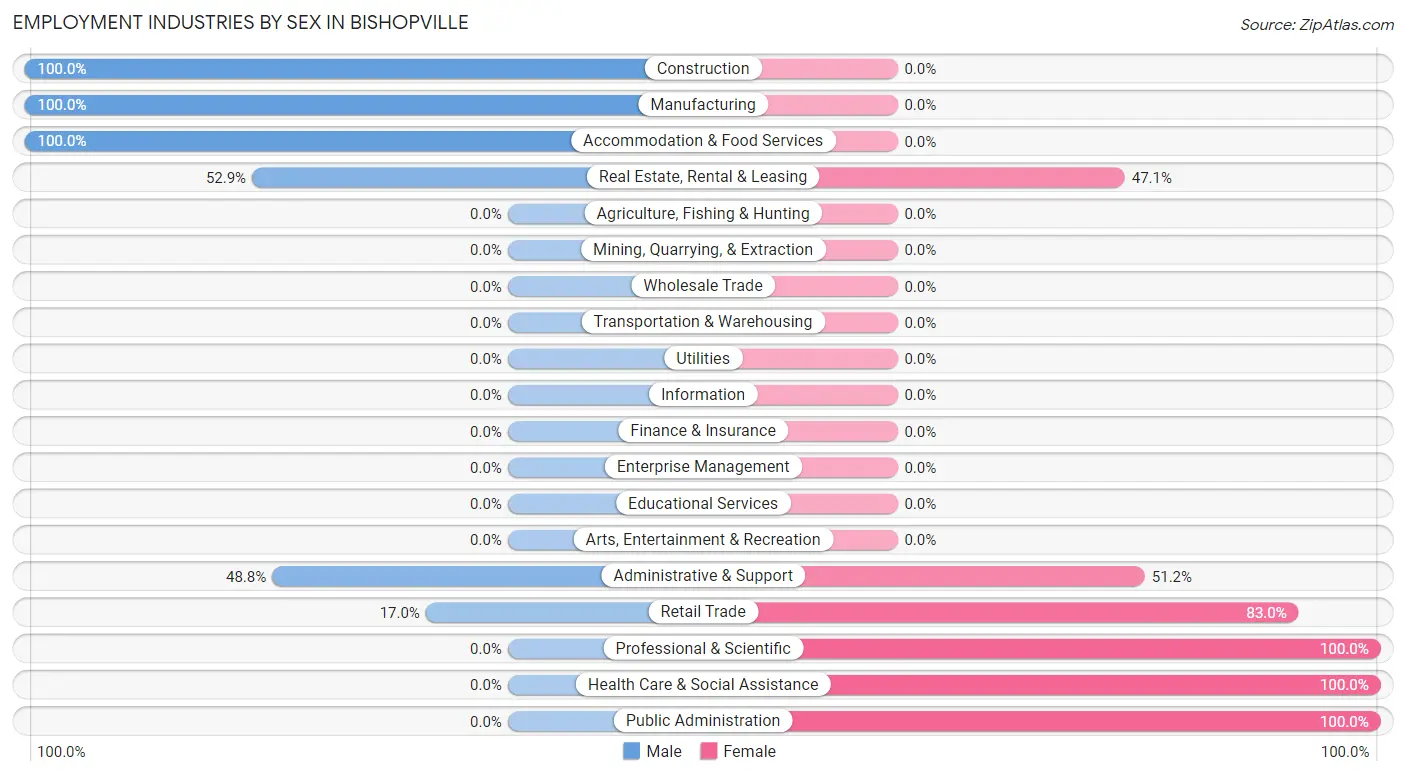
| Industry | Male | Female |
| Agriculture, Fishing & Hunting | 0 (0.0%) | 0 (0.0%) |
| Mining, Quarrying, & Extraction | 0 (0.0%) | 0 (0.0%) |
| Construction | 34 (100.0%) | 0 (0.0%) |
| Manufacturing | 14 (100.0%) | 0 (0.0%) |
| Wholesale Trade | 0 (0.0%) | 0 (0.0%) |
| Retail Trade | 9 (17.0%) | 44 (83.0%) |
| Transportation & Warehousing | 0 (0.0%) | 0 (0.0%) |
| Utilities | 0 (0.0%) | 0 (0.0%) |
| Information | 0 (0.0%) | 0 (0.0%) |
| Finance & Insurance | 0 (0.0%) | 0 (0.0%) |
| Real Estate, Rental & Leasing | 9 (52.9%) | 8 (47.1%) |
| Professional & Scientific | 0 (0.0%) | 1 (100.0%) |
| Enterprise Management | 0 (0.0%) | 0 (0.0%) |
| Administrative & Support | 20 (48.8%) | 21 (51.2%) |
| Educational Services | 0 (0.0%) | 0 (0.0%) |
| Health Care & Social Assistance | 0 (0.0%) | 52 (100.0%) |
| Arts, Entertainment & Recreation | 0 (0.0%) | 0 (0.0%) |
| Accommodation & Food Services | 19 (100.0%) | 0 (0.0%) |
| Public Administration | 0 (0.0%) | 31 (100.0%) |
| Total | 128 (44.9%) | 157 (55.1%) |
Education in Bishopville
School Enrollment in Bishopville
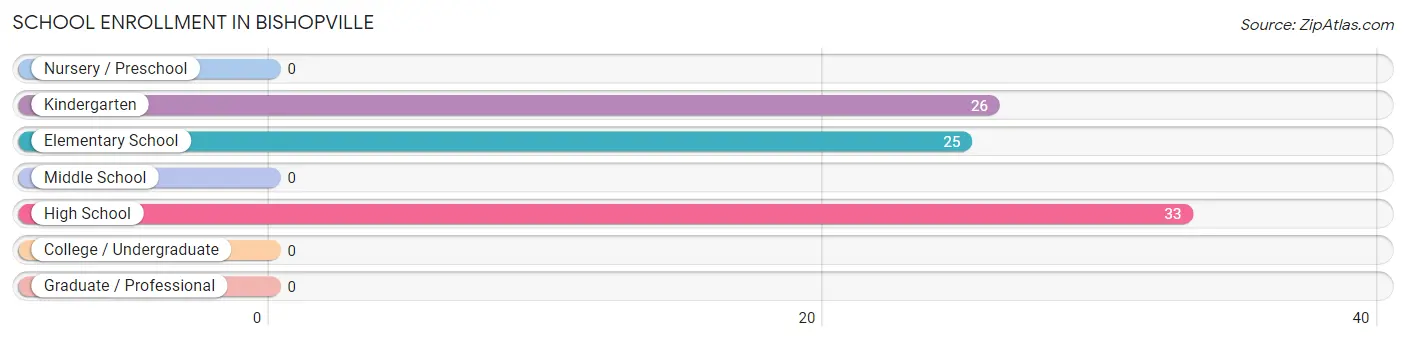
The most common levels of schooling among the 84 students in Bishopville are high school (33 | 39.3%), kindergarten (26 | 30.9%), and elementary school (25 | 29.8%).
| School Level | # Students | % Students |
| Nursery / Preschool | 0 | 0.0% |
| Kindergarten | 26 | 30.9% |
| Elementary School | 25 | 29.8% |
| Middle School | 0 | 0.0% |
| High School | 33 | 39.3% |
| College / Undergraduate | 0 | 0.0% |
| Graduate / Professional | 0 | 0.0% |
| Total | 84 | 100.0% |
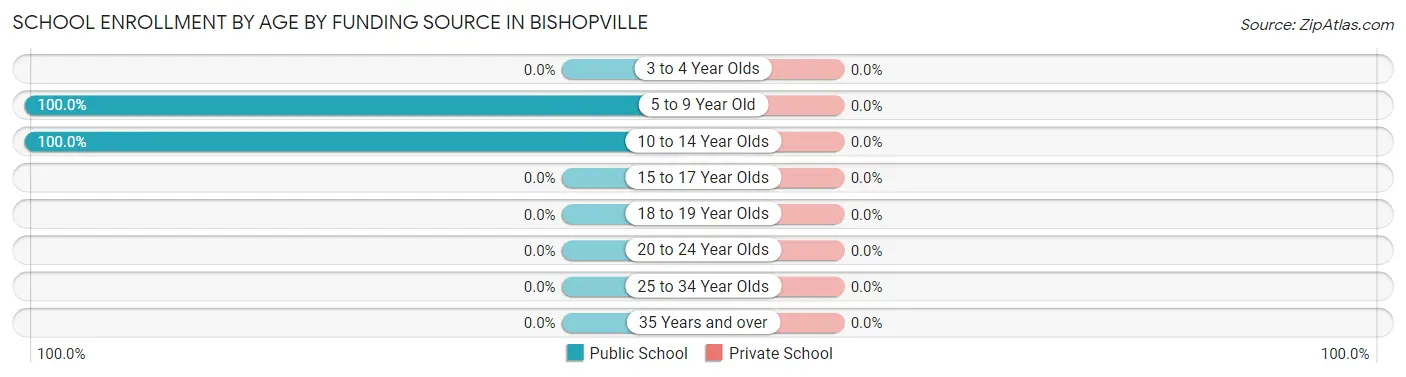
School Enrollment by Age by Funding Source in Bishopville
| Age Bracket | Public School | Private School |
| 3 to 4 Year Olds | 0 (0.0%) | 0 (0.0%) |
| 5 to 9 Year Old | 51 (100.0%) | 0 (0.0%) |
| 10 to 14 Year Olds | 33 (100.0%) | 0 (0.0%) |
| 15 to 17 Year Olds | 0 (0.0%) | 0 (0.0%) |
| 18 to 19 Year Olds | 0 (0.0%) | 0 (0.0%) |
| 20 to 24 Year Olds | 0 (0.0%) | 0 (0.0%) |
| 25 to 34 Year Olds | 0 (0.0%) | 0 (0.0%) |
| 35 Years and over | 0 (0.0%) | 0 (0.0%) |
| Total | 84 (100.0%) | 0 (0.0%) |
Educational Attainment by Field of Study in Bishopville
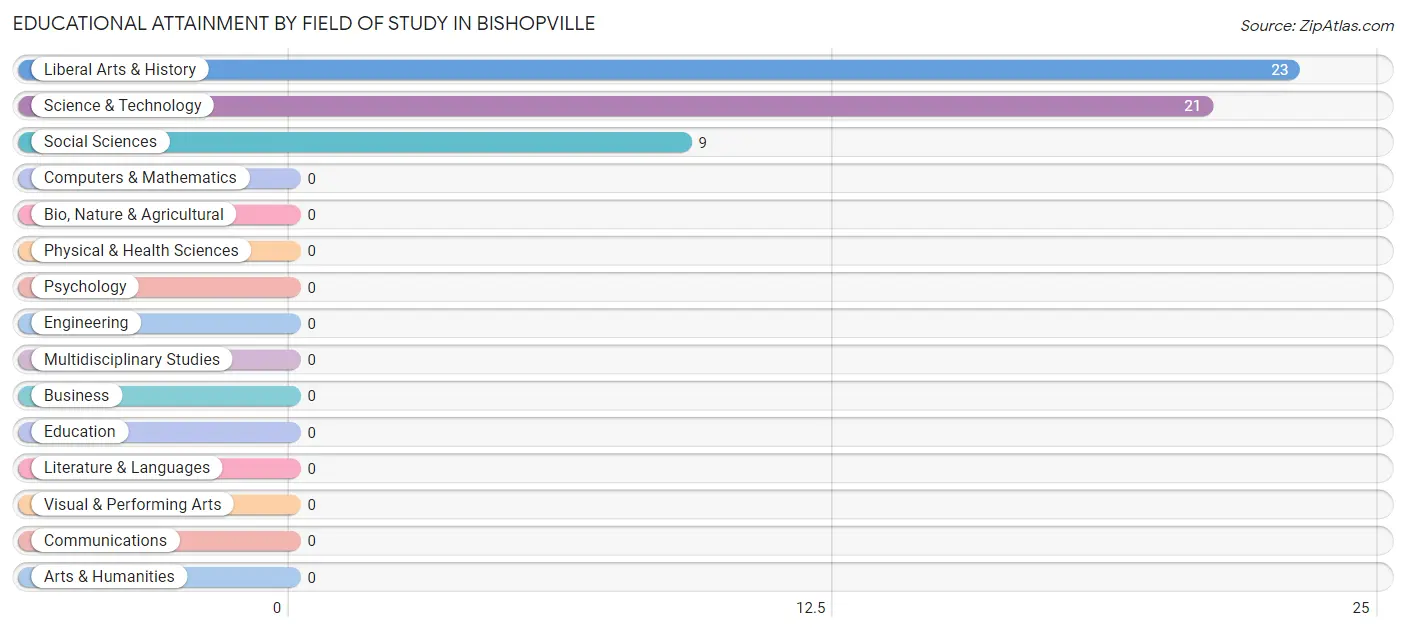
Liberal arts & history (23 | 43.4%), science & technology (21 | 39.6%), and social sciences (9 | 17.0%) are the most common fields of study among 53 individuals in Bishopville who have obtained a bachelor's degree or higher.
| Field of Study | # Graduates | % Graduates |
| Computers & Mathematics | 0 | 0.0% |
| Bio, Nature & Agricultural | 0 | 0.0% |
| Physical & Health Sciences | 0 | 0.0% |
| Psychology | 0 | 0.0% |
| Social Sciences | 9 | 17.0% |
| Engineering | 0 | 0.0% |
| Multidisciplinary Studies | 0 | 0.0% |
| Science & Technology | 21 | 39.6% |
| Business | 0 | 0.0% |
| Education | 0 | 0.0% |
| Literature & Languages | 0 | 0.0% |
| Liberal Arts & History | 23 | 43.4% |
| Visual & Performing Arts | 0 | 0.0% |
| Communications | 0 | 0.0% |
| Arts & Humanities | 0 | 0.0% |
| Total | 53 | 100.0% |
Transportation & Commute in Bishopville
Vehicle Availability by Sex in Bishopville
The most prevalent vehicle ownership categories in Bishopville are males with 2 vehicles (42, accounting for 32.8%) and females with 2 vehicles (74, making up 26.8%).
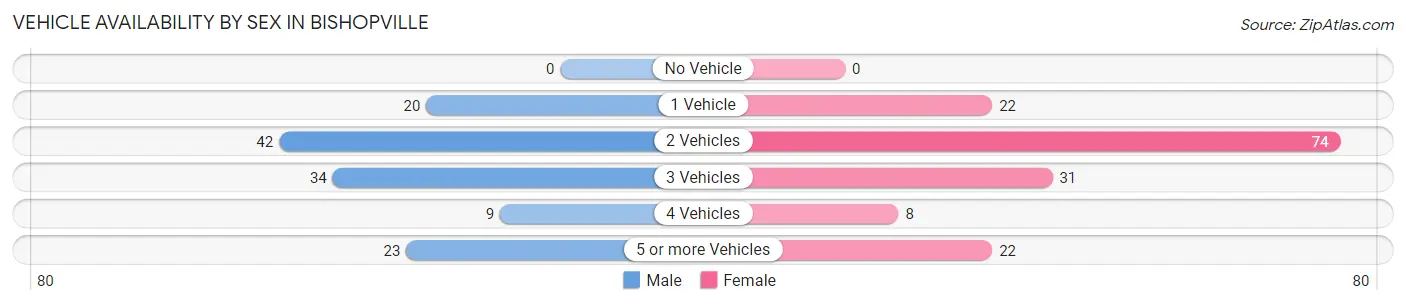
| Vehicles Available | Male | Female |
| No Vehicle | 0 (0.0%) | 0 (0.0%) |
| 1 Vehicle | 20 (15.6%) | 22 (14.0%) |
| 2 Vehicles | 42 (32.8%) | 74 (47.1%) |
| 3 Vehicles | 34 (26.6%) | 31 (19.8%) |
| 4 Vehicles | 9 (7.0%) | 8 (5.1%) |
| 5 or more Vehicles | 23 (18.0%) | 22 (14.0%) |
| Total | 128 (100.0%) | 157 (100.0%) |
Commute Time in Bishopville
The most frequently occuring commute durations in Bishopville are 10 to 14 minutes (83 commuters, 37.4%), 30 to 34 minutes (65 commuters, 29.3%), and 25 to 29 minutes (28 commuters, 12.6%).
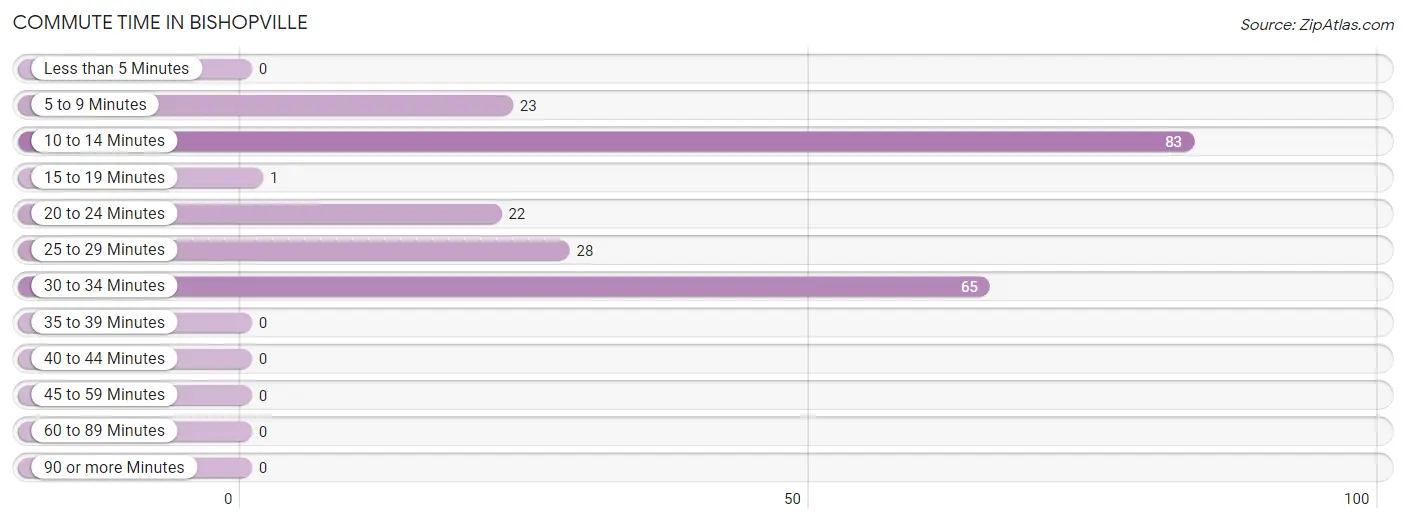
| Commute Time | # Commuters | % Commuters |
| Less than 5 Minutes | 0 | 0.0% |
| 5 to 9 Minutes | 23 | 10.4% |
| 10 to 14 Minutes | 83 | 37.4% |
| 15 to 19 Minutes | 1 | 0.4% |
| 20 to 24 Minutes | 22 | 9.9% |
| 25 to 29 Minutes | 28 | 12.6% |
| 30 to 34 Minutes | 65 | 29.3% |
| 35 to 39 Minutes | 0 | 0.0% |
| 40 to 44 Minutes | 0 | 0.0% |
| 45 to 59 Minutes | 0 | 0.0% |
| 60 to 89 Minutes | 0 | 0.0% |
| 90 or more Minutes | 0 | 0.0% |
Commute Time by Sex in Bishopville
The most common commute times in Bishopville are 30 to 34 minutes (34 commuters, 36.2%) for males and 10 to 14 minutes (74 commuters, 57.8%) for females.
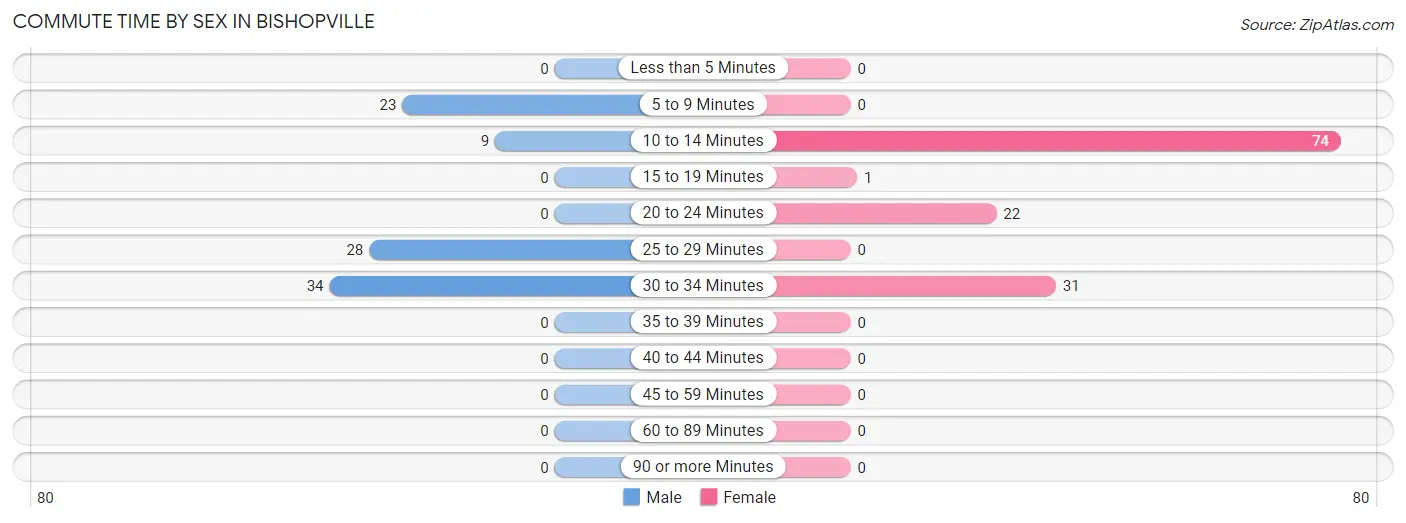
| Commute Time | Male | Female |
| Less than 5 Minutes | 0 (0.0%) | 0 (0.0%) |
| 5 to 9 Minutes | 23 (24.5%) | 0 (0.0%) |
| 10 to 14 Minutes | 9 (9.6%) | 74 (57.8%) |
| 15 to 19 Minutes | 0 (0.0%) | 1 (0.8%) |
| 20 to 24 Minutes | 0 (0.0%) | 22 (17.2%) |
| 25 to 29 Minutes | 28 (29.8%) | 0 (0.0%) |
| 30 to 34 Minutes | 34 (36.2%) | 31 (24.2%) |
| 35 to 39 Minutes | 0 (0.0%) | 0 (0.0%) |
| 40 to 44 Minutes | 0 (0.0%) | 0 (0.0%) |
| 45 to 59 Minutes | 0 (0.0%) | 0 (0.0%) |
| 60 to 89 Minutes | 0 (0.0%) | 0 (0.0%) |
| 90 or more Minutes | 0 (0.0%) | 0 (0.0%) |
Time of Departure to Work by Sex in Bishopville
The most frequent times of departure to work in Bishopville are 9:00 AM to 9:59 AM (23, 24.5%) for males and 7:30 AM to 7:59 AM (74, 57.8%) for females.
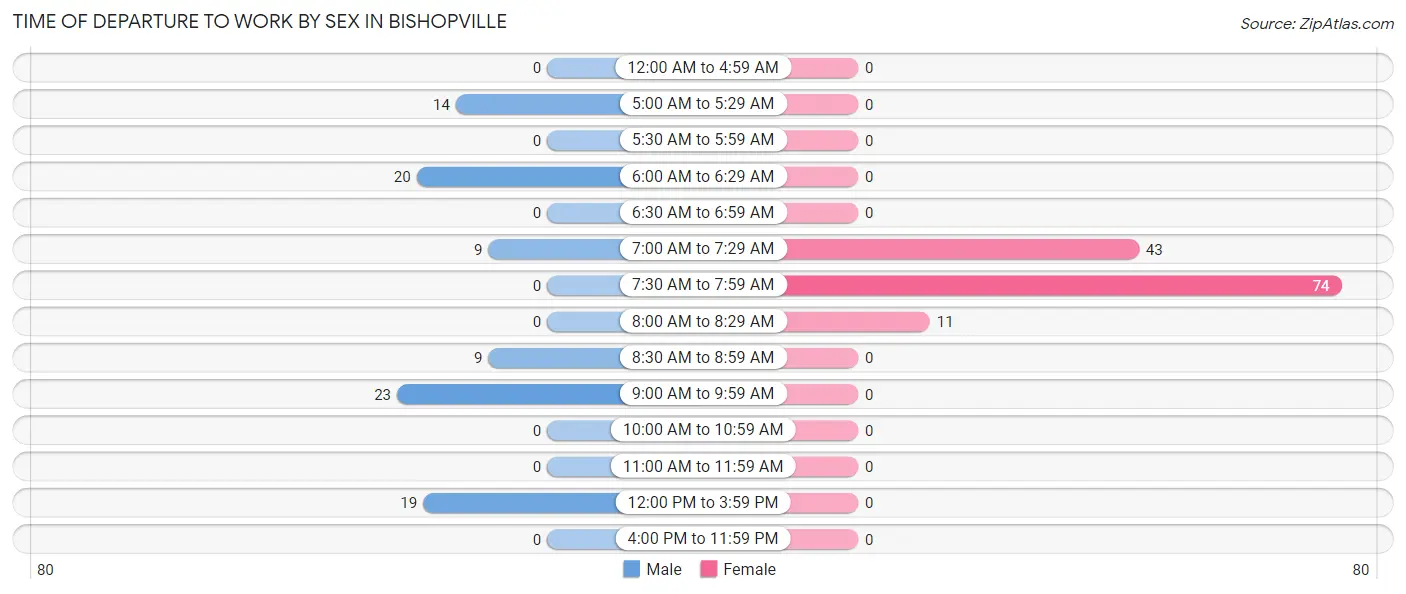
| Time of Departure | Male | Female |
| 12:00 AM to 4:59 AM | 0 (0.0%) | 0 (0.0%) |
| 5:00 AM to 5:29 AM | 14 (14.9%) | 0 (0.0%) |
| 5:30 AM to 5:59 AM | 0 (0.0%) | 0 (0.0%) |
| 6:00 AM to 6:29 AM | 20 (21.3%) | 0 (0.0%) |
| 6:30 AM to 6:59 AM | 0 (0.0%) | 0 (0.0%) |
| 7:00 AM to 7:29 AM | 9 (9.6%) | 43 (33.6%) |
| 7:30 AM to 7:59 AM | 0 (0.0%) | 74 (57.8%) |
| 8:00 AM to 8:29 AM | 0 (0.0%) | 11 (8.6%) |
| 8:30 AM to 8:59 AM | 9 (9.6%) | 0 (0.0%) |
| 9:00 AM to 9:59 AM | 23 (24.5%) | 0 (0.0%) |
| 10:00 AM to 10:59 AM | 0 (0.0%) | 0 (0.0%) |
| 11:00 AM to 11:59 AM | 0 (0.0%) | 0 (0.0%) |
| 12:00 PM to 3:59 PM | 19 (20.2%) | 0 (0.0%) |
| 4:00 PM to 11:59 PM | 0 (0.0%) | 0 (0.0%) |
| Total | 94 (100.0%) | 128 (100.0%) |
Housing Occupancy in Bishopville
Occupancy by Ownership in Bishopville
Of the total 174 dwellings in Bishopville, owner-occupied units account for 98 (56.3%), while renter-occupied units make up 76 (43.7%).
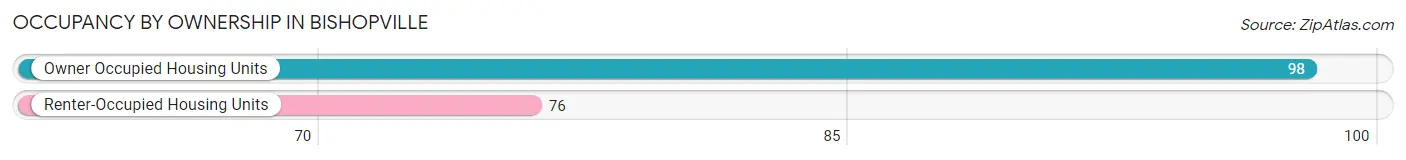
| Occupancy | # Housing Units | % Housing Units |
| Owner Occupied Housing Units | 98 | 56.3% |
| Renter-Occupied Housing Units | 76 | 43.7% |
| Total Occupied Housing Units | 174 | 100.0% |
Occupancy by Household Size in Bishopville
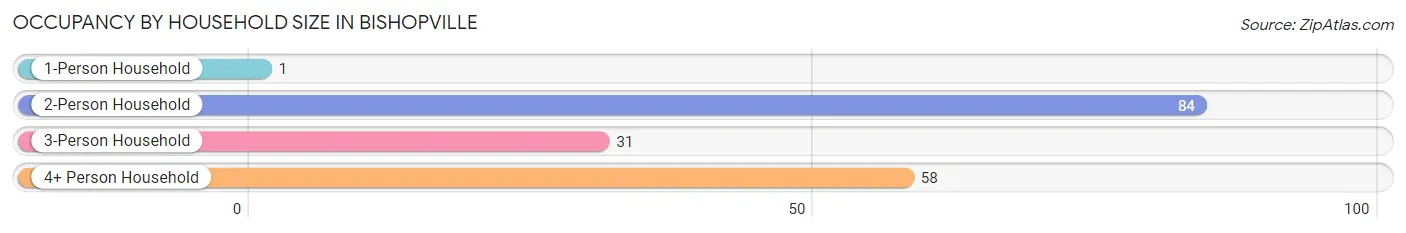
| Household Size | # Housing Units | % Housing Units |
| 1-Person Household | 1 | 0.6% |
| 2-Person Household | 84 | 48.3% |
| 3-Person Household | 31 | 17.8% |
| 4+ Person Household | 58 | 33.3% |
| Total Housing Units | 174 | 100.0% |
Occupancy by Ownership by Household Size in Bishopville
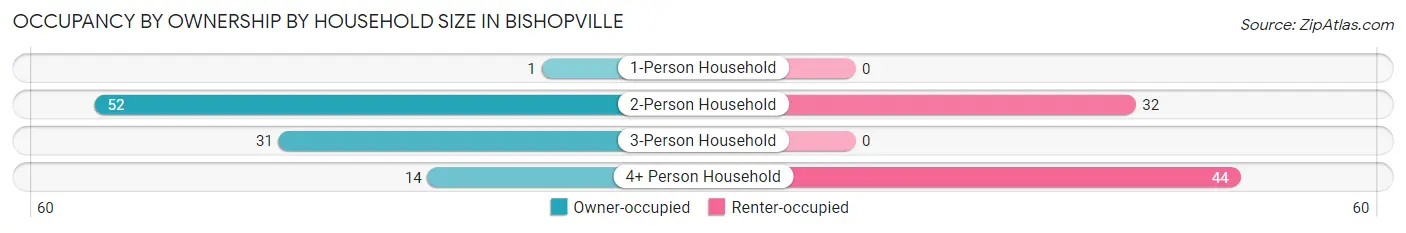
| Household Size | Owner-occupied | Renter-occupied |
| 1-Person Household | 1 (100.0%) | 0 (0.0%) |
| 2-Person Household | 52 (61.9%) | 32 (38.1%) |
| 3-Person Household | 31 (100.0%) | 0 (0.0%) |
| 4+ Person Household | 14 (24.1%) | 44 (75.9%) |
| Total Housing Units | 98 (56.3%) | 76 (43.7%) |
Occupancy by Educational Attainment in Bishopville
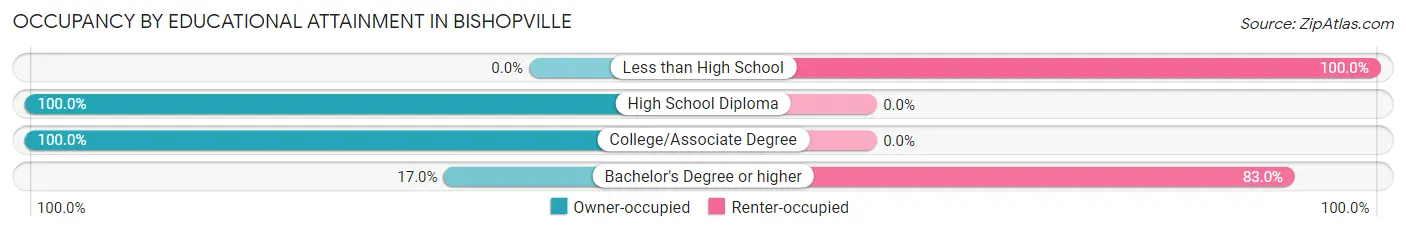
| Household Size | Owner-occupied | Renter-occupied |
| Less than High School | 0 (0.0%) | 32 (100.0%) |
| High School Diploma | 69 (100.0%) | 0 (0.0%) |
| College/Associate Degree | 20 (100.0%) | 0 (0.0%) |
| Bachelor's Degree or higher | 9 (17.0%) | 44 (83.0%) |
Occupancy by Age of Householder in Bishopville
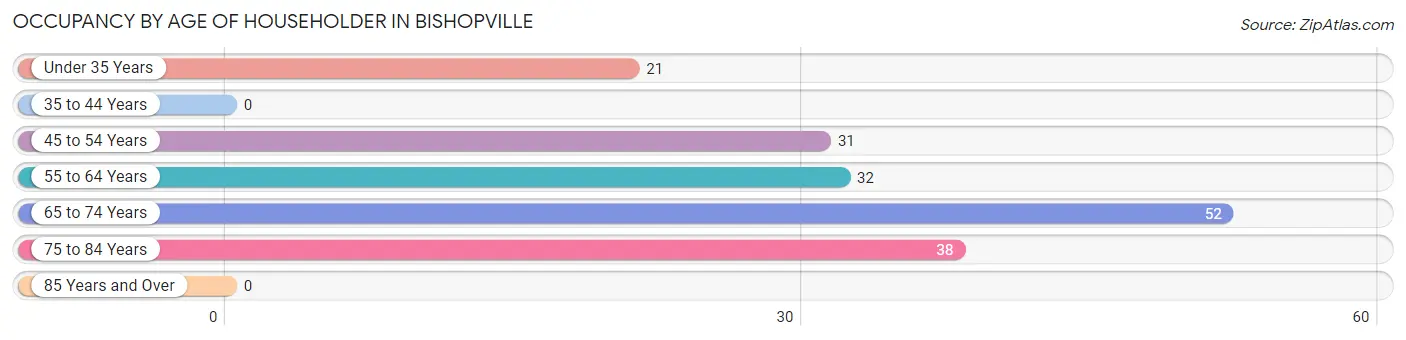
| Age Bracket | # Households | % Households |
| Under 35 Years | 21 | 12.1% |
| 35 to 44 Years | 0 | 0.0% |
| 45 to 54 Years | 31 | 17.8% |
| 55 to 64 Years | 32 | 18.4% |
| 65 to 74 Years | 52 | 29.9% |
| 75 to 84 Years | 38 | 21.8% |
| 85 Years and Over | 0 | 0.0% |
| Total | 174 | 100.0% |
Housing Finances in Bishopville
Median Income by Occupancy in Bishopville
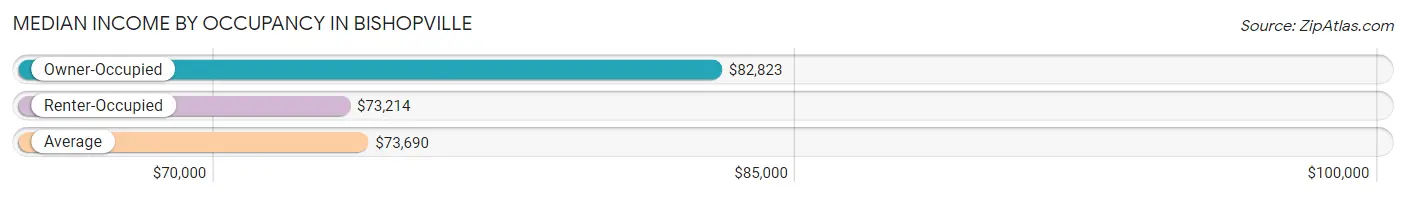
| Occupancy Type | # Households | Median Income |
| Owner-Occupied | 98 (56.3%) | $82,823 |
| Renter-Occupied | 76 (43.7%) | $73,214 |
| Average | 174 (100.0%) | $73,690 |
Occupancy by Householder Income Bracket in Bishopville
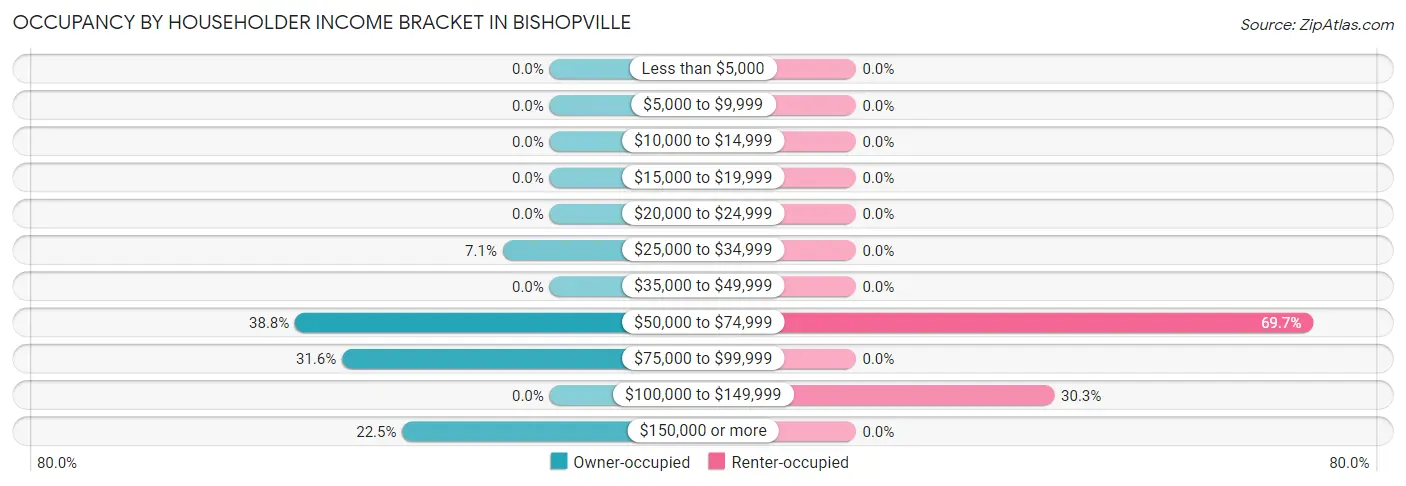
| Income Bracket | Owner-occupied | Renter-occupied |
| Less than $5,000 | 0 (0.0%) | 0 (0.0%) |
| $5,000 to $9,999 | 0 (0.0%) | 0 (0.0%) |
| $10,000 to $14,999 | 0 (0.0%) | 0 (0.0%) |
| $15,000 to $19,999 | 0 (0.0%) | 0 (0.0%) |
| $20,000 to $24,999 | 0 (0.0%) | 0 (0.0%) |
| $25,000 to $34,999 | 7 (7.1%) | 0 (0.0%) |
| $35,000 to $49,999 | 0 (0.0%) | 0 (0.0%) |
| $50,000 to $74,999 | 38 (38.8%) | 53 (69.7%) |
| $75,000 to $99,999 | 31 (31.6%) | 0 (0.0%) |
| $100,000 to $149,999 | 0 (0.0%) | 23 (30.3%) |
| $150,000 or more | 22 (22.5%) | 0 (0.0%) |
| Total | 98 (100.0%) | 76 (100.0%) |
Monthly Housing Cost Tiers in Bishopville
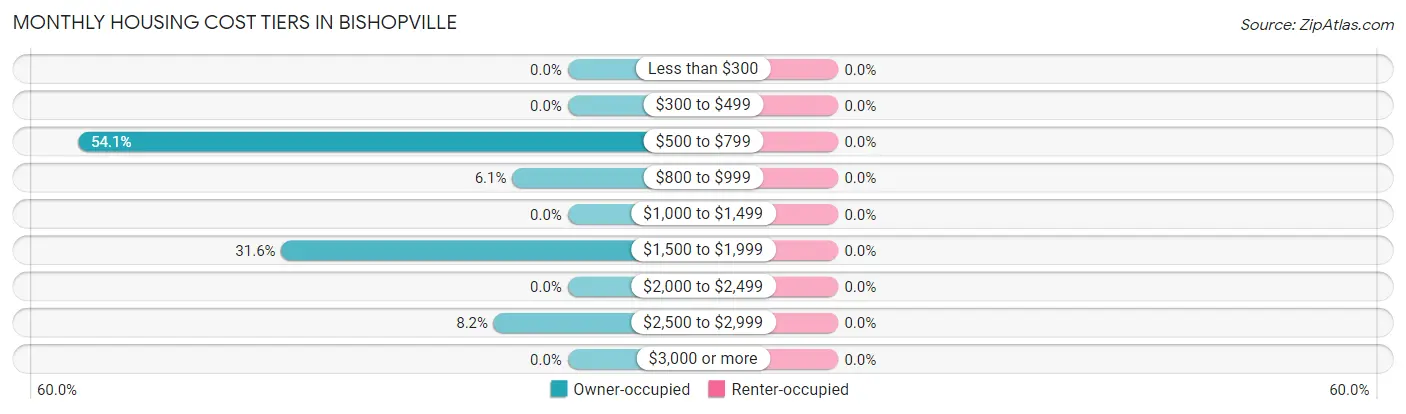
| Monthly Cost | Owner-occupied | Renter-occupied |
| Less than $300 | 0 (0.0%) | 0 (0.0%) |
| $300 to $499 | 0 (0.0%) | 0 (0.0%) |
| $500 to $799 | 53 (54.1%) | 0 (0.0%) |
| $800 to $999 | 6 (6.1%) | 0 (0.0%) |
| $1,000 to $1,499 | 0 (0.0%) | 0 (0.0%) |
| $1,500 to $1,999 | 31 (31.6%) | 0 (0.0%) |
| $2,000 to $2,499 | 0 (0.0%) | 0 (0.0%) |
| $2,500 to $2,999 | 8 (8.2%) | 0 (0.0%) |
| $3,000 or more | 0 (0.0%) | 0 (0.0%) |
| Total | 98 (100.0%) | 76 (100.0%) |
Physical Housing Characteristics in Bishopville
Housing Structures in Bishopville
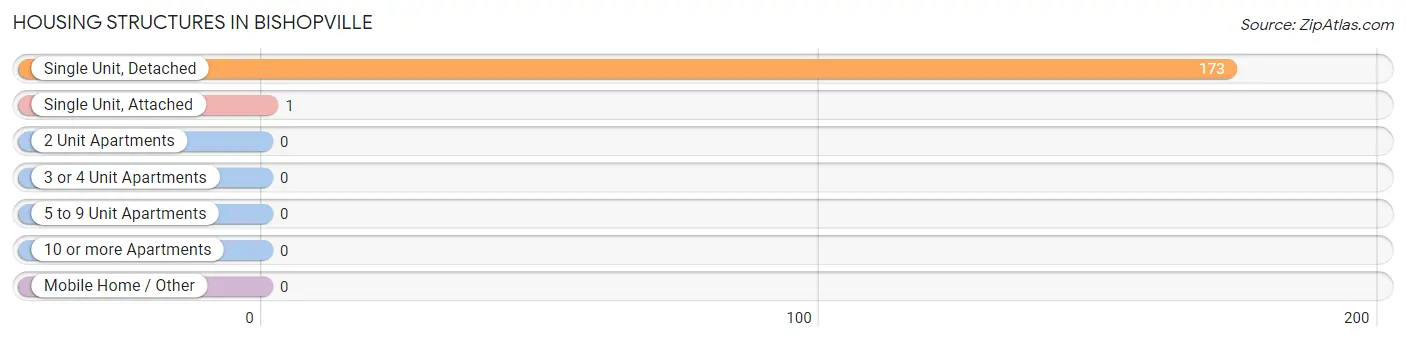
| Structure Type | # Housing Units | % Housing Units |
| Single Unit, Detached | 173 | 99.4% |
| Single Unit, Attached | 1 | 0.6% |
| 2 Unit Apartments | 0 | 0.0% |
| 3 or 4 Unit Apartments | 0 | 0.0% |
| 5 to 9 Unit Apartments | 0 | 0.0% |
| 10 or more Apartments | 0 | 0.0% |
| Mobile Home / Other | 0 | 0.0% |
| Total | 174 | 100.0% |
Housing Structures by Occupancy in Bishopville
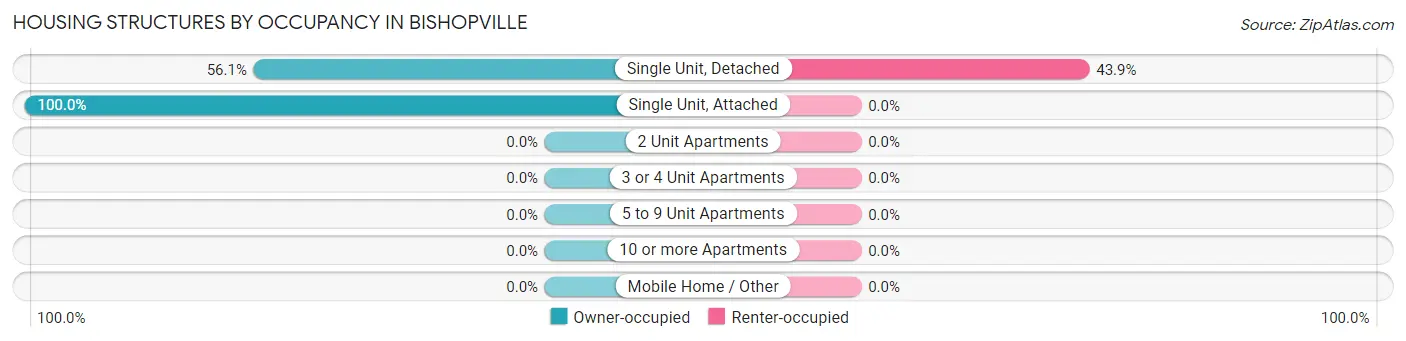
| Structure Type | Owner-occupied | Renter-occupied |
| Single Unit, Detached | 97 (56.1%) | 76 (43.9%) |
| Single Unit, Attached | 1 (100.0%) | 0 (0.0%) |
| 2 Unit Apartments | 0 (0.0%) | 0 (0.0%) |
| 3 or 4 Unit Apartments | 0 (0.0%) | 0 (0.0%) |
| 5 to 9 Unit Apartments | 0 (0.0%) | 0 (0.0%) |
| 10 or more Apartments | 0 (0.0%) | 0 (0.0%) |
| Mobile Home / Other | 0 (0.0%) | 0 (0.0%) |
| Total | 98 (56.3%) | 76 (43.7%) |
Housing Structures by Number of Rooms in Bishopville
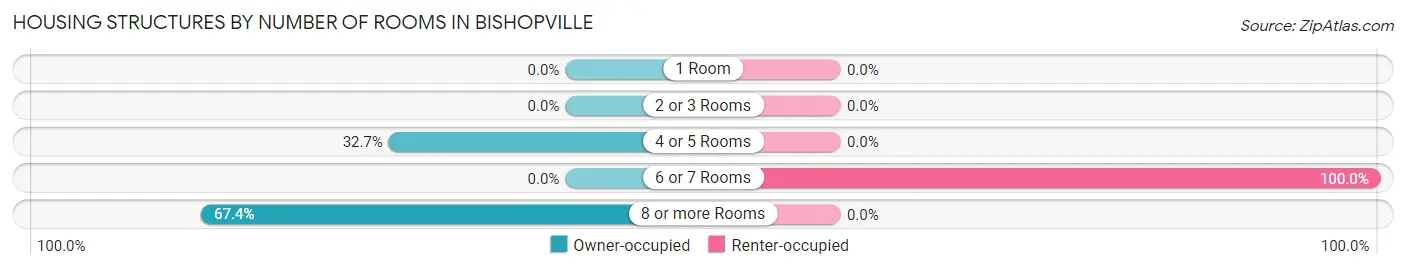
| Number of Rooms | Owner-occupied | Renter-occupied |
| 1 Room | 0 (0.0%) | 0 (0.0%) |
| 2 or 3 Rooms | 0 (0.0%) | 0 (0.0%) |
| 4 or 5 Rooms | 32 (32.7%) | 0 (0.0%) |
| 6 or 7 Rooms | 0 (0.0%) | 76 (100.0%) |
| 8 or more Rooms | 66 (67.3%) | 0 (0.0%) |
| Total | 98 (100.0%) | 76 (100.0%) |
Housing Structure by Heating Type in Bishopville
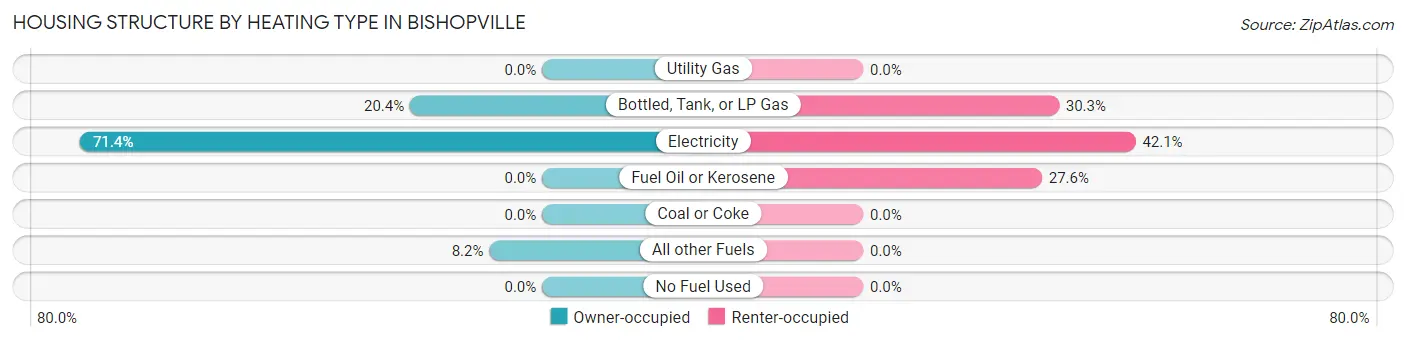
| Heating Type | Owner-occupied | Renter-occupied |
| Utility Gas | 0 (0.0%) | 0 (0.0%) |
| Bottled, Tank, or LP Gas | 20 (20.4%) | 23 (30.3%) |
| Electricity | 70 (71.4%) | 32 (42.1%) |
| Fuel Oil or Kerosene | 0 (0.0%) | 21 (27.6%) |
| Coal or Coke | 0 (0.0%) | 0 (0.0%) |
| All other Fuels | 8 (8.2%) | 0 (0.0%) |
| No Fuel Used | 0 (0.0%) | 0 (0.0%) |
| Total | 98 (100.0%) | 76 (100.0%) |
Household Vehicle Usage in Bishopville
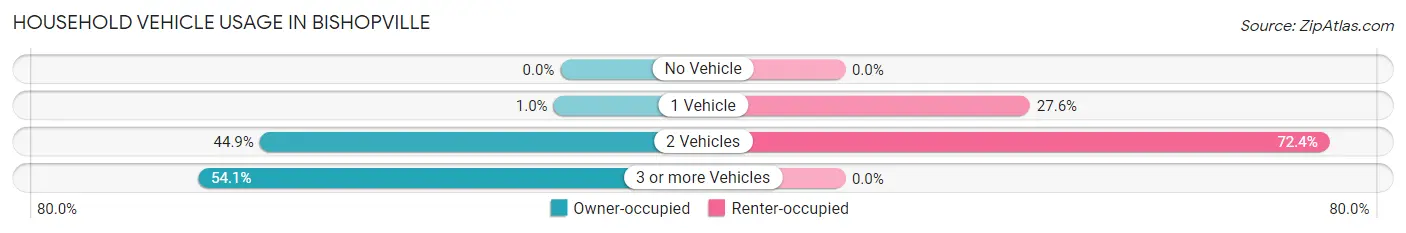
| Vehicles per Household | Owner-occupied | Renter-occupied |
| No Vehicle | 0 (0.0%) | 0 (0.0%) |
| 1 Vehicle | 1 (1.0%) | 21 (27.6%) |
| 2 Vehicles | 44 (44.9%) | 55 (72.4%) |
| 3 or more Vehicles | 53 (54.1%) | 0 (0.0%) |
| Total | 98 (100.0%) | 76 (100.0%) |
Real Estate & Mortgages in Bishopville
Real Estate and Mortgage Overview in Bishopville
| Characteristic | Without Mortgage | With Mortgage |
| Housing Units | 21 | 77 |
| Median Property Value | $425,000 | $540,800 |
| Median Household Income | - | - |
| Monthly Housing Costs | $668 | $0 |
| Real Estate Taxes | - | - |
Property Value by Mortgage Status in Bishopville
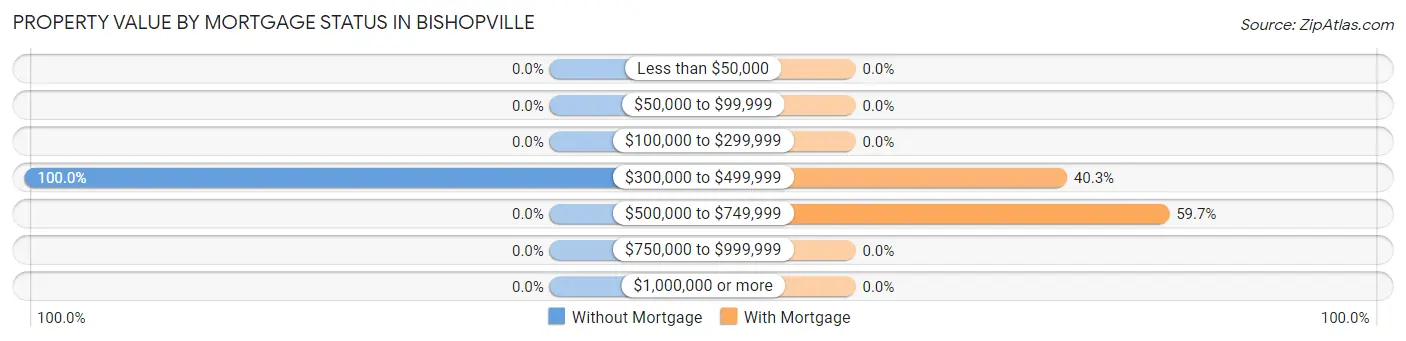
| Property Value | Without Mortgage | With Mortgage |
| Less than $50,000 | 0 (0.0%) | 0 (0.0%) |
| $50,000 to $99,999 | 0 (0.0%) | 0 (0.0%) |
| $100,000 to $299,999 | 0 (0.0%) | 0 (0.0%) |
| $300,000 to $499,999 | 21 (100.0%) | 31 (40.3%) |
| $500,000 to $749,999 | 0 (0.0%) | 46 (59.7%) |
| $750,000 to $999,999 | 0 (0.0%) | 0 (0.0%) |
| $1,000,000 or more | 0 (0.0%) | 0 (0.0%) |
| Total | 21 (100.0%) | 77 (100.0%) |
Household Income by Mortgage Status in Bishopville
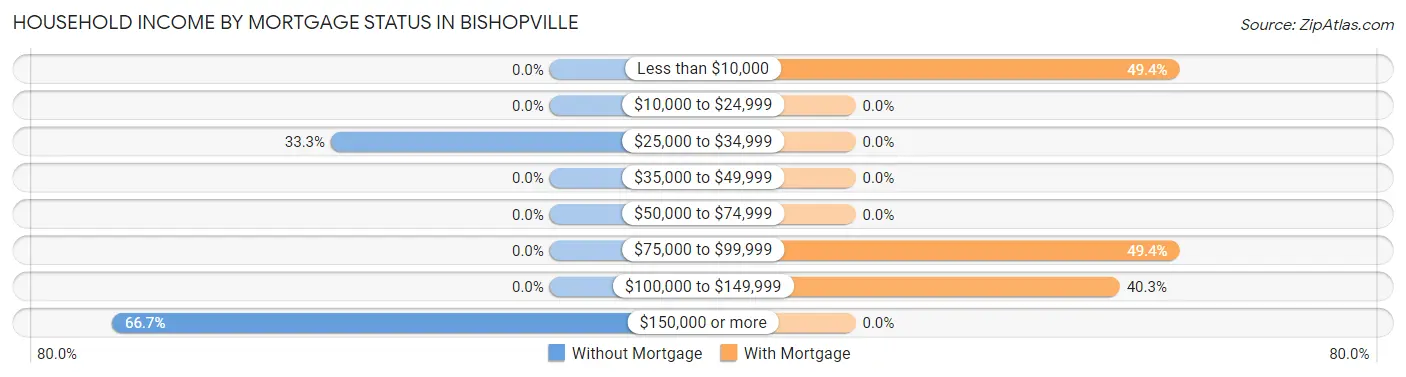
| Household Income | Without Mortgage | With Mortgage |
| Less than $10,000 | 0 (0.0%) | 38 (49.3%) |
| $10,000 to $24,999 | 0 (0.0%) | 0 (0.0%) |
| $25,000 to $34,999 | 7 (33.3%) | 0 (0.0%) |
| $35,000 to $49,999 | 0 (0.0%) | 0 (0.0%) |
| $50,000 to $74,999 | 0 (0.0%) | 0 (0.0%) |
| $75,000 to $99,999 | 0 (0.0%) | 38 (49.3%) |
| $100,000 to $149,999 | 0 (0.0%) | 31 (40.3%) |
| $150,000 or more | 14 (66.7%) | 0 (0.0%) |
| Total | 21 (100.0%) | 77 (100.0%) |
Property Value to Household Income Ratio in Bishopville
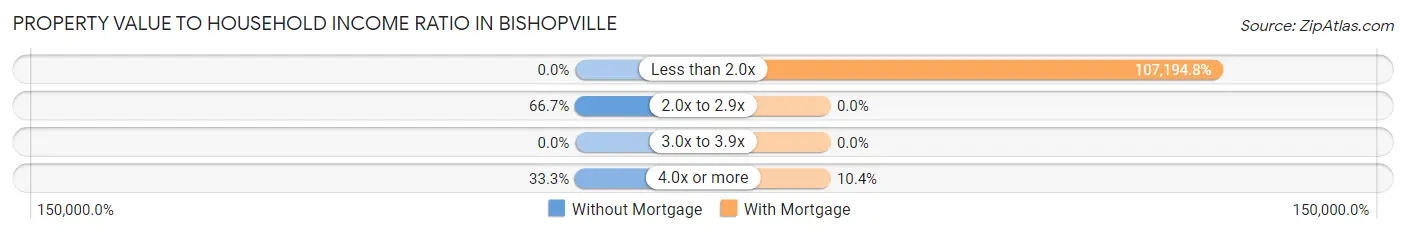
| Value-to-Income Ratio | Without Mortgage | With Mortgage |
| Less than 2.0x | 0 (0.0%) | 82,540 (107,194.8%) |
| 2.0x to 2.9x | 14 (66.7%) | 0 (0.0%) |
| 3.0x to 3.9x | 0 (0.0%) | 0 (0.0%) |
| 4.0x or more | 7 (33.3%) | 8 (10.4%) |
| Total | 21 (100.0%) | 77 (100.0%) |
Real Estate Taxes by Mortgage Status in Bishopville
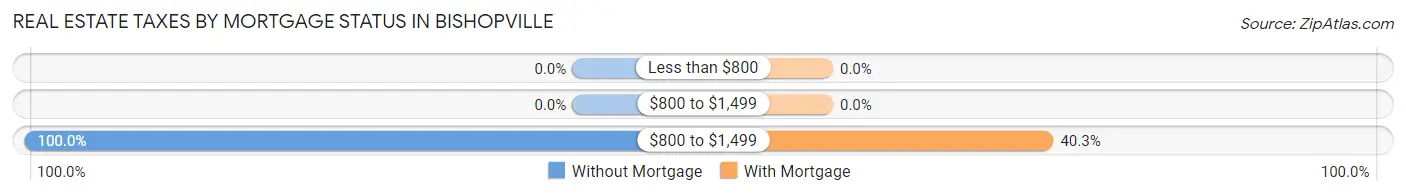
| Property Taxes | Without Mortgage | With Mortgage |
| Less than $800 | 0 (0.0%) | 0 (0.0%) |
| $800 to $1,499 | 0 (0.0%) | 0 (0.0%) |
| $800 to $1,499 | 21 (100.0%) | 31 (40.3%) |
| Total | 21 (100.0%) | 77 (100.0%) |
Health & Disability in Bishopville
Health Insurance Coverage by Age in Bishopville
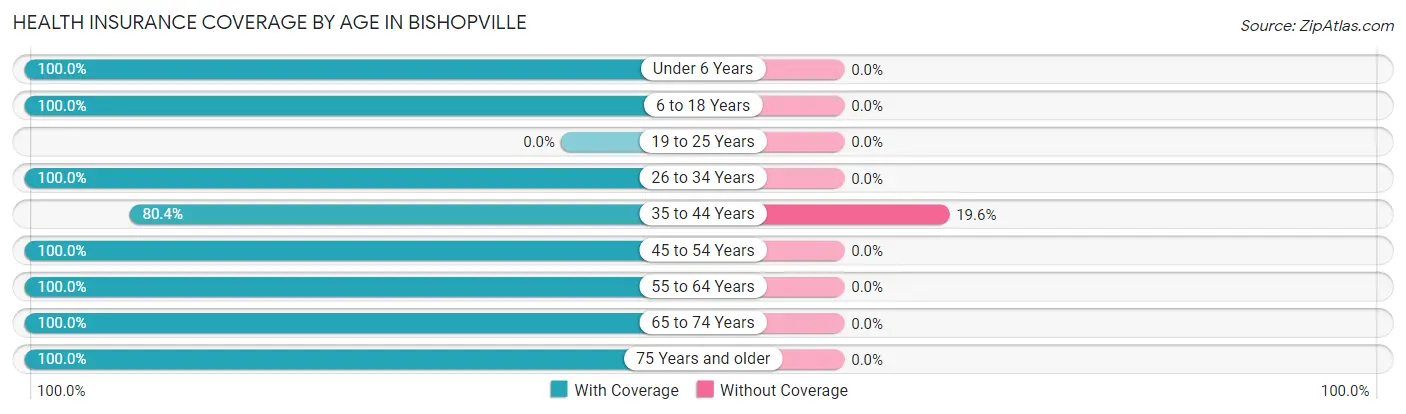
| Age Bracket | With Coverage | Without Coverage |
| Under 6 Years | 54 (100.0%) | 0 (0.0%) |
| 6 to 18 Years | 84 (100.0%) | 0 (0.0%) |
| 19 to 25 Years | 0 (0.0%) | 0 (0.0%) |
| 26 to 34 Years | 102 (100.0%) | 0 (0.0%) |
| 35 to 44 Years | 37 (80.4%) | 9 (19.6%) |
| 45 to 54 Years | 65 (100.0%) | 0 (0.0%) |
| 55 to 64 Years | 63 (100.0%) | 0 (0.0%) |
| 65 to 74 Years | 59 (100.0%) | 0 (0.0%) |
| 75 Years and older | 75 (100.0%) | 0 (0.0%) |
| Total | 539 (98.4%) | 9 (1.6%) |
Health Insurance Coverage by Citizenship Status in Bishopville
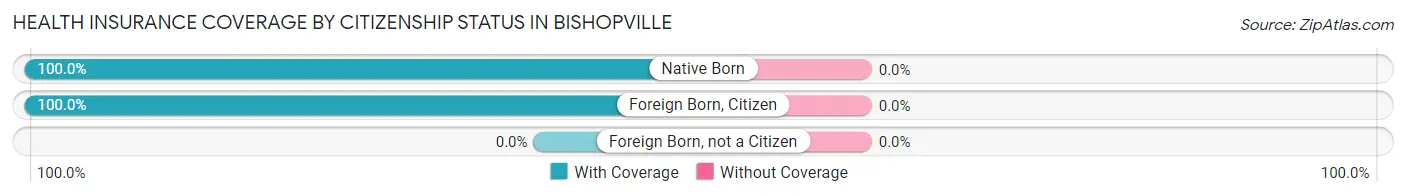
| Citizenship Status | With Coverage | Without Coverage |
| Native Born | 54 (100.0%) | 0 (0.0%) |
| Foreign Born, Citizen | 84 (100.0%) | 0 (0.0%) |
| Foreign Born, not a Citizen | 0 (0.0%) | 0 (0.0%) |
Health Insurance Coverage by Household Income in Bishopville
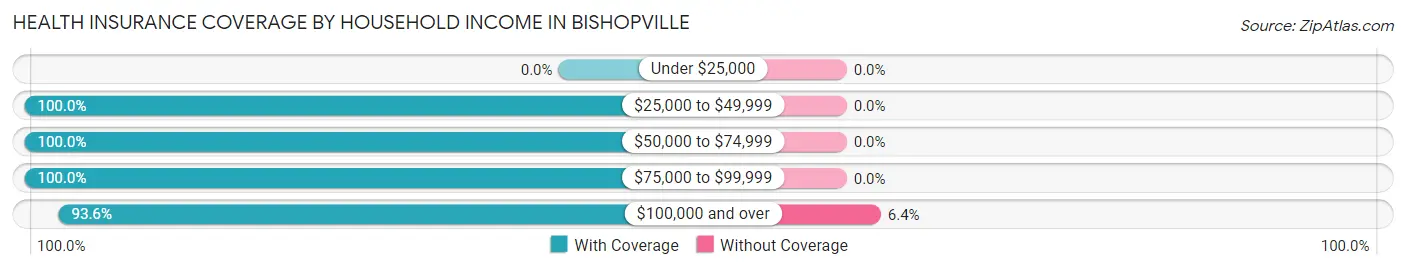
| Household Income | With Coverage | Without Coverage |
| Under $25,000 | 0 (0.0%) | 0 (0.0%) |
| $25,000 to $49,999 | 14 (100.0%) | 0 (0.0%) |
| $50,000 to $74,999 | 295 (100.0%) | 0 (0.0%) |
| $75,000 to $99,999 | 98 (100.0%) | 0 (0.0%) |
| $100,000 and over | 132 (93.6%) | 9 (6.4%) |
Public vs Private Health Insurance Coverage by Age in Bishopville
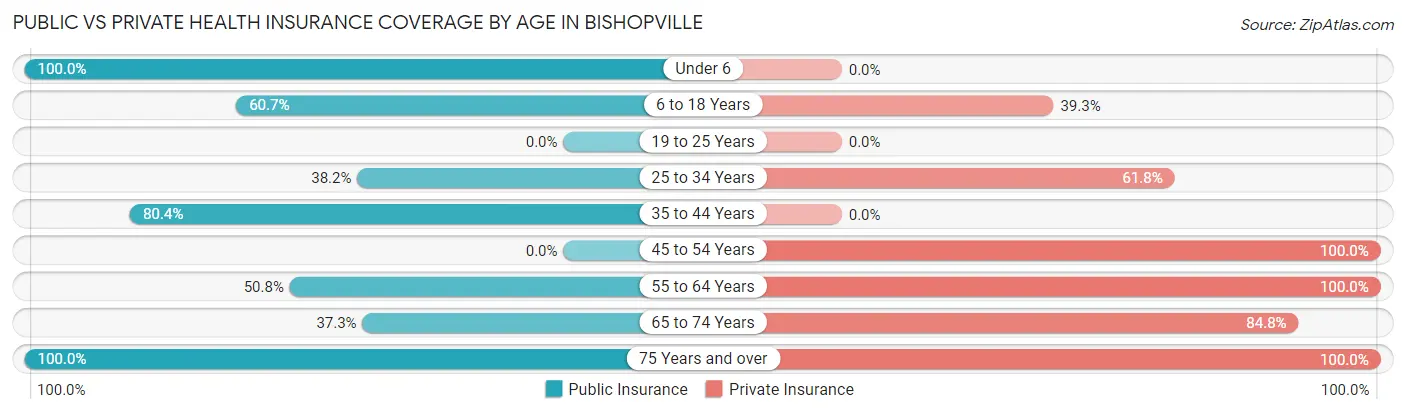
| Age Bracket | Public Insurance | Private Insurance |
| Under 6 | 54 (100.0%) | 0 (0.0%) |
| 6 to 18 Years | 51 (60.7%) | 33 (39.3%) |
| 19 to 25 Years | 0 (0.0%) | 0 (0.0%) |
| 25 to 34 Years | 39 (38.2%) | 63 (61.8%) |
| 35 to 44 Years | 37 (80.4%) | 0 (0.0%) |
| 45 to 54 Years | 0 (0.0%) | 65 (100.0%) |
| 55 to 64 Years | 32 (50.8%) | 63 (100.0%) |
| 65 to 74 Years | 22 (37.3%) | 50 (84.8%) |
| 75 Years and over | 75 (100.0%) | 75 (100.0%) |
| Total | 310 (56.6%) | 349 (63.7%) |
Disability Status by Sex by Age in Bishopville
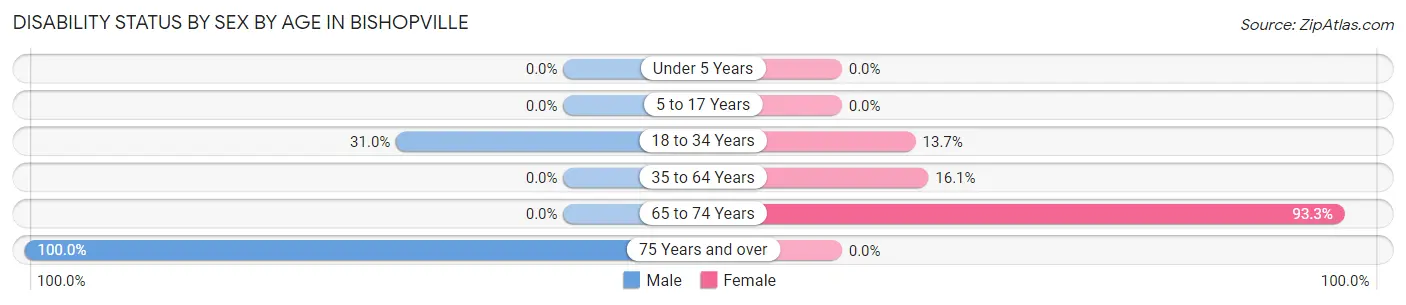
| Age Bracket | Male | Female |
| Under 5 Years | 0 (0.0%) | 0 (0.0%) |
| 5 to 17 Years | 0 (0.0%) | 0 (0.0%) |
| 18 to 34 Years | 9 (31.0%) | 10 (13.7%) |
| 35 to 64 Years | 0 (0.0%) | 18 (16.1%) |
| 65 to 74 Years | 0 (0.0%) | 14 (93.3%) |
| 75 Years and over | 38 (100.0%) | 0 (0.0%) |
Disability Class by Sex by Age in Bishopville
Disability Class: Hearing Difficulty
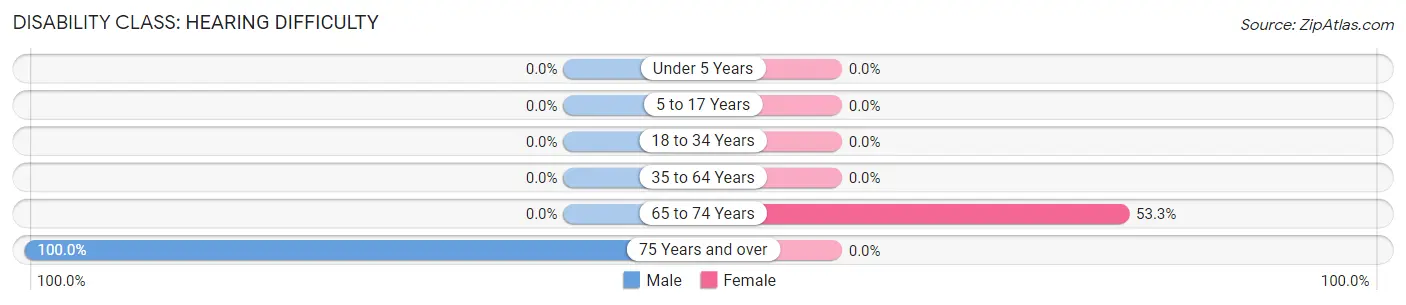
| Age Bracket | Male | Female |
| Under 5 Years | 0 (0.0%) | 0 (0.0%) |
| 5 to 17 Years | 0 (0.0%) | 0 (0.0%) |
| 18 to 34 Years | 0 (0.0%) | 0 (0.0%) |
| 35 to 64 Years | 0 (0.0%) | 0 (0.0%) |
| 65 to 74 Years | 0 (0.0%) | 8 (53.3%) |
| 75 Years and over | 38 (100.0%) | 0 (0.0%) |
Disability Class: Vision Difficulty
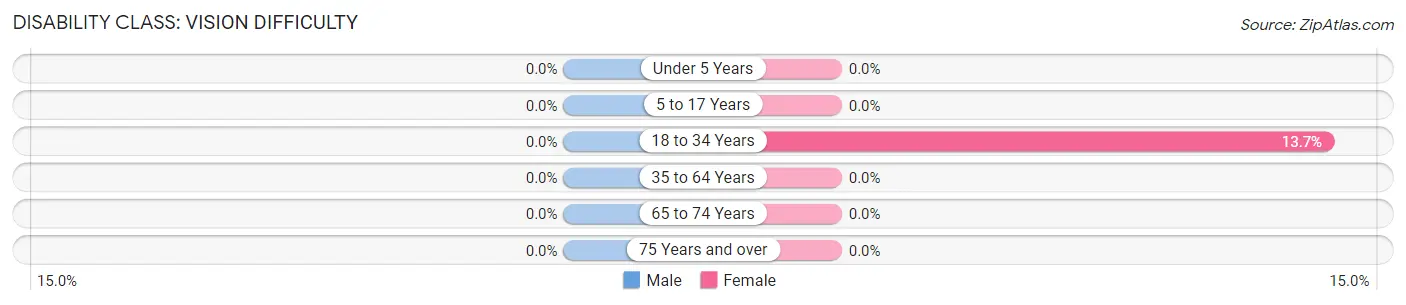
| Age Bracket | Male | Female |
| Under 5 Years | 0 (0.0%) | 0 (0.0%) |
| 5 to 17 Years | 0 (0.0%) | 0 (0.0%) |
| 18 to 34 Years | 0 (0.0%) | 10 (13.7%) |
| 35 to 64 Years | 0 (0.0%) | 0 (0.0%) |
| 65 to 74 Years | 0 (0.0%) | 0 (0.0%) |
| 75 Years and over | 0 (0.0%) | 0 (0.0%) |
Disability Class: Cognitive Difficulty
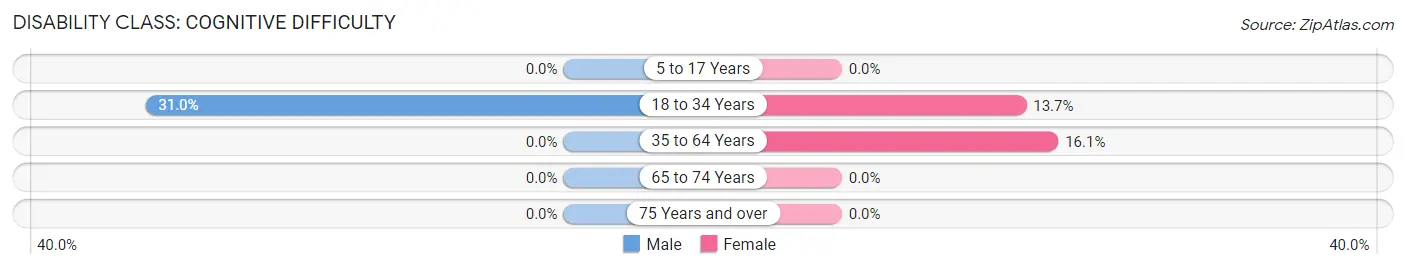
| Age Bracket | Male | Female |
| 5 to 17 Years | 0 (0.0%) | 0 (0.0%) |
| 18 to 34 Years | 9 (31.0%) | 10 (13.7%) |
| 35 to 64 Years | 0 (0.0%) | 18 (16.1%) |
| 65 to 74 Years | 0 (0.0%) | 0 (0.0%) |
| 75 Years and over | 0 (0.0%) | 0 (0.0%) |
Disability Class: Ambulatory Difficulty
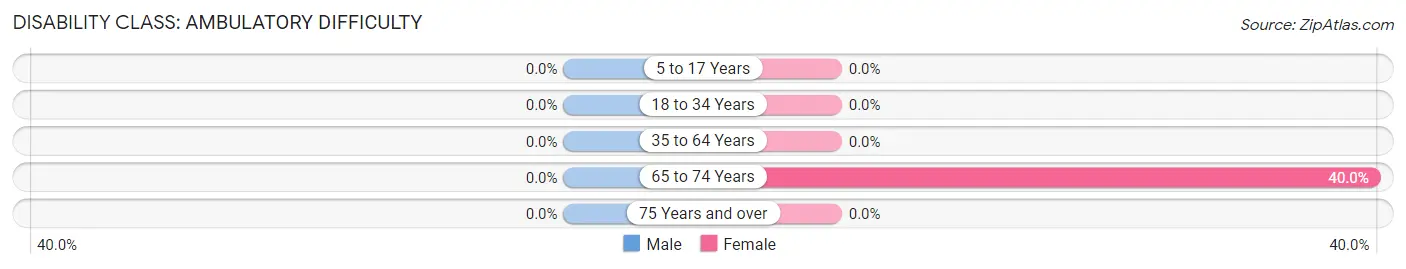
| Age Bracket | Male | Female |
| 5 to 17 Years | 0 (0.0%) | 0 (0.0%) |
| 18 to 34 Years | 0 (0.0%) | 0 (0.0%) |
| 35 to 64 Years | 0 (0.0%) | 0 (0.0%) |
| 65 to 74 Years | 0 (0.0%) | 6 (40.0%) |
| 75 Years and over | 0 (0.0%) | 0 (0.0%) |
Disability Class: Self-Care Difficulty
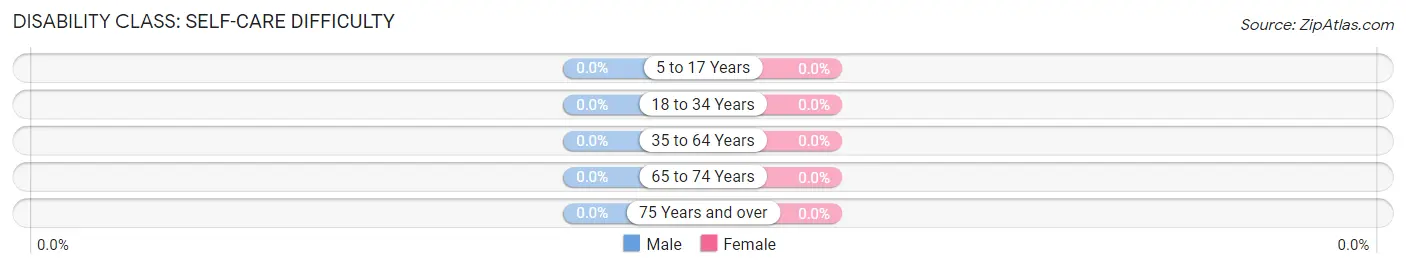
| Age Bracket | Male | Female |
| 5 to 17 Years | 0 (0.0%) | 0 (0.0%) |
| 18 to 34 Years | 0 (0.0%) | 0 (0.0%) |
| 35 to 64 Years | 0 (0.0%) | 0 (0.0%) |
| 65 to 74 Years | 0 (0.0%) | 0 (0.0%) |
| 75 Years and over | 0 (0.0%) | 0 (0.0%) |
Technology Access in Bishopville
Computing Device Access in Bishopville
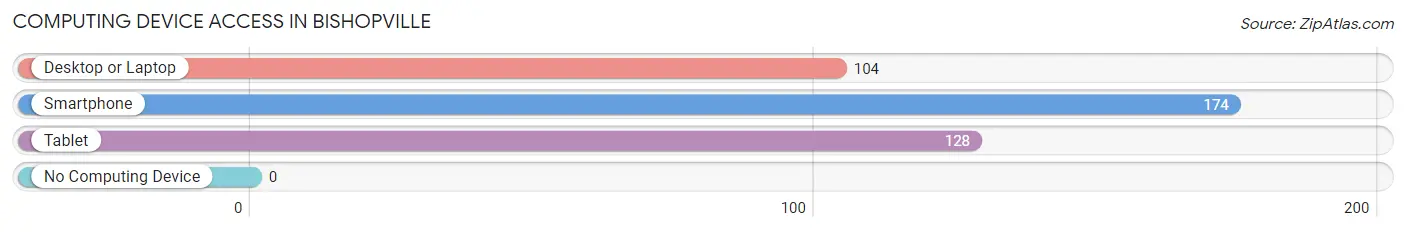
| Device Type | # Households | % Households |
| Desktop or Laptop | 104 | 59.8% |
| Smartphone | 174 | 100.0% |
| Tablet | 128 | 73.6% |
| No Computing Device | 0 | 0.0% |
| Total | 174 | 100.0% |
Internet Access in Bishopville
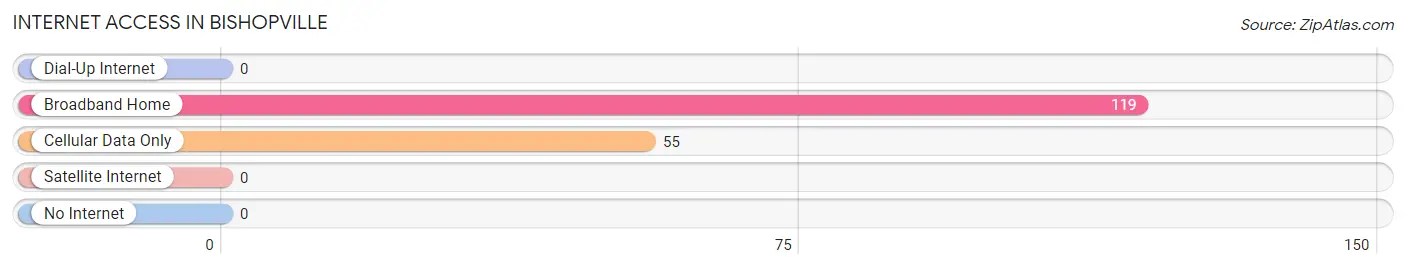
| Internet Type | # Households | % Households |
| Dial-Up Internet | 0 | 0.0% |
| Broadband Home | 119 | 68.4% |
| Cellular Data Only | 55 | 31.6% |
| Satellite Internet | 0 | 0.0% |
| No Internet | 0 | 0.0% |
| Total | 174 | 100.0% |
Bishopville Summary
Bishopville is a small town located in Worcester County, Maryland, United States. It is situated on the eastern shore of Maryland, approximately 20 miles south of Ocean City. The population of Bishopville was 1,717 at the 2010 census.
History
Bishopville was founded in 1867 by William Bishop, a former slave who had purchased his freedom. Bishop purchased a large tract of land in the area and began to develop it into a small farming community. The town was named after him and was incorporated in 1887.
In the early 1900s, Bishopville was a thriving agricultural community. The town was home to several large farms, including the Bishop Farm, which was owned by William Bishop's son, John. The town also had a number of small businesses, including a general store, a blacksmith shop, and a post office.
In the 1950s, Bishopville began to experience a decline in population as many of its residents moved away in search of better economic opportunities. The town's population dropped from 1,845 in 1950 to 1,717 in 2010.
Geography
Bishopville is located at 38°25'25" North, 75°25'45" West (38.423, -75.429). The town is situated on the eastern shore of Maryland, approximately 20 miles south of Ocean City. The town is bordered by the towns of Berlin, Ocean Pines, and Showell to the north, and the towns of Pittsville and Willards to the south.
The town has a total area of 1.2 square miles, all of which is land. The town is located in a flat, coastal plain region and is surrounded by farmland. The nearest major body of water is the Chesapeake Bay, which is located approximately 10 miles to the east.
Economy
The economy of Bishopville is largely based on agriculture. The town is home to several large farms, including the Bishop Farm, which is owned by William Bishop's son, John. The town also has a number of small businesses, including a general store, a blacksmith shop, and a post office.
In recent years, Bishopville has become a popular destination for tourists. The town is home to several bed and breakfasts, as well as a number of restaurants and shops. The town also hosts a number of festivals and events throughout the year, including the Bishopville Blueberry Festival and the Bishopville Watermelon Festival.
Demographics
As of the 2010 census, the population of Bishopville was 1,717. The racial makeup of the town was 87.3% White, 8.2% African American, 0.6% Native American, 0.7% Asian, 0.1% Pacific Islander, 1.2% from other races, and 2.1% from two or more races. Hispanic or Latino of any race were 3.2% of the population.
The median income for a household in Bishopville was $41,250, and the median income for a family was $48,750. The per capita income for the town was $20,945. About 11.2% of families and 14.2% of the population were below the poverty line, including 19.2% of those under age 18 and 8.3% of those age 65 or over.
Common Questions
What is Per Capita Income in Bishopville?
Per Capita income in Bishopville is $27,919.
What is the Median Family Income in Bishopville?
Median Family Income in Bishopville is $73,274.
What is the Median Household income in Bishopville?
Median Household Income in Bishopville is $73,690.
What is Income or Wage Gap in Bishopville?
Income or Wage Gap in Bishopville is 5.4%.
Women in Bishopville earn 94.6 cents for every dollar earned by a man.
What is Inequality or Gini Index in Bishopville?
Inequality or Gini Index in Bishopville is 0.25.
What is the Total Population of Bishopville?
Total Population of Bishopville is 548.
What is the Total Male Population of Bishopville?
Total Male Population of Bishopville is 199.
What is the Total Female Population of Bishopville?
Total Female Population of Bishopville is 349.
What is the Ratio of Males per 100 Females in Bishopville?
There are 57.02 Males per 100 Females in Bishopville.
What is the Ratio of Females per 100 Males in Bishopville?
There are 175.38 Females per 100 Males in Bishopville.
What is the Median Population Age in Bishopville?
Median Population Age in Bishopville is 42.3 Years.
What is the Average Family Size in Bishopville
Average Family Size in Bishopville is 3.2 People.
What is the Average Household Size in Bishopville
Average Household Size in Bishopville is 3.1 People.
How Large is the Labor Force in Bishopville?
There are 285 People in the Labor Forcein in Bishopville.
What is the Percentage of People in the Labor Force in Bishopville?
69.5% of People are in the Labor Force in Bishopville.