East New Market, MD Map & Demographics
East New Market Map
East New Market Overview
$31,907
PER CAPITA INCOME
$97,813
AVG FAMILY INCOME
$50,417
AVG HOUSEHOLD INCOME
32.2%
WAGE / INCOME GAP [ % ]
67.8¢/ $1
WAGE / INCOME GAP [ $ ]
0.48
INEQUALITY / GINI INDEX
389
TOTAL POPULATION
189
MALE POPULATION
200
FEMALE POPULATION
94.50
MALES / 100 FEMALES
105.82
FEMALES / 100 MALES
45.3
MEDIAN AGE
3.5
AVG FAMILY SIZE
2.5
AVG HOUSEHOLD SIZE
184
LABOR FORCE [ PEOPLE ]
55.4%
PERCENT IN LABOR FORCE
1.1%
UNEMPLOYMENT RATE
East New Market Zip Codes
East New Market Area Codes
Income in East New Market
Income Overview in East New Market
Per Capita Income in East New Market is $31,907, while median incomes of families and households are $97,813 and $50,417 respectively.
| Characteristic | Number | Measure |
| Per Capita Income | 389 | $31,907 |
| Median Family Income | 83 | $97,813 |
| Mean Family Income | 83 | $108,988 |
| Median Household Income | 158 | $50,417 |
| Mean Household Income | 158 | $75,369 |
| Income Deficit | 83 | $0 |
| Wage / Income Gap (%) | 389 | 32.23% |
| Wage / Income Gap ($) | 389 | 67.77¢ per $1 |
| Gini / Inequality Index | 389 | 0.48 |
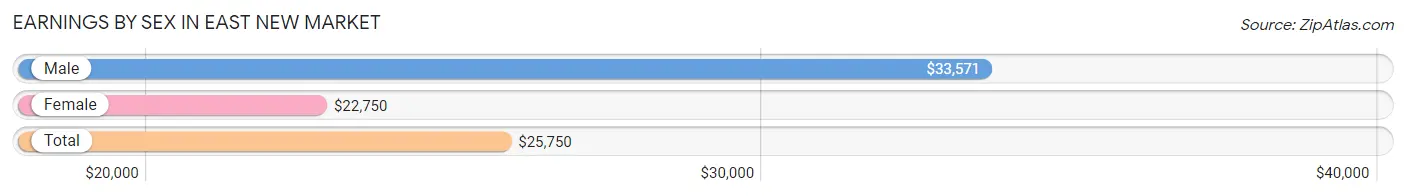
Earnings by Sex in East New Market
Average Earnings in East New Market are $25,750, $33,571 for men and $22,750 for women, a difference of 32.2%.
| Sex | Number | Average Earnings |
| Male | 116 (58.9%) | $33,571 |
| Female | 81 (41.1%) | $22,750 |
| Total | 197 (100.0%) | $25,750 |
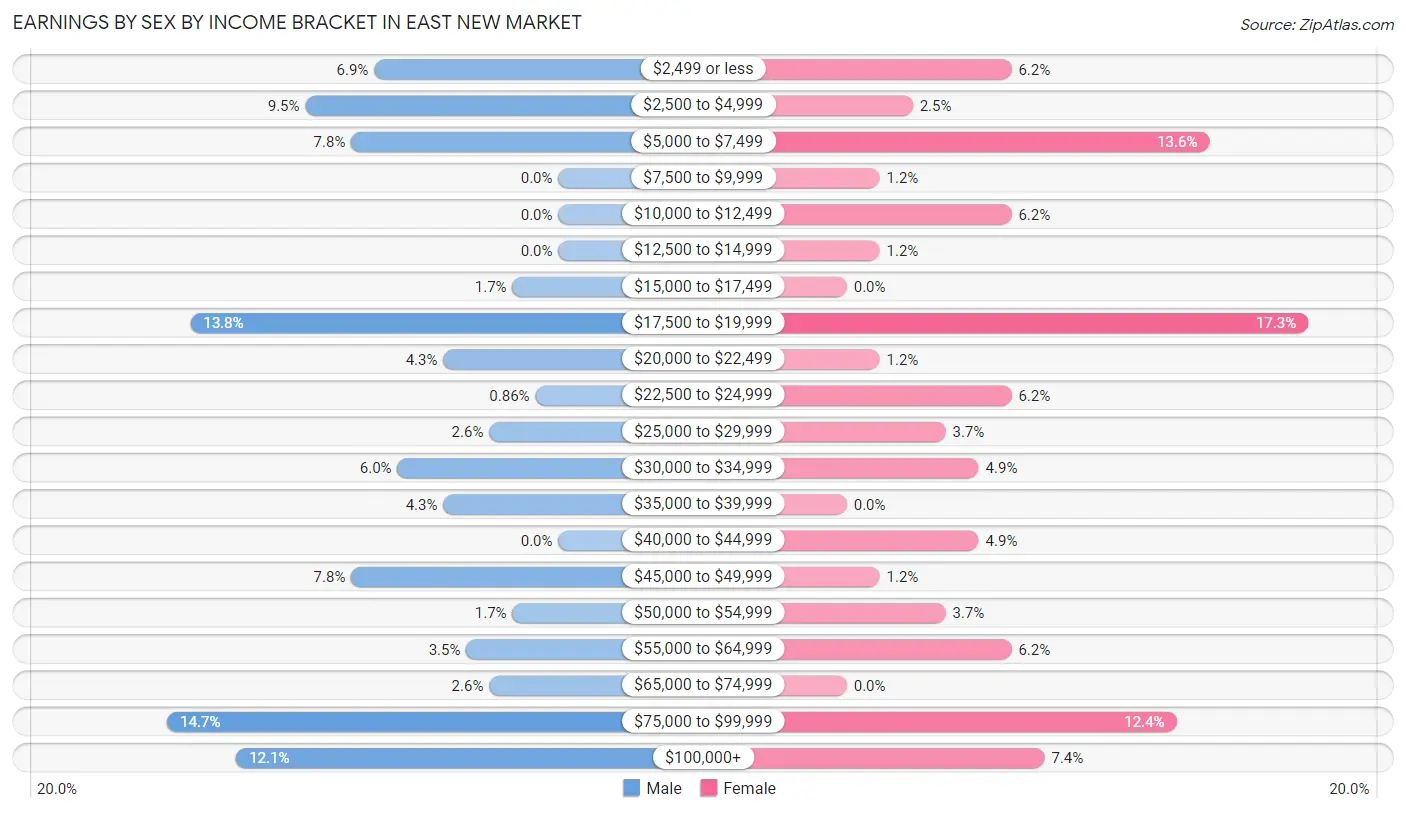
Earnings by Sex by Income Bracket in East New Market
The most common earnings brackets in East New Market are $75,000 to $99,999 for men (17 | 14.7%) and $17,500 to $19,999 for women (14 | 17.3%).
| Income | Male | Female |
| $2,499 or less | 8 (6.9%) | 5 (6.2%) |
| $2,500 to $4,999 | 11 (9.5%) | 2 (2.5%) |
| $5,000 to $7,499 | 9 (7.8%) | 11 (13.6%) |
| $7,500 to $9,999 | 0 (0.0%) | 1 (1.2%) |
| $10,000 to $12,499 | 0 (0.0%) | 5 (6.2%) |
| $12,500 to $14,999 | 0 (0.0%) | 1 (1.2%) |
| $15,000 to $17,499 | 2 (1.7%) | 0 (0.0%) |
| $17,500 to $19,999 | 16 (13.8%) | 14 (17.3%) |
| $20,000 to $22,499 | 5 (4.3%) | 1 (1.2%) |
| $22,500 to $24,999 | 1 (0.9%) | 5 (6.2%) |
| $25,000 to $29,999 | 3 (2.6%) | 3 (3.7%) |
| $30,000 to $34,999 | 7 (6.0%) | 4 (4.9%) |
| $35,000 to $39,999 | 5 (4.3%) | 0 (0.0%) |
| $40,000 to $44,999 | 0 (0.0%) | 4 (4.9%) |
| $45,000 to $49,999 | 9 (7.8%) | 1 (1.2%) |
| $50,000 to $54,999 | 2 (1.7%) | 3 (3.7%) |
| $55,000 to $64,999 | 4 (3.5%) | 5 (6.2%) |
| $65,000 to $74,999 | 3 (2.6%) | 0 (0.0%) |
| $75,000 to $99,999 | 17 (14.7%) | 10 (12.3%) |
| $100,000+ | 14 (12.1%) | 6 (7.4%) |
| Total | 116 (100.0%) | 81 (100.0%) |
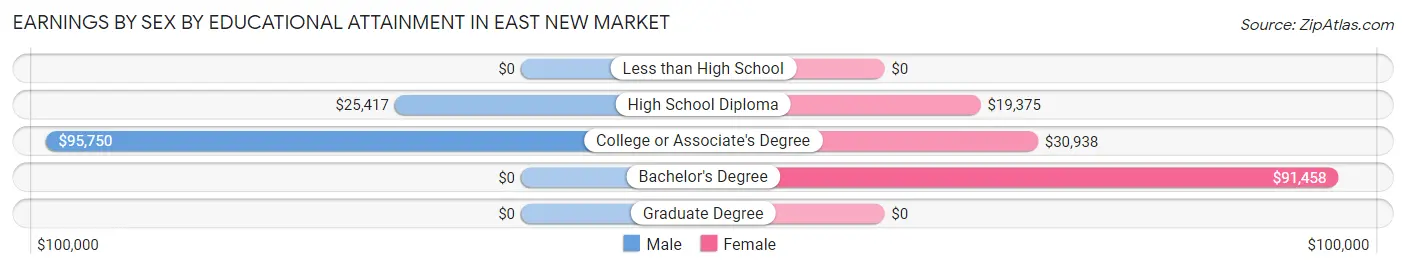
Earnings by Sex by Educational Attainment in East New Market
Average earnings in East New Market are $36,250 for men and $28,750 for women, a difference of 20.7%. Men with an educational attainment of college or associate's degree enjoy the highest average annual earnings of $95,750, while those with high school diploma education earn the least with $25,417. Women with an educational attainment of bachelor's degree earn the most with the average annual earnings of $91,458, while those with high school diploma education have the smallest earnings of $19,375.
| Educational Attainment | Male Income | Female Income |
| Less than High School | - | - |
| High School Diploma | $25,417 | $19,375 |
| College or Associate's Degree | $95,750 | $30,938 |
| Bachelor's Degree | - | - |
| Graduate Degree | - | - |
| Total | $36,250 | $28,750 |
Family Income in East New Market
Family Income Brackets in East New Market
According to the East New Market family income data, there are 21 families falling into the $75,000 to $99,999 income range, which is the most common income bracket and makes up 25.3% of all families.
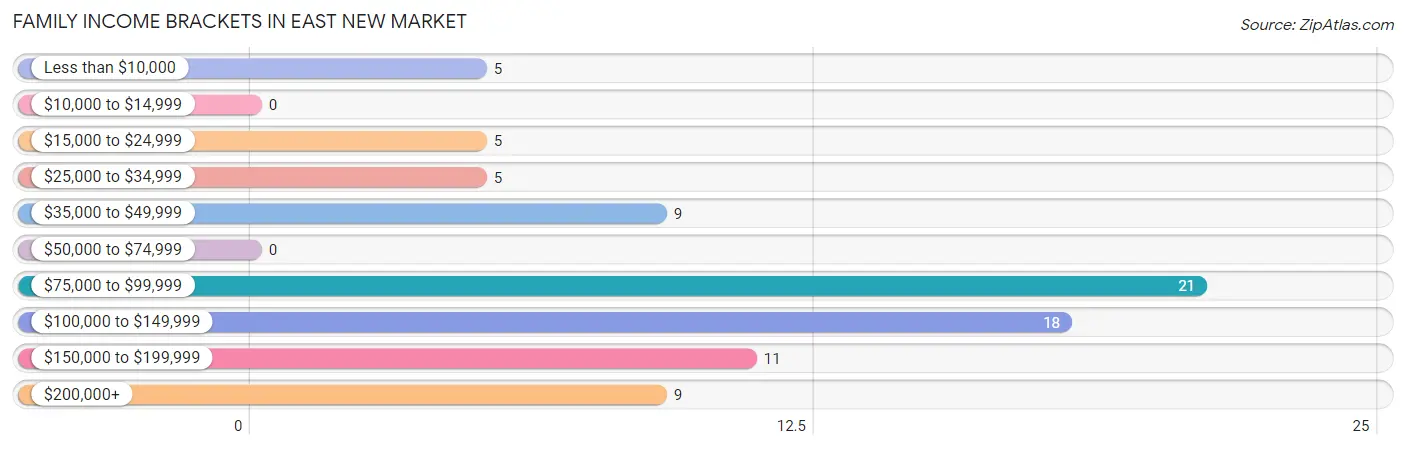
| Income Bracket | # Families | % Families |
| Less than $10,000 | 5 | 6.0% |
| $10,000 to $14,999 | 0 | 0.0% |
| $15,000 to $24,999 | 5 | 6.0% |
| $25,000 to $34,999 | 5 | 6.0% |
| $35,000 to $49,999 | 9 | 10.8% |
| $50,000 to $74,999 | 0 | 0.0% |
| $75,000 to $99,999 | 21 | 25.3% |
| $100,000 to $149,999 | 18 | 21.7% |
| $150,000 to $199,999 | 11 | 13.3% |
| $200,000+ | 9 | 10.8% |
Family Income by Famaliy Size in East New Market
4-person families (25 | 30.1%) account for the highest median family income in East New Market with $98,438 per family, while 2-person families (28 | 33.7%) have the highest median income of $46,944 per family member.
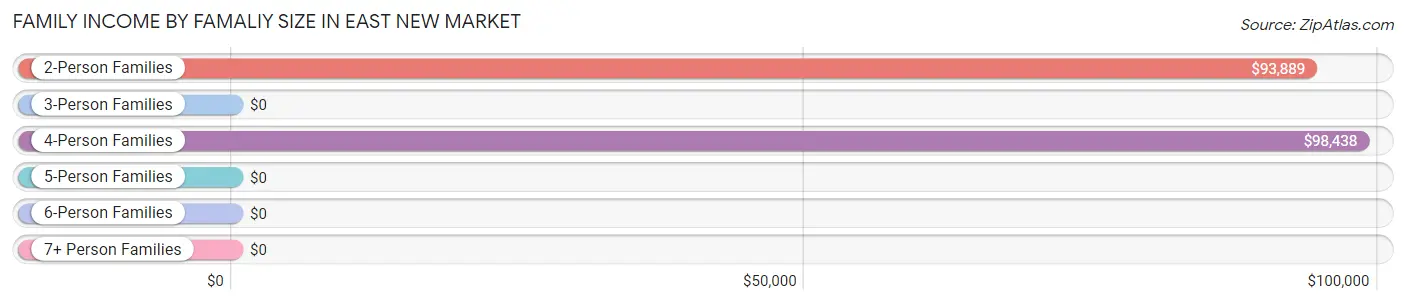
| Income Bracket | # Families | Median Income |
| 2-Person Families | 28 (33.7%) | $93,889 |
| 3-Person Families | 14 (16.9%) | $0 |
| 4-Person Families | 25 (30.1%) | $98,438 |
| 5-Person Families | 14 (16.9%) | $0 |
| 6-Person Families | 2 (2.4%) | $0 |
| 7+ Person Families | 0 (0.0%) | $0 |
| Total | 83 (100.0%) | $97,813 |
Family Income by Number of Earners in East New Market
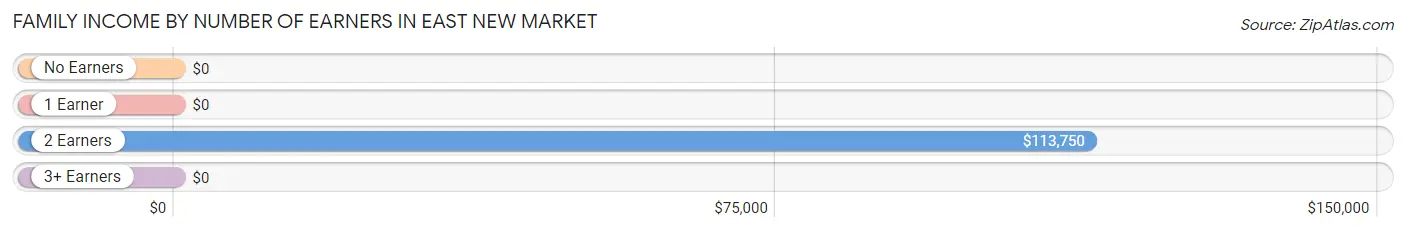
| Number of Earners | # Families | Median Income |
| No Earners | 5 (6.0%) | $0 |
| 1 Earner | 22 (26.5%) | $0 |
| 2 Earners | 36 (43.4%) | $113,750 |
| 3+ Earners | 20 (24.1%) | $0 |
| Total | 83 (100.0%) | $97,813 |
Household Income in East New Market
Household Income Brackets in East New Market
With 27 households falling in the category, the $15,000 to $24,999 income range is the most frequent in East New Market, accounting for 17.1% of all households. In contrast, only 5 households (3.2%) fall into the $10,000 to $14,999 income bracket, making it the least populous group.
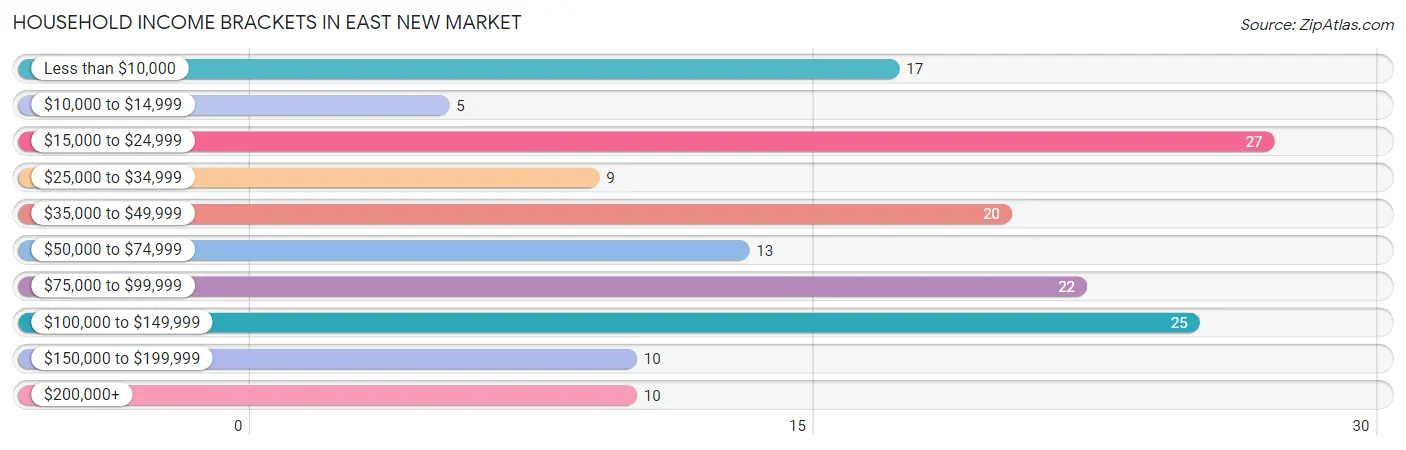
| Income Bracket | # Households | % Households |
| Less than $10,000 | 17 | 10.8% |
| $10,000 to $14,999 | 5 | 3.2% |
| $15,000 to $24,999 | 27 | 17.1% |
| $25,000 to $34,999 | 9 | 5.7% |
| $35,000 to $49,999 | 20 | 12.7% |
| $50,000 to $74,999 | 13 | 8.2% |
| $75,000 to $99,999 | 22 | 13.9% |
| $100,000 to $149,999 | 25 | 15.8% |
| $150,000 to $199,999 | 10 | 6.3% |
| $200,000+ | 10 | 6.3% |
Household Income by Householder Age in East New Market
The median household income in East New Market is $50,417, with the highest median household income of $94,732 found in the 45 to 64 years age bracket for the primary householder. A total of 67 households (42.4%) fall into this category.

| Income Bracket | # Households | Median Income |
| 15 to 24 Years | 0 (0.0%) | $0 |
| 25 to 44 Years | 30 (19.0%) | $50,625 |
| 45 to 64 Years | 67 (42.4%) | $94,732 |
| 65+ Years | 61 (38.6%) | $40,156 |
| Total | 158 (100.0%) | $50,417 |
Poverty in East New Market
Income Below Poverty by Sex and Age in East New Market
With 9.5% poverty level for males and 24.2% for females among the residents of East New Market, 5 year old males and 35 to 44 year old females are the most vulnerable to poverty, with 4 males (100.0%) and 5 females (71.4%) in their respective age groups living below the poverty level.
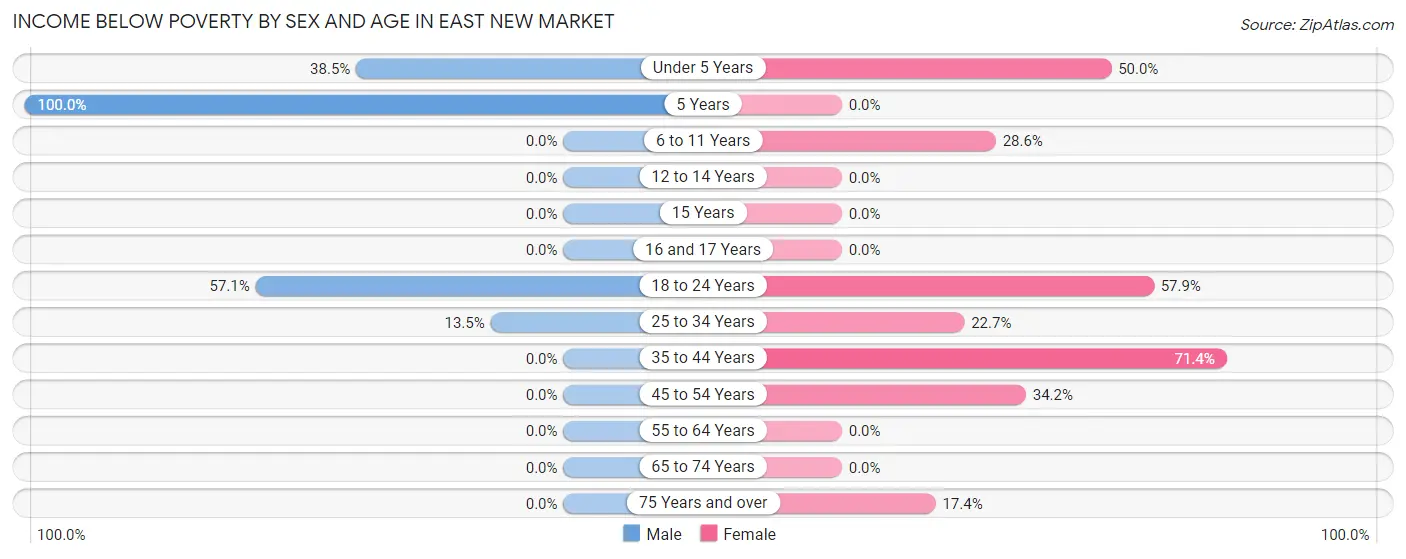
| Age Bracket | Male | Female |
| Under 5 Years | 5 (38.5%) | 5 (50.0%) |
| 5 Years | 4 (100.0%) | 0 (0.0%) |
| 6 to 11 Years | 0 (0.0%) | 4 (28.6%) |
| 12 to 14 Years | 0 (0.0%) | 0 (0.0%) |
| 15 Years | 0 (0.0%) | 0 (0.0%) |
| 16 and 17 Years | 0 (0.0%) | 0 (0.0%) |
| 18 to 24 Years | 4 (57.1%) | 11 (57.9%) |
| 25 to 34 Years | 5 (13.5%) | 5 (22.7%) |
| 35 to 44 Years | 0 (0.0%) | 5 (71.4%) |
| 45 to 54 Years | 0 (0.0%) | 14 (34.2%) |
| 55 to 64 Years | 0 (0.0%) | 0 (0.0%) |
| 65 to 74 Years | 0 (0.0%) | 0 (0.0%) |
| 75 Years and over | 0 (0.0%) | 4 (17.4%) |
| Total | 18 (9.5%) | 48 (24.2%) |
Income Above Poverty by Sex and Age in East New Market
According to the poverty statistics in East New Market, males aged 6 to 11 years and females aged 5 years are the age groups that are most secure financially, with 100.0% of males and 100.0% of females in these age groups living above the poverty line.
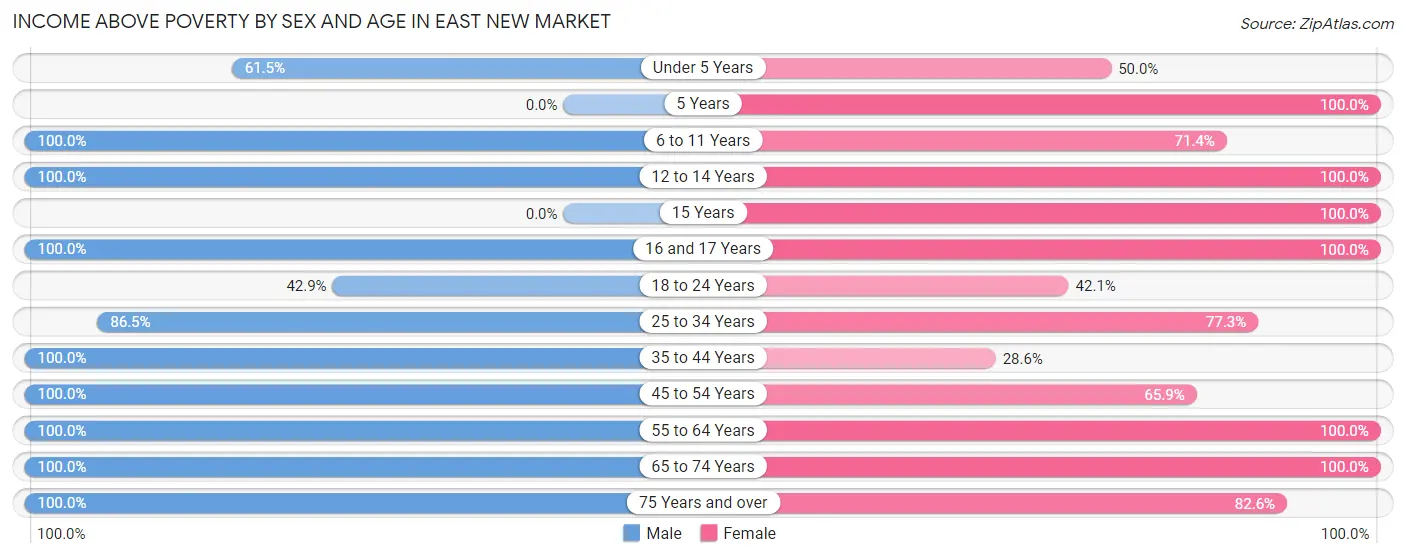
| Age Bracket | Male | Female |
| Under 5 Years | 8 (61.5%) | 5 (50.0%) |
| 5 Years | 0 (0.0%) | 1 (100.0%) |
| 6 to 11 Years | 4 (100.0%) | 10 (71.4%) |
| 12 to 14 Years | 5 (100.0%) | 1 (100.0%) |
| 15 Years | 0 (0.0%) | 3 (100.0%) |
| 16 and 17 Years | 12 (100.0%) | 4 (100.0%) |
| 18 to 24 Years | 3 (42.9%) | 8 (42.1%) |
| 25 to 34 Years | 32 (86.5%) | 17 (77.3%) |
| 35 to 44 Years | 27 (100.0%) | 2 (28.6%) |
| 45 to 54 Years | 31 (100.0%) | 27 (65.8%) |
| 55 to 64 Years | 14 (100.0%) | 13 (100.0%) |
| 65 to 74 Years | 13 (100.0%) | 40 (100.0%) |
| 75 Years and over | 22 (100.0%) | 19 (82.6%) |
| Total | 171 (90.5%) | 150 (75.8%) |
Income Below Poverty Among Married-Couple Families in East New Market
The poverty statistics for married-couple families in East New Market show that 7.9% or 5 of the total 63 families live below the poverty line. Families with 1 or 2 children have the highest poverty rate of 16.1%, comprising of 5 families. On the other hand, families with no children have the lowest poverty rate of 0.0%, which includes 0 families.
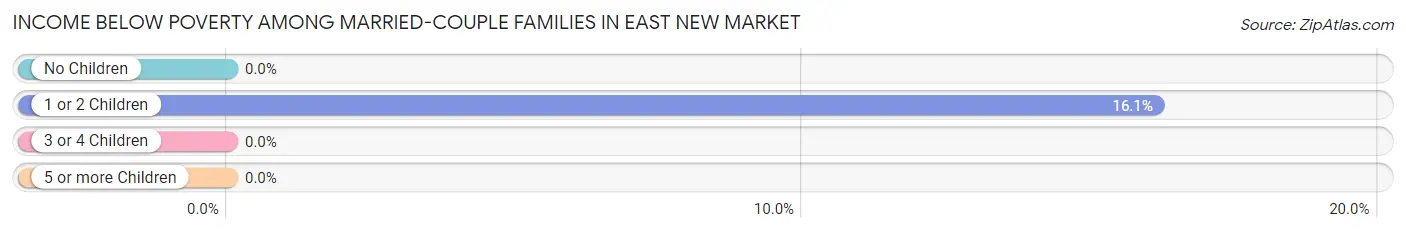
| Children | Above Poverty | Below Poverty |
| No Children | 27 (100.0%) | 0 (0.0%) |
| 1 or 2 Children | 26 (83.9%) | 5 (16.1%) |
| 3 or 4 Children | 5 (100.0%) | 0 (0.0%) |
| 5 or more Children | 0 (0.0%) | 0 (0.0%) |
| Total | 58 (92.1%) | 5 (7.9%) |
Income Below Poverty Among Single-Parent Households in East New Market
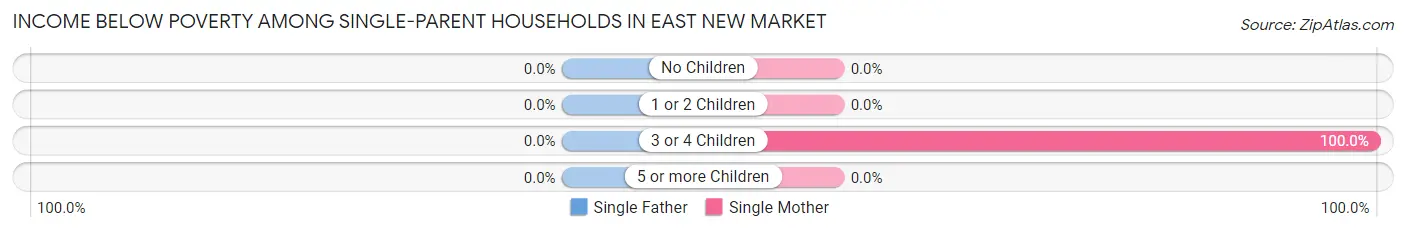
| Children | Single Father | Single Mother |
| No Children | 0 (0.0%) | 0 (0.0%) |
| 1 or 2 Children | 0 (0.0%) | 0 (0.0%) |
| 3 or 4 Children | 0 (0.0%) | 5 (100.0%) |
| 5 or more Children | 0 (0.0%) | 0 (0.0%) |
| Total | 0 (0.0%) | 5 (45.5%) |
Income Below Poverty Among Married-Couple vs Single-Parent Households in East New Market
The poverty data for East New Market shows that 5 of the married-couple family households (7.9%) and 5 of the single-parent households (25.0%) are living below the poverty level. Within the married-couple family households, those with 1 or 2 children have the highest poverty rate, with 5 households (16.1%) falling below the poverty line. Among the single-parent households, those with 3 or 4 children have the highest poverty rate, with 5 household (100.0%) living below poverty.
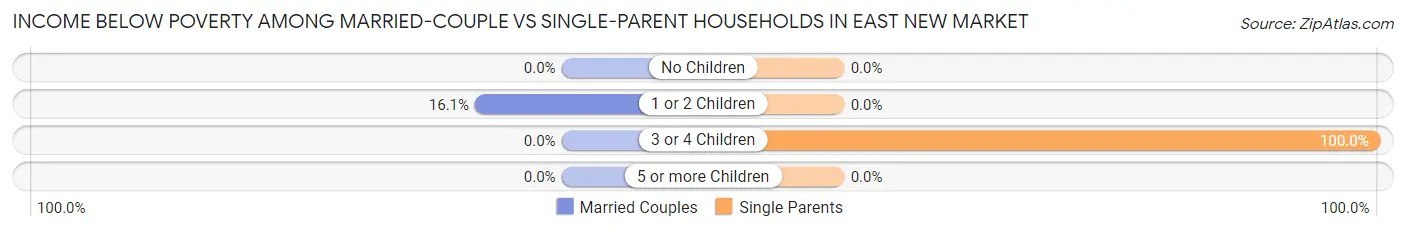
| Children | Married-Couple Families | Single-Parent Households |
| No Children | 0 (0.0%) | 0 (0.0%) |
| 1 or 2 Children | 5 (16.1%) | 0 (0.0%) |
| 3 or 4 Children | 0 (0.0%) | 5 (100.0%) |
| 5 or more Children | 0 (0.0%) | 0 (0.0%) |
| Total | 5 (7.9%) | 5 (25.0%) |
Race in East New Market
The most populous races in East New Market are White / Caucasian (309 | 79.4%), Black / African American (71 | 18.2%), and Two or more Races (9 | 2.3%).
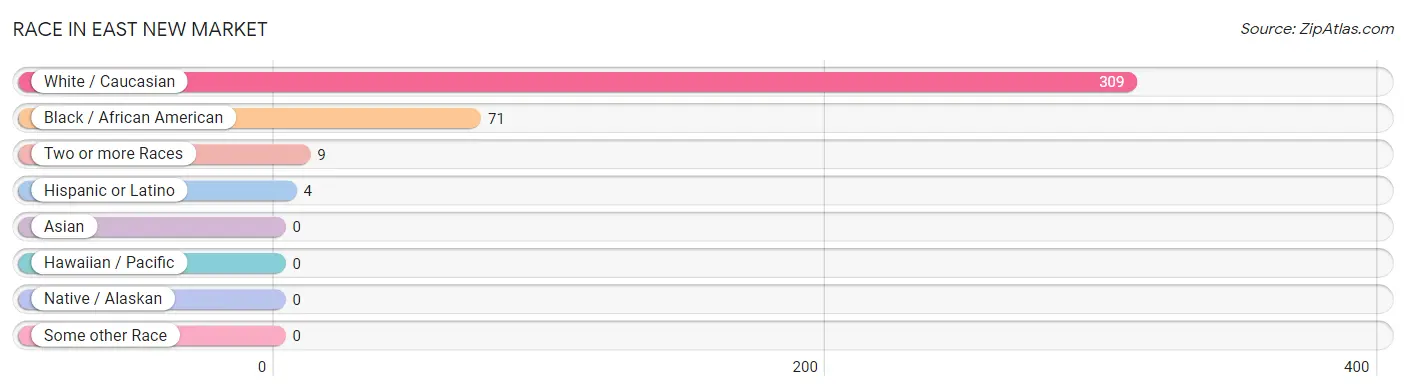
| Race | # Population | % Population |
| Asian | 0 | 0.0% |
| Black / African American | 71 | 18.2% |
| Hawaiian / Pacific | 0 | 0.0% |
| Hispanic or Latino | 4 | 1.0% |
| Native / Alaskan | 0 | 0.0% |
| White / Caucasian | 309 | 79.4% |
| Two or more Races | 9 | 2.3% |
| Some other Race | 0 | 0.0% |
| Total | 389 | 100.0% |
Ancestry in East New Market
The most populous ancestries reported in East New Market are American (113 | 29.0%), English (69 | 17.7%), German (56 | 14.4%), Irish (55 | 14.1%), and French (35 | 9.0%), together accounting for 84.3% of all East New Market residents.
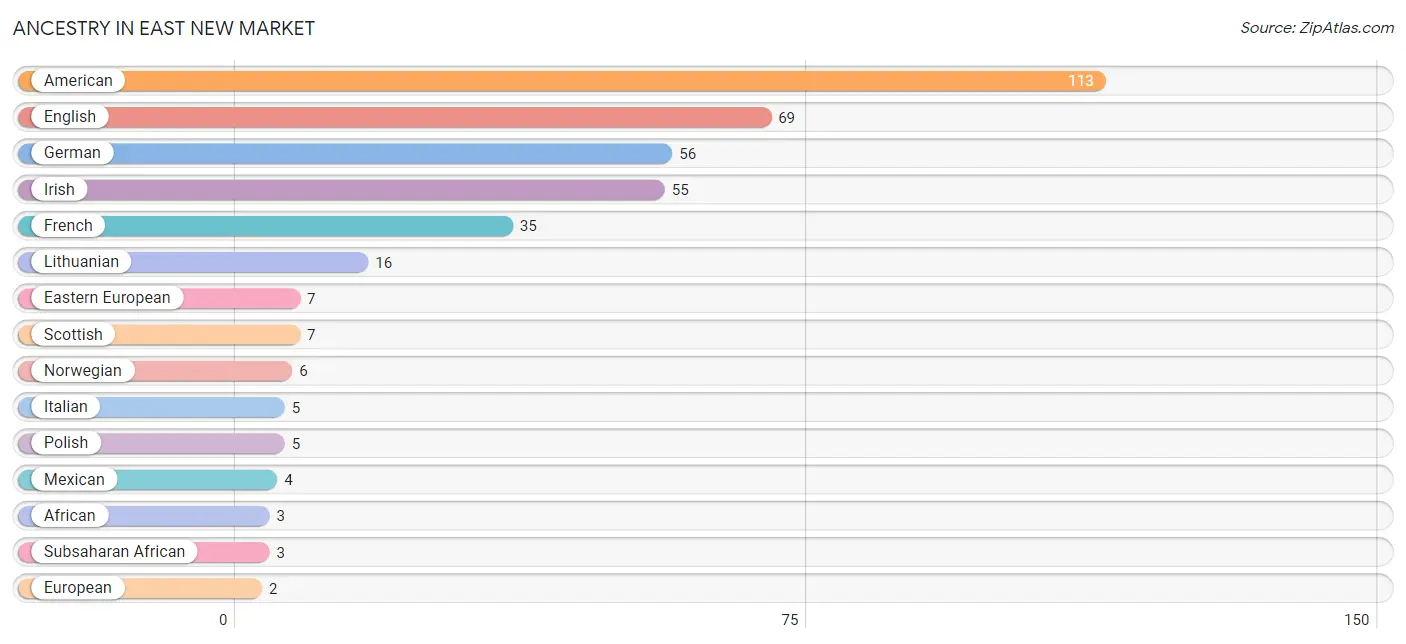
| Ancestry | # Population | % Population |
| African | 3 | 0.8% |
| American | 113 | 29.0% |
| Dutch | 1 | 0.3% |
| Eastern European | 7 | 1.8% |
| English | 69 | 17.7% |
| European | 2 | 0.5% |
| French | 35 | 9.0% |
| German | 56 | 14.4% |
| Irish | 55 | 14.1% |
| Italian | 5 | 1.3% |
| Lithuanian | 16 | 4.1% |
| Mexican | 4 | 1.0% |
| Norwegian | 6 | 1.5% |
| Polish | 5 | 1.3% |
| Scottish | 7 | 1.8% |
| Subsaharan African | 3 | 0.8% | View All 16 Rows |
Immigrants in East New Market

| Immigration Origin | # Population | % Population | View All 0 Rows |
Sex and Age in East New Market
Sex and Age in East New Market
The most populous age groups in East New Market are 30 to 34 Years (36 | 19.1%) for men and 70 to 74 Years (27 | 13.5%) for women.
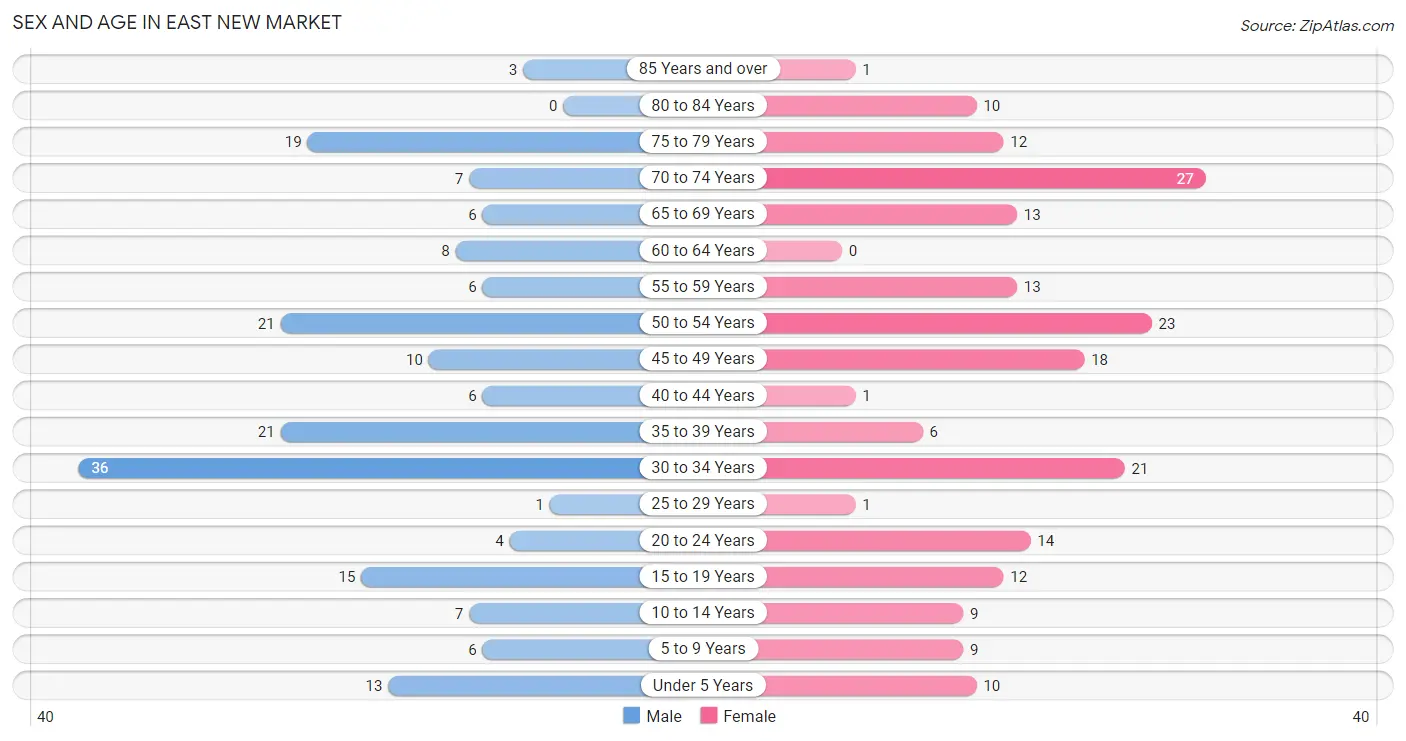
| Age Bracket | Male | Female |
| Under 5 Years | 13 (6.9%) | 10 (5.0%) |
| 5 to 9 Years | 6 (3.2%) | 9 (4.5%) |
| 10 to 14 Years | 7 (3.7%) | 9 (4.5%) |
| 15 to 19 Years | 15 (7.9%) | 12 (6.0%) |
| 20 to 24 Years | 4 (2.1%) | 14 (7.0%) |
| 25 to 29 Years | 1 (0.5%) | 1 (0.5%) |
| 30 to 34 Years | 36 (19.1%) | 21 (10.5%) |
| 35 to 39 Years | 21 (11.1%) | 6 (3.0%) |
| 40 to 44 Years | 6 (3.2%) | 1 (0.5%) |
| 45 to 49 Years | 10 (5.3%) | 18 (9.0%) |
| 50 to 54 Years | 21 (11.1%) | 23 (11.5%) |
| 55 to 59 Years | 6 (3.2%) | 13 (6.5%) |
| 60 to 64 Years | 8 (4.2%) | 0 (0.0%) |
| 65 to 69 Years | 6 (3.2%) | 13 (6.5%) |
| 70 to 74 Years | 7 (3.7%) | 27 (13.5%) |
| 75 to 79 Years | 19 (10.1%) | 12 (6.0%) |
| 80 to 84 Years | 0 (0.0%) | 10 (5.0%) |
| 85 Years and over | 3 (1.6%) | 1 (0.5%) |
| Total | 189 (100.0%) | 200 (100.0%) |
Families and Households in East New Market
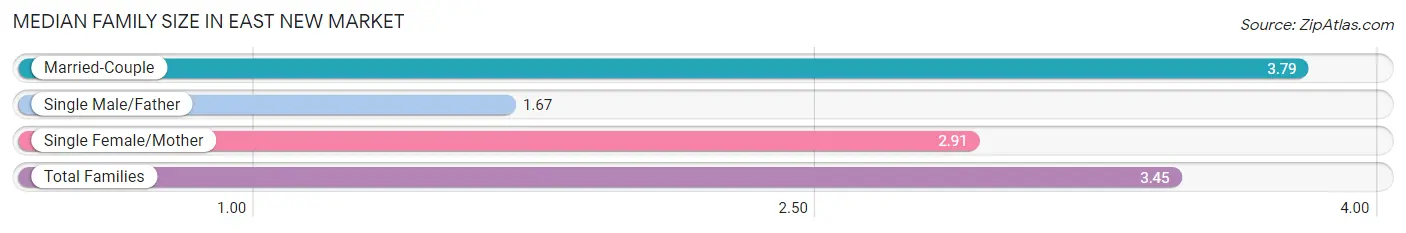
Median Family Size in East New Market
The median family size in East New Market is 3.45 persons per family, with married-couple families (63 | 75.9%) accounting for the largest median family size of 3.79 persons per family. On the other hand, single male/father families (9 | 10.8%) represent the smallest median family size with 1.67 persons per family.
| Family Type | # Families | Family Size |
| Married-Couple | 63 (75.9%) | 3.79 |
| Single Male/Father | 9 (10.8%) | 1.67 |
| Single Female/Mother | 11 (13.3%) | 2.91 |
| Total Families | 83 (100.0%) | 3.45 |
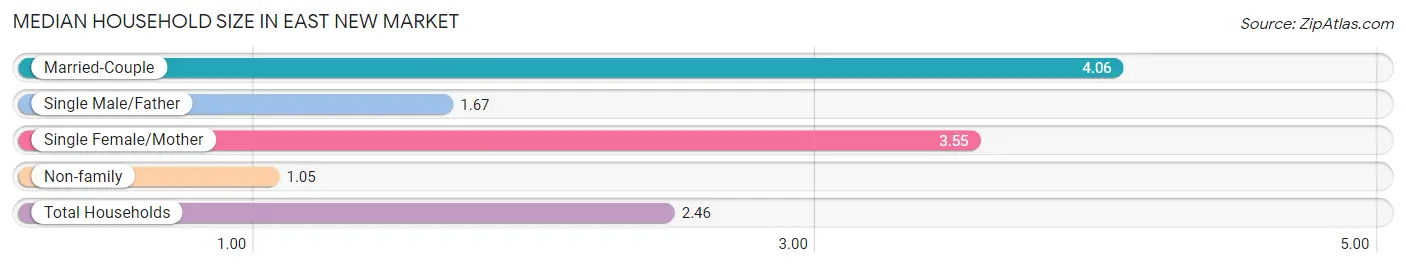
Median Household Size in East New Market
The median household size in East New Market is 2.46 persons per household, with married-couple households (63 | 39.9%) accounting for the largest median household size of 4.06 persons per household. non-family households (75 | 47.5%) represent the smallest median household size with 1.05 persons per household.
| Household Type | # Households | Household Size |
| Married-Couple | 63 (39.9%) | 4.06 |
| Single Male/Father | 9 (5.7%) | 1.67 |
| Single Female/Mother | 11 (7.0%) | 3.55 |
| Non-family | 75 (47.5%) | 1.05 |
| Total Households | 158 (100.0%) | 2.46 |
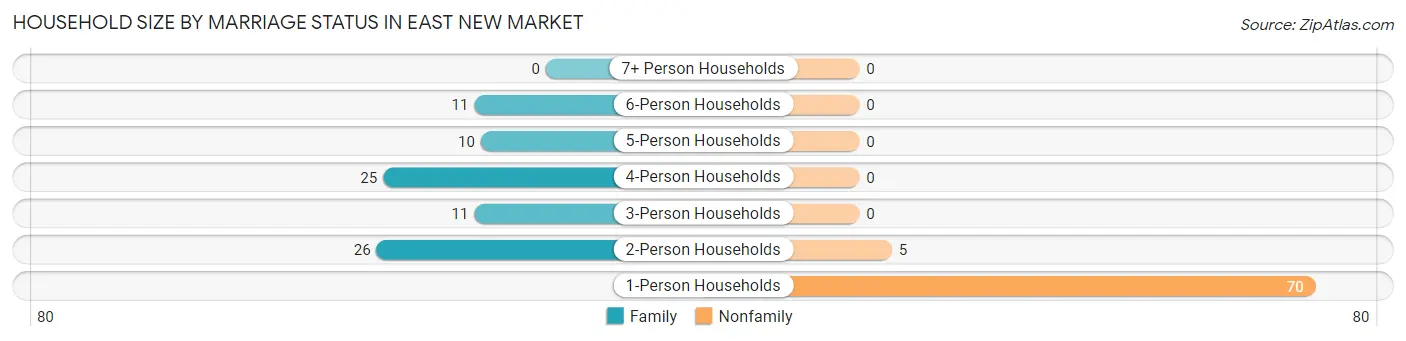
Household Size by Marriage Status in East New Market
Out of a total of 158 households in East New Market, 83 (52.5%) are family households, while 75 (47.5%) are nonfamily households. The most numerous type of family households are 2-person households, comprising 26, and the most common type of nonfamily households are 1-person households, comprising 70.
| Household Size | Family Households | Nonfamily Households |
| 1-Person Households | - | 70 (44.3%) |
| 2-Person Households | 26 (16.5%) | 5 (3.2%) |
| 3-Person Households | 11 (7.0%) | 0 (0.0%) |
| 4-Person Households | 25 (15.8%) | 0 (0.0%) |
| 5-Person Households | 10 (6.3%) | 0 (0.0%) |
| 6-Person Households | 11 (7.0%) | 0 (0.0%) |
| 7+ Person Households | 0 (0.0%) | 0 (0.0%) |
| Total | 83 (52.5%) | 75 (47.5%) |
Female Fertility in East New Market
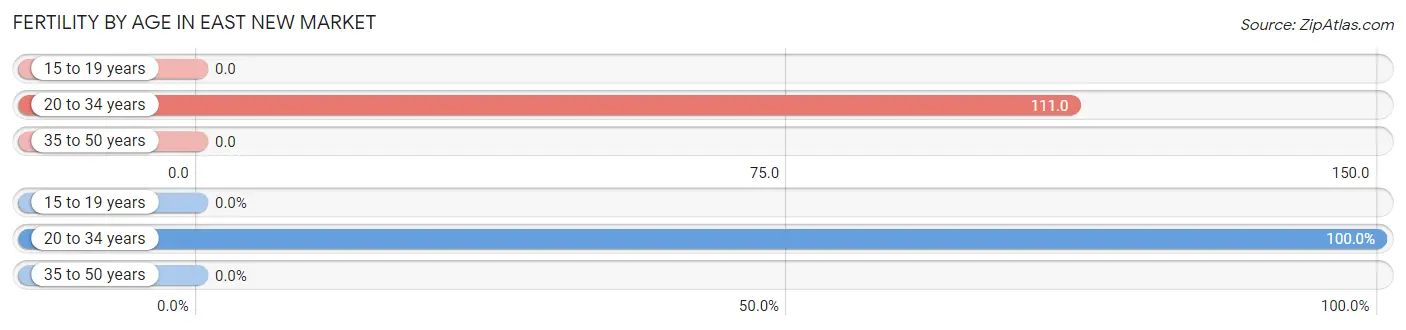
Fertility by Age in East New Market
Average fertility rate in East New Market is 55.0 births per 1,000 women. Women in the age bracket of 20 to 34 years have the highest fertility rate with 111.0 births per 1,000 women. Women in the age bracket of 20 to 34 years acount for 100.0% of all women with births.
| Age Bracket | Women with Births | Births / 1,000 Women |
| 15 to 19 years | 0 (0.0%) | 0.0 |
| 20 to 34 years | 4 (100.0%) | 111.0 |
| 35 to 50 years | 0 (0.0%) | 0.0 |
| Total | 4 (100.0%) | 55.0 |
Fertility by Age by Marriage Status in East New Market
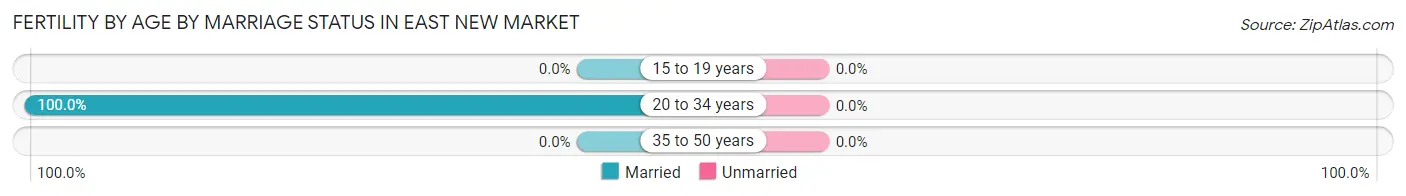
| Age Bracket | Married | Unmarried |
| 15 to 19 years | 0 (0.0%) | 0 (0.0%) |
| 20 to 34 years | 4 (100.0%) | 0 (0.0%) |
| 35 to 50 years | 0 (0.0%) | 0 (0.0%) |
| Total | 4 (100.0%) | 0 (0.0%) |
Fertility by Education in East New Market
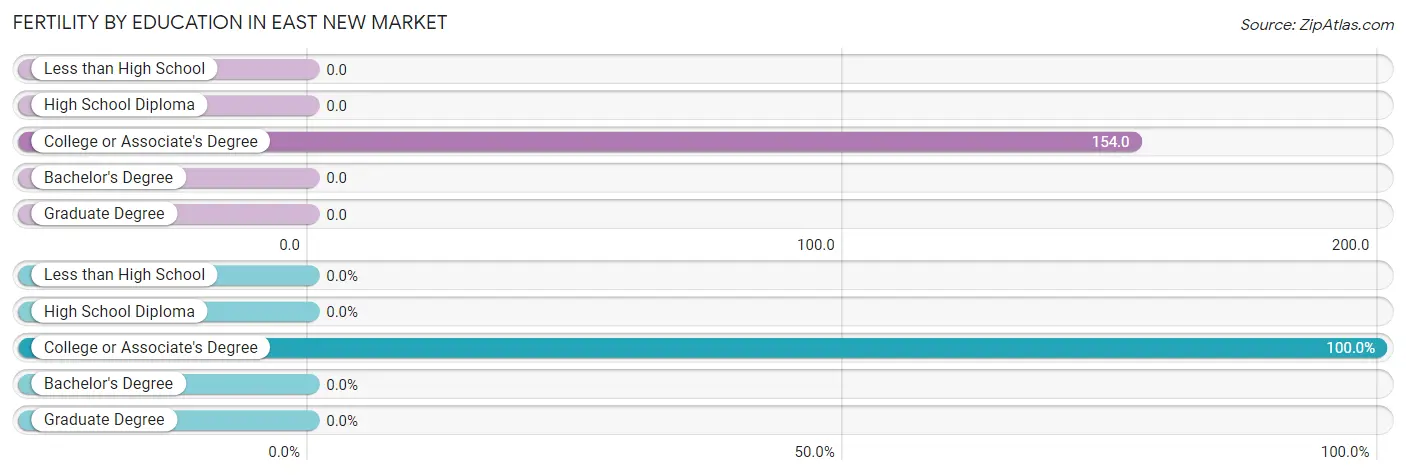
| Educational Attainment | Women with Births | Births / 1,000 Women |
| Less than High School | 0 (0.0%) | 0.0 |
| High School Diploma | 0 (0.0%) | 0.0 |
| College or Associate's Degree | 4 (100.0%) | 154.0 |
| Bachelor's Degree | 0 (0.0%) | 0.0 |
| Graduate Degree | 0 (0.0%) | 0.0 |
| Total | 4 (100.0%) | 55.0 |
Fertility by Education by Marriage Status in East New Market
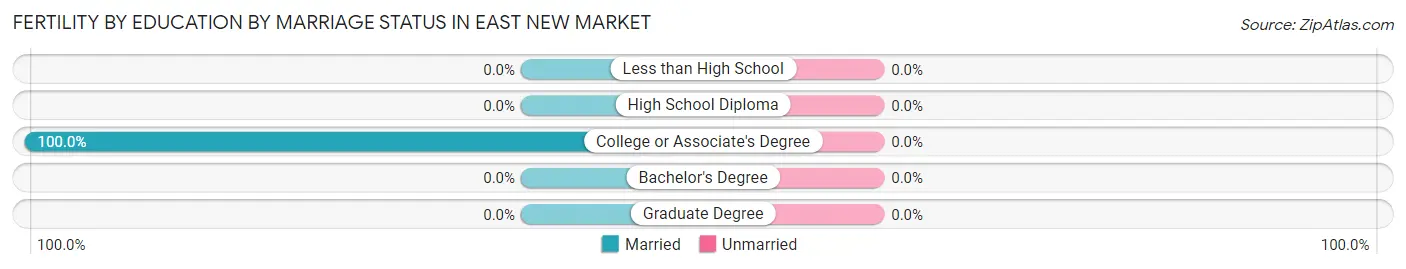
| Educational Attainment | Married | Unmarried |
| Less than High School | 0 (0.0%) | 0 (0.0%) |
| High School Diploma | 0 (0.0%) | 0 (0.0%) |
| College or Associate's Degree | 4 (100.0%) | 0 (0.0%) |
| Bachelor's Degree | 0 (0.0%) | 0 (0.0%) |
| Graduate Degree | 0 (0.0%) | 0 (0.0%) |
| Total | 4 (100.0%) | 0 (0.0%) |
Employment Characteristics in East New Market
Employment by Class of Employer in East New Market
Among the 176 employed individuals in East New Market, private company employees (102 | 58.0%), not-for-profit organizations (18 | 10.2%), and self-employed (not incorporated) (16 | 9.1%) make up the most common classes of employment.
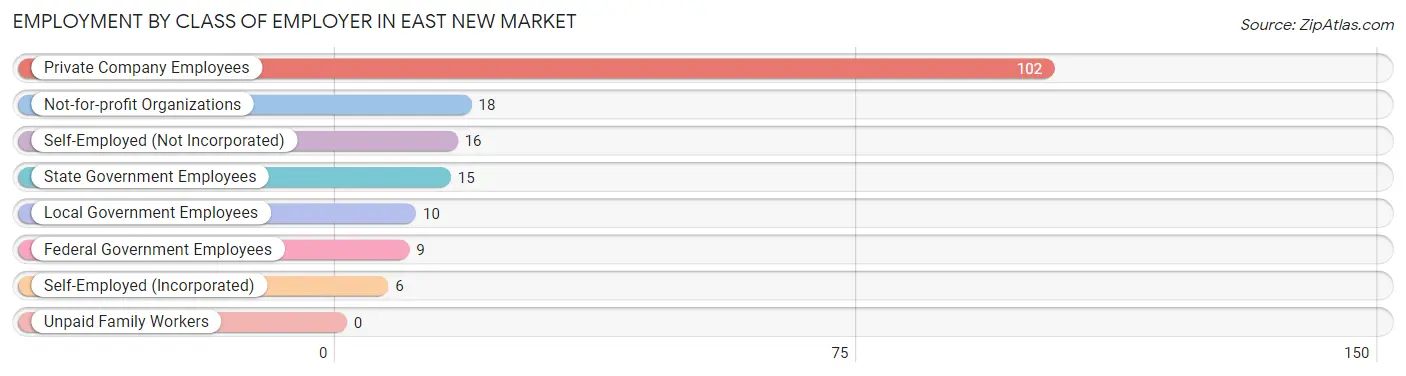
| Employer Class | # Employees | % Employees |
| Private Company Employees | 102 | 58.0% |
| Self-Employed (Incorporated) | 6 | 3.4% |
| Self-Employed (Not Incorporated) | 16 | 9.1% |
| Not-for-profit Organizations | 18 | 10.2% |
| Local Government Employees | 10 | 5.7% |
| State Government Employees | 15 | 8.5% |
| Federal Government Employees | 9 | 5.1% |
| Unpaid Family Workers | 0 | 0.0% |
| Total | 176 | 100.0% |
Employment Status by Age in East New Market
According to the labor force statistics for East New Market, out of the total population over 16 years of age (332), 55.4% or 184 individuals are in the labor force, with 1.1% or 2 of them unemployed. The age group with the highest labor force participation rate is 25 to 29 years, with 100.0% or 2 individuals in the labor force. Within the labor force, the 30 to 34 years age range has the highest percentage of unemployed individuals, with 3.9% or 2 of them being unemployed.
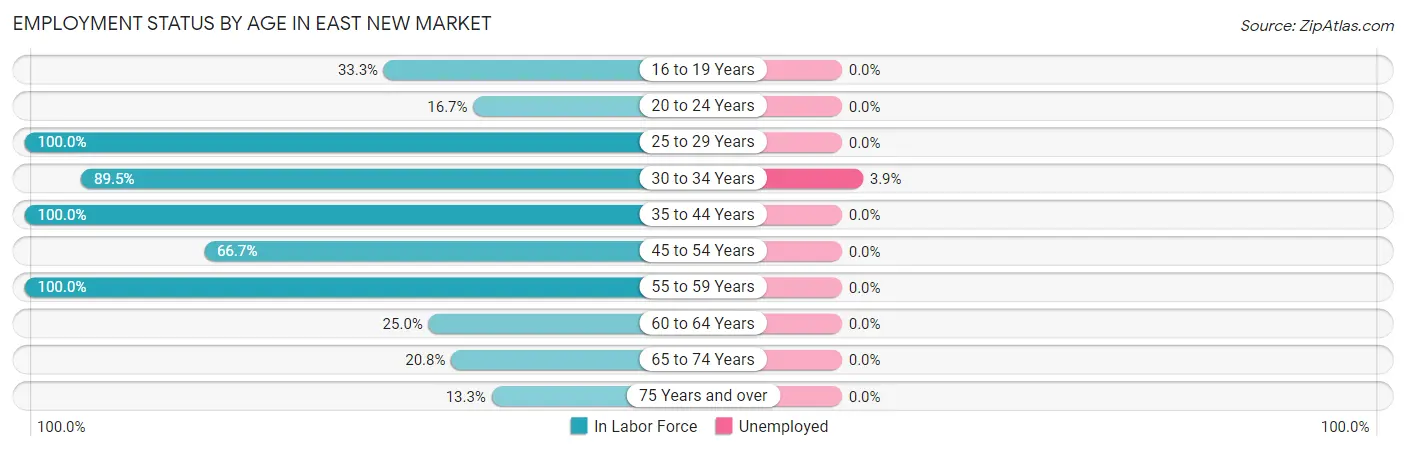
| Age Bracket | In Labor Force | Unemployed |
| 16 to 19 Years | 8 (33.3%) | 0 (0.0%) |
| 20 to 24 Years | 3 (16.7%) | 0 (0.0%) |
| 25 to 29 Years | 2 (100.0%) | 0 (0.0%) |
| 30 to 34 Years | 51 (89.5%) | 2 (3.9%) |
| 35 to 44 Years | 34 (100.0%) | 0 (0.0%) |
| 45 to 54 Years | 48 (66.7%) | 0 (0.0%) |
| 55 to 59 Years | 19 (100.0%) | 0 (0.0%) |
| 60 to 64 Years | 2 (25.0%) | 0 (0.0%) |
| 65 to 74 Years | 11 (20.8%) | 0 (0.0%) |
| 75 Years and over | 6 (13.3%) | 0 (0.0%) |
| Total | 184 (55.4%) | 2 (1.1%) |
Employment Status by Educational Attainment in East New Market
According to labor force statistics for East New Market, 81.3% of individuals (156) out of the total population between 25 and 64 years of age (192) are in the labor force, with 1.3% or 2 of them being unemployed. The group with the highest labor force participation rate are those with the educational attainment of bachelor's degree or higher, with 100.0% or 26 individuals in the labor force. Within the labor force, individuals with high school diploma education have the highest percentage of unemployment, with 2.4% or 2 of them being unemployed.
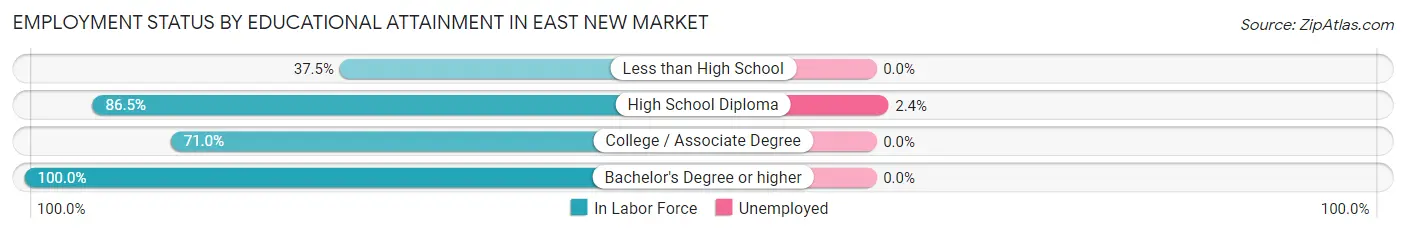
| Educational Attainment | In Labor Force | Unemployed |
| Less than High School | 3 (37.5%) | 0 (0.0%) |
| High School Diploma | 83 (86.5%) | 2 (2.4%) |
| College / Associate Degree | 44 (71.0%) | 0 (0.0%) |
| Bachelor's Degree or higher | 26 (100.0%) | 0 (0.0%) |
| Total | 156 (81.3%) | 2 (1.3%) |
Employment Occupations by Sex in East New Market
Management, Business, Science and Arts Occupations
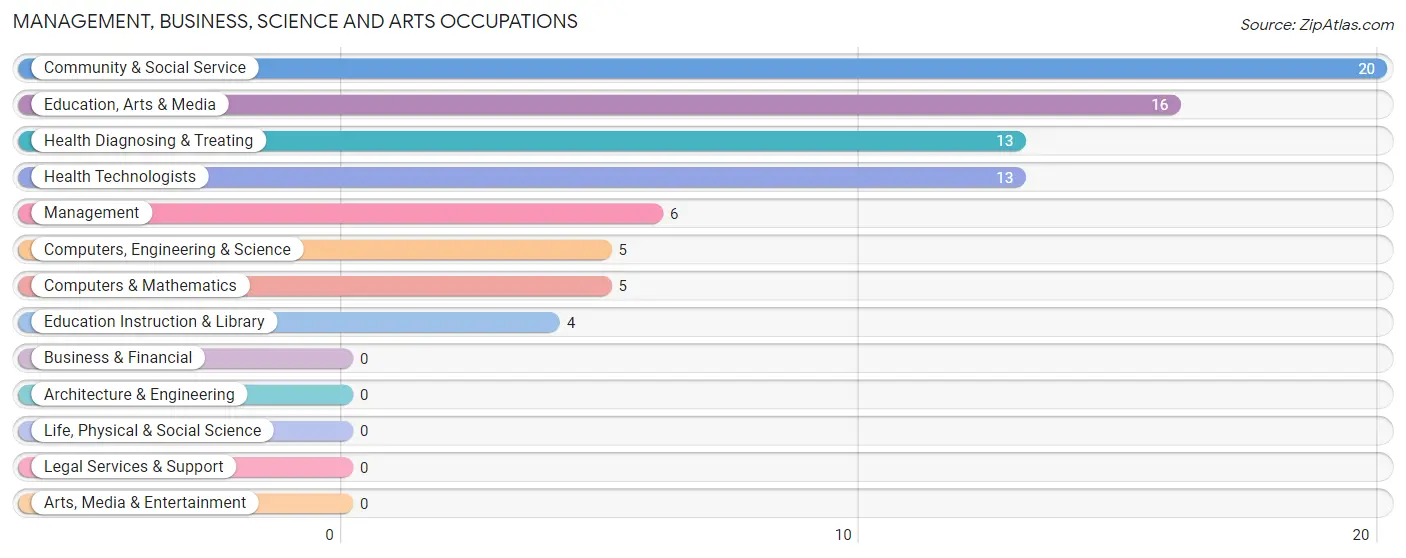
The most common Management, Business, Science and Arts occupations in East New Market are Community & Social Service (20 | 11.0%), Education, Arts & Media (16 | 8.8%), Health Diagnosing & Treating (13 | 7.1%), Health Technologists (13 | 7.1%), and Management (6 | 3.3%).
Management, Business, Science and Arts Occupations by Sex
Within the Management, Business, Science and Arts occupations in East New Market, the most male-oriented occupations are Computers, Engineering & Science (100.0%), Computers & Mathematics (100.0%), and Management (83.3%), while the most female-oriented occupations are Health Diagnosing & Treating (100.0%), Health Technologists (100.0%), and Education Instruction & Library (25.0%).
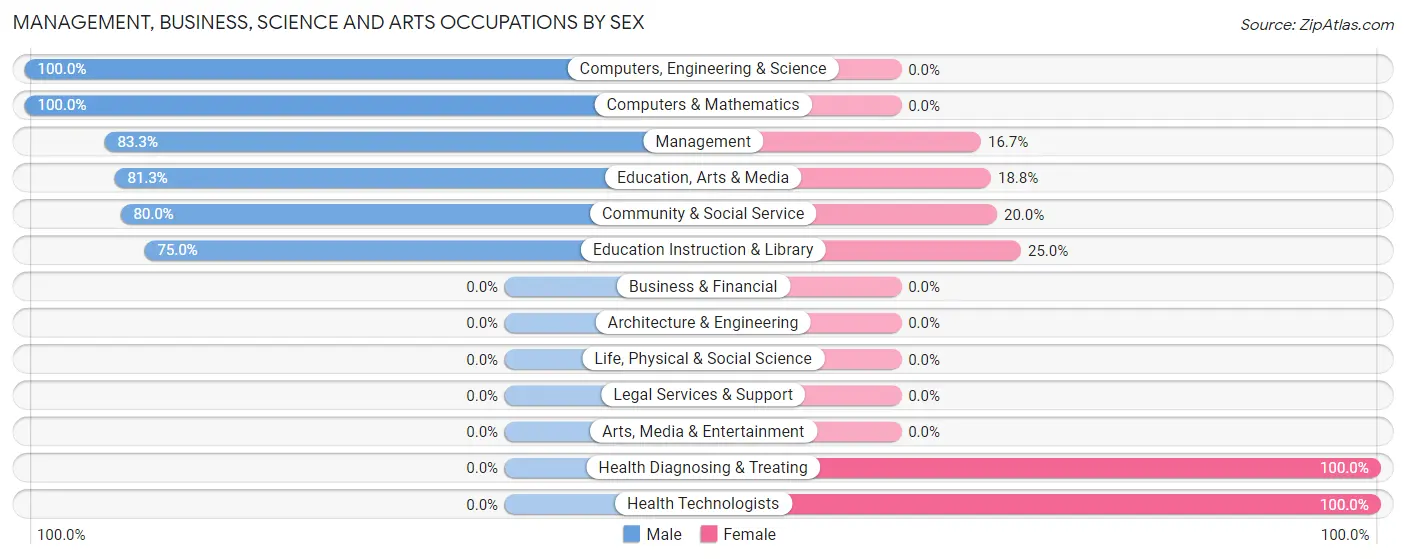
| Occupation | Male | Female |
| Management | 5 (83.3%) | 1 (16.7%) |
| Business & Financial | 0 (0.0%) | 0 (0.0%) |
| Computers, Engineering & Science | 5 (100.0%) | 0 (0.0%) |
| Computers & Mathematics | 5 (100.0%) | 0 (0.0%) |
| Architecture & Engineering | 0 (0.0%) | 0 (0.0%) |
| Life, Physical & Social Science | 0 (0.0%) | 0 (0.0%) |
| Community & Social Service | 16 (80.0%) | 4 (20.0%) |
| Education, Arts & Media | 13 (81.2%) | 3 (18.8%) |
| Legal Services & Support | 0 (0.0%) | 0 (0.0%) |
| Education Instruction & Library | 3 (75.0%) | 1 (25.0%) |
| Arts, Media & Entertainment | 0 (0.0%) | 0 (0.0%) |
| Health Diagnosing & Treating | 0 (0.0%) | 13 (100.0%) |
| Health Technologists | 0 (0.0%) | 13 (100.0%) |
| Total (Category) | 26 (59.1%) | 18 (40.9%) |
| Total (Overall) | 114 (62.6%) | 68 (37.4%) |
Services Occupations
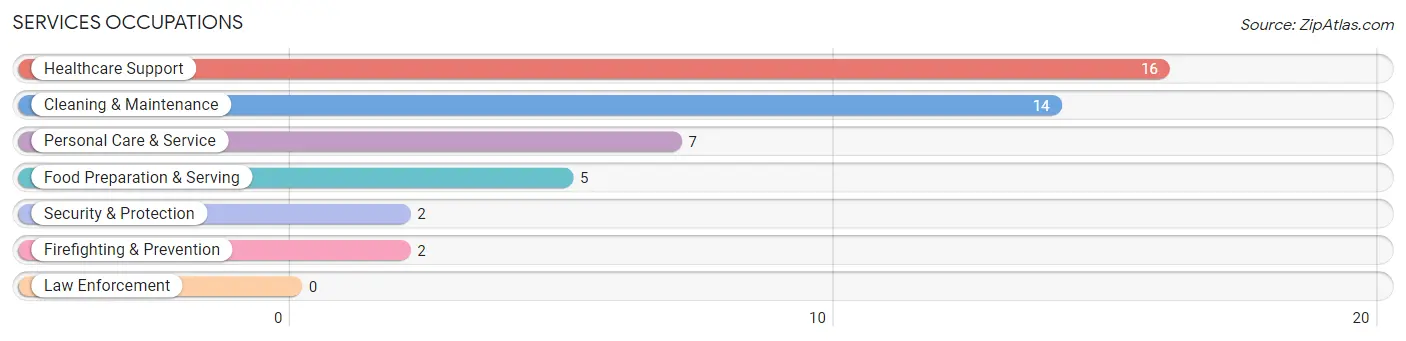
The most common Services occupations in East New Market are Healthcare Support (16 | 8.8%), Cleaning & Maintenance (14 | 7.7%), Personal Care & Service (7 | 3.8%), Food Preparation & Serving (5 | 2.8%), and Security & Protection (2 | 1.1%).
Services Occupations by Sex
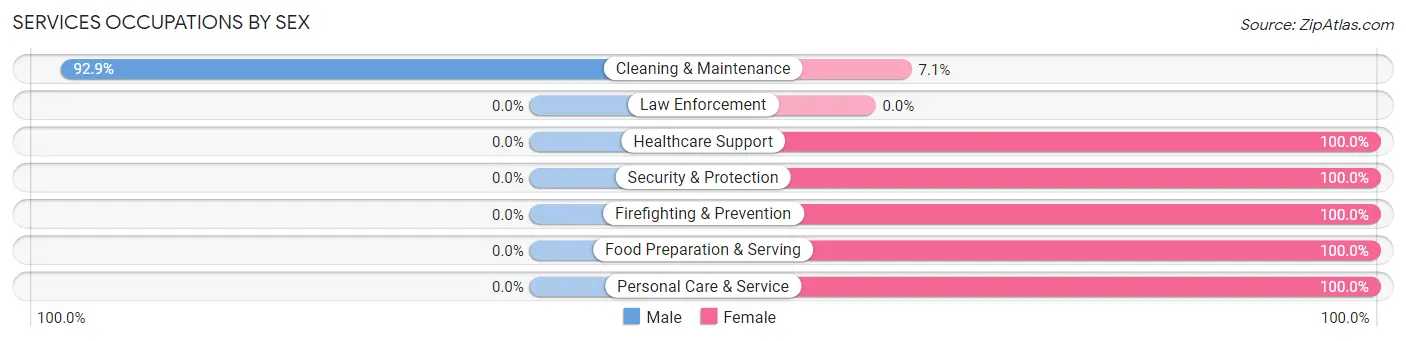
| Occupation | Male | Female |
| Healthcare Support | 0 (0.0%) | 16 (100.0%) |
| Security & Protection | 0 (0.0%) | 2 (100.0%) |
| Firefighting & Prevention | 0 (0.0%) | 2 (100.0%) |
| Law Enforcement | 0 (0.0%) | 0 (0.0%) |
| Food Preparation & Serving | 0 (0.0%) | 5 (100.0%) |
| Cleaning & Maintenance | 13 (92.9%) | 1 (7.1%) |
| Personal Care & Service | 0 (0.0%) | 7 (100.0%) |
| Total (Category) | 13 (29.5%) | 31 (70.5%) |
| Total (Overall) | 114 (62.6%) | 68 (37.4%) |
Sales and Office Occupations
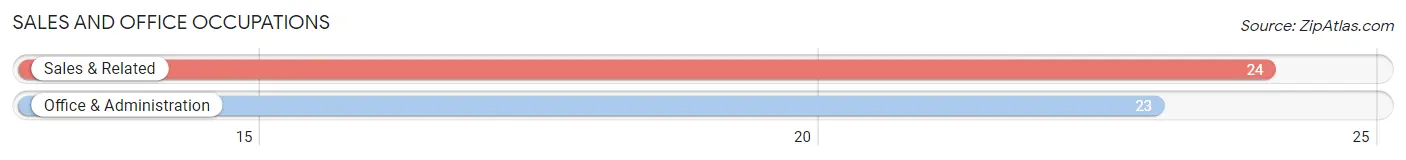
The most common Sales and Office occupations in East New Market are Sales & Related (24 | 13.2%), and Office & Administration (23 | 12.6%).
Sales and Office Occupations by Sex
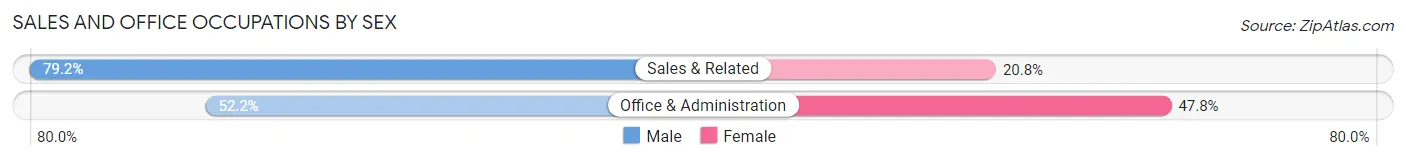
| Occupation | Male | Female |
| Sales & Related | 19 (79.2%) | 5 (20.8%) |
| Office & Administration | 12 (52.2%) | 11 (47.8%) |
| Total (Category) | 31 (66.0%) | 16 (34.0%) |
| Total (Overall) | 114 (62.6%) | 68 (37.4%) |
Natural Resources, Construction and Maintenance Occupations
The most common Natural Resources, Construction and Maintenance occupations in East New Market are Construction & Extraction (24 | 13.2%), Installation, Maintenance & Repair (6 | 3.3%), and Farming, Fishing & Forestry (3 | 1.7%).
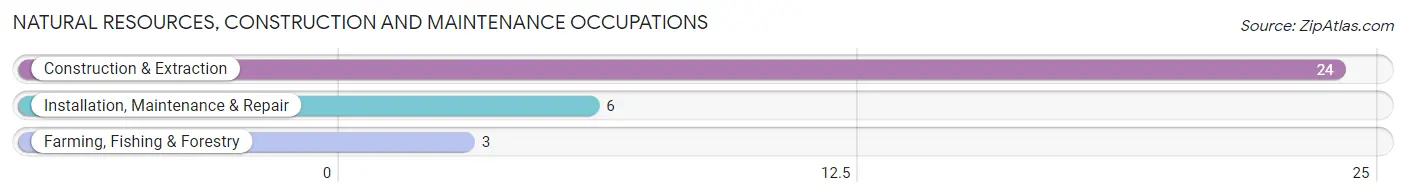
Natural Resources, Construction and Maintenance Occupations by Sex
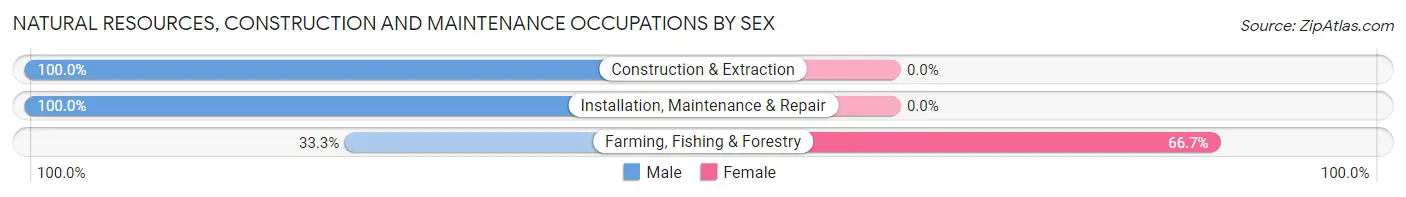
| Occupation | Male | Female |
| Farming, Fishing & Forestry | 1 (33.3%) | 2 (66.7%) |
| Construction & Extraction | 24 (100.0%) | 0 (0.0%) |
| Installation, Maintenance & Repair | 6 (100.0%) | 0 (0.0%) |
| Total (Category) | 31 (93.9%) | 2 (6.1%) |
| Total (Overall) | 114 (62.6%) | 68 (37.4%) |
Production, Transportation and Moving Occupations
The most common Production, Transportation and Moving occupations in East New Market are Transportation (6 | 3.3%), Material Moving (6 | 3.3%), and Production (2 | 1.1%).
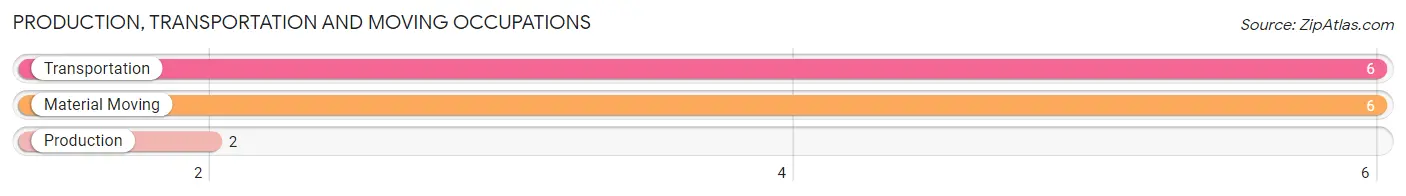
Production, Transportation and Moving Occupations by Sex
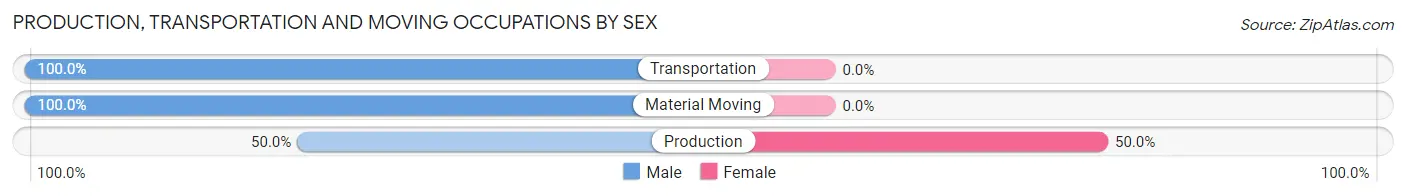
| Occupation | Male | Female |
| Production | 1 (50.0%) | 1 (50.0%) |
| Transportation | 6 (100.0%) | 0 (0.0%) |
| Material Moving | 6 (100.0%) | 0 (0.0%) |
| Total (Category) | 13 (92.9%) | 1 (7.1%) |
| Total (Overall) | 114 (62.6%) | 68 (37.4%) |
Employment Industries by Sex in East New Market
Employment Industries in East New Market
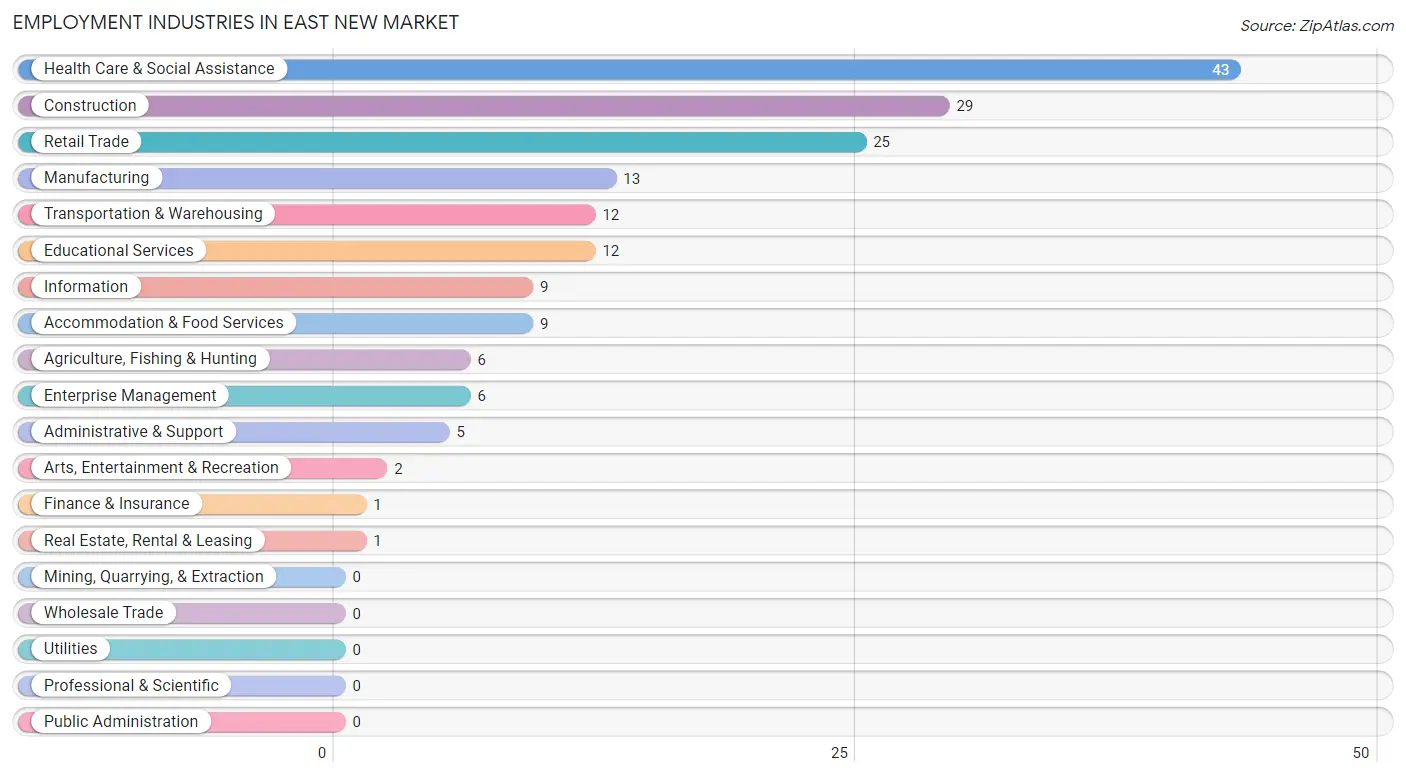
The major employment industries in East New Market include Health Care & Social Assistance (43 | 23.6%), Construction (29 | 15.9%), Retail Trade (25 | 13.7%), Manufacturing (13 | 7.1%), and Transportation & Warehousing (12 | 6.6%).
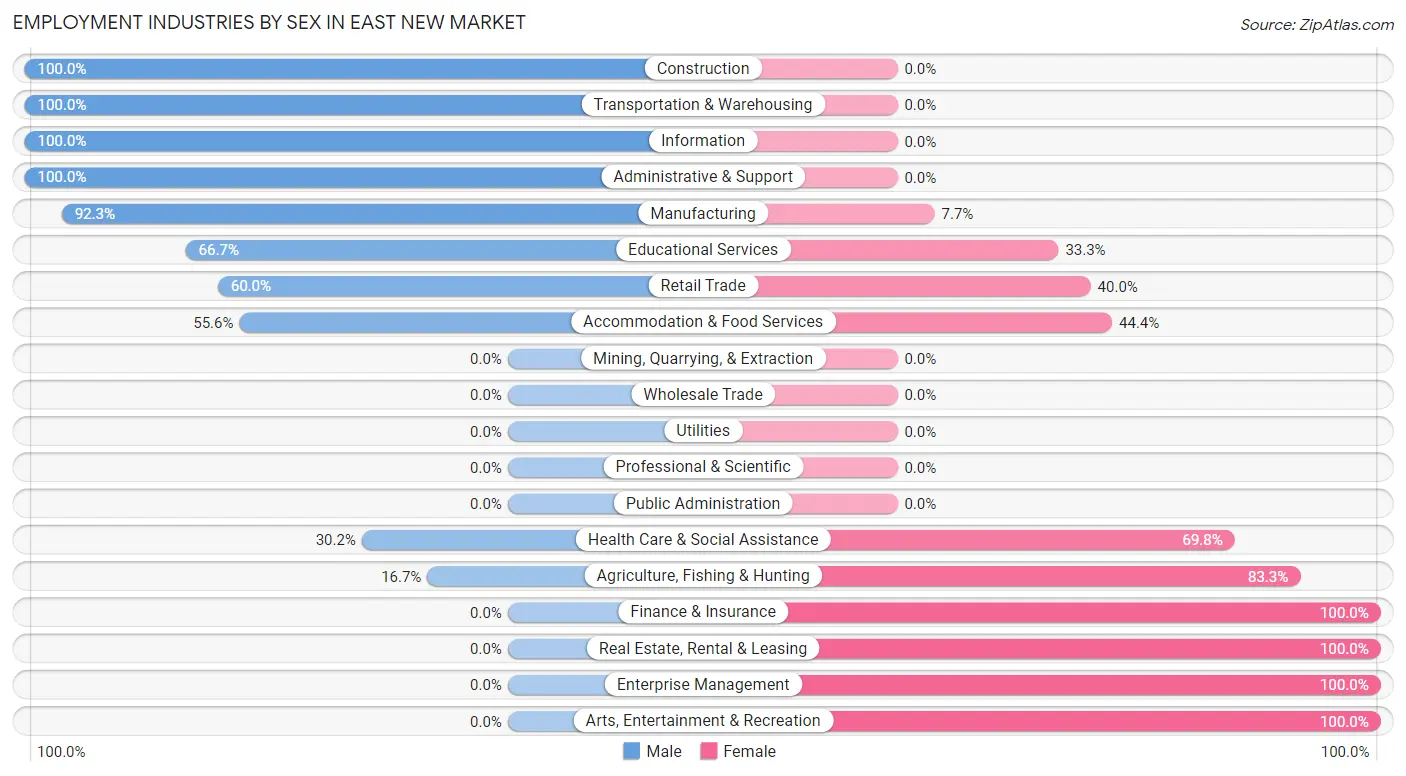
Employment Industries by Sex in East New Market
The East New Market industries that see more men than women are Construction (100.0%), Transportation & Warehousing (100.0%), and Information (100.0%), whereas the industries that tend to have a higher number of women are Finance & Insurance (100.0%), Real Estate, Rental & Leasing (100.0%), and Enterprise Management (100.0%).
| Industry | Male | Female |
| Agriculture, Fishing & Hunting | 1 (16.7%) | 5 (83.3%) |
| Mining, Quarrying, & Extraction | 0 (0.0%) | 0 (0.0%) |
| Construction | 29 (100.0%) | 0 (0.0%) |
| Manufacturing | 12 (92.3%) | 1 (7.7%) |
| Wholesale Trade | 0 (0.0%) | 0 (0.0%) |
| Retail Trade | 15 (60.0%) | 10 (40.0%) |
| Transportation & Warehousing | 12 (100.0%) | 0 (0.0%) |
| Utilities | 0 (0.0%) | 0 (0.0%) |
| Information | 9 (100.0%) | 0 (0.0%) |
| Finance & Insurance | 0 (0.0%) | 1 (100.0%) |
| Real Estate, Rental & Leasing | 0 (0.0%) | 1 (100.0%) |
| Professional & Scientific | 0 (0.0%) | 0 (0.0%) |
| Enterprise Management | 0 (0.0%) | 6 (100.0%) |
| Administrative & Support | 5 (100.0%) | 0 (0.0%) |
| Educational Services | 8 (66.7%) | 4 (33.3%) |
| Health Care & Social Assistance | 13 (30.2%) | 30 (69.8%) |
| Arts, Entertainment & Recreation | 0 (0.0%) | 2 (100.0%) |
| Accommodation & Food Services | 5 (55.6%) | 4 (44.4%) |
| Public Administration | 0 (0.0%) | 0 (0.0%) |
| Total | 114 (62.6%) | 68 (37.4%) |
Education in East New Market
School Enrollment in East New Market
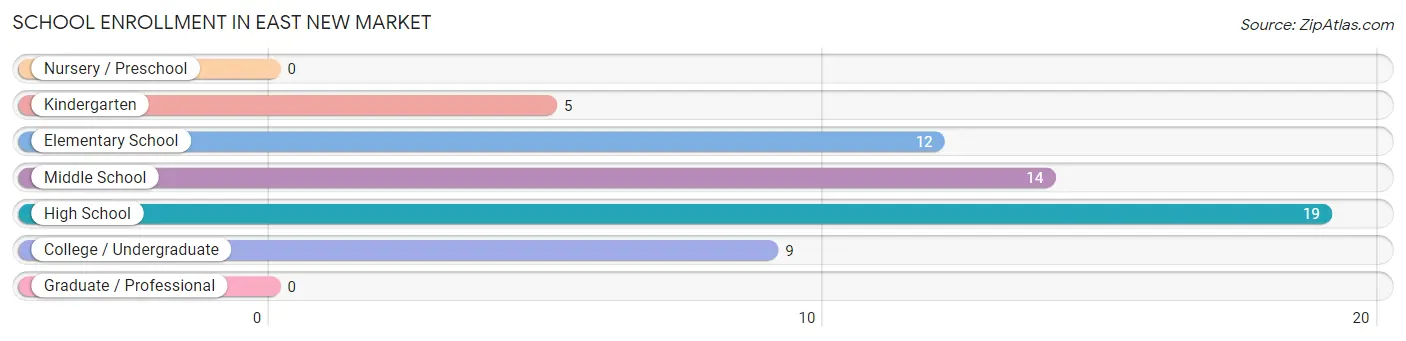
The most common levels of schooling among the 59 students in East New Market are high school (19 | 32.2%), middle school (14 | 23.7%), and elementary school (12 | 20.3%).
| School Level | # Students | % Students |
| Nursery / Preschool | 0 | 0.0% |
| Kindergarten | 5 | 8.5% |
| Elementary School | 12 | 20.3% |
| Middle School | 14 | 23.7% |
| High School | 19 | 32.2% |
| College / Undergraduate | 9 | 15.2% |
| Graduate / Professional | 0 | 0.0% |
| Total | 59 | 100.0% |
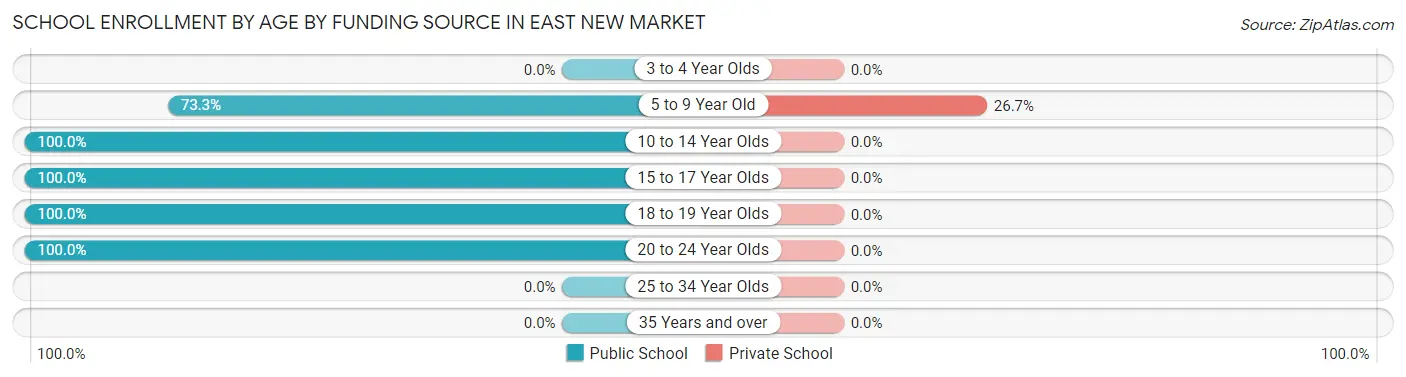
School Enrollment by Age by Funding Source in East New Market
Out of a total of 59 students who are enrolled in schools in East New Market, 4 (6.8%) attend a private institution, while the remaining 55 (93.2%) are enrolled in public schools. The age group of 5 to 9 year old has the highest likelihood of being enrolled in private schools, with 4 (26.7% in the age bracket) enrolled. Conversely, the age group of 10 to 14 year olds has the lowest likelihood of being enrolled in a private school, with 16 (100.0% in the age bracket) attending a public institution.
| Age Bracket | Public School | Private School |
| 3 to 4 Year Olds | 0 (0.0%) | 0 (0.0%) |
| 5 to 9 Year Old | 11 (73.3%) | 4 (26.7%) |
| 10 to 14 Year Olds | 16 (100.0%) | 0 (0.0%) |
| 15 to 17 Year Olds | 19 (100.0%) | 0 (0.0%) |
| 18 to 19 Year Olds | 5 (100.0%) | 0 (0.0%) |
| 20 to 24 Year Olds | 4 (100.0%) | 0 (0.0%) |
| 25 to 34 Year Olds | 0 (0.0%) | 0 (0.0%) |
| 35 Years and over | 0 (0.0%) | 0 (0.0%) |
| Total | 55 (93.2%) | 4 (6.8%) |
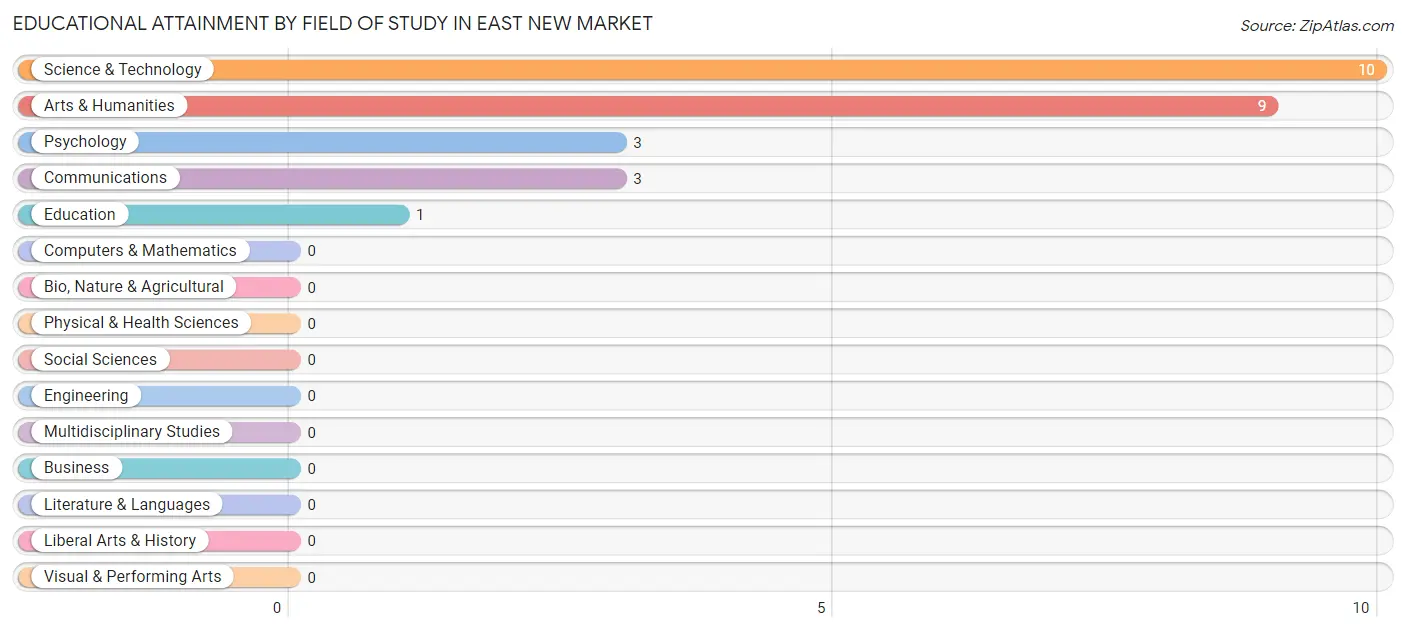
Educational Attainment by Field of Study in East New Market
Science & technology (10 | 38.5%), arts & humanities (9 | 34.6%), psychology (3 | 11.5%), communications (3 | 11.5%), and education (1 | 3.8%) are the most common fields of study among 26 individuals in East New Market who have obtained a bachelor's degree or higher.
| Field of Study | # Graduates | % Graduates |
| Computers & Mathematics | 0 | 0.0% |
| Bio, Nature & Agricultural | 0 | 0.0% |
| Physical & Health Sciences | 0 | 0.0% |
| Psychology | 3 | 11.5% |
| Social Sciences | 0 | 0.0% |
| Engineering | 0 | 0.0% |
| Multidisciplinary Studies | 0 | 0.0% |
| Science & Technology | 10 | 38.5% |
| Business | 0 | 0.0% |
| Education | 1 | 3.8% |
| Literature & Languages | 0 | 0.0% |
| Liberal Arts & History | 0 | 0.0% |
| Visual & Performing Arts | 0 | 0.0% |
| Communications | 3 | 11.5% |
| Arts & Humanities | 9 | 34.6% |
| Total | 26 | 100.0% |
Transportation & Commute in East New Market
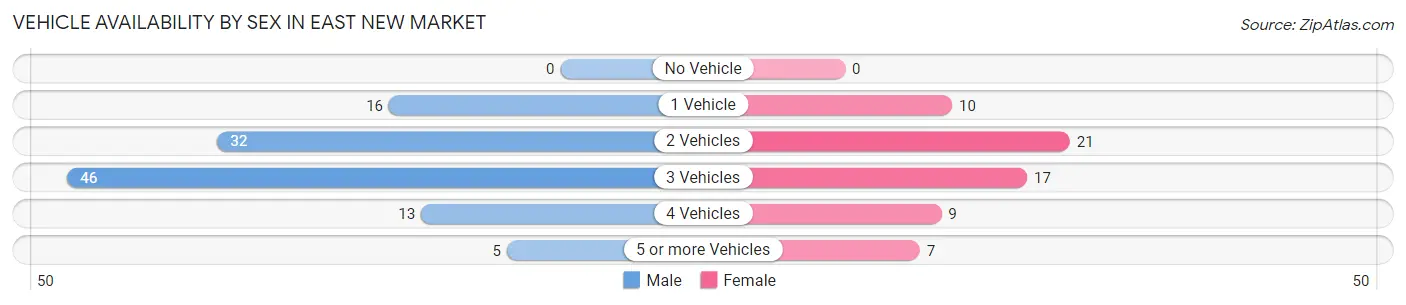
Vehicle Availability by Sex in East New Market
The most prevalent vehicle ownership categories in East New Market are males with 3 vehicles (46, accounting for 41.1%) and females with 3 vehicles (17, making up 71.9%).
| Vehicles Available | Male | Female |
| No Vehicle | 0 (0.0%) | 0 (0.0%) |
| 1 Vehicle | 16 (14.3%) | 10 (15.6%) |
| 2 Vehicles | 32 (28.6%) | 21 (32.8%) |
| 3 Vehicles | 46 (41.1%) | 17 (26.6%) |
| 4 Vehicles | 13 (11.6%) | 9 (14.1%) |
| 5 or more Vehicles | 5 (4.5%) | 7 (10.9%) |
| Total | 112 (100.0%) | 64 (100.0%) |
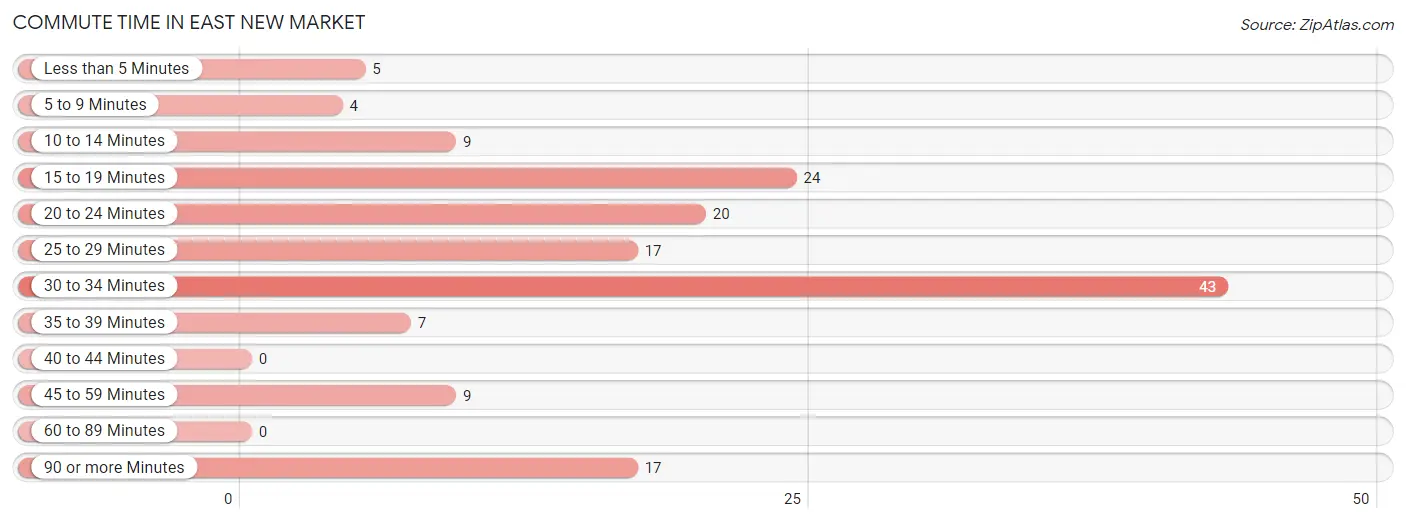
Commute Time in East New Market
The most frequently occuring commute durations in East New Market are 30 to 34 minutes (43 commuters, 27.7%), 15 to 19 minutes (24 commuters, 15.5%), and 20 to 24 minutes (20 commuters, 12.9%).
| Commute Time | # Commuters | % Commuters |
| Less than 5 Minutes | 5 | 3.2% |
| 5 to 9 Minutes | 4 | 2.6% |
| 10 to 14 Minutes | 9 | 5.8% |
| 15 to 19 Minutes | 24 | 15.5% |
| 20 to 24 Minutes | 20 | 12.9% |
| 25 to 29 Minutes | 17 | 11.0% |
| 30 to 34 Minutes | 43 | 27.7% |
| 35 to 39 Minutes | 7 | 4.5% |
| 40 to 44 Minutes | 0 | 0.0% |
| 45 to 59 Minutes | 9 | 5.8% |
| 60 to 89 Minutes | 0 | 0.0% |
| 90 or more Minutes | 17 | 11.0% |
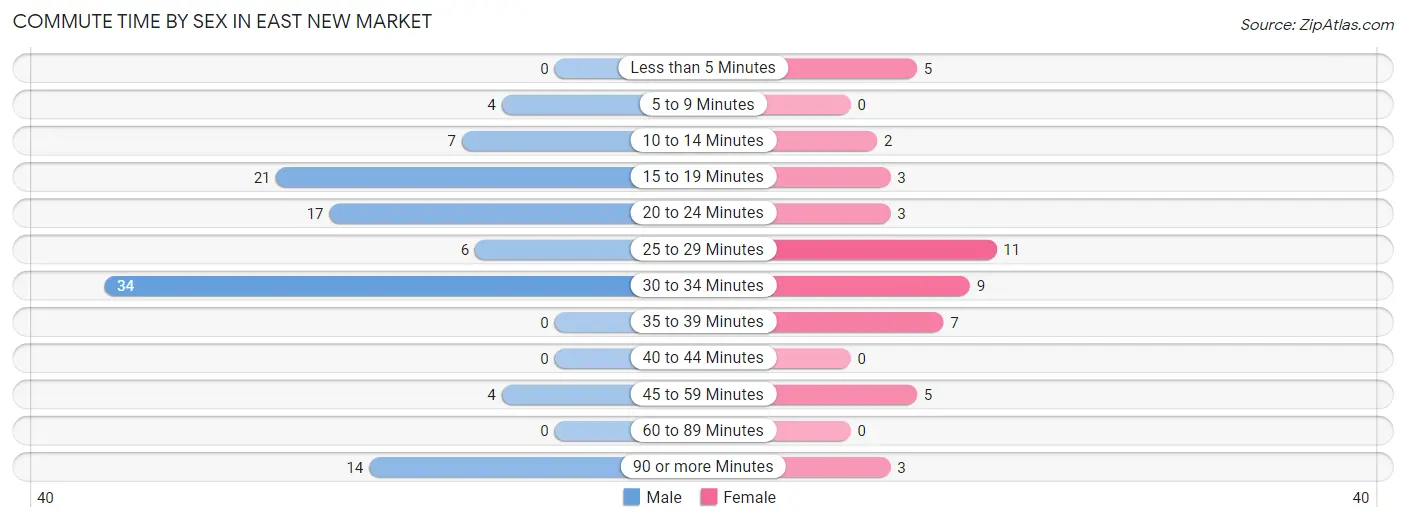
Commute Time by Sex in East New Market
The most common commute times in East New Market are 30 to 34 minutes (34 commuters, 31.8%) for males and 25 to 29 minutes (11 commuters, 22.9%) for females.
| Commute Time | Male | Female |
| Less than 5 Minutes | 0 (0.0%) | 5 (10.4%) |
| 5 to 9 Minutes | 4 (3.7%) | 0 (0.0%) |
| 10 to 14 Minutes | 7 (6.5%) | 2 (4.2%) |
| 15 to 19 Minutes | 21 (19.6%) | 3 (6.2%) |
| 20 to 24 Minutes | 17 (15.9%) | 3 (6.2%) |
| 25 to 29 Minutes | 6 (5.6%) | 11 (22.9%) |
| 30 to 34 Minutes | 34 (31.8%) | 9 (18.8%) |
| 35 to 39 Minutes | 0 (0.0%) | 7 (14.6%) |
| 40 to 44 Minutes | 0 (0.0%) | 0 (0.0%) |
| 45 to 59 Minutes | 4 (3.7%) | 5 (10.4%) |
| 60 to 89 Minutes | 0 (0.0%) | 0 (0.0%) |
| 90 or more Minutes | 14 (13.1%) | 3 (6.2%) |
Time of Departure to Work by Sex in East New Market
The most frequent times of departure to work in East New Market are 7:00 AM to 7:29 AM (35, 32.7%) for males and 5:00 AM to 5:29 AM (7, 14.6%) for females.
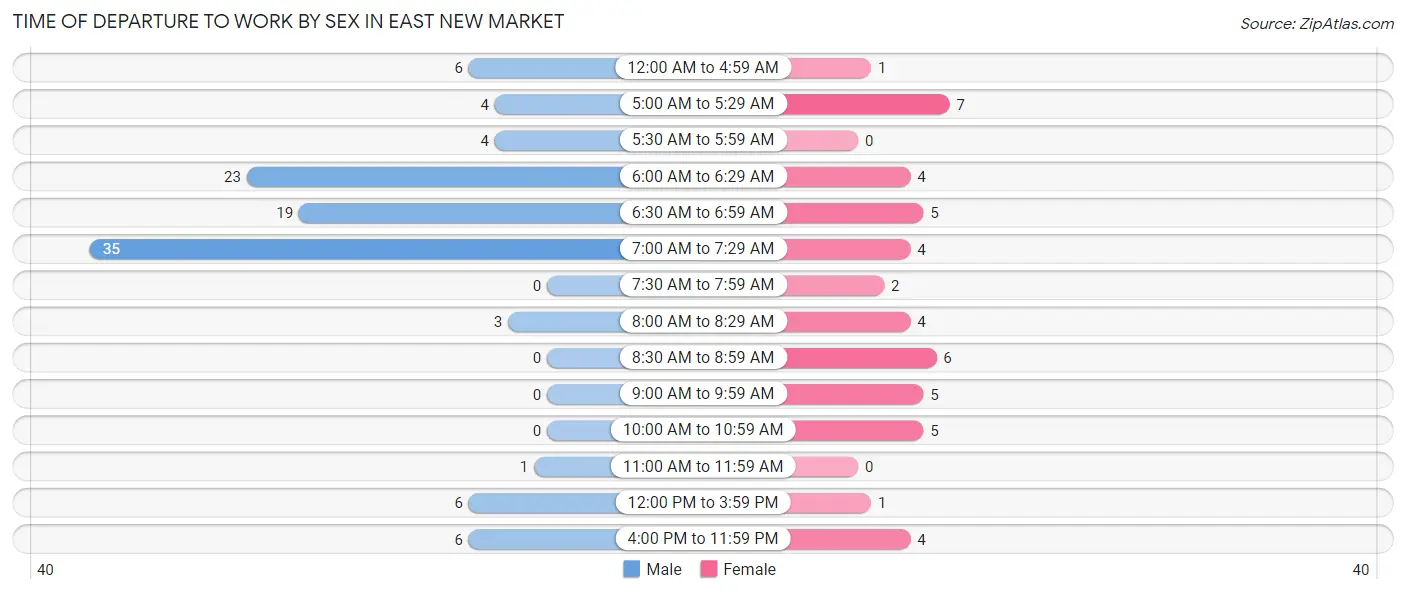
| Time of Departure | Male | Female |
| 12:00 AM to 4:59 AM | 6 (5.6%) | 1 (2.1%) |
| 5:00 AM to 5:29 AM | 4 (3.7%) | 7 (14.6%) |
| 5:30 AM to 5:59 AM | 4 (3.7%) | 0 (0.0%) |
| 6:00 AM to 6:29 AM | 23 (21.5%) | 4 (8.3%) |
| 6:30 AM to 6:59 AM | 19 (17.8%) | 5 (10.4%) |
| 7:00 AM to 7:29 AM | 35 (32.7%) | 4 (8.3%) |
| 7:30 AM to 7:59 AM | 0 (0.0%) | 2 (4.2%) |
| 8:00 AM to 8:29 AM | 3 (2.8%) | 4 (8.3%) |
| 8:30 AM to 8:59 AM | 0 (0.0%) | 6 (12.5%) |
| 9:00 AM to 9:59 AM | 0 (0.0%) | 5 (10.4%) |
| 10:00 AM to 10:59 AM | 0 (0.0%) | 5 (10.4%) |
| 11:00 AM to 11:59 AM | 1 (0.9%) | 0 (0.0%) |
| 12:00 PM to 3:59 PM | 6 (5.6%) | 1 (2.1%) |
| 4:00 PM to 11:59 PM | 6 (5.6%) | 4 (8.3%) |
| Total | 107 (100.0%) | 48 (100.0%) |
Housing Occupancy in East New Market
Occupancy by Ownership in East New Market
Of the total 158 dwellings in East New Market, owner-occupied units account for 106 (67.1%), while renter-occupied units make up 52 (32.9%).
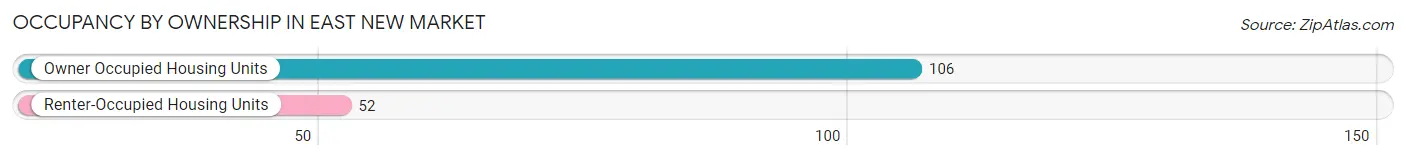
| Occupancy | # Housing Units | % Housing Units |
| Owner Occupied Housing Units | 106 | 67.1% |
| Renter-Occupied Housing Units | 52 | 32.9% |
| Total Occupied Housing Units | 158 | 100.0% |
Occupancy by Household Size in East New Market
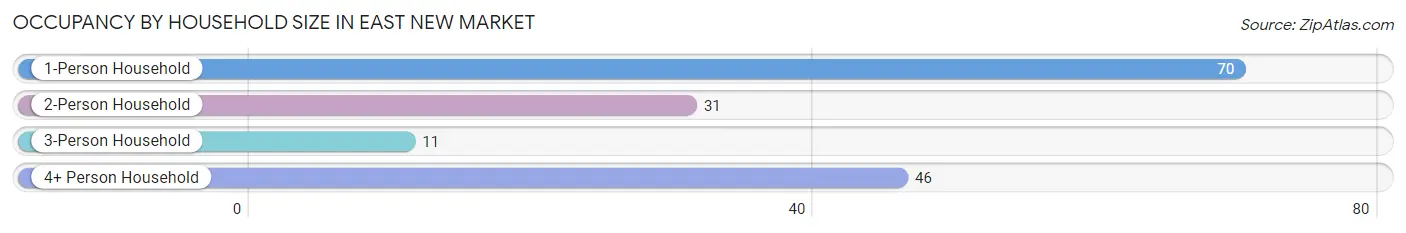
| Household Size | # Housing Units | % Housing Units |
| 1-Person Household | 70 | 44.3% |
| 2-Person Household | 31 | 19.6% |
| 3-Person Household | 11 | 7.0% |
| 4+ Person Household | 46 | 29.1% |
| Total Housing Units | 158 | 100.0% |
Occupancy by Ownership by Household Size in East New Market
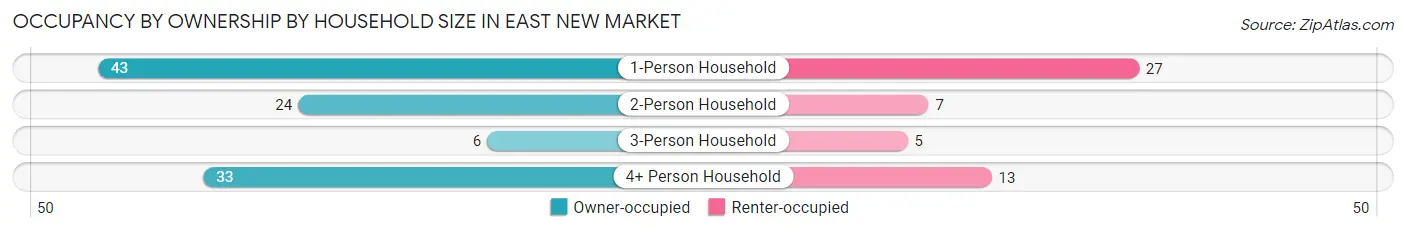
| Household Size | Owner-occupied | Renter-occupied |
| 1-Person Household | 43 (61.4%) | 27 (38.6%) |
| 2-Person Household | 24 (77.4%) | 7 (22.6%) |
| 3-Person Household | 6 (54.5%) | 5 (45.5%) |
| 4+ Person Household | 33 (71.7%) | 13 (28.3%) |
| Total Housing Units | 106 (67.1%) | 52 (32.9%) |
Occupancy by Educational Attainment in East New Market
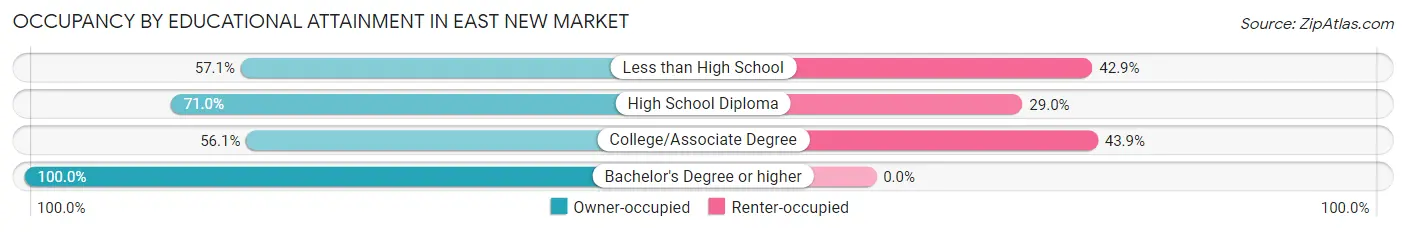
| Household Size | Owner-occupied | Renter-occupied |
| Less than High School | 4 (57.1%) | 3 (42.9%) |
| High School Diploma | 49 (71.0%) | 20 (29.0%) |
| College/Associate Degree | 37 (56.1%) | 29 (43.9%) |
| Bachelor's Degree or higher | 16 (100.0%) | 0 (0.0%) |
Occupancy by Age of Householder in East New Market
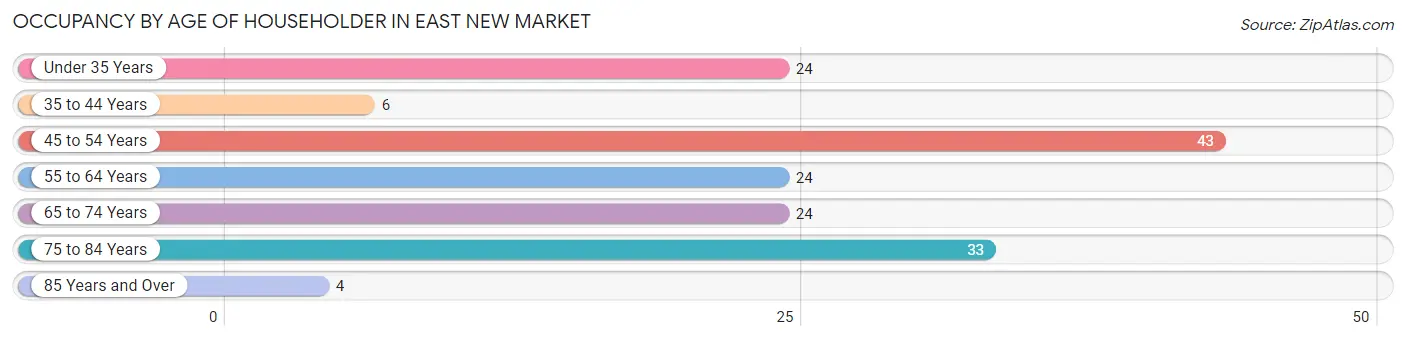
| Age Bracket | # Households | % Households |
| Under 35 Years | 24 | 15.2% |
| 35 to 44 Years | 6 | 3.8% |
| 45 to 54 Years | 43 | 27.2% |
| 55 to 64 Years | 24 | 15.2% |
| 65 to 74 Years | 24 | 15.2% |
| 75 to 84 Years | 33 | 20.9% |
| 85 Years and Over | 4 | 2.5% |
| Total | 158 | 100.0% |
Housing Finances in East New Market
Median Income by Occupancy in East New Market
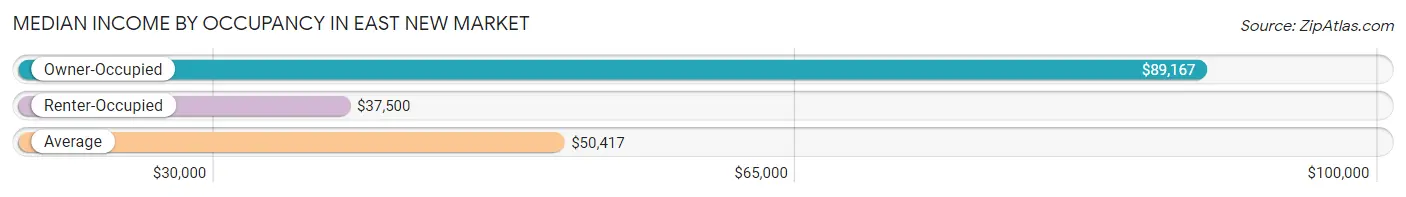
| Occupancy Type | # Households | Median Income |
| Owner-Occupied | 106 (67.1%) | $89,167 |
| Renter-Occupied | 52 (32.9%) | $37,500 |
| Average | 158 (100.0%) | $50,417 |
Occupancy by Householder Income Bracket in East New Market
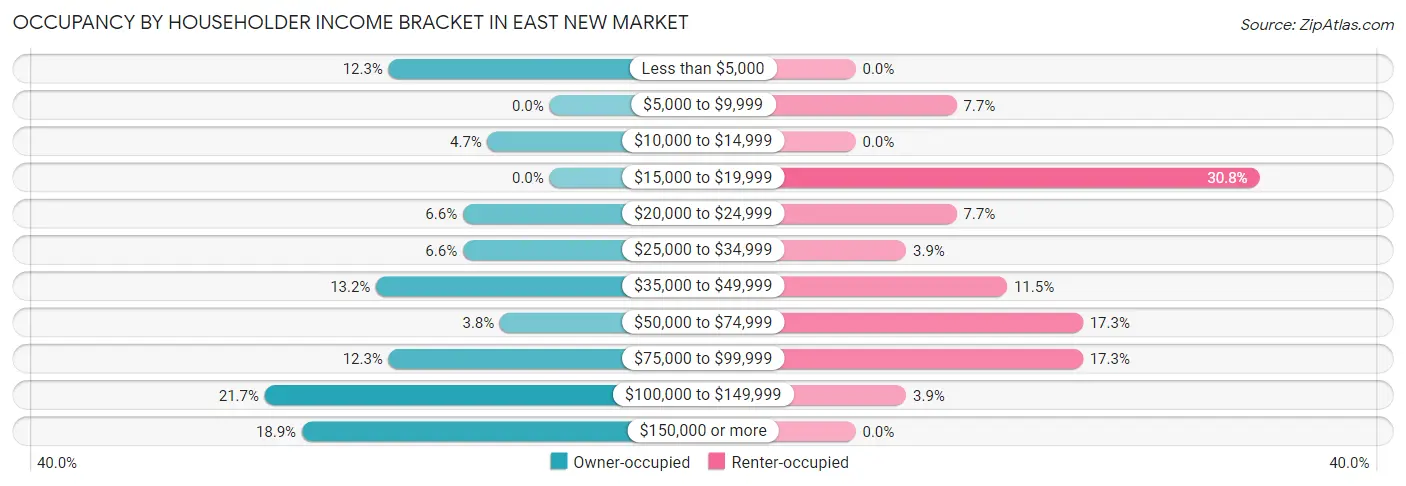
| Income Bracket | Owner-occupied | Renter-occupied |
| Less than $5,000 | 13 (12.3%) | 0 (0.0%) |
| $5,000 to $9,999 | 0 (0.0%) | 4 (7.7%) |
| $10,000 to $14,999 | 5 (4.7%) | 0 (0.0%) |
| $15,000 to $19,999 | 0 (0.0%) | 16 (30.8%) |
| $20,000 to $24,999 | 7 (6.6%) | 4 (7.7%) |
| $25,000 to $34,999 | 7 (6.6%) | 2 (3.8%) |
| $35,000 to $49,999 | 14 (13.2%) | 6 (11.5%) |
| $50,000 to $74,999 | 4 (3.8%) | 9 (17.3%) |
| $75,000 to $99,999 | 13 (12.3%) | 9 (17.3%) |
| $100,000 to $149,999 | 23 (21.7%) | 2 (3.8%) |
| $150,000 or more | 20 (18.9%) | 0 (0.0%) |
| Total | 106 (100.0%) | 52 (100.0%) |
Monthly Housing Cost Tiers in East New Market
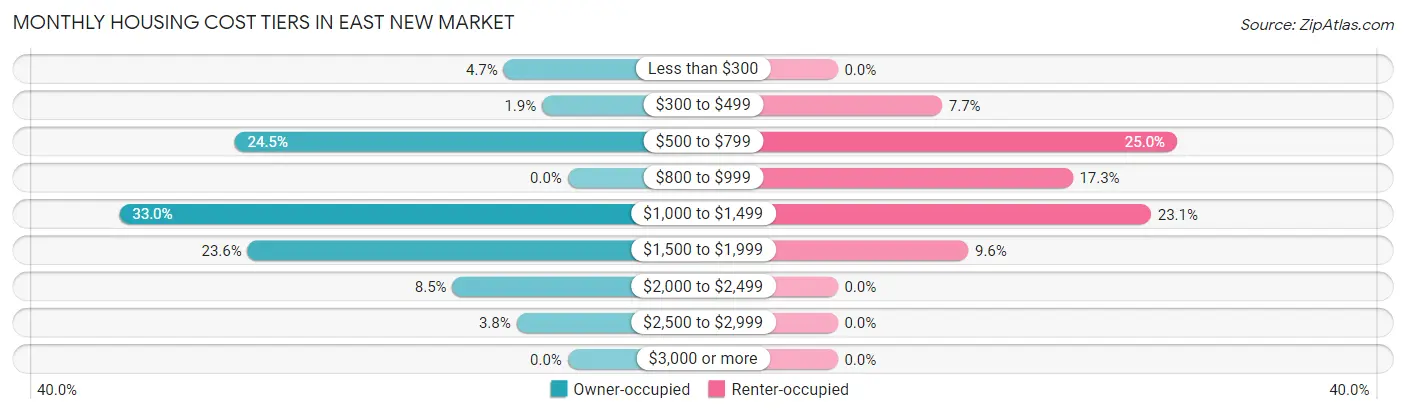
| Monthly Cost | Owner-occupied | Renter-occupied |
| Less than $300 | 5 (4.7%) | 0 (0.0%) |
| $300 to $499 | 2 (1.9%) | 4 (7.7%) |
| $500 to $799 | 26 (24.5%) | 13 (25.0%) |
| $800 to $999 | 0 (0.0%) | 9 (17.3%) |
| $1,000 to $1,499 | 35 (33.0%) | 12 (23.1%) |
| $1,500 to $1,999 | 25 (23.6%) | 5 (9.6%) |
| $2,000 to $2,499 | 9 (8.5%) | 0 (0.0%) |
| $2,500 to $2,999 | 4 (3.8%) | 0 (0.0%) |
| $3,000 or more | 0 (0.0%) | 0 (0.0%) |
| Total | 106 (100.0%) | 52 (100.0%) |
Physical Housing Characteristics in East New Market
Housing Structures in East New Market
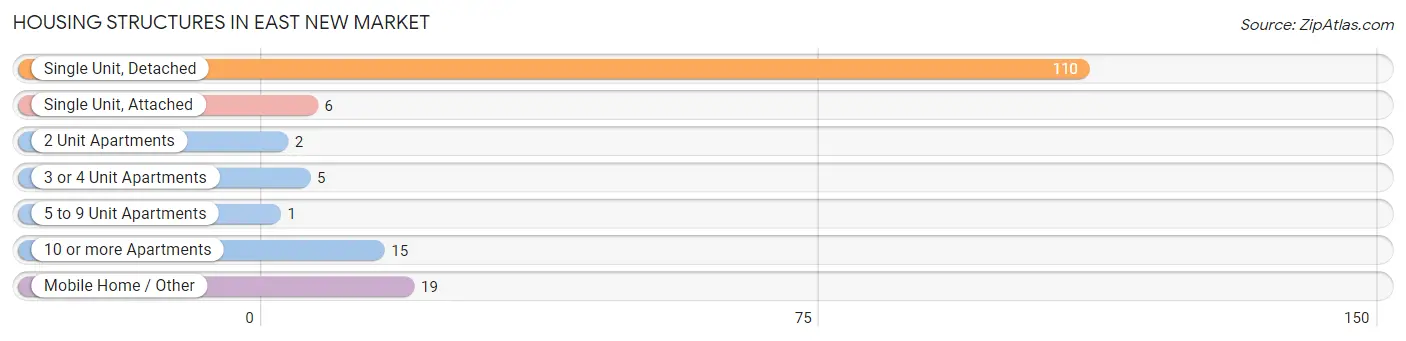
| Structure Type | # Housing Units | % Housing Units |
| Single Unit, Detached | 110 | 69.6% |
| Single Unit, Attached | 6 | 3.8% |
| 2 Unit Apartments | 2 | 1.3% |
| 3 or 4 Unit Apartments | 5 | 3.2% |
| 5 to 9 Unit Apartments | 1 | 0.6% |
| 10 or more Apartments | 15 | 9.5% |
| Mobile Home / Other | 19 | 12.0% |
| Total | 158 | 100.0% |
Housing Structures by Occupancy in East New Market
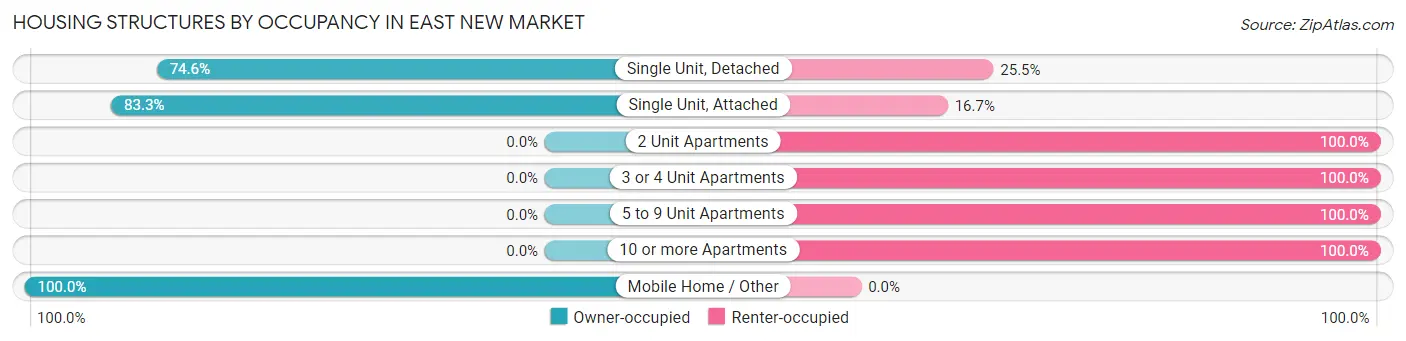
| Structure Type | Owner-occupied | Renter-occupied |
| Single Unit, Detached | 82 (74.6%) | 28 (25.5%) |
| Single Unit, Attached | 5 (83.3%) | 1 (16.7%) |
| 2 Unit Apartments | 0 (0.0%) | 2 (100.0%) |
| 3 or 4 Unit Apartments | 0 (0.0%) | 5 (100.0%) |
| 5 to 9 Unit Apartments | 0 (0.0%) | 1 (100.0%) |
| 10 or more Apartments | 0 (0.0%) | 15 (100.0%) |
| Mobile Home / Other | 19 (100.0%) | 0 (0.0%) |
| Total | 106 (67.1%) | 52 (32.9%) |
Housing Structures by Number of Rooms in East New Market
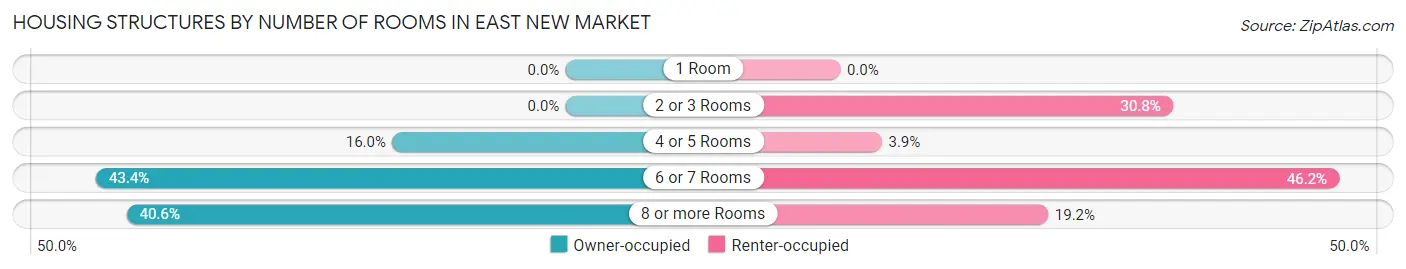
| Number of Rooms | Owner-occupied | Renter-occupied |
| 1 Room | 0 (0.0%) | 0 (0.0%) |
| 2 or 3 Rooms | 0 (0.0%) | 16 (30.8%) |
| 4 or 5 Rooms | 17 (16.0%) | 2 (3.8%) |
| 6 or 7 Rooms | 46 (43.4%) | 24 (46.2%) |
| 8 or more Rooms | 43 (40.6%) | 10 (19.2%) |
| Total | 106 (100.0%) | 52 (100.0%) |
Housing Structure by Heating Type in East New Market
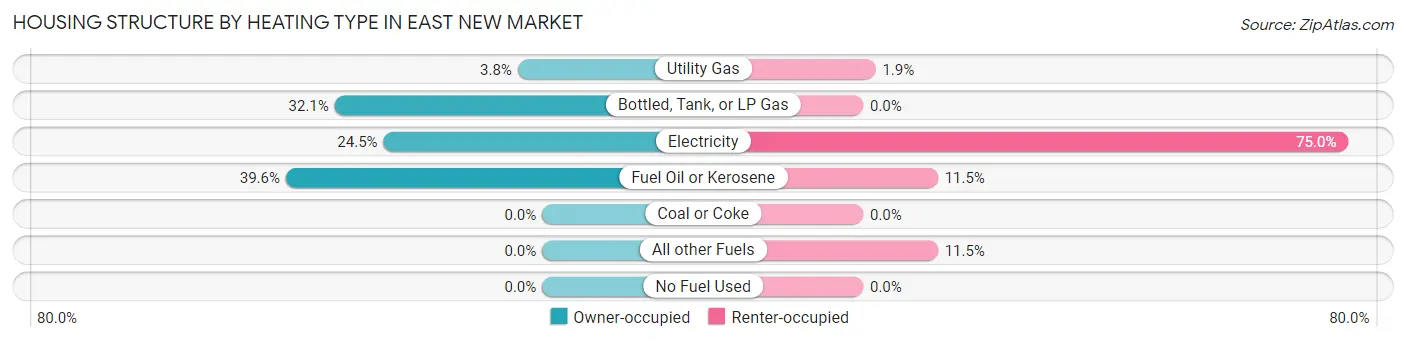
| Heating Type | Owner-occupied | Renter-occupied |
| Utility Gas | 4 (3.8%) | 1 (1.9%) |
| Bottled, Tank, or LP Gas | 34 (32.1%) | 0 (0.0%) |
| Electricity | 26 (24.5%) | 39 (75.0%) |
| Fuel Oil or Kerosene | 42 (39.6%) | 6 (11.5%) |
| Coal or Coke | 0 (0.0%) | 0 (0.0%) |
| All other Fuels | 0 (0.0%) | 6 (11.5%) |
| No Fuel Used | 0 (0.0%) | 0 (0.0%) |
| Total | 106 (100.0%) | 52 (100.0%) |
Household Vehicle Usage in East New Market
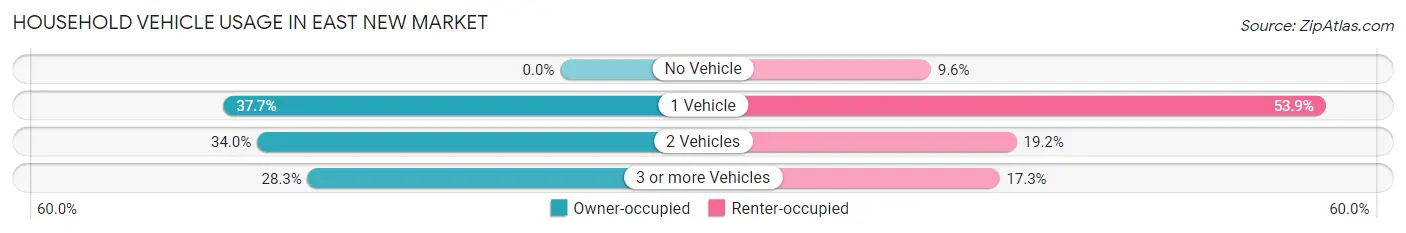
| Vehicles per Household | Owner-occupied | Renter-occupied |
| No Vehicle | 0 (0.0%) | 5 (9.6%) |
| 1 Vehicle | 40 (37.7%) | 28 (53.8%) |
| 2 Vehicles | 36 (34.0%) | 10 (19.2%) |
| 3 or more Vehicles | 30 (28.3%) | 9 (17.3%) |
| Total | 106 (100.0%) | 52 (100.0%) |
Real Estate & Mortgages in East New Market
Real Estate and Mortgage Overview in East New Market
| Characteristic | Without Mortgage | With Mortgage |
| Housing Units | 31 | 75 |
| Median Property Value | - | - |
| Median Household Income | $93,194 | $20 |
| Monthly Housing Costs | $638 | $0 |
| Real Estate Taxes | $1,355 | $10 |
Property Value by Mortgage Status in East New Market
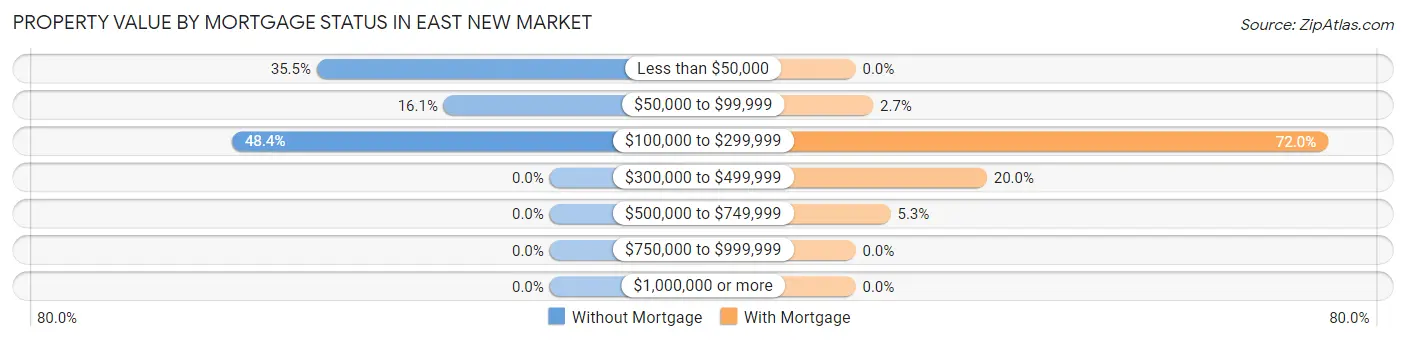
| Property Value | Without Mortgage | With Mortgage |
| Less than $50,000 | 11 (35.5%) | 0 (0.0%) |
| $50,000 to $99,999 | 5 (16.1%) | 2 (2.7%) |
| $100,000 to $299,999 | 15 (48.4%) | 54 (72.0%) |
| $300,000 to $499,999 | 0 (0.0%) | 15 (20.0%) |
| $500,000 to $749,999 | 0 (0.0%) | 4 (5.3%) |
| $750,000 to $999,999 | 0 (0.0%) | 0 (0.0%) |
| $1,000,000 or more | 0 (0.0%) | 0 (0.0%) |
| Total | 31 (100.0%) | 75 (100.0%) |
Household Income by Mortgage Status in East New Market
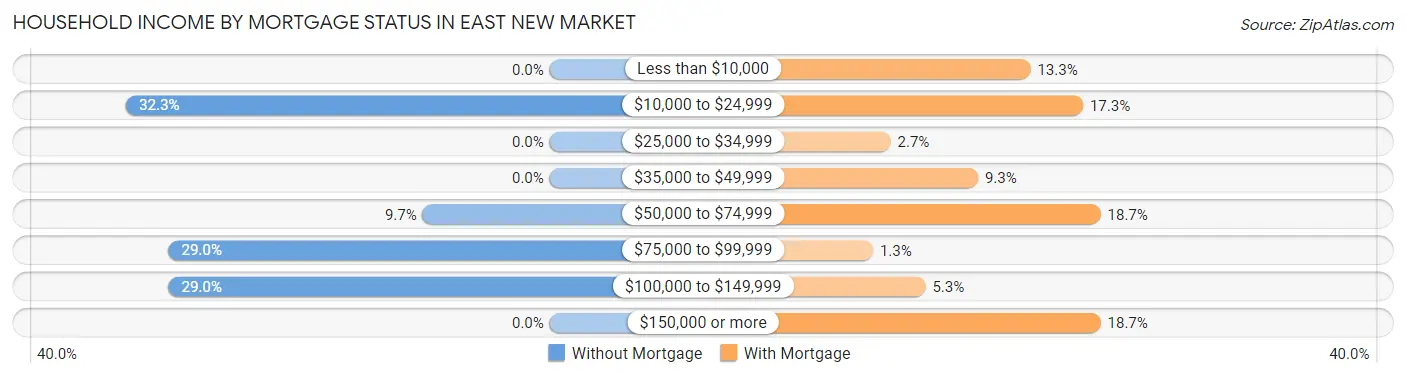
| Household Income | Without Mortgage | With Mortgage |
| Less than $10,000 | 0 (0.0%) | 10 (13.3%) |
| $10,000 to $24,999 | 10 (32.3%) | 13 (17.3%) |
| $25,000 to $34,999 | 0 (0.0%) | 2 (2.7%) |
| $35,000 to $49,999 | 0 (0.0%) | 7 (9.3%) |
| $50,000 to $74,999 | 3 (9.7%) | 14 (18.7%) |
| $75,000 to $99,999 | 9 (29.0%) | 1 (1.3%) |
| $100,000 to $149,999 | 9 (29.0%) | 4 (5.3%) |
| $150,000 or more | 0 (0.0%) | 14 (18.7%) |
| Total | 31 (100.0%) | 75 (100.0%) |
Property Value to Household Income Ratio in East New Market
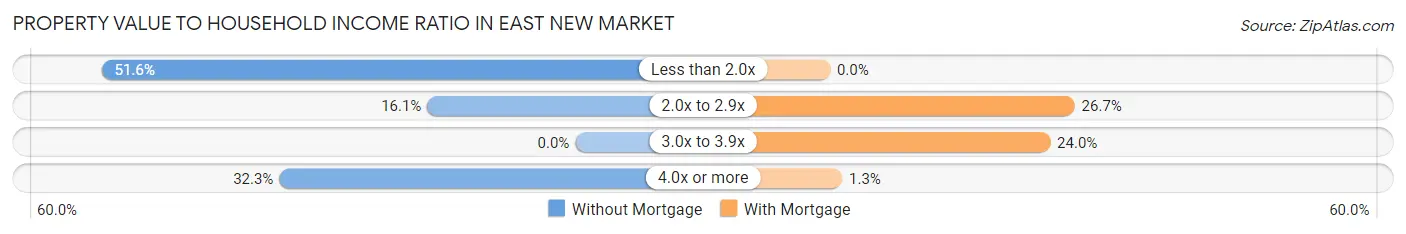
| Value-to-Income Ratio | Without Mortgage | With Mortgage |
| Less than 2.0x | 16 (51.6%) | 0 (0.0%) |
| 2.0x to 2.9x | 5 (16.1%) | 20 (26.7%) |
| 3.0x to 3.9x | 0 (0.0%) | 18 (24.0%) |
| 4.0x or more | 10 (32.3%) | 1 (1.3%) |
| Total | 31 (100.0%) | 75 (100.0%) |
Real Estate Taxes by Mortgage Status in East New Market
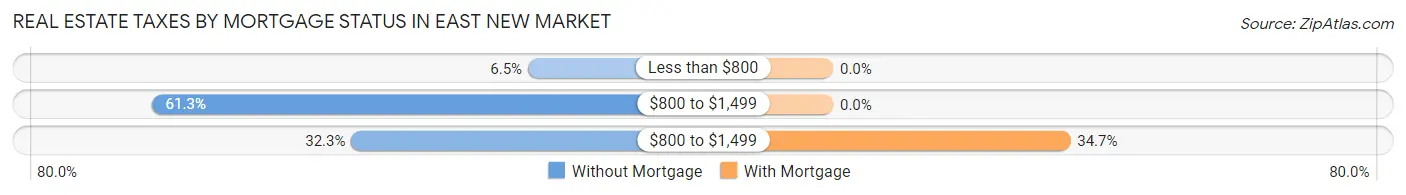
| Property Taxes | Without Mortgage | With Mortgage |
| Less than $800 | 2 (6.5%) | 0 (0.0%) |
| $800 to $1,499 | 19 (61.3%) | 0 (0.0%) |
| $800 to $1,499 | 10 (32.3%) | 26 (34.7%) |
| Total | 31 (100.0%) | 75 (100.0%) |
Health & Disability in East New Market
Health Insurance Coverage by Age in East New Market
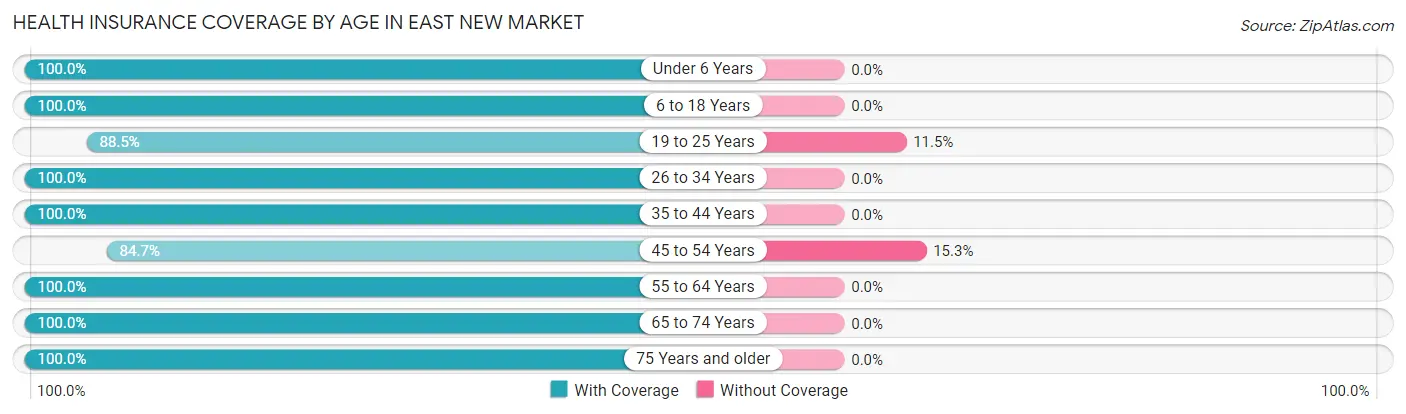
| Age Bracket | With Coverage | Without Coverage |
| Under 6 Years | 28 (100.0%) | 0 (0.0%) |
| 6 to 18 Years | 45 (100.0%) | 0 (0.0%) |
| 19 to 25 Years | 23 (88.5%) | 3 (11.5%) |
| 26 to 34 Years | 59 (100.0%) | 0 (0.0%) |
| 35 to 44 Years | 34 (100.0%) | 0 (0.0%) |
| 45 to 54 Years | 61 (84.7%) | 11 (15.3%) |
| 55 to 64 Years | 27 (100.0%) | 0 (0.0%) |
| 65 to 74 Years | 53 (100.0%) | 0 (0.0%) |
| 75 Years and older | 45 (100.0%) | 0 (0.0%) |
| Total | 375 (96.4%) | 14 (3.6%) |
Health Insurance Coverage by Citizenship Status in East New Market
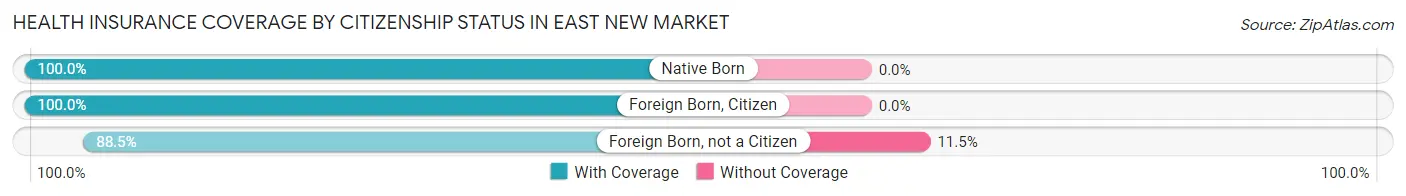
| Citizenship Status | With Coverage | Without Coverage |
| Native Born | 28 (100.0%) | 0 (0.0%) |
| Foreign Born, Citizen | 45 (100.0%) | 0 (0.0%) |
| Foreign Born, not a Citizen | 23 (88.5%) | 3 (11.5%) |
Health Insurance Coverage by Household Income in East New Market
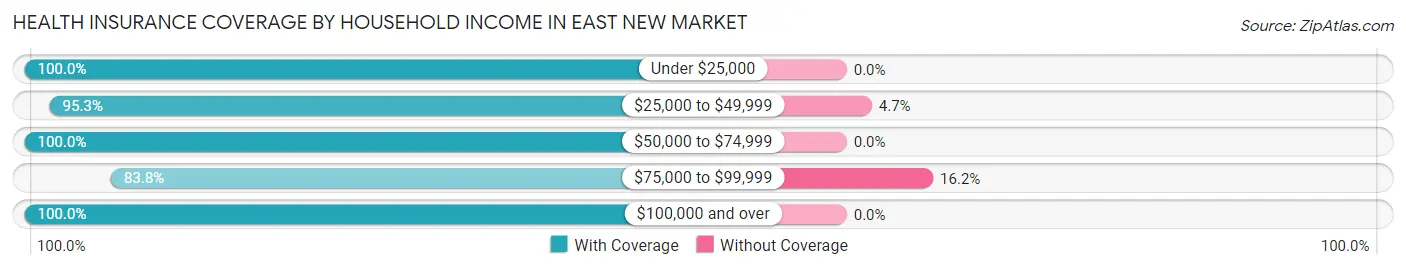
| Household Income | With Coverage | Without Coverage |
| Under $25,000 | 60 (100.0%) | 0 (0.0%) |
| $25,000 to $49,999 | 61 (95.3%) | 3 (4.7%) |
| $50,000 to $74,999 | 17 (100.0%) | 0 (0.0%) |
| $75,000 to $99,999 | 57 (83.8%) | 11 (16.2%) |
| $100,000 and over | 180 (100.0%) | 0 (0.0%) |
Public vs Private Health Insurance Coverage by Age in East New Market
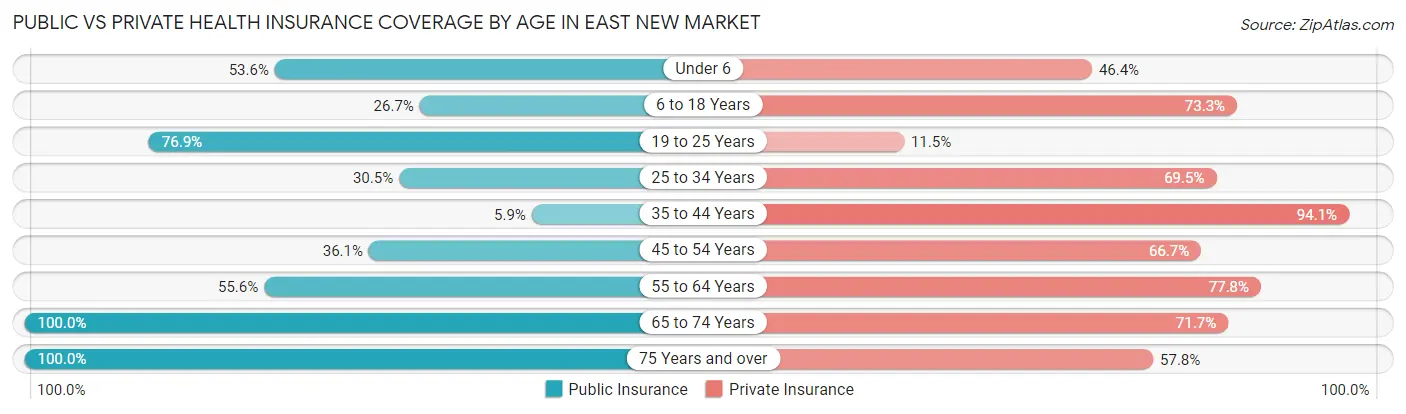
| Age Bracket | Public Insurance | Private Insurance |
| Under 6 | 15 (53.6%) | 13 (46.4%) |
| 6 to 18 Years | 12 (26.7%) | 33 (73.3%) |
| 19 to 25 Years | 20 (76.9%) | 3 (11.5%) |
| 25 to 34 Years | 18 (30.5%) | 41 (69.5%) |
| 35 to 44 Years | 2 (5.9%) | 32 (94.1%) |
| 45 to 54 Years | 26 (36.1%) | 48 (66.7%) |
| 55 to 64 Years | 15 (55.6%) | 21 (77.8%) |
| 65 to 74 Years | 53 (100.0%) | 38 (71.7%) |
| 75 Years and over | 45 (100.0%) | 26 (57.8%) |
| Total | 206 (53.0%) | 255 (65.5%) |
Disability Status by Sex by Age in East New Market
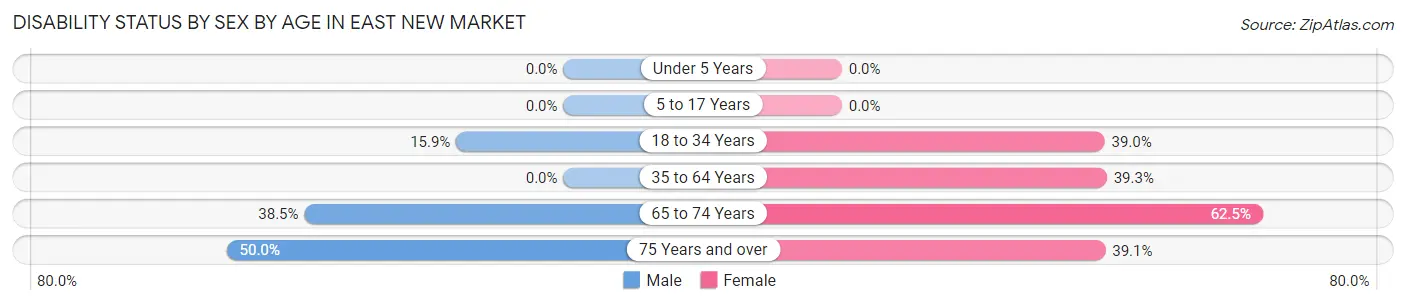
| Age Bracket | Male | Female |
| Under 5 Years | 0 (0.0%) | 0 (0.0%) |
| 5 to 17 Years | 0 (0.0%) | 0 (0.0%) |
| 18 to 34 Years | 7 (15.9%) | 16 (39.0%) |
| 35 to 64 Years | 0 (0.0%) | 24 (39.3%) |
| 65 to 74 Years | 5 (38.5%) | 25 (62.5%) |
| 75 Years and over | 11 (50.0%) | 9 (39.1%) |
Disability Class by Sex by Age in East New Market
Disability Class: Hearing Difficulty
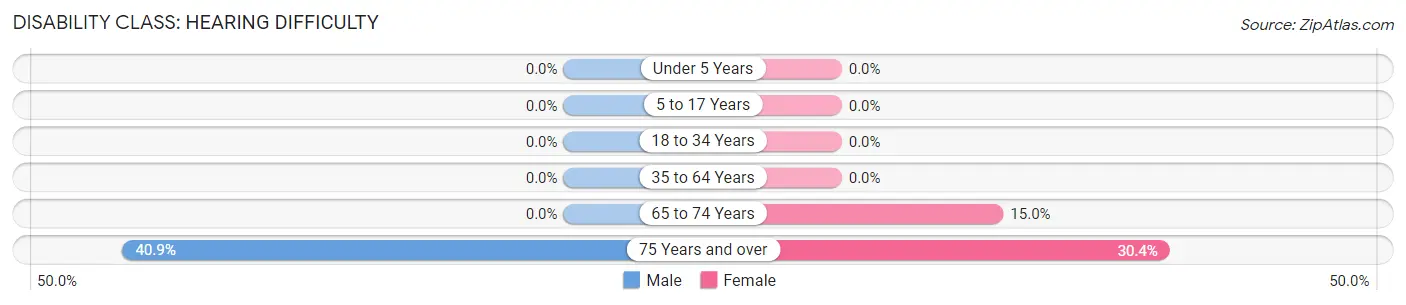
| Age Bracket | Male | Female |
| Under 5 Years | 0 (0.0%) | 0 (0.0%) |
| 5 to 17 Years | 0 (0.0%) | 0 (0.0%) |
| 18 to 34 Years | 0 (0.0%) | 0 (0.0%) |
| 35 to 64 Years | 0 (0.0%) | 0 (0.0%) |
| 65 to 74 Years | 0 (0.0%) | 6 (15.0%) |
| 75 Years and over | 9 (40.9%) | 7 (30.4%) |
Disability Class: Vision Difficulty
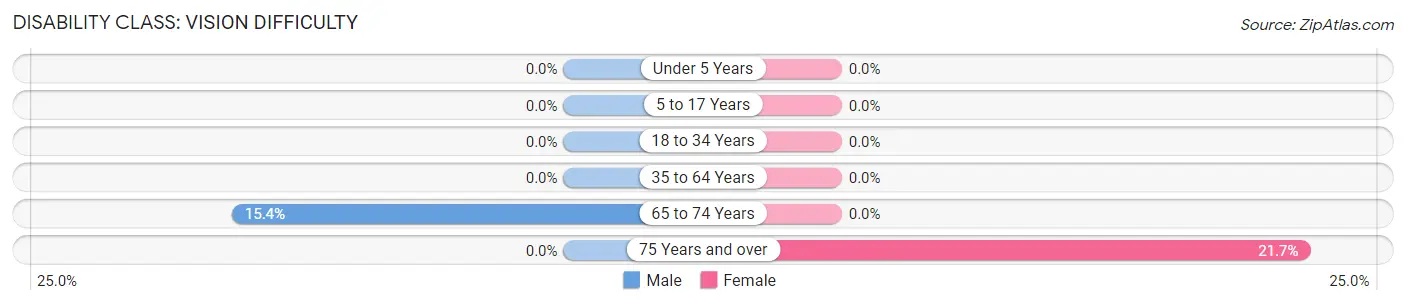
| Age Bracket | Male | Female |
| Under 5 Years | 0 (0.0%) | 0 (0.0%) |
| 5 to 17 Years | 0 (0.0%) | 0 (0.0%) |
| 18 to 34 Years | 0 (0.0%) | 0 (0.0%) |
| 35 to 64 Years | 0 (0.0%) | 0 (0.0%) |
| 65 to 74 Years | 2 (15.4%) | 0 (0.0%) |
| 75 Years and over | 0 (0.0%) | 5 (21.7%) |
Disability Class: Cognitive Difficulty
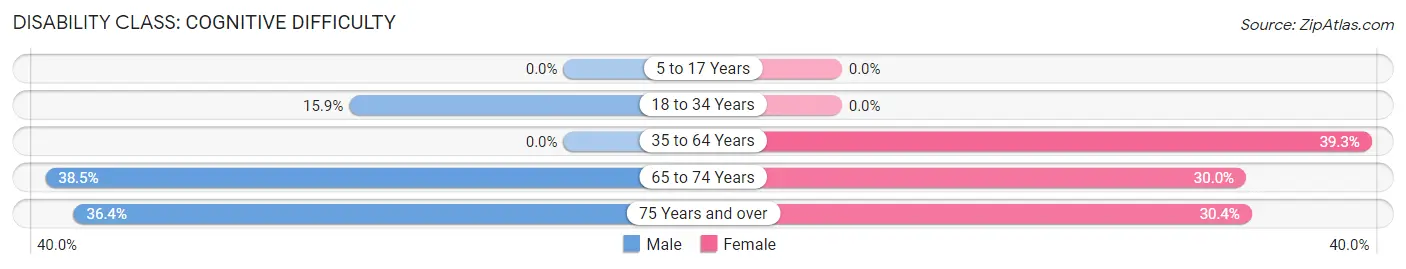
| Age Bracket | Male | Female |
| 5 to 17 Years | 0 (0.0%) | 0 (0.0%) |
| 18 to 34 Years | 7 (15.9%) | 0 (0.0%) |
| 35 to 64 Years | 0 (0.0%) | 24 (39.3%) |
| 65 to 74 Years | 5 (38.5%) | 12 (30.0%) |
| 75 Years and over | 8 (36.4%) | 7 (30.4%) |
Disability Class: Ambulatory Difficulty
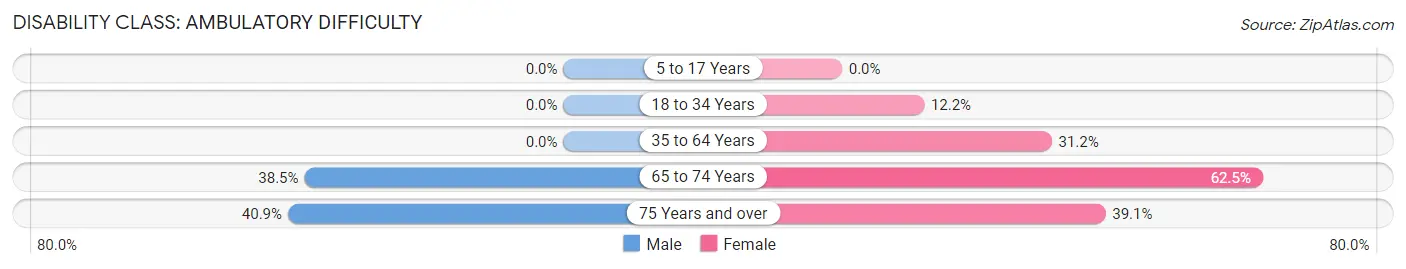
| Age Bracket | Male | Female |
| 5 to 17 Years | 0 (0.0%) | 0 (0.0%) |
| 18 to 34 Years | 0 (0.0%) | 5 (12.2%) |
| 35 to 64 Years | 0 (0.0%) | 19 (31.1%) |
| 65 to 74 Years | 5 (38.5%) | 25 (62.5%) |
| 75 Years and over | 9 (40.9%) | 9 (39.1%) |
Disability Class: Self-Care Difficulty
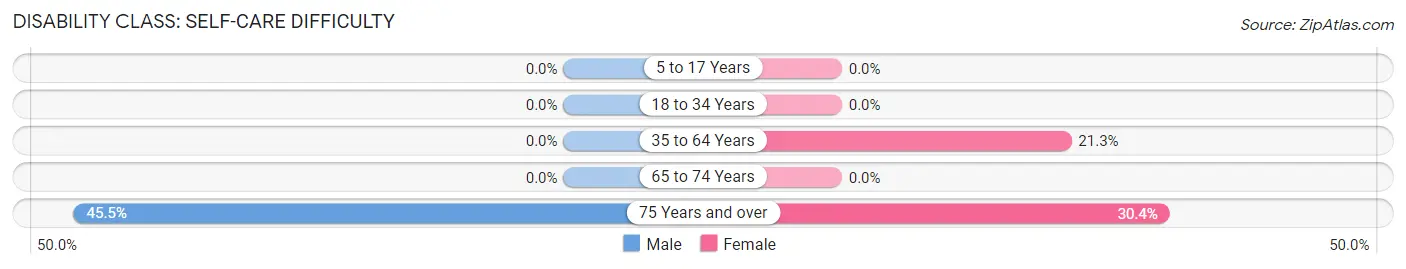
| Age Bracket | Male | Female |
| 5 to 17 Years | 0 (0.0%) | 0 (0.0%) |
| 18 to 34 Years | 0 (0.0%) | 0 (0.0%) |
| 35 to 64 Years | 0 (0.0%) | 13 (21.3%) |
| 65 to 74 Years | 0 (0.0%) | 0 (0.0%) |
| 75 Years and over | 10 (45.5%) | 7 (30.4%) |
Technology Access in East New Market
Computing Device Access in East New Market

| Device Type | # Households | % Households |
| Desktop or Laptop | 96 | 60.8% |
| Smartphone | 123 | 77.8% |
| Tablet | 68 | 43.0% |
| No Computing Device | 27 | 17.1% |
| Total | 158 | 100.0% |
Internet Access in East New Market
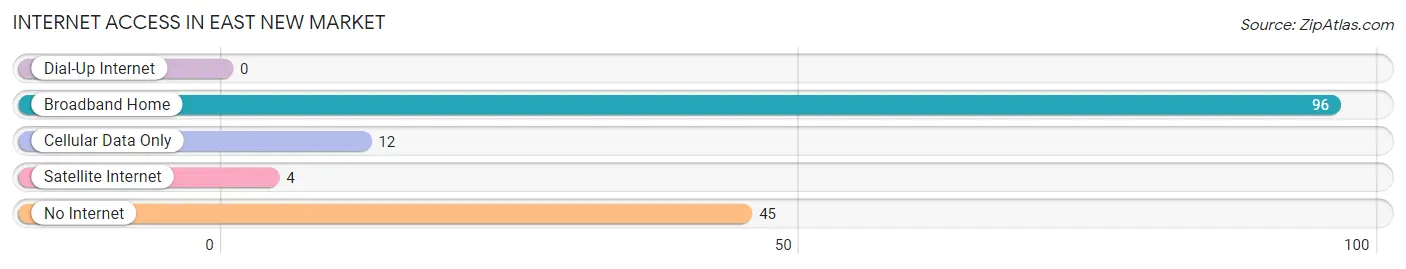
| Internet Type | # Households | % Households |
| Dial-Up Internet | 0 | 0.0% |
| Broadband Home | 96 | 60.8% |
| Cellular Data Only | 12 | 7.6% |
| Satellite Internet | 4 | 2.5% |
| No Internet | 45 | 28.5% |
| Total | 158 | 100.0% |
East New Market Summary
East New Market is a small town located in Dorchester County, Maryland. It is situated on the Eastern Shore of the Chesapeake Bay, approximately 25 miles south of Cambridge. The town has a population of approximately 500 people and is part of the Cambridge-East New Market Micropolitan Statistical Area.
History
East New Market was founded in 1781 by a group of Quakers from Pennsylvania. The town was originally known as “New Market” and was the first Quaker settlement in Maryland. The town was renamed “East New Market” in 1810 to distinguish it from the nearby town of New Market.
The town was an important center of commerce and industry in the 19th century. It was home to several mills, including a grist mill, a saw mill, and a paper mill. The town also had a blacksmith shop, a tannery, and a brickyard.
In the early 20th century, East New Market was a popular destination for tourists. The town was home to several resorts, including the East New Market Hotel and the East New Market Beach Club.
Geography
East New Market is located in Dorchester County, Maryland. It is situated on the Eastern Shore of the Chesapeake Bay, approximately 25 miles south of Cambridge. The town is bordered by the towns of Cambridge, Secretary, and Vienna.
The town has a total area of 0.7 square miles, all of which is land. The town is located in a rural area and is surrounded by farmland.
Economy
The economy of East New Market is largely based on agriculture. The town is home to several farms, including poultry, dairy, and vegetable farms. The town also has several small businesses, including a grocery store, a hardware store, and a restaurant.
Demographics
As of the 2010 census, East New Market had a population of 500 people. The racial makeup of the town was 94.2% White, 3.2% African American, 0.2% Native American, 0.4% Asian, and 1.8% from other races.
The median household income in East New Market was $45,833 in 2018. The median age of the town’s population was 44.7 years. The town’s population is largely made up of families, with 57.2% of households having children under the age of 18.
Conclusion
East New Market is a small town located in Dorchester County, Maryland. It was founded in 1781 by a group of Quakers from Pennsylvania and was an important center of commerce and industry in the 19th century. The town has a population of 500 people and is largely based on agriculture. The median household income in East New Market was $45,833 in 2018 and the median age of the town’s population was 44.7 years.
Common Questions
What is Per Capita Income in East New Market?
Per Capita income in East New Market is $31,907.
What is the Median Family Income in East New Market?
Median Family Income in East New Market is $97,813.
What is the Median Household income in East New Market?
Median Household Income in East New Market is $50,417.
What is Income or Wage Gap in East New Market?
Income or Wage Gap in East New Market is 32.2%.
Women in East New Market earn 67.8 cents for every dollar earned by a man.
What is Inequality or Gini Index in East New Market?
Inequality or Gini Index in East New Market is 0.48.
What is the Total Population of East New Market?
Total Population of East New Market is 389.
What is the Total Male Population of East New Market?
Total Male Population of East New Market is 189.
What is the Total Female Population of East New Market?
Total Female Population of East New Market is 200.
What is the Ratio of Males per 100 Females in East New Market?
There are 94.50 Males per 100 Females in East New Market.
What is the Ratio of Females per 100 Males in East New Market?
There are 105.82 Females per 100 Males in East New Market.
What is the Median Population Age in East New Market?
Median Population Age in East New Market is 45.3 Years.
What is the Average Family Size in East New Market
Average Family Size in East New Market is 3.5 People.
What is the Average Household Size in East New Market
Average Household Size in East New Market is 2.5 People.
How Large is the Labor Force in East New Market?
There are 184 People in the Labor Forcein in East New Market.
What is the Percentage of People in the Labor Force in East New Market?
55.4% of People are in the Labor Force in East New Market.
What is the Unemployment Rate in East New Market?
Unemployment Rate in East New Market is 1.1%.