Zip Codes with the Highest Percentage of Population Employed in Transportation & Warehousing in Richland, WA
RELATED REPORTS & OPTIONS
Transportation & Warehousing
Richland
Compare Zip Codes
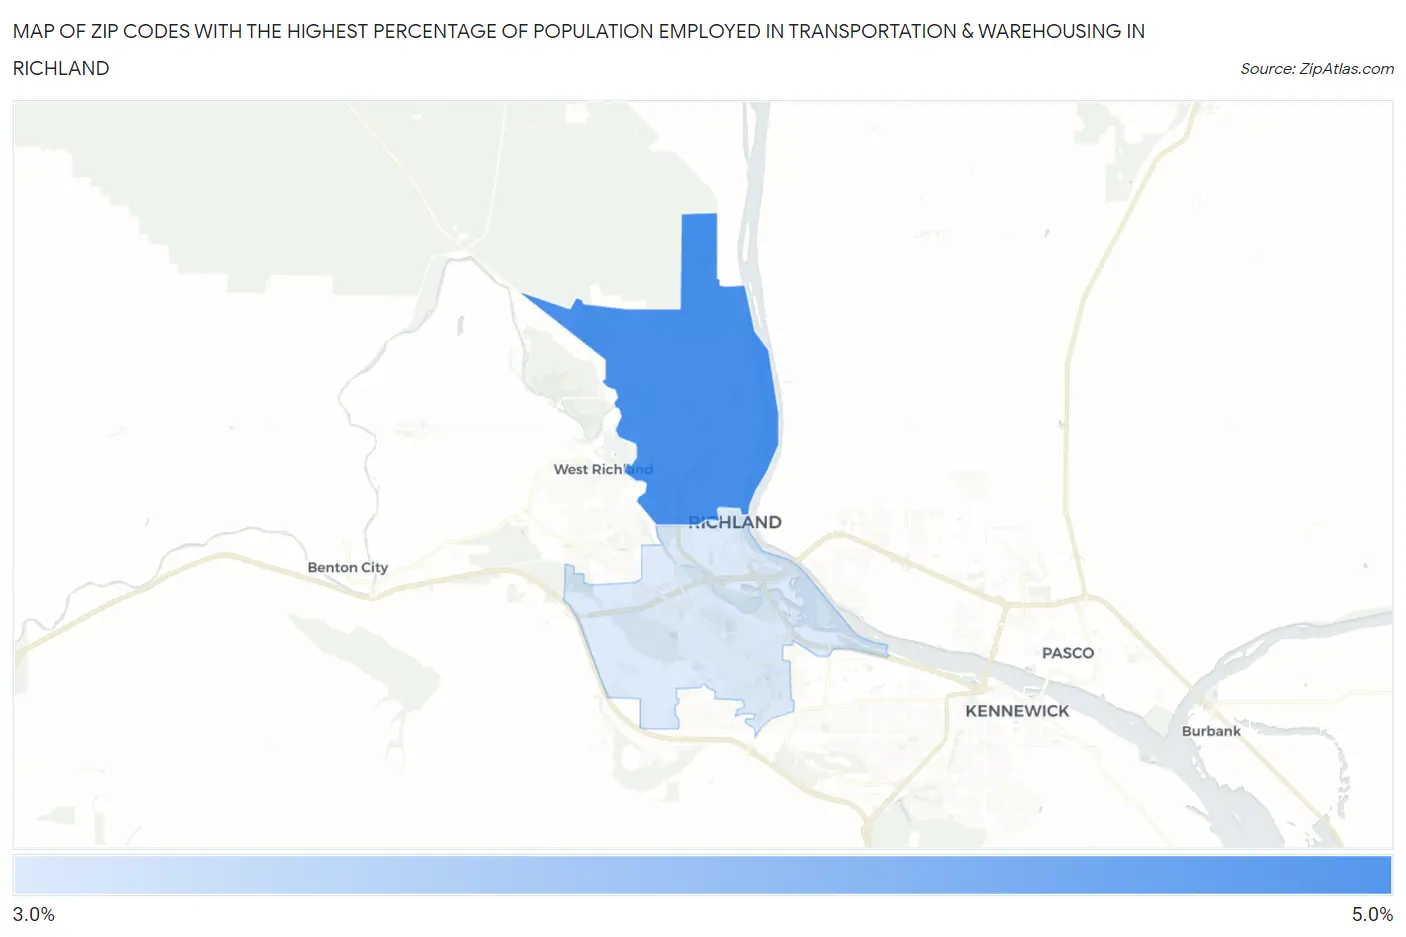
Map of Zip Codes with the Highest Percentage of Population Employed in Transportation & Warehousing in Richland
3.5%
4.9%
Zip Codes with the Highest Percentage of Population Employed in Transportation & Warehousing in Richland, WA
| Zip Code | % Employed | vs State | vs National | |
| 1. | 99354 | 4.9% | 4.9%(-0.061)#222 | 4.9%(-0.094)#12,435 |
| 2. | 99352 | 3.5% | 4.9%(-1.39)#317 | 4.9%(-1.43)#17,992 |
1
Common Questions
What are the Top Zip Codes with the Highest Percentage of Population Employed in Transportation & Warehousing in Richland, WA?
Top Zip Codes with the Highest Percentage of Population Employed in Transportation & Warehousing in Richland, WA are:
What zip code has the Highest Percentage of Population Employed in Transportation & Warehousing in Richland, WA?
99354 has the Highest Percentage of Population Employed in Transportation & Warehousing in Richland, WA with 4.9%.
What is the Percentage of Population Employed in Transportation & Warehousing in Richland, WA?
Percentage of Population Employed in Transportation & Warehousing in Richland is 4.2%.
What is the Percentage of Population Employed in Transportation & Warehousing in Washington?
Percentage of Population Employed in Transportation & Warehousing in Washington is 4.9%.
What is the Percentage of Population Employed in Transportation & Warehousing in the United States?
Percentage of Population Employed in Transportation & Warehousing in the United States is 4.9%.