Zip Codes with the Highest Percentage of Population Employed in Agriculture, Fishing & Hunting in Renton, WA
RELATED REPORTS & OPTIONS
Agriculture, Fishing & Hunting
Renton
Compare Zip Codes
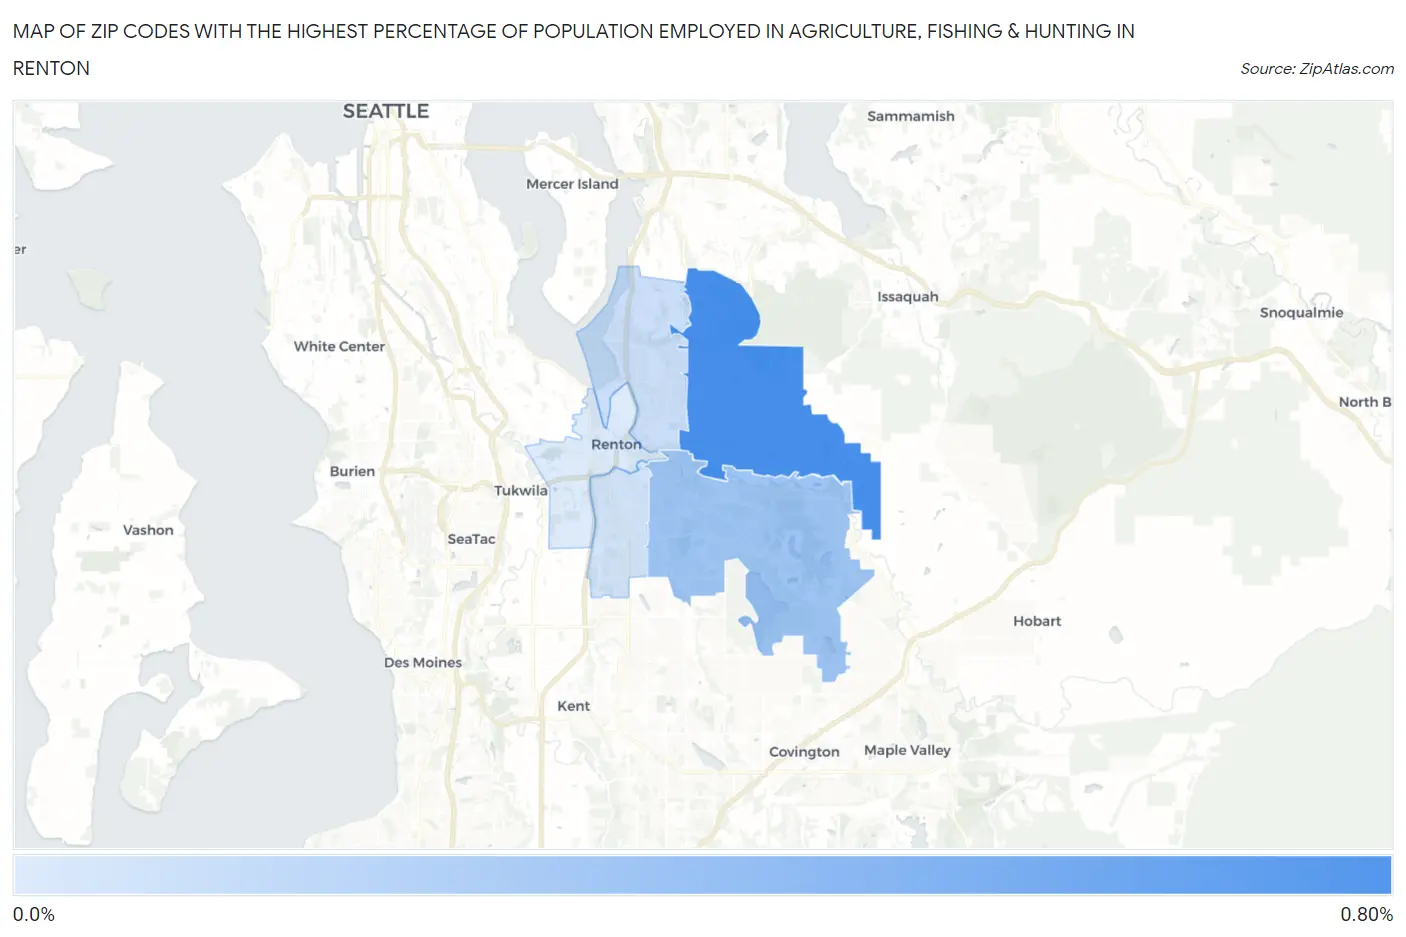
Map of Zip Codes with the Highest Percentage of Population Employed in Agriculture, Fishing & Hunting in Renton
0.013%
0.71%
Zip Codes with the Highest Percentage of Population Employed in Agriculture, Fishing & Hunting in Renton, WA
| Zip Code | % Employed | vs State | vs National | |
| 1. | 98059 | 0.71% | 2.4%(-1.68)#377 | 1.2%(-0.486)#17,777 |
| 2. | 98058 | 0.31% | 2.4%(-2.08)#449 | 1.2%(-0.890)#21,070 |
| 3. | 98056 | 0.10% | 2.4%(-2.29)#498 | 1.2%(-1.10)#23,659 |
| 4. | 98055 | 0.068% | 2.4%(-2.32)#504 | 1.2%(-1.13)#24,131 |
| 5. | 98057 | 0.013% | 2.4%(-2.38)#505 | 1.2%(-1.19)#24,610 |
1
Common Questions
What are the Top 3 Zip Codes with the Highest Percentage of Population Employed in Agriculture, Fishing & Hunting in Renton, WA?
Top 3 Zip Codes with the Highest Percentage of Population Employed in Agriculture, Fishing & Hunting in Renton, WA are:
What zip code has the Highest Percentage of Population Employed in Agriculture, Fishing & Hunting in Renton, WA?
98059 has the Highest Percentage of Population Employed in Agriculture, Fishing & Hunting in Renton, WA with 0.71%.
What is the Percentage of Population Employed in Agriculture, Fishing & Hunting in Renton, WA?
Percentage of Population Employed in Agriculture, Fishing & Hunting in Renton is 0.22%.
What is the Percentage of Population Employed in Agriculture, Fishing & Hunting in Washington?
Percentage of Population Employed in Agriculture, Fishing & Hunting in Washington is 2.4%.
What is the Percentage of Population Employed in Agriculture, Fishing & Hunting in the United States?
Percentage of Population Employed in Agriculture, Fishing & Hunting in the United States is 1.2%.