Zip Codes with the Highest Percentage of Population Employed in Farming, Fishing & Forestry in Renton, WA
RELATED REPORTS & OPTIONS
Farming, Fishing & Forestry
Renton
Compare Zip Codes
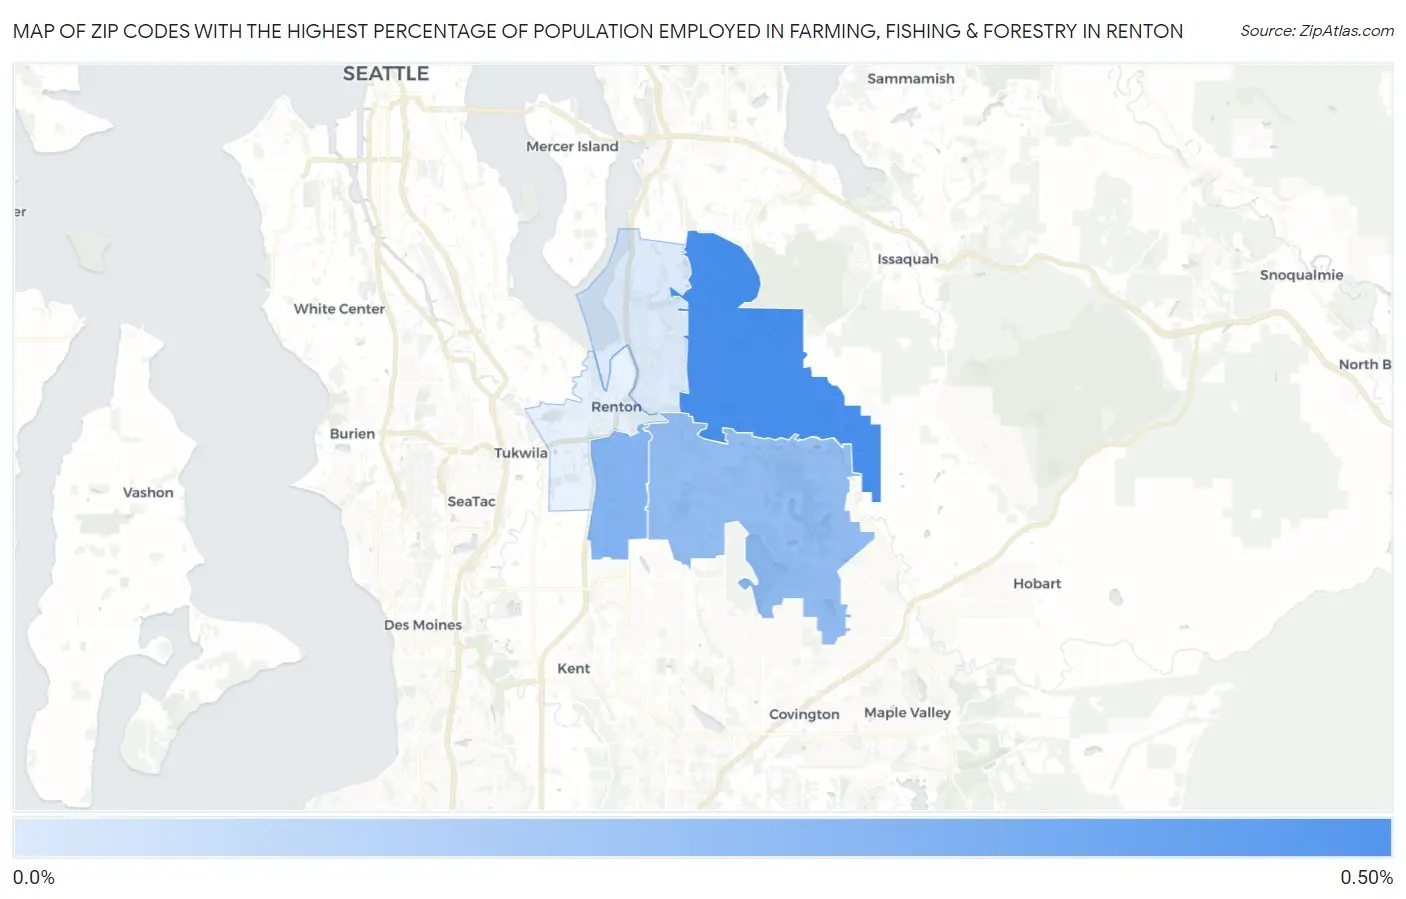
Map of Zip Codes with the Highest Percentage of Population Employed in Farming, Fishing & Forestry in Renton
0.051%
0.46%
Zip Codes with the Highest Percentage of Population Employed in Farming, Fishing & Forestry in Renton, WA
| Zip Code | % Employed | vs State | vs National | |
| 1. | 98059 | 0.46% | 1.5%(-1.06)#315 | 0.61%(-0.150)#13,240 |
| 2. | 98055 | 0.29% | 1.5%(-1.23)#352 | 0.61%(-0.320)#15,004 |
| 3. | 98058 | 0.25% | 1.5%(-1.26)#364 | 0.61%(-0.357)#15,430 |
| 4. | 98056 | 0.051% | 1.5%(-1.46)#424 | 0.61%(-0.555)#18,647 |
1
Common Questions
What are the Top 3 Zip Codes with the Highest Percentage of Population Employed in Farming, Fishing & Forestry in Renton, WA?
Top 3 Zip Codes with the Highest Percentage of Population Employed in Farming, Fishing & Forestry in Renton, WA are:
What zip code has the Highest Percentage of Population Employed in Farming, Fishing & Forestry in Renton, WA?
98059 has the Highest Percentage of Population Employed in Farming, Fishing & Forestry in Renton, WA with 0.46%.
What is the Percentage of Population Employed in Farming, Fishing & Forestry in Renton, WA?
Percentage of Population Employed in Farming, Fishing & Forestry in Renton is 0.26%.
What is the Percentage of Population Employed in Farming, Fishing & Forestry in Washington?
Percentage of Population Employed in Farming, Fishing & Forestry in Washington is 1.5%.
What is the Percentage of Population Employed in Farming, Fishing & Forestry in the United States?
Percentage of Population Employed in Farming, Fishing & Forestry in the United States is 0.61%.