Immigrants from Panama vs Laotian 1 or more Vehicles in Household
COMPARE
Immigrants from Panama
Laotian
1 or more Vehicles in Household
1 or more Vehicles in Household Comparison
Immigrants from Panama
Laotians
85.4%
1 OR MORE VEHICLES IN HOUSEHOLD
0.0/ 100
METRIC RATING
301st/ 347
METRIC RANK
91.0%
1 OR MORE VEHICLES IN HOUSEHOLD
98.0/ 100
METRIC RATING
105th/ 347
METRIC RANK
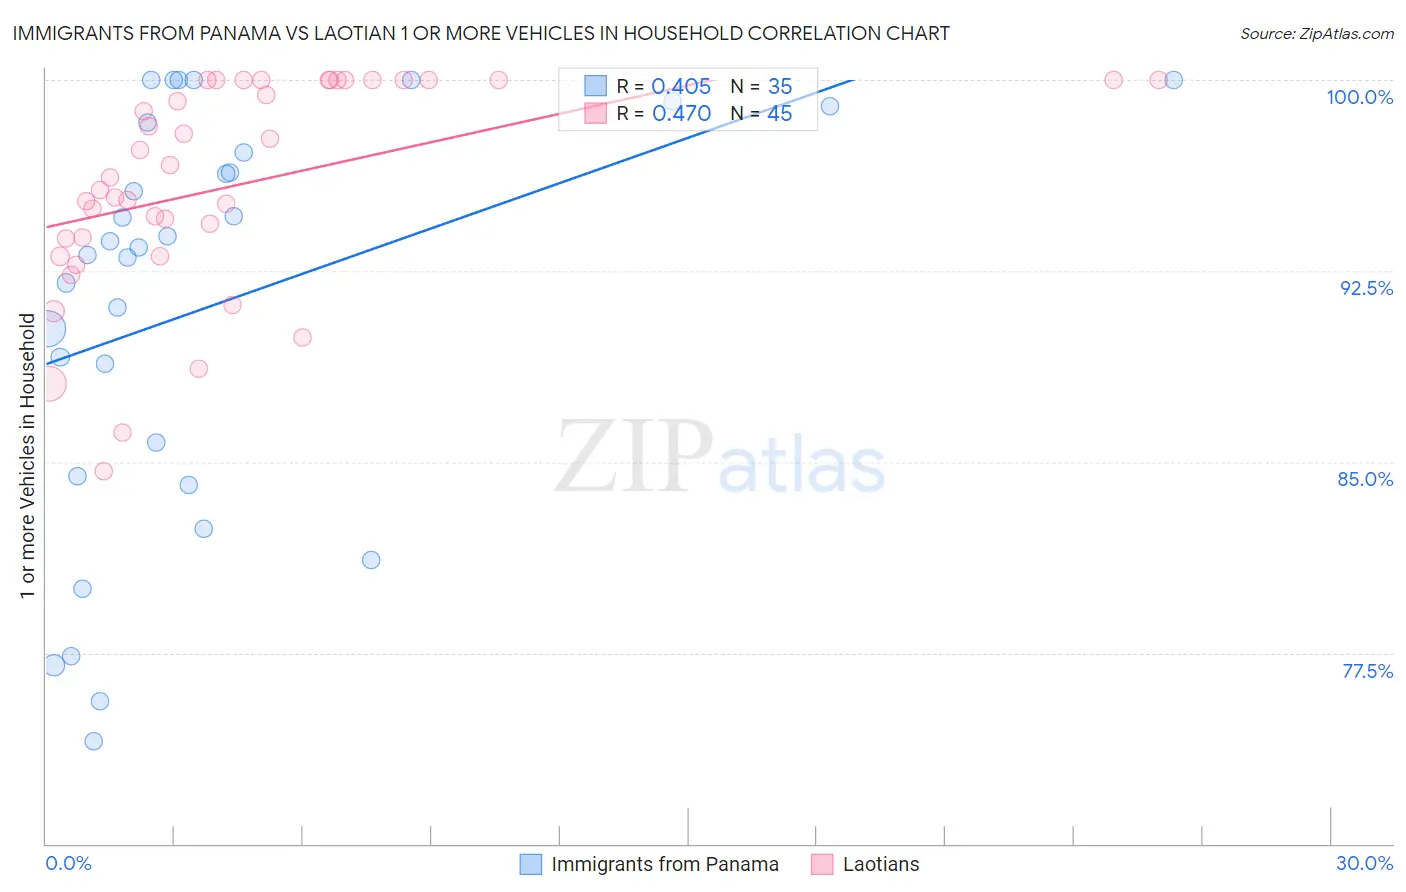
Immigrants from Panama vs Laotian 1 or more Vehicles in Household Correlation Chart
The statistical analysis conducted on geographies consisting of 221,156,465 people shows a moderate positive correlation between the proportion of Immigrants from Panama and percentage of households with 1 or more vehicles available in the United States with a correlation coefficient (R) of 0.405 and weighted average of 85.4%. Similarly, the statistical analysis conducted on geographies consisting of 224,651,996 people shows a moderate positive correlation between the proportion of Laotians and percentage of households with 1 or more vehicles available in the United States with a correlation coefficient (R) of 0.470 and weighted average of 91.0%, a difference of 6.6%.
1 or more Vehicles in Household Correlation Summary
| Measurement | Immigrants from Panama | Laotian |
| Minimum | 74.0% | 84.6% |
| Maximum | 100.0% | 100.0% |
| Range | 26.0% | 15.4% |
| Mean | 91.2% | 95.9% |
| Median | 93.4% | 96.2% |
| Interquartile 25% (IQ1) | 84.4% | 93.4% |
| Interquartile 75% (IQ3) | 98.3% | 100.0% |
| Interquartile Range (IQR) | 13.9% | 6.6% |
| Standard Deviation (Sample) | 8.0% | 4.1% |
| Standard Deviation (Population) | 7.9% | 4.1% |
Similar Demographics by 1 or more Vehicles in Household
Demographics Similar to Immigrants from Panama by 1 or more Vehicles in Household
In terms of 1 or more vehicles in household, the demographic groups most similar to Immigrants from Panama are Moroccan (85.4%, a difference of 0.020%), Immigrants from Russia (85.4%, a difference of 0.040%), Yuman (85.5%, a difference of 0.050%), Immigrants from Greece (85.4%, a difference of 0.050%), and Immigrants from Ukraine (85.2%, a difference of 0.22%).
| Demographics | Rating | Rank | 1 or more Vehicles in Household |
| Alaskan Athabascans | 0.0 /100 | #294 | Tragic 86.0% |
| Immigrants | Jamaica | 0.0 /100 | #295 | Tragic 85.8% |
| Immigrants | Spain | 0.0 /100 | #296 | Tragic 85.8% |
| Paraguayans | 0.0 /100 | #297 | Tragic 85.7% |
| Belizeans | 0.0 /100 | #298 | Tragic 85.7% |
| Yuman | 0.0 /100 | #299 | Tragic 85.5% |
| Immigrants | Russia | 0.0 /100 | #300 | Tragic 85.4% |
| Immigrants | Panama | 0.0 /100 | #301 | Tragic 85.4% |
| Moroccans | 0.0 /100 | #302 | Tragic 85.4% |
| Immigrants | Greece | 0.0 /100 | #303 | Tragic 85.4% |
| Immigrants | Ukraine | 0.0 /100 | #304 | Tragic 85.2% |
| Immigrants | China | 0.0 /100 | #305 | Tragic 84.9% |
| Immigrants | Western Africa | 0.0 /100 | #306 | Tragic 84.9% |
| Tohono O'odham | 0.0 /100 | #307 | Tragic 84.7% |
| Immigrants | Belize | 0.0 /100 | #308 | Tragic 84.7% |
Demographics Similar to Laotians by 1 or more Vehicles in Household
In terms of 1 or more vehicles in household, the demographic groups most similar to Laotians are Asian (91.1%, a difference of 0.040%), Zimbabwean (91.0%, a difference of 0.040%), Yugoslavian (91.1%, a difference of 0.060%), Maltese (91.0%, a difference of 0.060%), and Hispanic or Latino (91.0%, a difference of 0.060%).
| Demographics | Rating | Rank | 1 or more Vehicles in Household |
| Slavs | 98.7 /100 | #98 | Exceptional 91.2% |
| Immigrants | Bolivia | 98.6 /100 | #99 | Exceptional 91.2% |
| Immigrants | Central America | 98.4 /100 | #100 | Exceptional 91.1% |
| Bulgarians | 98.4 /100 | #101 | Exceptional 91.1% |
| Seminole | 98.3 /100 | #102 | Exceptional 91.1% |
| Yugoslavians | 98.3 /100 | #103 | Exceptional 91.1% |
| Asians | 98.2 /100 | #104 | Exceptional 91.1% |
| Laotians | 98.0 /100 | #105 | Exceptional 91.0% |
| Zimbabweans | 97.7 /100 | #106 | Exceptional 91.0% |
| Maltese | 97.7 /100 | #107 | Exceptional 91.0% |
| Hispanics or Latinos | 97.6 /100 | #108 | Exceptional 91.0% |
| Delaware | 97.6 /100 | #109 | Exceptional 91.0% |
| Mexican American Indians | 97.4 /100 | #110 | Exceptional 91.0% |
| Navajo | 95.8 /100 | #111 | Exceptional 90.8% |
| Immigrants | Netherlands | 95.7 /100 | #112 | Exceptional 90.8% |