Immigrants from Micronesia vs Immigrants from Ghana 1 or more Vehicles in Household
COMPARE
Immigrants from Micronesia
Immigrants from Ghana
1 or more Vehicles in Household
1 or more Vehicles in Household Comparison
Immigrants from Micronesia
Immigrants from Ghana
90.1%
1 OR MORE VEHICLES IN HOUSEHOLD
75.9/ 100
METRIC RATING
150th/ 347
METRIC RANK
83.4%
1 OR MORE VEHICLES IN HOUSEHOLD
0.0/ 100
METRIC RATING
318th/ 347
METRIC RANK
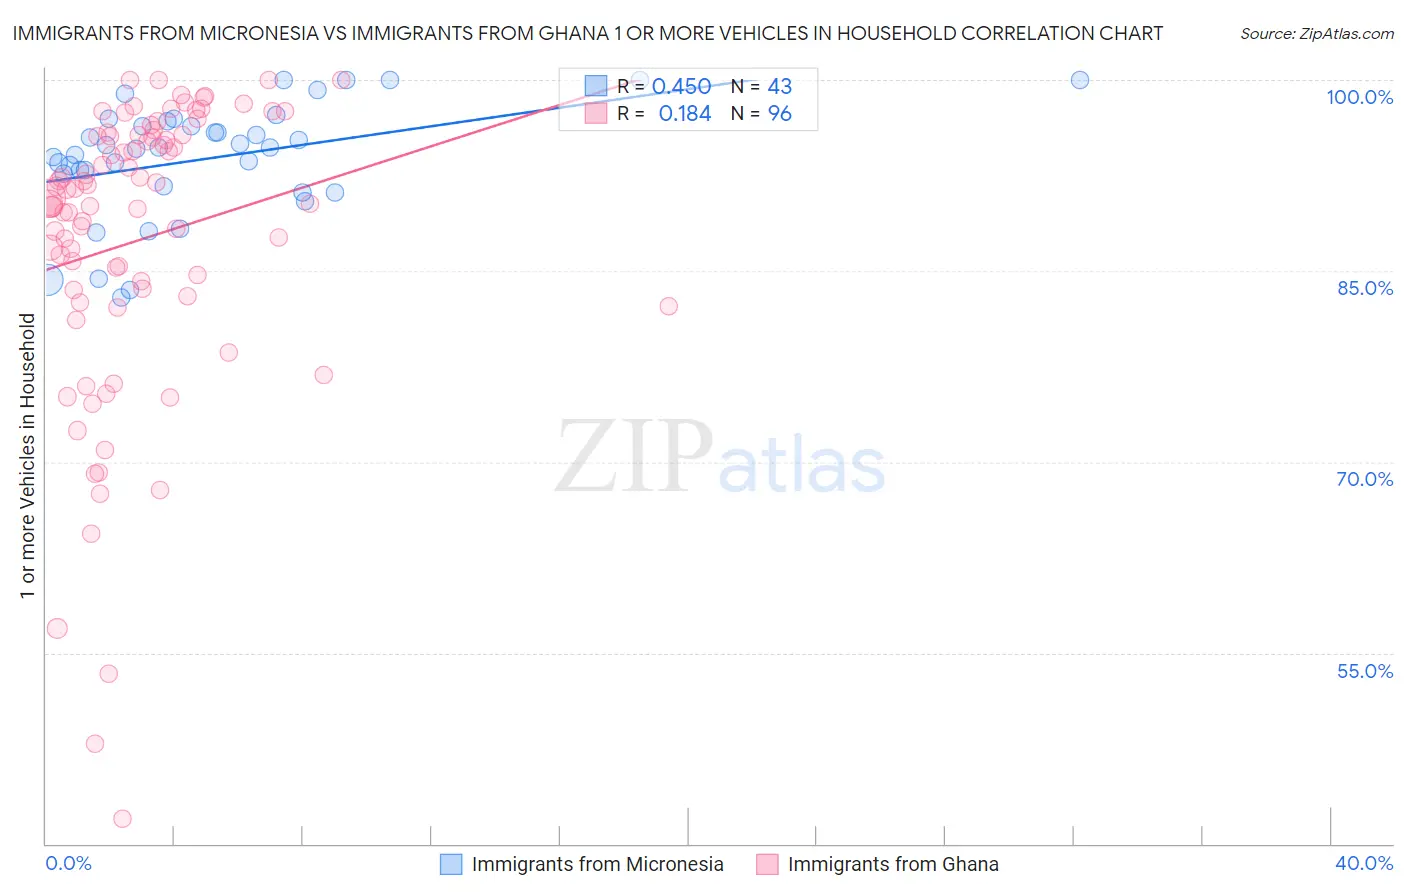
Immigrants from Micronesia vs Immigrants from Ghana 1 or more Vehicles in Household Correlation Chart
The statistical analysis conducted on geographies consisting of 61,591,588 people shows a moderate positive correlation between the proportion of Immigrants from Micronesia and percentage of households with 1 or more vehicles available in the United States with a correlation coefficient (R) of 0.450 and weighted average of 90.1%. Similarly, the statistical analysis conducted on geographies consisting of 199,558,175 people shows a poor positive correlation between the proportion of Immigrants from Ghana and percentage of households with 1 or more vehicles available in the United States with a correlation coefficient (R) of 0.184 and weighted average of 83.4%, a difference of 8.0%.
1 or more Vehicles in Household Correlation Summary
| Measurement | Immigrants from Micronesia | Immigrants from Ghana |
| Minimum | 83.0% | 42.0% |
| Maximum | 100.0% | 100.0% |
| Range | 17.0% | 58.0% |
| Mean | 93.8% | 87.4% |
| Median | 94.7% | 90.5% |
| Interquartile 25% (IQ1) | 91.7% | 83.3% |
| Interquartile 75% (IQ3) | 96.8% | 95.6% |
| Interquartile Range (IQR) | 5.1% | 12.3% |
| Standard Deviation (Sample) | 4.5% | 11.7% |
| Standard Deviation (Population) | 4.5% | 11.7% |
Similar Demographics by 1 or more Vehicles in Household
Demographics Similar to Immigrants from Micronesia by 1 or more Vehicles in Household
In terms of 1 or more vehicles in household, the demographic groups most similar to Immigrants from Micronesia are Immigrants from Bosnia and Herzegovina (90.1%, a difference of 0.010%), Immigrants from Nicaragua (90.1%, a difference of 0.020%), Tlingit-Haida (90.1%, a difference of 0.030%), New Zealander (90.1%, a difference of 0.040%), and Immigrants from Uganda (90.1%, a difference of 0.040%).
| Demographics | Rating | Rank | 1 or more Vehicles in Household |
| Immigrants | Bahamas | 81.5 /100 | #143 | Excellent 90.2% |
| Immigrants | Zimbabwe | 81.5 /100 | #144 | Excellent 90.2% |
| Sioux | 81.3 /100 | #145 | Excellent 90.2% |
| Bahamians | 80.5 /100 | #146 | Excellent 90.2% |
| Chileans | 79.8 /100 | #147 | Good 90.2% |
| Immigrants | Eastern Africa | 78.2 /100 | #148 | Good 90.1% |
| Immigrants | Nicaragua | 76.7 /100 | #149 | Good 90.1% |
| Immigrants | Micronesia | 75.9 /100 | #150 | Good 90.1% |
| Immigrants | Bosnia and Herzegovina | 75.4 /100 | #151 | Good 90.1% |
| Tlingit-Haida | 74.3 /100 | #152 | Good 90.1% |
| New Zealanders | 73.8 /100 | #153 | Good 90.1% |
| Immigrants | Uganda | 73.8 /100 | #154 | Good 90.1% |
| Immigrants | Immigrants | 73.6 /100 | #155 | Good 90.1% |
| Australians | 72.4 /100 | #156 | Good 90.0% |
| Immigrants | Congo | 71.2 /100 | #157 | Good 90.0% |
Demographics Similar to Immigrants from Ghana by 1 or more Vehicles in Household
In terms of 1 or more vehicles in household, the demographic groups most similar to Immigrants from Ghana are Immigrants from Belarus (83.3%, a difference of 0.13%), Ghanaian (83.6%, a difference of 0.20%), Alaska Native (83.8%, a difference of 0.42%), Soviet Union (82.7%, a difference of 0.94%), and Cypriot (84.4%, a difference of 1.1%).
| Demographics | Rating | Rank | 1 or more Vehicles in Household |
| Puerto Ricans | 0.0 /100 | #311 | Tragic 84.6% |
| Cape Verdeans | 0.0 /100 | #312 | Tragic 84.5% |
| Immigrants | Israel | 0.0 /100 | #313 | Tragic 84.5% |
| Albanians | 0.0 /100 | #314 | Tragic 84.4% |
| Cypriots | 0.0 /100 | #315 | Tragic 84.4% |
| Alaska Natives | 0.0 /100 | #316 | Tragic 83.8% |
| Ghanaians | 0.0 /100 | #317 | Tragic 83.6% |
| Immigrants | Ghana | 0.0 /100 | #318 | Tragic 83.4% |
| Immigrants | Belarus | 0.0 /100 | #319 | Tragic 83.3% |
| Soviet Union | 0.0 /100 | #320 | Tragic 82.7% |
| Jamaicans | 0.0 /100 | #321 | Tragic 82.1% |
| Immigrants | Cabo Verde | 0.0 /100 | #322 | Tragic 81.6% |
| Immigrants | Yemen | 0.0 /100 | #323 | Tragic 80.5% |
| Immigrants | Caribbean | 0.0 /100 | #324 | Tragic 80.4% |
| Senegalese | 0.0 /100 | #325 | Tragic 80.4% |