Immigrants from Laos vs Immigrants from West Indies 1 or more Vehicles in Household
COMPARE
Immigrants from Laos
Immigrants from West Indies
1 or more Vehicles in Household
1 or more Vehicles in Household Comparison
Immigrants from Laos
Immigrants from West Indies
91.8%
1 OR MORE VEHICLES IN HOUSEHOLD
99.8/ 100
METRIC RATING
65th/ 347
METRIC RANK
79.5%
1 OR MORE VEHICLES IN HOUSEHOLD
0.0/ 100
METRIC RATING
326th/ 347
METRIC RANK
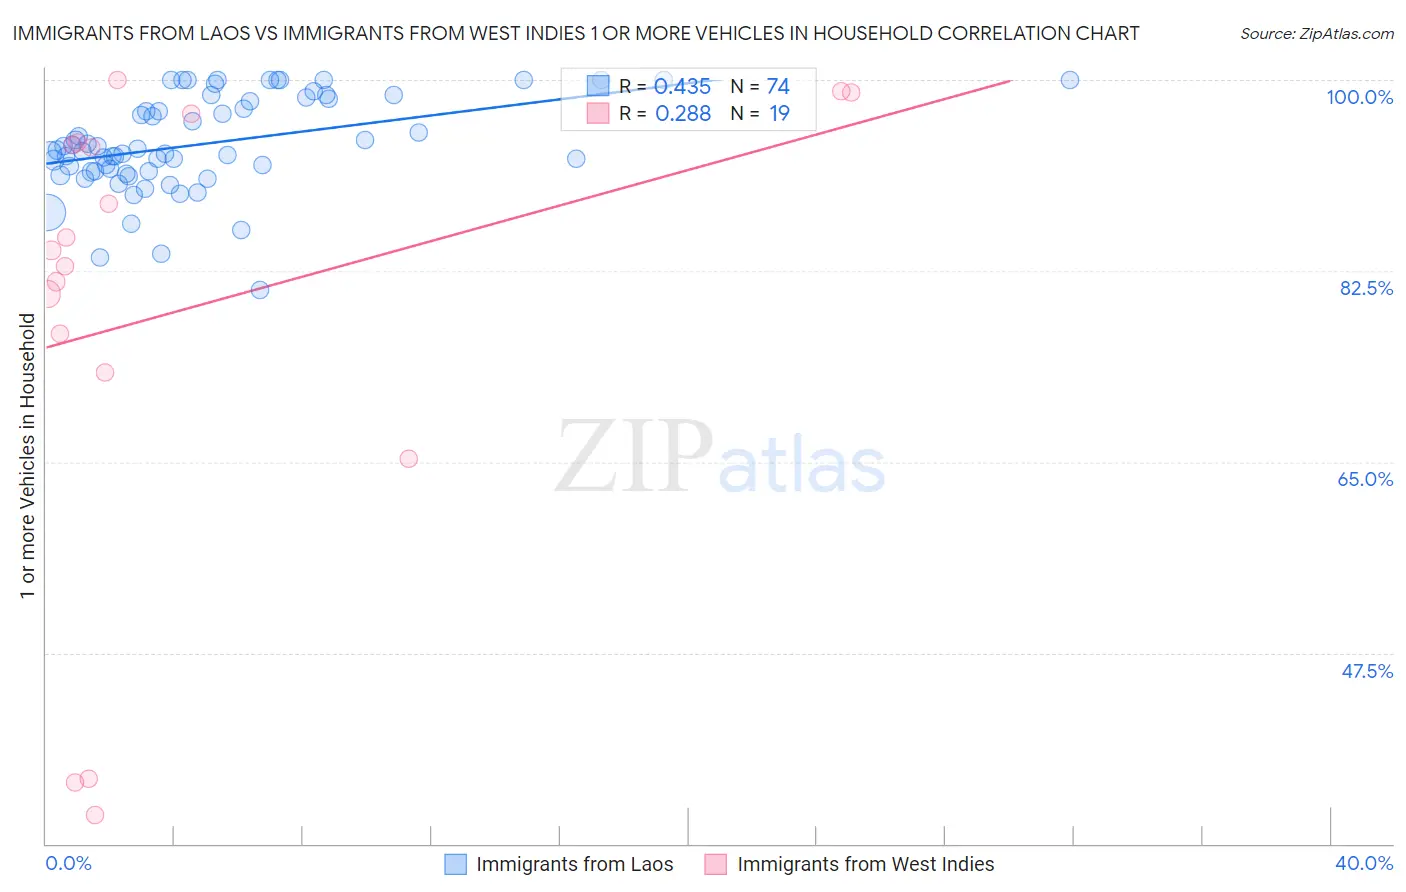
Immigrants from Laos vs Immigrants from West Indies 1 or more Vehicles in Household Correlation Chart
The statistical analysis conducted on geographies consisting of 201,467,889 people shows a moderate positive correlation between the proportion of Immigrants from Laos and percentage of households with 1 or more vehicles available in the United States with a correlation coefficient (R) of 0.435 and weighted average of 91.8%. Similarly, the statistical analysis conducted on geographies consisting of 72,454,628 people shows a weak positive correlation between the proportion of Immigrants from West Indies and percentage of households with 1 or more vehicles available in the United States with a correlation coefficient (R) of 0.288 and weighted average of 79.5%, a difference of 15.5%.
1 or more Vehicles in Household Correlation Summary
| Measurement | Immigrants from Laos | Immigrants from West Indies |
| Minimum | 80.7% | 32.7% |
| Maximum | 100.0% | 100.0% |
| Range | 19.3% | 67.3% |
| Mean | 94.2% | 78.9% |
| Median | 93.5% | 84.4% |
| Interquartile 25% (IQ1) | 91.6% | 73.2% |
| Interquartile 75% (IQ3) | 98.3% | 94.3% |
| Interquartile Range (IQR) | 6.7% | 21.1% |
| Standard Deviation (Sample) | 4.4% | 21.8% |
| Standard Deviation (Population) | 4.3% | 21.2% |
Similar Demographics by 1 or more Vehicles in Household
Demographics Similar to Immigrants from Laos by 1 or more Vehicles in Household
In terms of 1 or more vehicles in household, the demographic groups most similar to Immigrants from Laos are Canadian (91.8%, a difference of 0.020%), Chinese (91.9%, a difference of 0.030%), Croatian (91.9%, a difference of 0.030%), Spaniard (91.8%, a difference of 0.040%), and Immigrants from India (91.9%, a difference of 0.060%).
| Demographics | Rating | Rank | 1 or more Vehicles in Household |
| Immigrants | Mexico | 99.8 /100 | #58 | Exceptional 91.9% |
| Venezuelans | 99.8 /100 | #59 | Exceptional 91.9% |
| Slovaks | 99.8 /100 | #60 | Exceptional 91.9% |
| Immigrants | India | 99.8 /100 | #61 | Exceptional 91.9% |
| Thais | 99.8 /100 | #62 | Exceptional 91.9% |
| Chinese | 99.8 /100 | #63 | Exceptional 91.9% |
| Croatians | 99.8 /100 | #64 | Exceptional 91.9% |
| Immigrants | Laos | 99.8 /100 | #65 | Exceptional 91.8% |
| Canadians | 99.8 /100 | #66 | Exceptional 91.8% |
| Spaniards | 99.8 /100 | #67 | Exceptional 91.8% |
| Immigrants | Scotland | 99.7 /100 | #68 | Exceptional 91.8% |
| Palestinians | 99.7 /100 | #69 | Exceptional 91.7% |
| Lithuanians | 99.7 /100 | #70 | Exceptional 91.7% |
| Poles | 99.7 /100 | #71 | Exceptional 91.7% |
| Cajuns | 99.7 /100 | #72 | Exceptional 91.7% |
Demographics Similar to Immigrants from West Indies by 1 or more Vehicles in Household
In terms of 1 or more vehicles in household, the demographic groups most similar to Immigrants from West Indies are Immigrants from Senegal (79.0%, a difference of 0.63%), Senegalese (80.4%, a difference of 1.1%), Immigrants from Caribbean (80.4%, a difference of 1.2%), Immigrants from Yemen (80.5%, a difference of 1.3%), and Ecuadorian (77.9%, a difference of 2.0%).
| Demographics | Rating | Rank | 1 or more Vehicles in Household |
| Immigrants | Belarus | 0.0 /100 | #319 | Tragic 83.3% |
| Soviet Union | 0.0 /100 | #320 | Tragic 82.7% |
| Jamaicans | 0.0 /100 | #321 | Tragic 82.1% |
| Immigrants | Cabo Verde | 0.0 /100 | #322 | Tragic 81.6% |
| Immigrants | Yemen | 0.0 /100 | #323 | Tragic 80.5% |
| Immigrants | Caribbean | 0.0 /100 | #324 | Tragic 80.4% |
| Senegalese | 0.0 /100 | #325 | Tragic 80.4% |
| Immigrants | West Indies | 0.0 /100 | #326 | Tragic 79.5% |
| Immigrants | Senegal | 0.0 /100 | #327 | Tragic 79.0% |
| Ecuadorians | 0.0 /100 | #328 | Tragic 77.9% |
| Immigrants | Dominica | 0.0 /100 | #329 | Tragic 77.8% |
| Immigrants | Trinidad and Tobago | 0.0 /100 | #330 | Tragic 76.8% |
| West Indians | 0.0 /100 | #331 | Tragic 76.4% |
| Trinidadians and Tobagonians | 0.0 /100 | #332 | Tragic 76.3% |
| Immigrants | Ecuador | 0.0 /100 | #333 | Tragic 76.2% |