Immigrants from Hungary vs South American Indian 1 or more Vehicles in Household
COMPARE
Immigrants from Hungary
South American Indian
1 or more Vehicles in Household
1 or more Vehicles in Household Comparison
Immigrants from Hungary
South American Indians
89.0%
1 OR MORE VEHICLES IN HOUSEHOLD
11.9/ 100
METRIC RATING
214th/ 347
METRIC RANK
88.0%
1 OR MORE VEHICLES IN HOUSEHOLD
0.9/ 100
METRIC RATING
258th/ 347
METRIC RANK
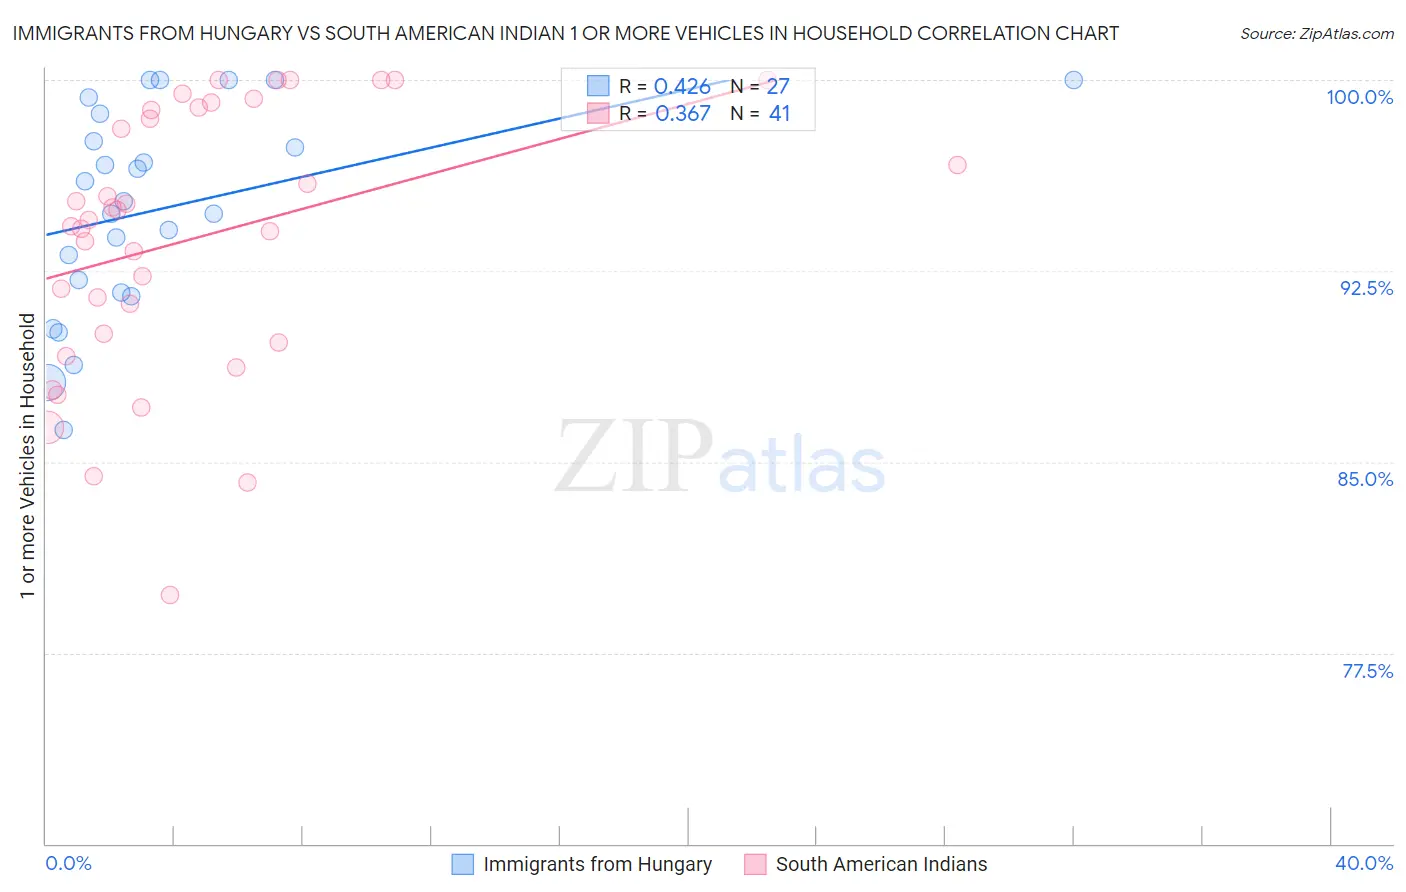
Immigrants from Hungary vs South American Indian 1 or more Vehicles in Household Correlation Chart
The statistical analysis conducted on geographies consisting of 195,676,592 people shows a moderate positive correlation between the proportion of Immigrants from Hungary and percentage of households with 1 or more vehicles available in the United States with a correlation coefficient (R) of 0.426 and weighted average of 89.0%. Similarly, the statistical analysis conducted on geographies consisting of 164,540,397 people shows a mild positive correlation between the proportion of South American Indians and percentage of households with 1 or more vehicles available in the United States with a correlation coefficient (R) of 0.367 and weighted average of 88.0%, a difference of 1.1%.
1 or more Vehicles in Household Correlation Summary
| Measurement | Immigrants from Hungary | South American Indian |
| Minimum | 86.3% | 79.8% |
| Maximum | 100.0% | 100.0% |
| Range | 13.7% | 20.2% |
| Mean | 94.9% | 93.8% |
| Median | 95.3% | 94.5% |
| Interquartile 25% (IQ1) | 91.7% | 89.9% |
| Interquartile 75% (IQ3) | 98.7% | 98.9% |
| Interquartile Range (IQR) | 7.0% | 9.0% |
| Standard Deviation (Sample) | 4.0% | 5.2% |
| Standard Deviation (Population) | 4.0% | 5.1% |
Similar Demographics by 1 or more Vehicles in Household
Demographics Similar to Immigrants from Hungary by 1 or more Vehicles in Household
In terms of 1 or more vehicles in household, the demographic groups most similar to Immigrants from Hungary are Immigrants from Western Asia (89.0%, a difference of 0.010%), Somali (89.0%, a difference of 0.030%), Sierra Leonean (89.0%, a difference of 0.040%), Dutch West Indian (89.0%, a difference of 0.060%), and Immigrants from Italy (89.1%, a difference of 0.070%).
| Demographics | Rating | Rank | 1 or more Vehicles in Household |
| Immigrants | Denmark | 14.8 /100 | #207 | Poor 89.1% |
| Immigrants | Chile | 14.4 /100 | #208 | Poor 89.1% |
| Immigrants | Italy | 14.0 /100 | #209 | Poor 89.1% |
| Dutch West Indians | 13.5 /100 | #210 | Poor 89.0% |
| Sierra Leoneans | 13.0 /100 | #211 | Poor 89.0% |
| Somalis | 12.8 /100 | #212 | Poor 89.0% |
| Immigrants | Western Asia | 12.3 /100 | #213 | Poor 89.0% |
| Immigrants | Hungary | 11.9 /100 | #214 | Poor 89.0% |
| Immigrants | Sri Lanka | 10.2 /100 | #215 | Poor 88.9% |
| Immigrants | Argentina | 9.4 /100 | #216 | Tragic 88.9% |
| Argentineans | 8.8 /100 | #217 | Tragic 88.9% |
| Ugandans | 8.7 /100 | #218 | Tragic 88.9% |
| Immigrants | Guatemala | 8.6 /100 | #219 | Tragic 88.9% |
| Immigrants | Zaire | 8.1 /100 | #220 | Tragic 88.8% |
| Peruvians | 7.9 /100 | #221 | Tragic 88.8% |
Demographics Similar to South American Indians by 1 or more Vehicles in Household
In terms of 1 or more vehicles in household, the demographic groups most similar to South American Indians are Liberian (88.0%, a difference of 0.0%), Immigrants from Latvia (88.1%, a difference of 0.010%), Colombian (88.0%, a difference of 0.010%), Nigerian (88.0%, a difference of 0.030%), and Honduran (88.1%, a difference of 0.040%).
| Demographics | Rating | Rank | 1 or more Vehicles in Household |
| Immigrants | Serbia | 1.2 /100 | #251 | Tragic 88.2% |
| Immigrants | Uruguay | 1.1 /100 | #252 | Tragic 88.1% |
| Hondurans | 1.0 /100 | #253 | Tragic 88.1% |
| Haitians | 0.9 /100 | #254 | Tragic 88.1% |
| Immigrants | Latvia | 0.9 /100 | #255 | Tragic 88.1% |
| Colombians | 0.9 /100 | #256 | Tragic 88.0% |
| Liberians | 0.9 /100 | #257 | Tragic 88.0% |
| South American Indians | 0.9 /100 | #258 | Tragic 88.0% |
| Nigerians | 0.8 /100 | #259 | Tragic 88.0% |
| Macedonians | 0.6 /100 | #260 | Tragic 87.9% |
| Immigrants | Switzerland | 0.6 /100 | #261 | Tragic 87.9% |
| Sub-Saharan Africans | 0.5 /100 | #262 | Tragic 87.9% |
| Immigrants | Egypt | 0.5 /100 | #263 | Tragic 87.8% |
| Immigrants | Liberia | 0.4 /100 | #264 | Tragic 87.8% |
| Africans | 0.4 /100 | #265 | Tragic 87.8% |