Zip Codes with the Highest Percentage of Hispanic or Latino Population in Gatesville, TX
RELATED REPORTS & OPTIONS
Hispanic or Latino
Gatesville
Compare Zip Codes
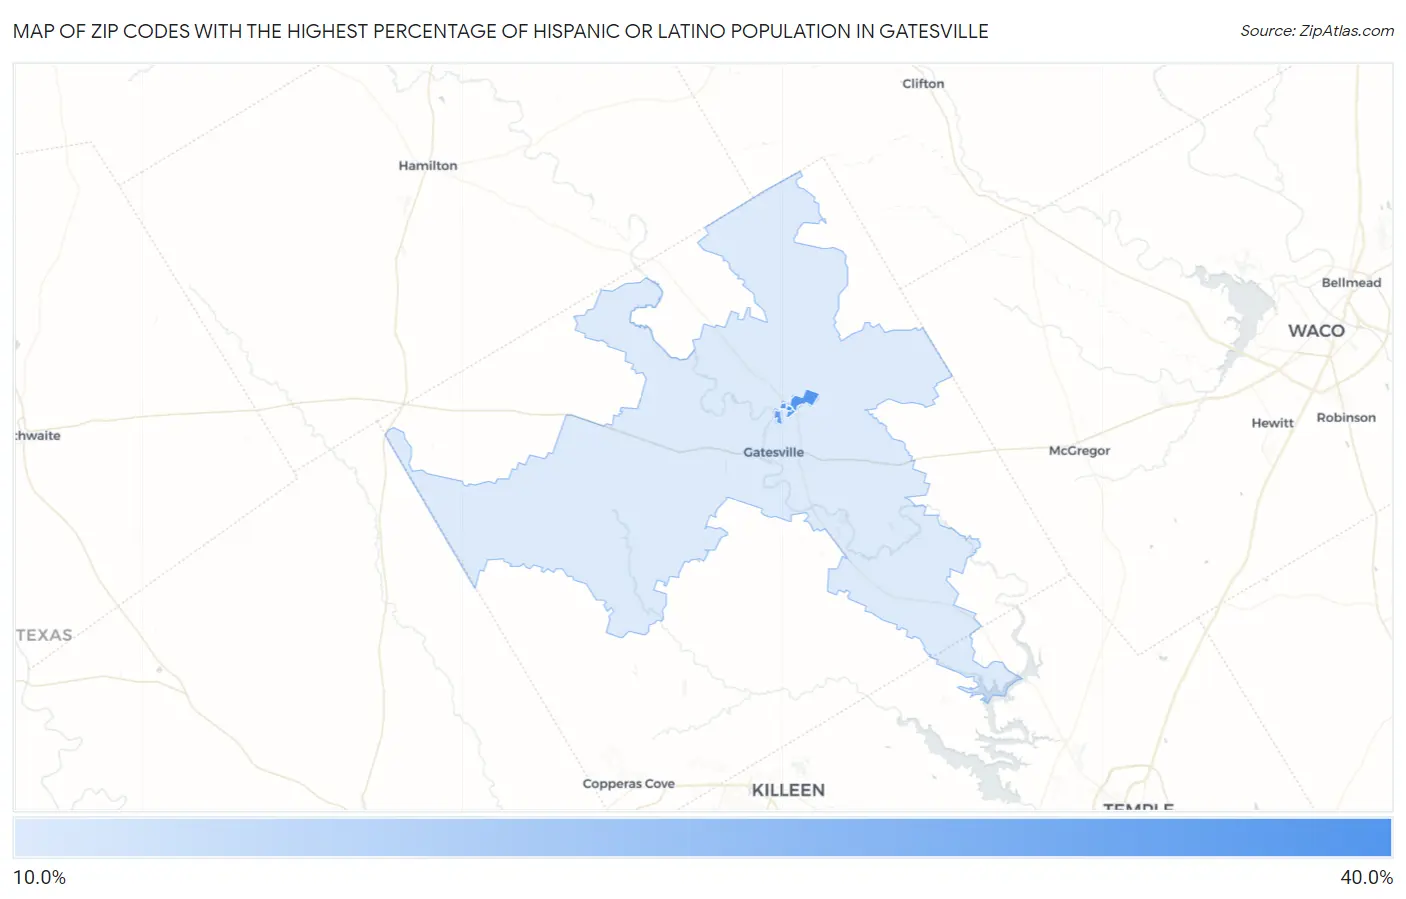
Map of Zip Codes with the Highest Percentage of Hispanic or Latino Population in Gatesville
16.6%
34.3%
Zip Codes with the Highest Percentage of Hispanic or Latino Population in Gatesville, TX
| Zip Code | Hispanic or Latino | vs State | vs National | |
| 1. | 76596 | 34.3% | 39.9%(-5.62)#730 | 18.7%(+15.6)#2,642 |
| 2. | 76597 | 32.9% | 39.9%(-6.97)#754 | 18.7%(+14.3)#2,784 |
| 3. | 76599 | 31.2% | 39.9%(-8.71)#791 | 18.7%(+12.5)#2,970 |
| 4. | 76598 | 23.4% | 39.9%(-16.5)#1,005 | 18.7%(+4.76)#4,095 |
| 5. | 76528 | 16.6% | 39.9%(-23.3)#1,275 | 18.7%(-2.08)#5,778 |
1
Common Questions
What are the Top 3 Zip Codes with the Highest Percentage of Hispanic or Latino Population in Gatesville, TX?
Top 3 Zip Codes with the Highest Percentage of Hispanic or Latino Population in Gatesville, TX are:
What zip code has the Highest Percentage of Hispanic or Latino Population in Gatesville, TX?
76596 has the Highest Percentage of Hispanic or Latino Population in Gatesville, TX with 34.3%.
What is the Percentage of Hispanic or Latino Population in Gatesville, TX?
Percentage of Hispanic or Latino Population in Gatesville is 25.2%.
What is the Percentage of Hispanic or Latino Population in Texas?
Percentage of Hispanic or Latino Population in Texas is 39.9%.
What is the Percentage of Hispanic or Latino Population in the United States?
Percentage of Hispanic or Latino Population in the United States is 18.7%.