Zip Codes with the Highest Percentage of Immigrants from Europe in Gatesville, TX
RELATED REPORTS & OPTIONS
Europe
Gatesville
Compare Zip Codes
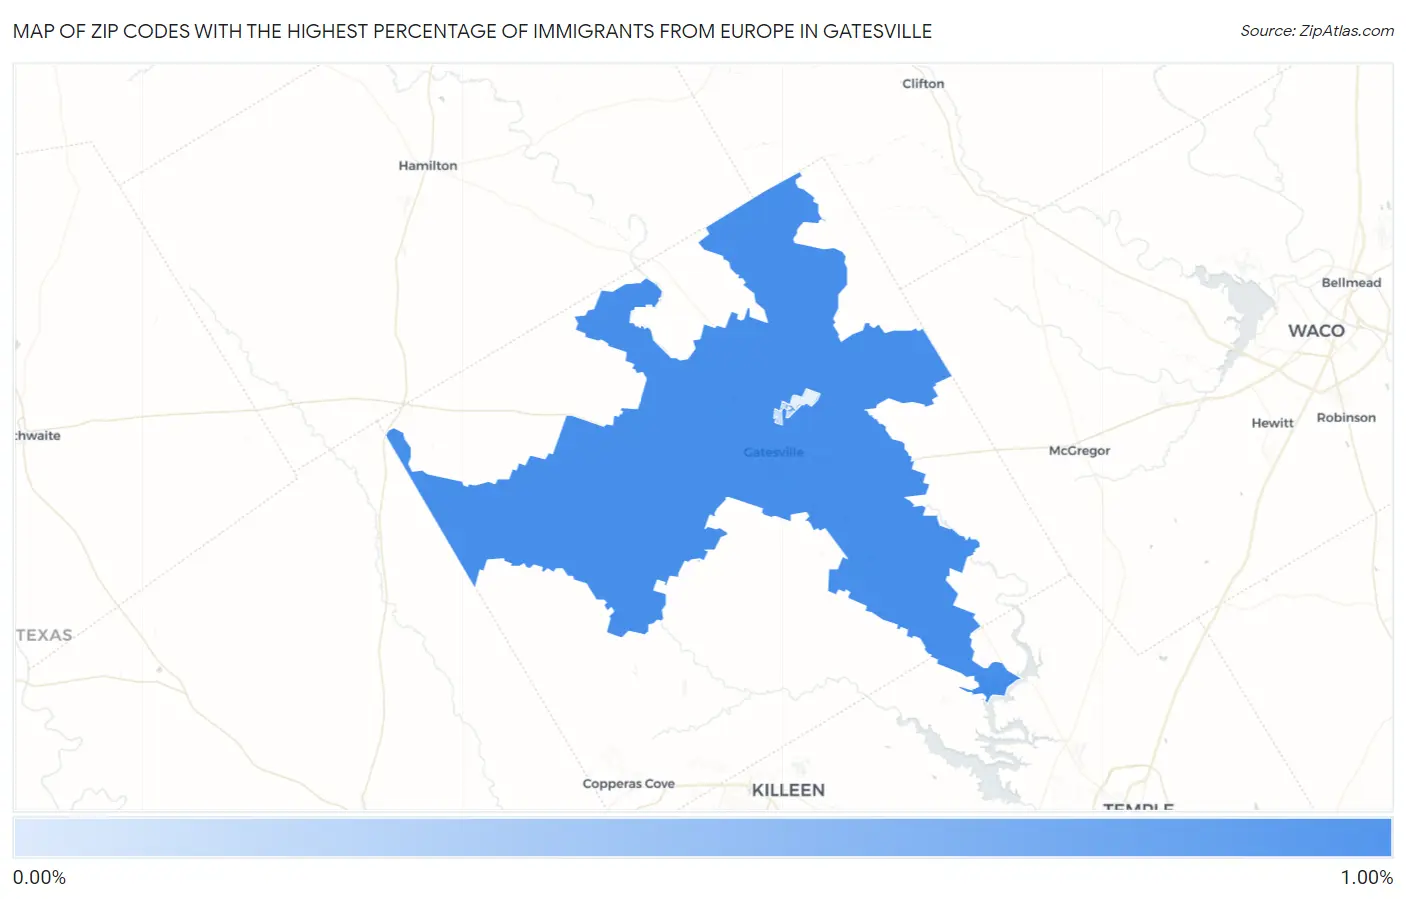
Map of Zip Codes with the Highest Percentage of Immigrants from Europe in Gatesville
0.11%
0.84%
Zip Codes with the Highest Percentage of Immigrants from Europe in Gatesville, TX
| Zip Code | Europe | vs State | vs National | |
| 1. | 76528 | 0.84% | 0.74%(+0.105)#373 | 1.46%(-0.612)#9,246 |
| 2. | 76599 | 0.11% | 0.74%(-0.626)#993 | 1.46%(-1.34)#18,574 |
1
Common Questions
What are the Top 3 Zip Codes with the Highest Percentage of Immigrants from Europe in Gatesville, TX?
Top 3 Zip Codes with the Highest Percentage of Immigrants from Europe in Gatesville, TX are:
What zip code has the Highest Percentage of Immigrants from Europe in Gatesville, TX?
76528 has the Highest Percentage of Immigrants from Europe in Gatesville, TX with 0.84%.
What is the Percentage of Immigrants from Europe in Gatesville, TX?
Percentage of Immigrants from Europe in Gatesville is 0.19%.
What is the Percentage of Immigrants from Europe in Texas?
Percentage of Immigrants from Europe in Texas is 0.74%.
What is the Percentage of Immigrants from Europe in the United States?
Percentage of Immigrants from Europe in the United States is 1.46%.