Zip Codes with the Highest Percentage of Immigrants from Africa in Gatesville, TX
RELATED REPORTS & OPTIONS
Africa
Gatesville
Compare Zip Codes
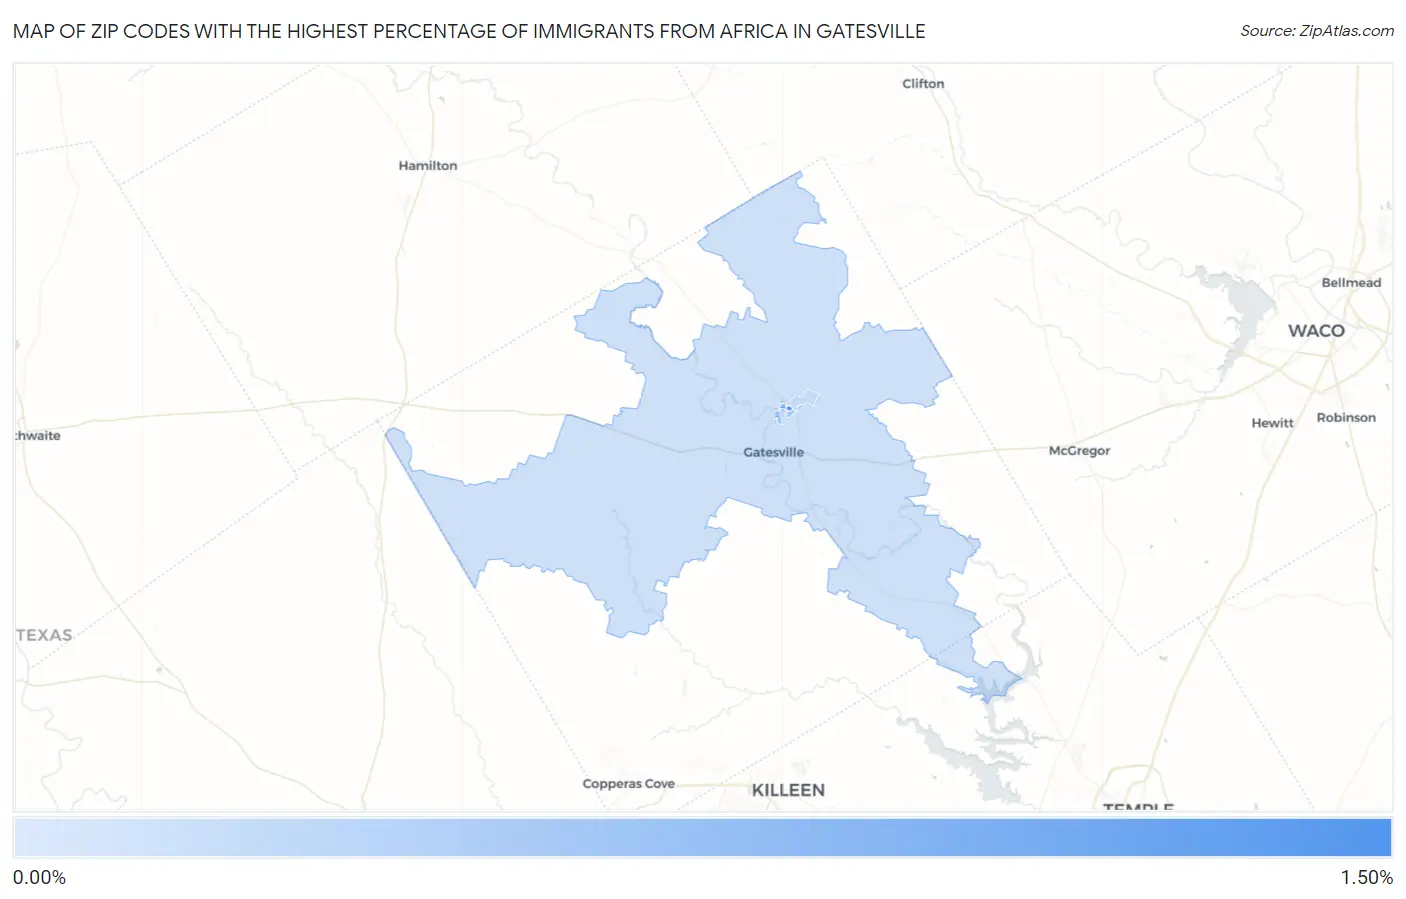
Map of Zip Codes with the Highest Percentage of Immigrants from Africa in Gatesville
0.11%
1.09%
Zip Codes with the Highest Percentage of Immigrants from Africa in Gatesville, TX
| Zip Code | Africa | vs State | vs National | |
| 1. | 76596 | 1.09% | 1.00%(+0.099)#-1 | 0.78%(+0.315)#0 |
| 2. | 76599 | 0.45% | 1.00%(-0.542)#0 | 0.78%(-0.326)#1 |
| 3. | 76597 | 0.19% | 1.00%(-0.803)#1 | 0.78%(-0.587)#2 |
| 4. | 76528 | 0.11% | 1.00%(-0.886)#2 | 0.78%(-0.671)#3 |
1
Common Questions
What are the Top 3 Zip Codes with the Highest Percentage of Immigrants from Africa in Gatesville, TX?
Top 3 Zip Codes with the Highest Percentage of Immigrants from Africa in Gatesville, TX are:
What zip code has the Highest Percentage of Immigrants from Africa in Gatesville, TX?
76596 has the Highest Percentage of Immigrants from Africa in Gatesville, TX with 1.09%.
What is the Percentage of Immigrants from Africa in Gatesville, TX?
Percentage of Immigrants from Africa in Gatesville is 0.18%.
What is the Percentage of Immigrants from Africa in Texas?
Percentage of Immigrants from Africa in Texas is 1.00%.
What is the Percentage of Immigrants from Africa in the United States?
Percentage of Immigrants from Africa in the United States is 0.78%.