Zip Codes with the Highest Percentage of Immigrants from Asia in Gatesville, TX
RELATED REPORTS & OPTIONS
Asia
Gatesville
Compare Zip Codes
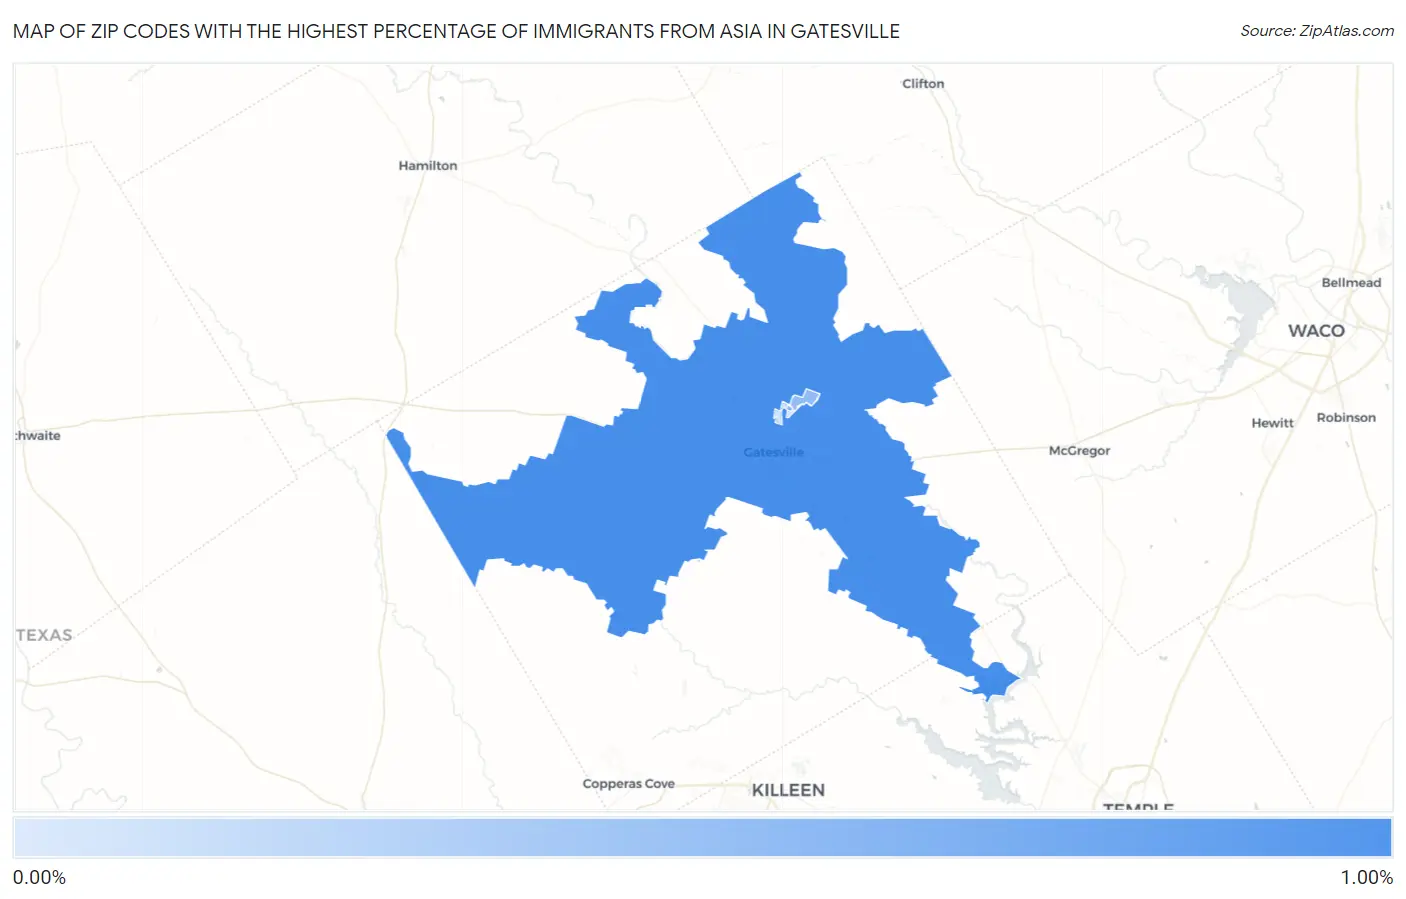
Map of Zip Codes with the Highest Percentage of Immigrants from Asia in Gatesville
0.057%
0.99%
Zip Codes with the Highest Percentage of Immigrants from Asia in Gatesville, TX
| Zip Code | Asia | vs State | vs National | |
| 1. | 76528 | 0.99% | 3.94%(-2.95)#659 | 4.26%(-3.27)#10,411 |
| 2. | 76596 | 0.55% | 3.94%(-3.39)#844 | 4.26%(-3.71)#13,414 |
| 3. | 76597 | 0.48% | 3.94%(-3.46)#883 | 4.26%(-3.78)#14,006 |
| 4. | 76599 | 0.057% | 3.94%(-3.88)#1,198 | 4.26%(-4.20)#18,894 |
1
Common Questions
What are the Top 3 Zip Codes with the Highest Percentage of Immigrants from Asia in Gatesville, TX?
Top 3 Zip Codes with the Highest Percentage of Immigrants from Asia in Gatesville, TX are:
What zip code has the Highest Percentage of Immigrants from Asia in Gatesville, TX?
76528 has the Highest Percentage of Immigrants from Asia in Gatesville, TX with 0.99%.
What is the Percentage of Immigrants from Asia in Gatesville, TX?
Percentage of Immigrants from Asia in Gatesville is 0.80%.
What is the Percentage of Immigrants from Asia in Texas?
Percentage of Immigrants from Asia in Texas is 3.94%.
What is the Percentage of Immigrants from Asia in the United States?
Percentage of Immigrants from Asia in the United States is 4.26%.