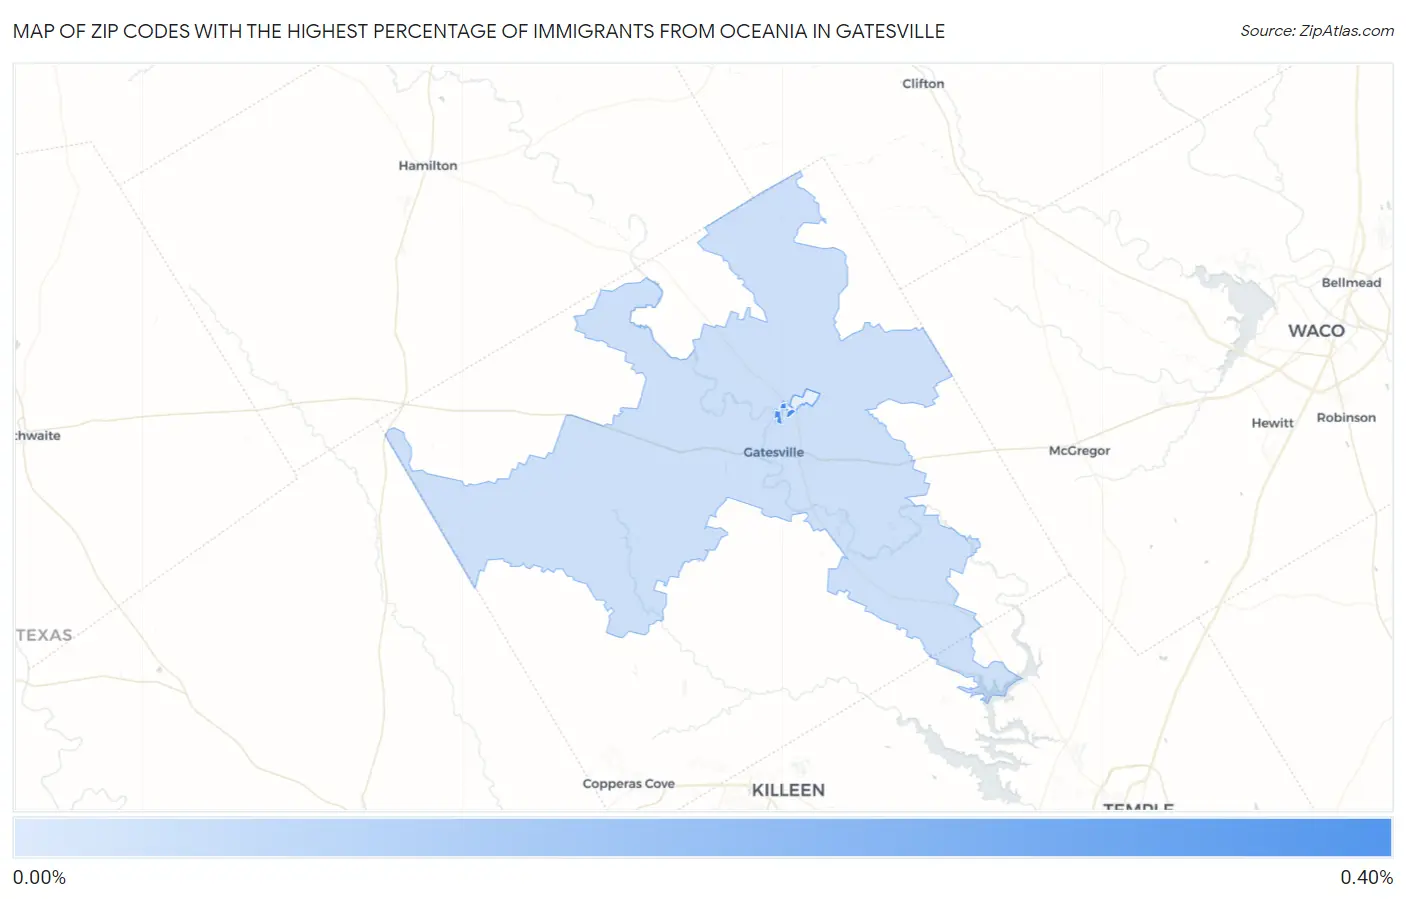
Zip Codes with the Highest Percentage of Immigrants from Oceania in Gatesville, TX
RELATED REPORTS & OPTIONS
Oceania
Gatesville
Compare Zip Codes
Map of Zip Codes with the Highest Percentage of Immigrants from Oceania in Gatesville
0.041%
0.40%
Zip Codes with the Highest Percentage of Immigrants from Oceania in Gatesville, TX
| Zip Code | Oceania | vs State | vs National | |
| 1. | 76599 | 0.40% | 0.050%(+0.347)#-1 | 0.089%(+0.308)#0 |
| 2. | 76528 | 0.041% | 0.050%(-0.009)#0 | 0.089%(-0.047)#1 |
1
Common Questions
What are the Top 3 Zip Codes with the Highest Percentage of Immigrants from Oceania in Gatesville, TX?
Top 3 Zip Codes with the Highest Percentage of Immigrants from Oceania in Gatesville, TX are:
What zip code has the Highest Percentage of Immigrants from Oceania in Gatesville, TX?
76599 has the Highest Percentage of Immigrants from Oceania in Gatesville, TX with 0.40%.
What is the Percentage of Immigrants from Oceania in Gatesville, TX?
Percentage of Immigrants from Oceania in Gatesville is 0.095%.
What is the Percentage of Immigrants from Oceania in Texas?
Percentage of Immigrants from Oceania in Texas is 0.050%.
What is the Percentage of Immigrants from Oceania in the United States?
Percentage of Immigrants from Oceania in the United States is 0.089%.