Zip Codes with the Highest Percentage of Immigrants from Eastern Europe in Gatesville, TX
RELATED REPORTS & OPTIONS
Eastern Europe
Gatesville
Compare Zip Codes
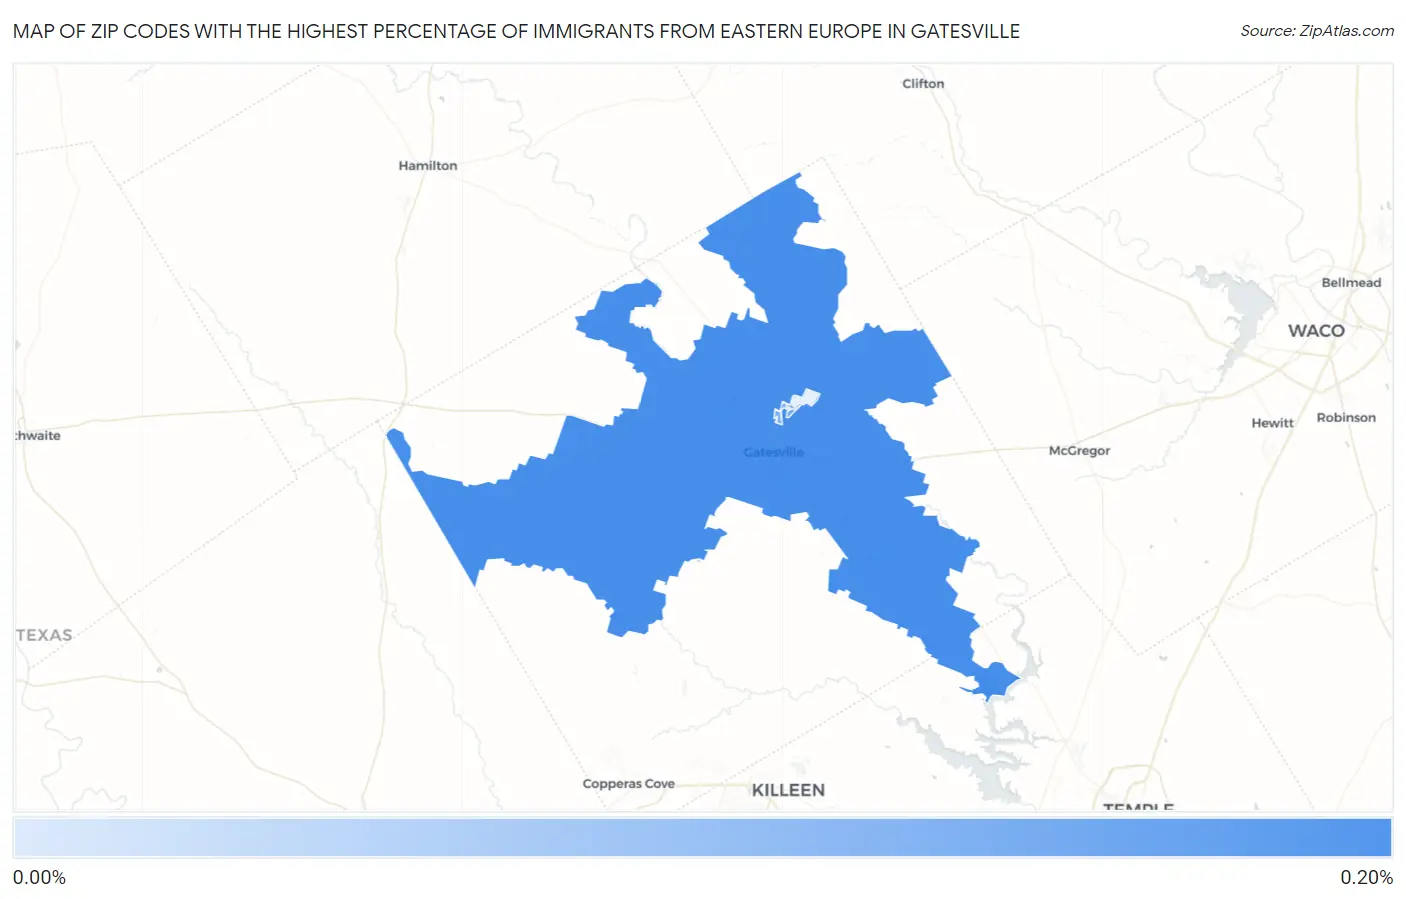
Map of Zip Codes with the Highest Percentage of Immigrants from Eastern Europe in Gatesville
0.11%
0.18%
Zip Codes with the Highest Percentage of Immigrants from Eastern Europe in Gatesville, TX
| Zip Code | Eastern Europe | vs State | vs National | |
| 1. | 76528 | 0.18% | 0.22%(-0.041)#381 | 0.67%(-0.486)#9,270 |
| 2. | 76599 | 0.11% | 0.22%(-0.109)#463 | 0.67%(-0.554)#10,565 |
1
Common Questions
What are the Top 3 Zip Codes with the Highest Percentage of Immigrants from Eastern Europe in Gatesville, TX?
Top 3 Zip Codes with the Highest Percentage of Immigrants from Eastern Europe in Gatesville, TX are:
What zip code has the Highest Percentage of Immigrants from Eastern Europe in Gatesville, TX?
76528 has the Highest Percentage of Immigrants from Eastern Europe in Gatesville, TX with 0.18%.
What is the Percentage of Immigrants from Eastern Europe in Gatesville, TX?
Percentage of Immigrants from Eastern Europe in Gatesville is 0.076%.
What is the Percentage of Immigrants from Eastern Europe in Texas?
Percentage of Immigrants from Eastern Europe in Texas is 0.22%.
What is the Percentage of Immigrants from Eastern Europe in the United States?
Percentage of Immigrants from Eastern Europe in the United States is 0.67%.