Chickasaw vs Burmese Single Female Poverty

COMPARE

Chickasaw
Race
Ancestry
AfghanAfricanAlaska NativeAlaskan AthabascanAlbanianAleutAlsatianAmericanApacheArabArapahoArgentineanArmenianAssyrian/Chaldean/SyriacAustralianAustrianBahamianBangladeshiBarbadianBasqueBelgianBelizeanBermudanBhutaneseBlackfeetBolivianBrazilianBritishBritish West IndianBulgarianCajunCambodianCanadianCape VerdeanCarpatho RusynCelticCentral AmericanCentral American IndianCherokeeCheyenneChickasawChileanChineseChippewaChoctawColombianColvilleComancheCosta RicanCreeCreekCroatianCrowCubanCypriotCzechCzechoslovakianDanishDelawareDominicanDutchDutch West IndianEastern EuropeanEcuadorianEgyptianEnglishEstonianEthiopianEuropeanFijianFilipinoFinnishFrenchFrench American IndianFrench CanadianGermanGerman RussianGhanaianGreekGuamanian/ChamorroGuatemalanGuyaneseHaitianHmongHonduranHopiHoumaHungarianIcelanderIndian (Asian)IndonesianInupiatIranianIraqiIrishIroquoisIsraeliItalianJamaicanJapaneseJordanianKenyanKiowaKoreanLaotianLatvianLebaneseLiberianLithuanianLumbeeLuxembourgerMacedonianMalaysianMalteseMarshalleseMenomineeMexicanMexican American IndianMongolianMoroccanNative HawaiianNavajoNepaleseNew ZealanderNicaraguanNigerianNorthern EuropeanNorwegianOkinawanOsageOttawaPaiutePakistaniPalestinianPanamanianParaguayanPennsylvania GermanPeruvianPimaPolishPortuguesePotawatomiPuebloPuerto RicanPuget Sound SalishRomanianRussianSalvadoranSamoanScandinavianScotch-IrishScottishSeminoleSenegaleseSerbianShoshoneSierra LeoneanSiouxSlavicSlovakSloveneSomaliSouth AfricanSouth AmericanSouth American IndianSoviet UnionSpaniardSpanishSpanish AmericanSpanish American IndianSri LankanSubsaharan AfricanSudaneseSwedishSwissSyrianTaiwaneseThaiTlingit-HaidaTohono O'OdhamTonganTrinidadian and TobagonianTsimshianTurkishU.S. Virgin IslanderUgandanUkrainianUruguayanUteVenezuelanVietnameseWelshWest IndianYakamaYaquiYugoslavianYumanYup'ikZimbabwean
Immigration
NonimmigrantsImmigrantsAfghanistanAfricaAlbaniaArgentinaArmeniaAsiaAustraliaAustriaBahamasBangladeshBarbadosBelarusBelgiumBelizeBoliviaBosnia and HerzegovinaBrazilBulgariaBurma/MyanmarCabo VerdeCambodiaCameroonCanadaCaribbeanCentral AmericaChileChinaColombiaCongoCosta RicaCroatiaCubaCzechoslovakiaDenmarkDominicaDominican RepublicEastern AfricaEastern AsiaEastern EuropeEcuadorEgyptEl SalvadorEnglandEritreaEthiopiaEuropeFijiFranceGermanyGhanaGreeceGrenadaGuatemalaGuyanaHaitiHondurasHong KongHungaryIndiaIndonesiaIranIraqIrelandIsraelItalyJamaicaJapanJordanKazakhstanKenyaKoreaKuwaitLaosLatin AmericaLatviaLebanonLiberiaLithuaniaMalaysiaMexicoMicronesiaMiddle AfricaMoldovaMoroccoNepalNetherlandsNicaraguaNigeriaNorth AmericaNorth MacedoniaNorthern AfricaNorthern EuropeNorwayOceaniaPakistanPanamaPeruPhilippinesPolandPortugalRomaniaRussiaSaudi ArabiaScotlandSenegalSerbiaSierra LeoneSingaporeSomaliaSouth AfricaSouth AmericaSouth Central AsiaSouth Eastern AsiaSouthern EuropeSpainSri LankaSt. Vincent and the GrenadinesSudanSwedenSwitzerlandSyriaTaiwanThailandTrinidad and TobagoTurkeyUgandaUkraineUruguayUzbekistanVenezuelaVietnamWest IndiesWestern AfricaWestern AsiaWestern EuropeYemenZaireZimbabweAzores
Burmese
Race
Ancestry
AfghanAfricanAlaska NativeAlaskan AthabascanAlbanianAleutAlsatianAmericanApacheArabArapahoArgentineanArmenianAssyrian/Chaldean/SyriacAustralianAustrianBahamianBangladeshiBarbadianBasqueBelgianBelizeanBermudanBhutaneseBlackfeetBolivianBrazilianBritishBritish West IndianBulgarianBurmeseCajunCambodianCanadianCape VerdeanCarpatho RusynCelticCentral AmericanCentral American IndianCherokeeCheyenneChileanChineseChippewaChoctawColombianColvilleComancheCosta RicanCreeCreekCroatianCrowCubanCypriotCzechCzechoslovakianDanishDelawareDominicanDutchDutch West IndianEastern EuropeanEcuadorianEgyptianEnglishEstonianEthiopianEuropeanFijianFilipinoFinnishFrenchFrench American IndianFrench CanadianGermanGerman RussianGhanaianGreekGuamanian/ChamorroGuatemalanGuyaneseHaitianHmongHonduranHopiHoumaHungarianIcelanderIndian (Asian)IndonesianInupiatIranianIraqiIrishIroquoisIsraeliItalianJamaicanJapaneseJordanianKenyanKiowaKoreanLaotianLatvianLebaneseLiberianLithuanianLumbeeLuxembourgerMacedonianMalaysianMalteseMarshalleseMenomineeMexicanMexican American IndianMongolianMoroccanNative HawaiianNavajoNepaleseNew ZealanderNicaraguanNigerianNorthern EuropeanNorwegianOkinawanOsageOttawaPaiutePakistaniPalestinianPanamanianParaguayanPennsylvania GermanPeruvianPimaPolishPortuguesePotawatomiPuebloPuerto RicanPuget Sound SalishRomanianRussianSalvadoranSamoanScandinavianScotch-IrishScottishSeminoleSenegaleseSerbianShoshoneSierra LeoneanSiouxSlavicSlovakSloveneSomaliSouth AfricanSouth AmericanSouth American IndianSoviet UnionSpaniardSpanishSpanish AmericanSpanish American IndianSri LankanSubsaharan AfricanSudaneseSwedishSwissSyrianTaiwaneseThaiTlingit-HaidaTohono O'OdhamTonganTrinidadian and TobagonianTsimshianTurkishU.S. Virgin IslanderUgandanUkrainianUruguayanUteVenezuelanVietnameseWelshWest IndianYakamaYaquiYugoslavianYumanYup'ikZimbabwean
Immigration
NonimmigrantsImmigrantsAfghanistanAfricaAlbaniaArgentinaArmeniaAsiaAustraliaAustriaBahamasBangladeshBarbadosBelarusBelgiumBelizeBoliviaBosnia and HerzegovinaBrazilBulgariaBurma/MyanmarCabo VerdeCambodiaCameroonCanadaCaribbeanCentral AmericaChileChinaColombiaCongoCosta RicaCroatiaCubaCzechoslovakiaDenmarkDominicaDominican RepublicEastern AfricaEastern AsiaEastern EuropeEcuadorEgyptEl SalvadorEnglandEritreaEthiopiaEuropeFijiFranceGermanyGhanaGreeceGrenadaGuatemalaGuyanaHaitiHondurasHong KongHungaryIndiaIndonesiaIranIraqIrelandIsraelItalyJamaicaJapanJordanKazakhstanKenyaKoreaKuwaitLaosLatin AmericaLatviaLebanonLiberiaLithuaniaMalaysiaMexicoMicronesiaMiddle AfricaMoldovaMoroccoNepalNetherlandsNicaraguaNigeriaNorth AmericaNorth MacedoniaNorthern AfricaNorthern EuropeNorwayOceaniaPakistanPanamaPeruPhilippinesPolandPortugalRomaniaRussiaSaudi ArabiaScotlandSenegalSerbiaSierra LeoneSingaporeSomaliaSouth AfricaSouth AmericaSouth Central AsiaSouth Eastern AsiaSouthern EuropeSpainSri LankaSt. Vincent and the GrenadinesSudanSwedenSwitzerlandSyriaTaiwanThailandTrinidad and TobagoTurkeyUgandaUkraineUruguayUzbekistanVenezuelaVietnamWest IndiesWestern AfricaWestern AsiaWestern EuropeYemenZaireZimbabweAzores
Single Female Poverty
Income
Poverty
Unemployment
Labor Participation
Family Structure
Vehicle Availability
Education Level
Disability

Single Female Poverty Comparison

Chickasaw

Burmese

Tragic
Exceptional
26.3%
SINGLE FEMALE POVERTY
0.0/ 100
METRIC RATING
318th/ 347
METRIC RANK
18.3%
SINGLE FEMALE POVERTY
100.0/ 100
METRIC RATING
22nd/ 347
METRIC RANK

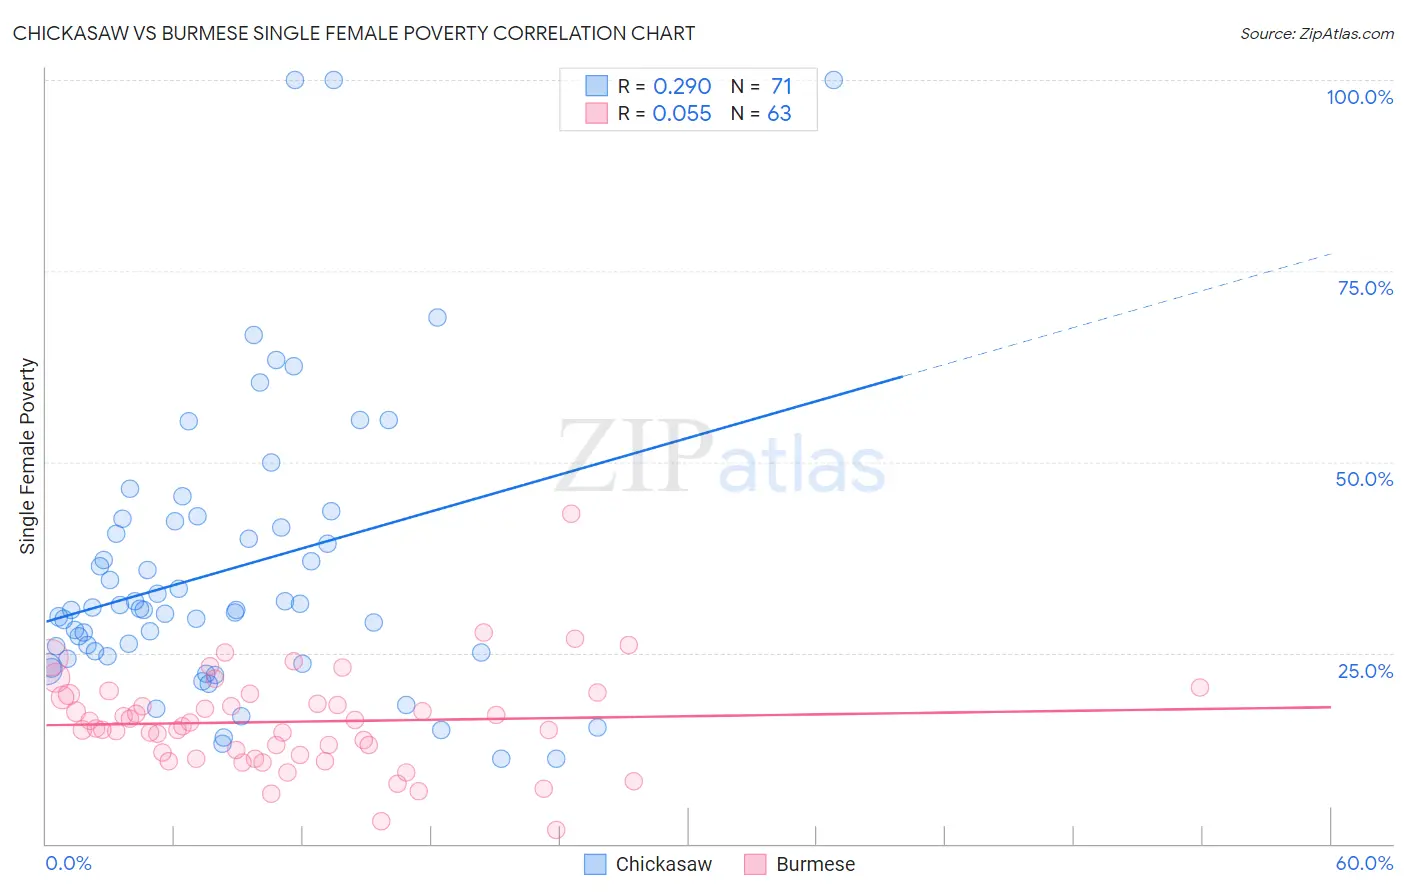
Chickasaw vs Burmese Single Female Poverty Correlation Chart

The statistical analysis conducted on geographies consisting of 147,052,400 people shows a weak positive correlation between the proportion of Chickasaw and poverty level among single females in the United States with a correlation coefficient (R) of 0.290 and weighted average of 26.3%. Similarly, the statistical analysis conducted on geographies consisting of 455,450,200 people shows a slight positive correlation between the proportion of Burmese and poverty level among single females in the United States with a correlation coefficient (R) of 0.055 and weighted average of 18.3%, a difference of 43.7%.
Chickasaw vs Burmese Single Female Poverty

Single Female Poverty Correlation Summary

MeasurementChickasawBurmese
Minimum11.1%1.8%
Maximum100.0%43.2%
Range88.9%41.3%
Mean35.8%16.0%
Median30.6%15.4%
Interquartile 25% (IQ1)24.5%11.7%
Interquartile 75% (IQ3)42.2%19.5%
Interquartile Range (IQR)17.7%7.9%
Standard Deviation (Sample)19.0%6.6%
Standard Deviation (Population)18.8%6.5%

Similar Demographics by Single Female Poverty

Demographics Similar to Chickasaw by Single Female Poverty

In terms of single female poverty, the demographic groups most similar to Chickasaw are Black/African American (26.4%, a difference of 0.33%), Arapaho (26.4%, a difference of 0.63%), Ottawa (26.0%, a difference of 1.0%), Yup'ik (26.6%, a difference of 1.3%), and Immigrants from Somalia (25.8%, a difference of 1.9%).
DemographicsRating | RankSingle Female Poverty
Immigrants | Honduras
0.0
/100
|
#311
Tragic
25.5%
Paiute
0.0
/100
|
#312
Tragic
25.5%
Comanche
0.0
/100
|
#313
Tragic
25.6%
Cherokee
0.0
/100
|
#314
Tragic
25.7%
Iroquois
0.0
/100
|
#315
Tragic
25.7%
Immigrants | Somalia
0.0
/100
|
#316
Tragic
25.8%
Ottawa
0.0
/100
|
#317
Tragic
26.0%
Chickasaw
0.0
/100
|
#318
Tragic
26.3%
Blacks/African Americans
0.0
/100
|
#319
Tragic
26.4%
Arapaho
0.0
/100
|
#320
Tragic
26.4%
Yup'ik
0.0
/100
|
#321
Tragic
26.6%
Seminole
0.0
/100
|
#322
Tragic
26.8%
Chippewa
0.0
/100
|
#323
Tragic
26.8%
Kiowa
0.0
/100
|
#324
Tragic
26.9%
Choctaw
0.0
/100
|
#325
Tragic
27.2%

Demographics Similar to Burmese by Single Female Poverty

In terms of single female poverty, the demographic groups most similar to Burmese are Asian (18.3%, a difference of 0.0%), Maltese (18.3%, a difference of 0.010%), Immigrants from Greece (18.3%, a difference of 0.070%), Armenian (18.3%, a difference of 0.23%), and Immigrants from Singapore (18.3%, a difference of 0.33%).
DemographicsRating | RankSingle Female Poverty
Indians (Asian)
100.0
/100
|
#15
Exceptional
17.9%
Iranians
100.0
/100
|
#16
Exceptional
18.0%
Immigrants | Korea
100.0
/100
|
#17
Exceptional
18.1%
Immigrants | Eastern Asia
100.0
/100
|
#18
Exceptional
18.1%
Immigrants | China
100.0
/100
|
#19
Exceptional
18.1%
Immigrants | Greece
100.0
/100
|
#20
Exceptional
18.3%
Maltese
100.0
/100
|
#21
Exceptional
18.3%
Burmese
100.0
/100
|
#22
Exceptional
18.3%
Asians
100.0
/100
|
#23
Exceptional
18.3%
Armenians
100.0
/100
|
#24
Exceptional
18.3%
Immigrants | Singapore
100.0
/100
|
#25
Exceptional
18.3%
Immigrants | Israel
100.0
/100
|
#26
Exceptional
18.3%
Immigrants | Pakistan
100.0
/100
|
#27
Exceptional
18.4%
Immigrants | Moldova
100.0
/100
|
#28
Exceptional
18.5%
Immigrants | Poland
100.0
/100
|
#29
Exceptional
18.5%