Chickasaw vs Immigrants from Ireland Single Female Poverty
COMPARE
Chickasaw
Immigrants from Ireland
Single Female Poverty
Single Female Poverty Comparison
Chickasaw
Immigrants from Ireland
26.3%
SINGLE FEMALE POVERTY
0.0/ 100
METRIC RATING
318th/ 347
METRIC RANK
17.8%
SINGLE FEMALE POVERTY
100.0/ 100
METRIC RATING
10th/ 347
METRIC RANK
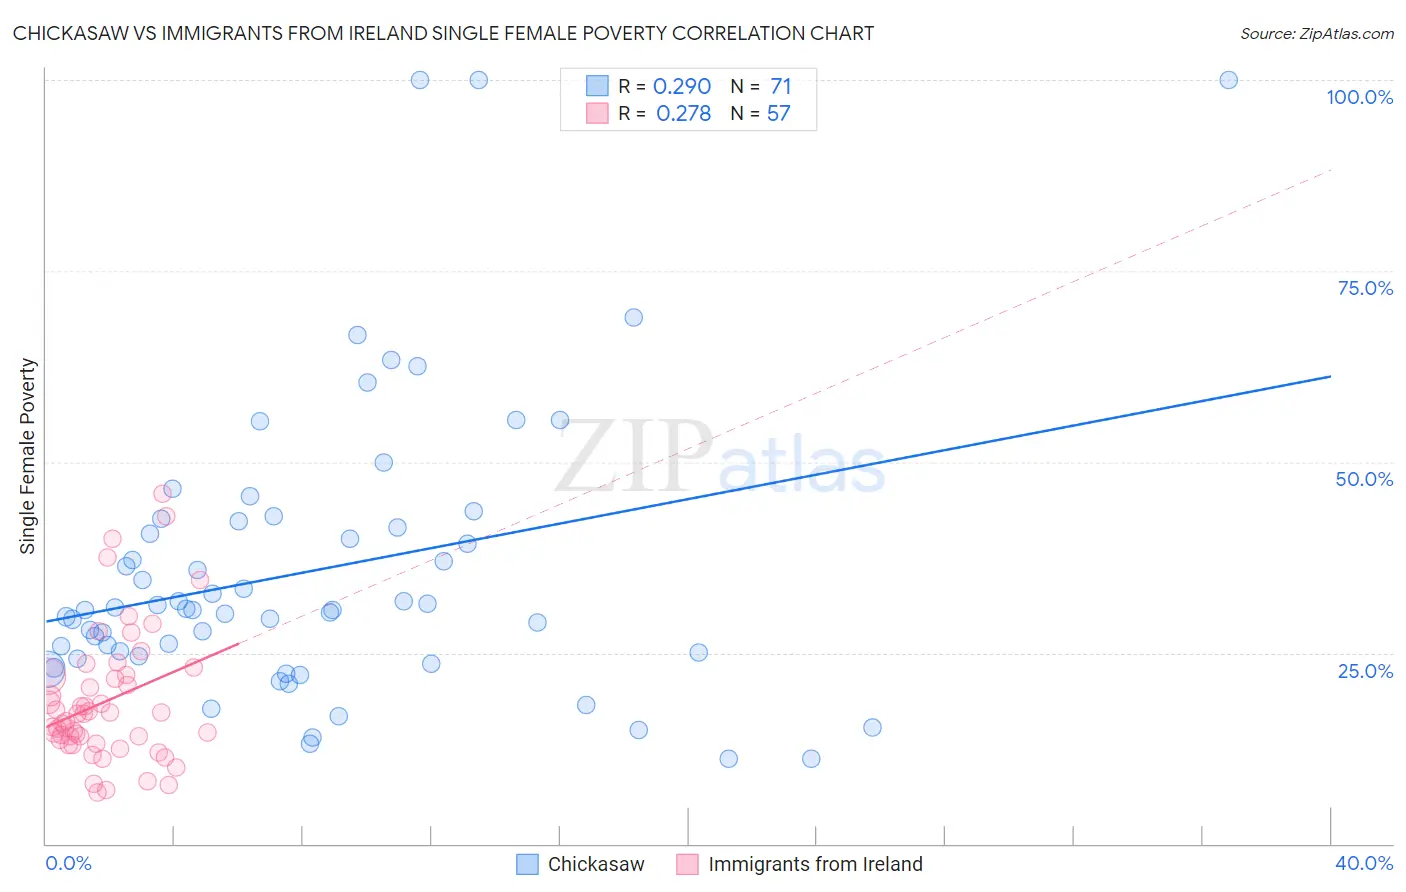
Chickasaw vs Immigrants from Ireland Single Female Poverty Correlation Chart
The statistical analysis conducted on geographies consisting of 147,052,400 people shows a weak positive correlation between the proportion of Chickasaw and poverty level among single females in the United States with a correlation coefficient (R) of 0.290 and weighted average of 26.3%. Similarly, the statistical analysis conducted on geographies consisting of 237,318,290 people shows a weak positive correlation between the proportion of Immigrants from Ireland and poverty level among single females in the United States with a correlation coefficient (R) of 0.278 and weighted average of 17.8%, a difference of 47.8%.
Single Female Poverty Correlation Summary
| Measurement | Chickasaw | Immigrants from Ireland |
| Minimum | 11.1% | 6.7% |
| Maximum | 100.0% | 45.8% |
| Range | 88.9% | 39.1% |
| Mean | 35.8% | 18.7% |
| Median | 30.6% | 17.0% |
| Interquartile 25% (IQ1) | 24.5% | 13.4% |
| Interquartile 75% (IQ3) | 42.2% | 22.0% |
| Interquartile Range (IQR) | 17.7% | 8.6% |
| Standard Deviation (Sample) | 19.0% | 8.7% |
| Standard Deviation (Population) | 18.8% | 8.6% |
Similar Demographics by Single Female Poverty
Demographics Similar to Chickasaw by Single Female Poverty
In terms of single female poverty, the demographic groups most similar to Chickasaw are Black/African American (26.4%, a difference of 0.33%), Arapaho (26.4%, a difference of 0.63%), Ottawa (26.0%, a difference of 1.0%), Yup'ik (26.6%, a difference of 1.3%), and Immigrants from Somalia (25.8%, a difference of 1.9%).
| Demographics | Rating | Rank | Single Female Poverty |
| Immigrants | Honduras | 0.0 /100 | #311 | Tragic 25.5% |
| Paiute | 0.0 /100 | #312 | Tragic 25.5% |
| Comanche | 0.0 /100 | #313 | Tragic 25.6% |
| Cherokee | 0.0 /100 | #314 | Tragic 25.7% |
| Iroquois | 0.0 /100 | #315 | Tragic 25.7% |
| Immigrants | Somalia | 0.0 /100 | #316 | Tragic 25.8% |
| Ottawa | 0.0 /100 | #317 | Tragic 26.0% |
| Chickasaw | 0.0 /100 | #318 | Tragic 26.3% |
| Blacks/African Americans | 0.0 /100 | #319 | Tragic 26.4% |
| Arapaho | 0.0 /100 | #320 | Tragic 26.4% |
| Yup'ik | 0.0 /100 | #321 | Tragic 26.6% |
| Seminole | 0.0 /100 | #322 | Tragic 26.8% |
| Chippewa | 0.0 /100 | #323 | Tragic 26.8% |
| Kiowa | 0.0 /100 | #324 | Tragic 26.9% |
| Choctaw | 0.0 /100 | #325 | Tragic 27.2% |
Demographics Similar to Immigrants from Ireland by Single Female Poverty
In terms of single female poverty, the demographic groups most similar to Immigrants from Ireland are Immigrants from Lithuania (17.8%, a difference of 0.090%), Immigrants from South Central Asia (17.8%, a difference of 0.15%), Bhutanese (17.7%, a difference of 0.41%), Immigrants from Bolivia (17.8%, a difference of 0.41%), and Bolivian (17.9%, a difference of 0.85%).
| Demographics | Rating | Rank | Single Female Poverty |
| Immigrants | Hong Kong | 100.0 /100 | #3 | Exceptional 16.5% |
| Immigrants | India | 100.0 /100 | #4 | Exceptional 16.8% |
| Assyrians/Chaldeans/Syriacs | 100.0 /100 | #5 | Exceptional 17.0% |
| Filipinos | 100.0 /100 | #6 | Exceptional 17.0% |
| Thais | 100.0 /100 | #7 | Exceptional 17.3% |
| Immigrants | Iran | 100.0 /100 | #8 | Exceptional 17.5% |
| Bhutanese | 100.0 /100 | #9 | Exceptional 17.7% |
| Immigrants | Ireland | 100.0 /100 | #10 | Exceptional 17.8% |
| Immigrants | Lithuania | 100.0 /100 | #11 | Exceptional 17.8% |
| Immigrants | South Central Asia | 100.0 /100 | #12 | Exceptional 17.8% |
| Immigrants | Bolivia | 100.0 /100 | #13 | Exceptional 17.8% |
| Bolivians | 100.0 /100 | #14 | Exceptional 17.9% |
| Indians (Asian) | 100.0 /100 | #15 | Exceptional 17.9% |
| Iranians | 100.0 /100 | #16 | Exceptional 18.0% |
| Immigrants | Korea | 100.0 /100 | #17 | Exceptional 18.1% |