Chickasaw vs Hispanic or Latino Single Female Poverty
COMPARE
Chickasaw
Hispanic or Latino
Single Female Poverty
Single Female Poverty Comparison
Chickasaw
Hispanics or Latinos
26.3%
SINGLE FEMALE POVERTY
0.0/ 100
METRIC RATING
318th/ 347
METRIC RANK
24.6%
SINGLE FEMALE POVERTY
0.0/ 100
METRIC RATING
295th/ 347
METRIC RANK
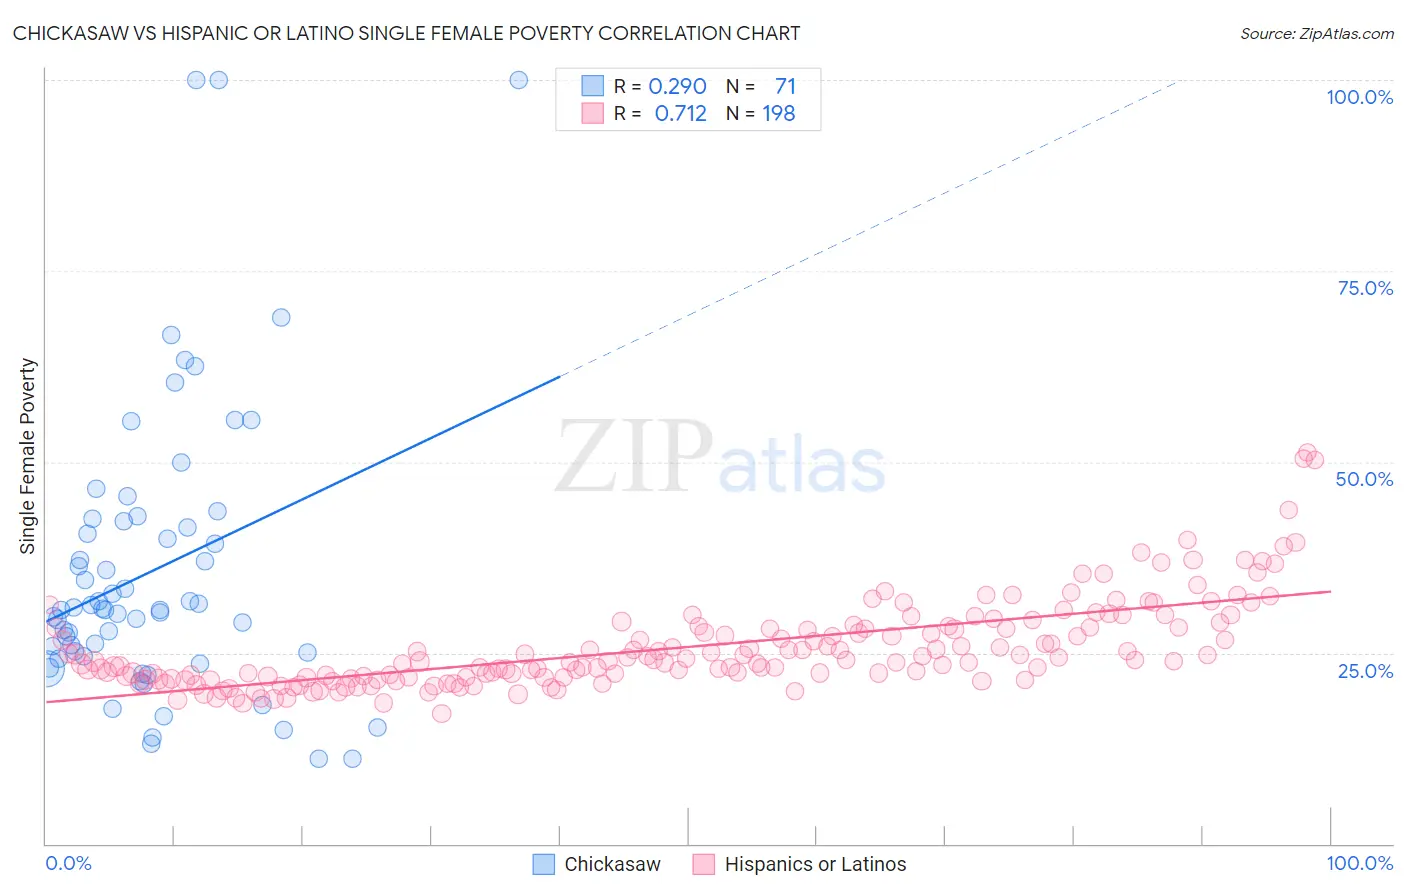
Chickasaw vs Hispanic or Latino Single Female Poverty Correlation Chart
The statistical analysis conducted on geographies consisting of 147,052,400 people shows a weak positive correlation between the proportion of Chickasaw and poverty level among single females in the United States with a correlation coefficient (R) of 0.290 and weighted average of 26.3%. Similarly, the statistical analysis conducted on geographies consisting of 554,629,261 people shows a strong positive correlation between the proportion of Hispanics or Latinos and poverty level among single females in the United States with a correlation coefficient (R) of 0.712 and weighted average of 24.6%, a difference of 6.6%.
Single Female Poverty Correlation Summary
| Measurement | Chickasaw | Hispanic or Latino |
| Minimum | 11.1% | 17.1% |
| Maximum | 100.0% | 51.2% |
| Range | 88.9% | 34.2% |
| Mean | 35.8% | 25.7% |
| Median | 30.6% | 23.9% |
| Interquartile 25% (IQ1) | 24.5% | 21.8% |
| Interquartile 75% (IQ3) | 42.2% | 28.3% |
| Interquartile Range (IQR) | 17.7% | 6.5% |
| Standard Deviation (Sample) | 19.0% | 5.8% |
| Standard Deviation (Population) | 18.8% | 5.8% |
Similar Demographics by Single Female Poverty
Demographics Similar to Chickasaw by Single Female Poverty
In terms of single female poverty, the demographic groups most similar to Chickasaw are Black/African American (26.4%, a difference of 0.33%), Arapaho (26.4%, a difference of 0.63%), Ottawa (26.0%, a difference of 1.0%), Yup'ik (26.6%, a difference of 1.3%), and Immigrants from Somalia (25.8%, a difference of 1.9%).
| Demographics | Rating | Rank | Single Female Poverty |
| Immigrants | Honduras | 0.0 /100 | #311 | Tragic 25.5% |
| Paiute | 0.0 /100 | #312 | Tragic 25.5% |
| Comanche | 0.0 /100 | #313 | Tragic 25.6% |
| Cherokee | 0.0 /100 | #314 | Tragic 25.7% |
| Iroquois | 0.0 /100 | #315 | Tragic 25.7% |
| Immigrants | Somalia | 0.0 /100 | #316 | Tragic 25.8% |
| Ottawa | 0.0 /100 | #317 | Tragic 26.0% |
| Chickasaw | 0.0 /100 | #318 | Tragic 26.3% |
| Blacks/African Americans | 0.0 /100 | #319 | Tragic 26.4% |
| Arapaho | 0.0 /100 | #320 | Tragic 26.4% |
| Yup'ik | 0.0 /100 | #321 | Tragic 26.6% |
| Seminole | 0.0 /100 | #322 | Tragic 26.8% |
| Chippewa | 0.0 /100 | #323 | Tragic 26.8% |
| Kiowa | 0.0 /100 | #324 | Tragic 26.9% |
| Choctaw | 0.0 /100 | #325 | Tragic 27.2% |
Demographics Similar to Hispanics or Latinos by Single Female Poverty
In terms of single female poverty, the demographic groups most similar to Hispanics or Latinos are French American Indian (24.6%, a difference of 0.35%), African (24.8%, a difference of 0.48%), American (24.5%, a difference of 0.49%), Alsatian (24.5%, a difference of 0.57%), and Immigrants from Central America (24.8%, a difference of 0.76%).
| Demographics | Rating | Rank | Single Female Poverty |
| Spanish Americans | 0.0 /100 | #288 | Tragic 24.2% |
| U.S. Virgin Islanders | 0.0 /100 | #289 | Tragic 24.2% |
| Indonesians | 0.0 /100 | #290 | Tragic 24.3% |
| Osage | 0.0 /100 | #291 | Tragic 24.4% |
| Alsatians | 0.0 /100 | #292 | Tragic 24.5% |
| Americans | 0.0 /100 | #293 | Tragic 24.5% |
| French American Indians | 0.0 /100 | #294 | Tragic 24.6% |
| Hispanics or Latinos | 0.0 /100 | #295 | Tragic 24.6% |
| Africans | 0.0 /100 | #296 | Tragic 24.8% |
| Immigrants | Central America | 0.0 /100 | #297 | Tragic 24.8% |
| Yaqui | 0.0 /100 | #298 | Tragic 24.9% |
| Mexicans | 0.0 /100 | #299 | Tragic 25.0% |
| Blackfeet | 0.0 /100 | #300 | Tragic 25.1% |
| Hondurans | 0.0 /100 | #301 | Tragic 25.1% |
| Shoshone | 0.0 /100 | #302 | Tragic 25.1% |