Chickasaw vs Immigrants from Nicaragua Single Female Poverty
COMPARE
Chickasaw
Immigrants from Nicaragua
Single Female Poverty
Single Female Poverty Comparison
Chickasaw
Immigrants from Nicaragua
26.3%
SINGLE FEMALE POVERTY
0.0/ 100
METRIC RATING
318th/ 347
METRIC RANK
21.6%
SINGLE FEMALE POVERTY
13.3/ 100
METRIC RATING
214th/ 347
METRIC RANK
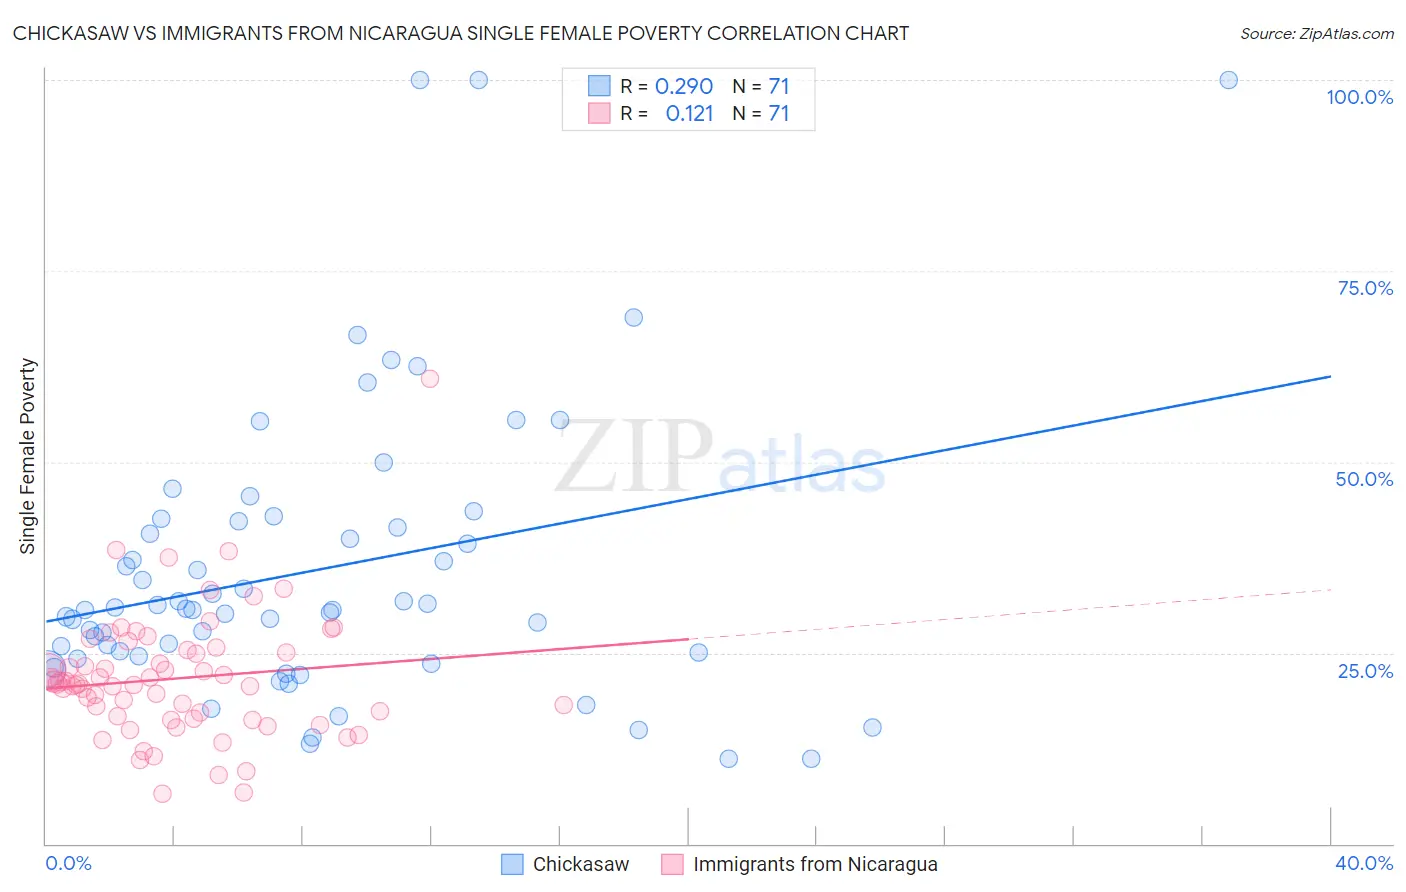
Chickasaw vs Immigrants from Nicaragua Single Female Poverty Correlation Chart
The statistical analysis conducted on geographies consisting of 147,052,400 people shows a weak positive correlation between the proportion of Chickasaw and poverty level among single females in the United States with a correlation coefficient (R) of 0.290 and weighted average of 26.3%. Similarly, the statistical analysis conducted on geographies consisting of 235,216,654 people shows a poor positive correlation between the proportion of Immigrants from Nicaragua and poverty level among single females in the United States with a correlation coefficient (R) of 0.121 and weighted average of 21.6%, a difference of 21.5%.
Single Female Poverty Correlation Summary
| Measurement | Chickasaw | Immigrants from Nicaragua |
| Minimum | 11.1% | 6.5% |
| Maximum | 100.0% | 60.9% |
| Range | 88.9% | 54.4% |
| Mean | 35.8% | 21.6% |
| Median | 30.6% | 21.0% |
| Interquartile 25% (IQ1) | 24.5% | 16.3% |
| Interquartile 75% (IQ3) | 42.2% | 25.4% |
| Interquartile Range (IQR) | 17.7% | 9.1% |
| Standard Deviation (Sample) | 19.0% | 8.3% |
| Standard Deviation (Population) | 18.8% | 8.3% |
Similar Demographics by Single Female Poverty
Demographics Similar to Chickasaw by Single Female Poverty
In terms of single female poverty, the demographic groups most similar to Chickasaw are Black/African American (26.4%, a difference of 0.33%), Arapaho (26.4%, a difference of 0.63%), Ottawa (26.0%, a difference of 1.0%), Yup'ik (26.6%, a difference of 1.3%), and Immigrants from Somalia (25.8%, a difference of 1.9%).
| Demographics | Rating | Rank | Single Female Poverty |
| Immigrants | Honduras | 0.0 /100 | #311 | Tragic 25.5% |
| Paiute | 0.0 /100 | #312 | Tragic 25.5% |
| Comanche | 0.0 /100 | #313 | Tragic 25.6% |
| Cherokee | 0.0 /100 | #314 | Tragic 25.7% |
| Iroquois | 0.0 /100 | #315 | Tragic 25.7% |
| Immigrants | Somalia | 0.0 /100 | #316 | Tragic 25.8% |
| Ottawa | 0.0 /100 | #317 | Tragic 26.0% |
| Chickasaw | 0.0 /100 | #318 | Tragic 26.3% |
| Blacks/African Americans | 0.0 /100 | #319 | Tragic 26.4% |
| Arapaho | 0.0 /100 | #320 | Tragic 26.4% |
| Yup'ik | 0.0 /100 | #321 | Tragic 26.6% |
| Seminole | 0.0 /100 | #322 | Tragic 26.8% |
| Chippewa | 0.0 /100 | #323 | Tragic 26.8% |
| Kiowa | 0.0 /100 | #324 | Tragic 26.9% |
| Choctaw | 0.0 /100 | #325 | Tragic 27.2% |
Demographics Similar to Immigrants from Nicaragua by Single Female Poverty
In terms of single female poverty, the demographic groups most similar to Immigrants from Nicaragua are Guamanian/Chamorro (21.6%, a difference of 0.060%), Jamaican (21.6%, a difference of 0.090%), Icelander (21.6%, a difference of 0.10%), Ecuadorian (21.6%, a difference of 0.13%), and Immigrants from Panama (21.6%, a difference of 0.14%).
| Demographics | Rating | Rank | Single Female Poverty |
| Ghanaians | 15.7 /100 | #207 | Poor 21.6% |
| Haitians | 15.4 /100 | #208 | Poor 21.6% |
| Immigrants | Eastern Africa | 15.1 /100 | #209 | Poor 21.6% |
| Immigrants | Panama | 14.4 /100 | #210 | Poor 21.6% |
| Icelanders | 14.0 /100 | #211 | Poor 21.6% |
| Jamaicans | 14.0 /100 | #212 | Poor 21.6% |
| Guamanians/Chamorros | 13.7 /100 | #213 | Poor 21.6% |
| Immigrants | Nicaragua | 13.3 /100 | #214 | Poor 21.6% |
| Ecuadorians | 12.3 /100 | #215 | Poor 21.6% |
| Immigrants | Barbados | 12.2 /100 | #216 | Poor 21.7% |
| Immigrants | St. Vincent and the Grenadines | 11.7 /100 | #217 | Poor 21.7% |
| Nepalese | 9.7 /100 | #218 | Tragic 21.7% |
| Panamanians | 9.4 /100 | #219 | Tragic 21.7% |
| Germans | 8.3 /100 | #220 | Tragic 21.8% |
| Immigrants | Grenada | 8.0 /100 | #221 | Tragic 21.8% |