Chickasaw vs Moroccan Single Female Poverty
COMPARE
Chickasaw
Moroccan
Single Female Poverty
Single Female Poverty Comparison
Chickasaw
Moroccans
26.3%
SINGLE FEMALE POVERTY
0.0/ 100
METRIC RATING
318th/ 347
METRIC RANK
21.0%
SINGLE FEMALE POVERTY
52.8/ 100
METRIC RATING
171st/ 347
METRIC RANK
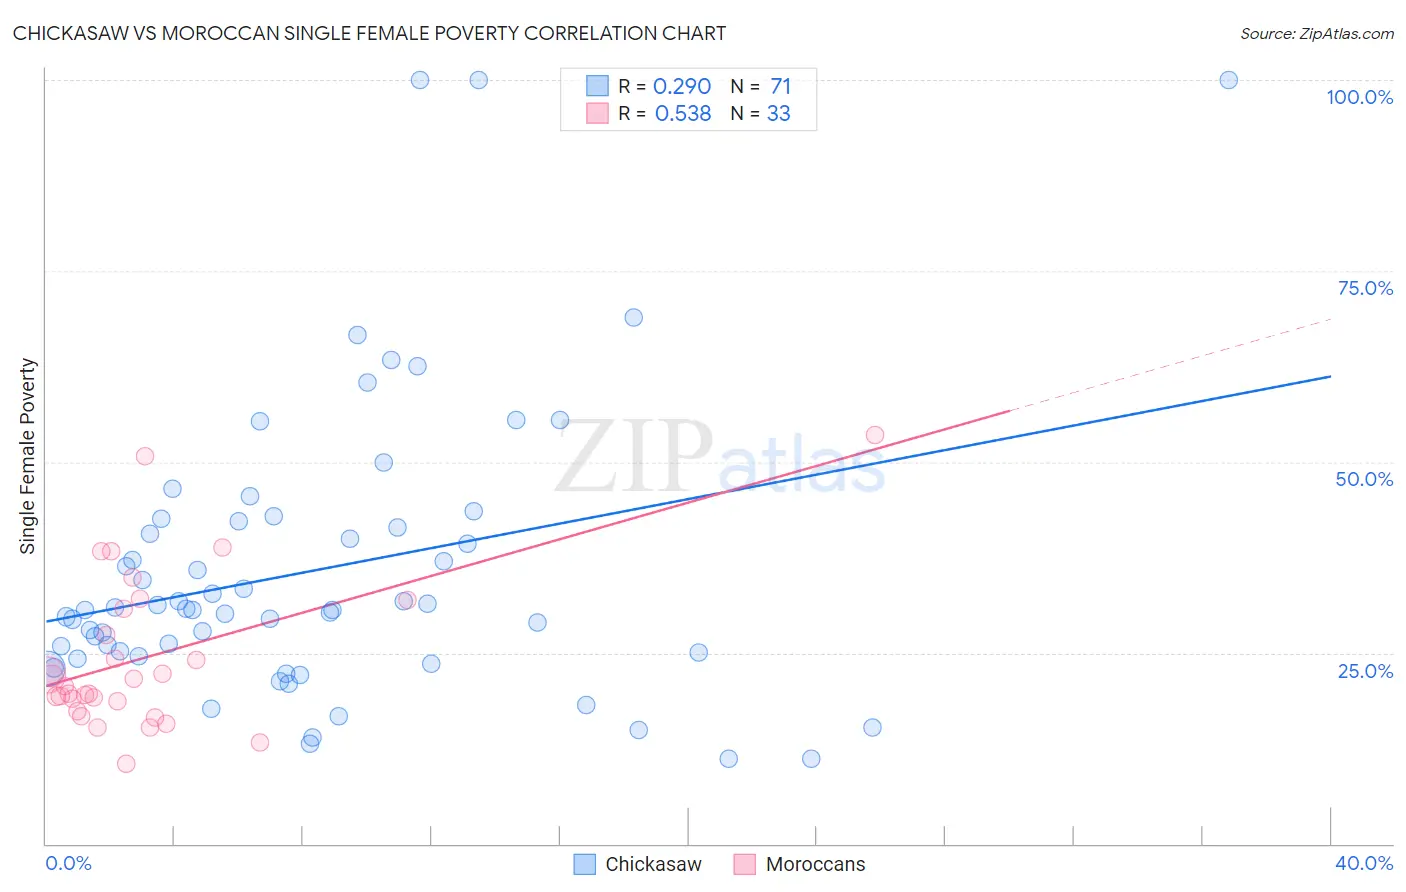
Chickasaw vs Moroccan Single Female Poverty Correlation Chart
The statistical analysis conducted on geographies consisting of 147,052,400 people shows a weak positive correlation between the proportion of Chickasaw and poverty level among single females in the United States with a correlation coefficient (R) of 0.290 and weighted average of 26.3%. Similarly, the statistical analysis conducted on geographies consisting of 200,405,308 people shows a substantial positive correlation between the proportion of Moroccans and poverty level among single females in the United States with a correlation coefficient (R) of 0.538 and weighted average of 21.0%, a difference of 25.2%.
Single Female Poverty Correlation Summary
| Measurement | Chickasaw | Moroccan |
| Minimum | 11.1% | 10.5% |
| Maximum | 100.0% | 53.5% |
| Range | 88.9% | 43.0% |
| Mean | 35.8% | 24.5% |
| Median | 30.6% | 20.6% |
| Interquartile 25% (IQ1) | 24.5% | 18.0% |
| Interquartile 75% (IQ3) | 42.2% | 31.3% |
| Interquartile Range (IQR) | 17.7% | 13.4% |
| Standard Deviation (Sample) | 19.0% | 10.3% |
| Standard Deviation (Population) | 18.8% | 10.1% |
Similar Demographics by Single Female Poverty
Demographics Similar to Chickasaw by Single Female Poverty
In terms of single female poverty, the demographic groups most similar to Chickasaw are Black/African American (26.4%, a difference of 0.33%), Arapaho (26.4%, a difference of 0.63%), Ottawa (26.0%, a difference of 1.0%), Yup'ik (26.6%, a difference of 1.3%), and Immigrants from Somalia (25.8%, a difference of 1.9%).
| Demographics | Rating | Rank | Single Female Poverty |
| Immigrants | Honduras | 0.0 /100 | #311 | Tragic 25.5% |
| Paiute | 0.0 /100 | #312 | Tragic 25.5% |
| Comanche | 0.0 /100 | #313 | Tragic 25.6% |
| Cherokee | 0.0 /100 | #314 | Tragic 25.7% |
| Iroquois | 0.0 /100 | #315 | Tragic 25.7% |
| Immigrants | Somalia | 0.0 /100 | #316 | Tragic 25.8% |
| Ottawa | 0.0 /100 | #317 | Tragic 26.0% |
| Chickasaw | 0.0 /100 | #318 | Tragic 26.3% |
| Blacks/African Americans | 0.0 /100 | #319 | Tragic 26.4% |
| Arapaho | 0.0 /100 | #320 | Tragic 26.4% |
| Yup'ik | 0.0 /100 | #321 | Tragic 26.6% |
| Seminole | 0.0 /100 | #322 | Tragic 26.8% |
| Chippewa | 0.0 /100 | #323 | Tragic 26.8% |
| Kiowa | 0.0 /100 | #324 | Tragic 26.9% |
| Choctaw | 0.0 /100 | #325 | Tragic 27.2% |
Demographics Similar to Moroccans by Single Female Poverty
In terms of single female poverty, the demographic groups most similar to Moroccans are New Zealander (21.0%, a difference of 0.020%), Guyanese (21.0%, a difference of 0.050%), Immigrants from Guyana (21.0%, a difference of 0.14%), Cuban (21.0%, a difference of 0.17%), and Immigrants from Trinidad and Tobago (20.9%, a difference of 0.22%).
| Demographics | Rating | Rank | Single Female Poverty |
| Iraqis | 64.5 /100 | #164 | Good 20.8% |
| Ugandans | 64.0 /100 | #165 | Good 20.8% |
| Norwegians | 63.0 /100 | #166 | Good 20.8% |
| Immigrants | Norway | 63.0 /100 | #167 | Good 20.8% |
| Immigrants | Costa Rica | 61.5 /100 | #168 | Good 20.9% |
| Immigrants | Trinidad and Tobago | 56.3 /100 | #169 | Average 20.9% |
| New Zealanders | 53.2 /100 | #170 | Average 21.0% |
| Moroccans | 52.8 /100 | #171 | Average 21.0% |
| Guyanese | 52.0 /100 | #172 | Average 21.0% |
| Immigrants | Guyana | 50.6 /100 | #173 | Average 21.0% |
| Cubans | 50.0 /100 | #174 | Average 21.0% |
| Czechs | 46.8 /100 | #175 | Average 21.0% |
| Canadians | 45.4 /100 | #176 | Average 21.1% |
| Scandinavians | 45.2 /100 | #177 | Average 21.1% |
| Immigrants | Bosnia and Herzegovina | 44.9 /100 | #178 | Average 21.1% |