Chickasaw vs Immigrants from Belgium Single Female Poverty
COMPARE
Chickasaw
Immigrants from Belgium
Single Female Poverty
Single Female Poverty Comparison
Chickasaw
Immigrants from Belgium
26.3%
SINGLE FEMALE POVERTY
0.0/ 100
METRIC RATING
318th/ 347
METRIC RANK
19.8%
SINGLE FEMALE POVERTY
97.3/ 100
METRIC RATING
101st/ 347
METRIC RANK
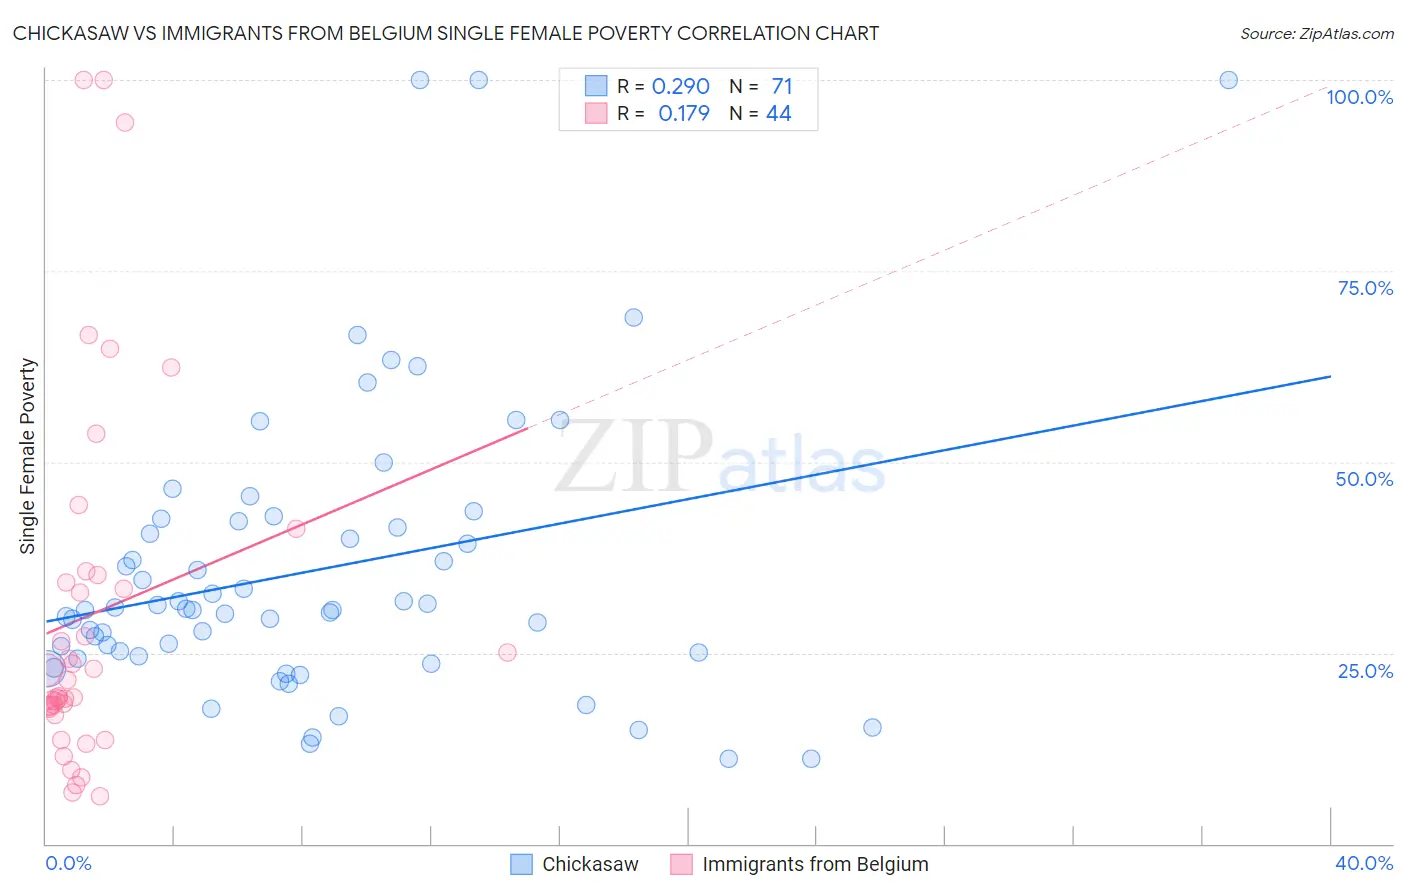
Chickasaw vs Immigrants from Belgium Single Female Poverty Correlation Chart
The statistical analysis conducted on geographies consisting of 147,052,400 people shows a weak positive correlation between the proportion of Chickasaw and poverty level among single females in the United States with a correlation coefficient (R) of 0.290 and weighted average of 26.3%. Similarly, the statistical analysis conducted on geographies consisting of 145,269,497 people shows a poor positive correlation between the proportion of Immigrants from Belgium and poverty level among single females in the United States with a correlation coefficient (R) of 0.179 and weighted average of 19.8%, a difference of 32.4%.
Single Female Poverty Correlation Summary
| Measurement | Chickasaw | Immigrants from Belgium |
| Minimum | 11.1% | 6.3% |
| Maximum | 100.0% | 100.0% |
| Range | 88.9% | 93.7% |
| Mean | 35.8% | 30.1% |
| Median | 30.6% | 20.4% |
| Interquartile 25% (IQ1) | 24.5% | 17.9% |
| Interquartile 75% (IQ3) | 42.2% | 34.7% |
| Interquartile Range (IQR) | 17.7% | 16.9% |
| Standard Deviation (Sample) | 19.0% | 23.7% |
| Standard Deviation (Population) | 18.8% | 23.5% |
Similar Demographics by Single Female Poverty
Demographics Similar to Chickasaw by Single Female Poverty
In terms of single female poverty, the demographic groups most similar to Chickasaw are Black/African American (26.4%, a difference of 0.33%), Arapaho (26.4%, a difference of 0.63%), Ottawa (26.0%, a difference of 1.0%), Yup'ik (26.6%, a difference of 1.3%), and Immigrants from Somalia (25.8%, a difference of 1.9%).
| Demographics | Rating | Rank | Single Female Poverty |
| Immigrants | Honduras | 0.0 /100 | #311 | Tragic 25.5% |
| Paiute | 0.0 /100 | #312 | Tragic 25.5% |
| Comanche | 0.0 /100 | #313 | Tragic 25.6% |
| Cherokee | 0.0 /100 | #314 | Tragic 25.7% |
| Iroquois | 0.0 /100 | #315 | Tragic 25.7% |
| Immigrants | Somalia | 0.0 /100 | #316 | Tragic 25.8% |
| Ottawa | 0.0 /100 | #317 | Tragic 26.0% |
| Chickasaw | 0.0 /100 | #318 | Tragic 26.3% |
| Blacks/African Americans | 0.0 /100 | #319 | Tragic 26.4% |
| Arapaho | 0.0 /100 | #320 | Tragic 26.4% |
| Yup'ik | 0.0 /100 | #321 | Tragic 26.6% |
| Seminole | 0.0 /100 | #322 | Tragic 26.8% |
| Chippewa | 0.0 /100 | #323 | Tragic 26.8% |
| Kiowa | 0.0 /100 | #324 | Tragic 26.9% |
| Choctaw | 0.0 /100 | #325 | Tragic 27.2% |
Demographics Similar to Immigrants from Belgium by Single Female Poverty
In terms of single female poverty, the demographic groups most similar to Immigrants from Belgium are Immigrants from Cameroon (19.8%, a difference of 0.010%), Immigrants from Southern Europe (19.9%, a difference of 0.13%), Ukrainian (19.8%, a difference of 0.18%), Chilean (19.9%, a difference of 0.25%), and Israeli (19.9%, a difference of 0.26%).
| Demographics | Rating | Rank | Single Female Poverty |
| Romanians | 98.6 /100 | #94 | Exceptional 19.6% |
| Estonians | 98.2 /100 | #95 | Exceptional 19.7% |
| Immigrants | Brazil | 98.2 /100 | #96 | Exceptional 19.7% |
| Croatians | 98.1 /100 | #97 | Exceptional 19.7% |
| Immigrants | France | 97.9 /100 | #98 | Exceptional 19.7% |
| Sierra Leoneans | 97.9 /100 | #99 | Exceptional 19.7% |
| Ukrainians | 97.6 /100 | #100 | Exceptional 19.8% |
| Immigrants | Belgium | 97.3 /100 | #101 | Exceptional 19.8% |
| Immigrants | Cameroon | 97.3 /100 | #102 | Exceptional 19.8% |
| Immigrants | Southern Europe | 97.1 /100 | #103 | Exceptional 19.9% |
| Chileans | 96.9 /100 | #104 | Exceptional 19.9% |
| Israelis | 96.9 /100 | #105 | Exceptional 19.9% |
| Ethiopians | 96.7 /100 | #106 | Exceptional 19.9% |
| Immigrants | Syria | 96.7 /100 | #107 | Exceptional 19.9% |
| Native Hawaiians | 96.6 /100 | #108 | Exceptional 19.9% |