Chickasaw vs Immigrants from Dominican Republic Single Female Poverty
COMPARE
Chickasaw
Immigrants from Dominican Republic
Single Female Poverty
Single Female Poverty Comparison
Chickasaw
Immigrants from Dominican Republic
26.3%
SINGLE FEMALE POVERTY
0.0/ 100
METRIC RATING
318th/ 347
METRIC RANK
25.3%
SINGLE FEMALE POVERTY
0.0/ 100
METRIC RATING
305th/ 347
METRIC RANK
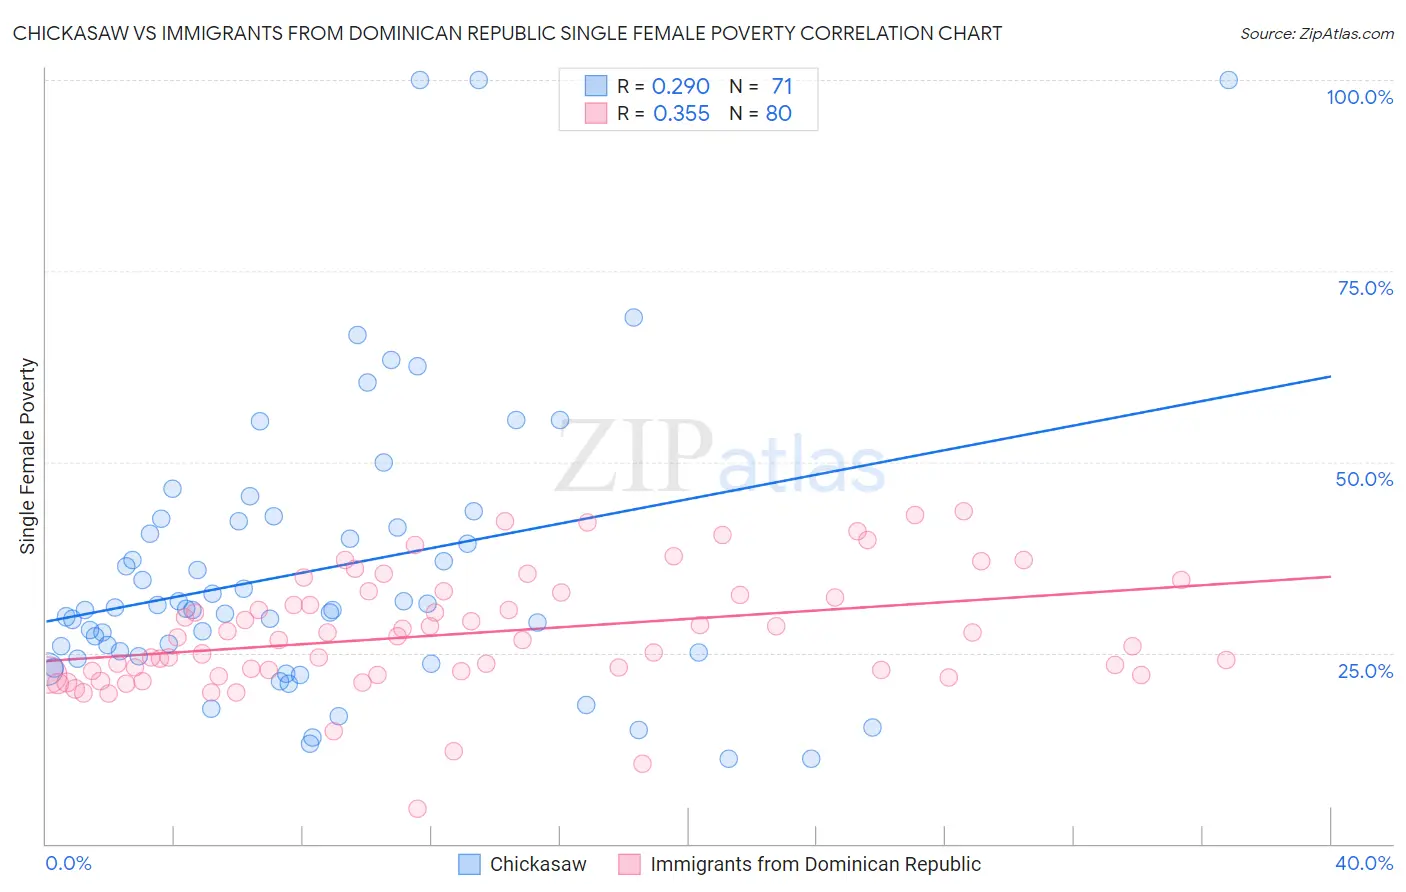
Chickasaw vs Immigrants from Dominican Republic Single Female Poverty Correlation Chart
The statistical analysis conducted on geographies consisting of 147,052,400 people shows a weak positive correlation between the proportion of Chickasaw and poverty level among single females in the United States with a correlation coefficient (R) of 0.290 and weighted average of 26.3%. Similarly, the statistical analysis conducted on geographies consisting of 271,687,011 people shows a mild positive correlation between the proportion of Immigrants from Dominican Republic and poverty level among single females in the United States with a correlation coefficient (R) of 0.355 and weighted average of 25.3%, a difference of 3.8%.
Single Female Poverty Correlation Summary
| Measurement | Chickasaw | Immigrants from Dominican Republic |
| Minimum | 11.1% | 4.6% |
| Maximum | 100.0% | 43.6% |
| Range | 88.9% | 39.0% |
| Mean | 35.8% | 27.5% |
| Median | 30.6% | 26.9% |
| Interquartile 25% (IQ1) | 24.5% | 22.4% |
| Interquartile 75% (IQ3) | 42.2% | 32.7% |
| Interquartile Range (IQR) | 17.7% | 10.3% |
| Standard Deviation (Sample) | 19.0% | 7.7% |
| Standard Deviation (Population) | 18.8% | 7.6% |
Demographics Similar to Chickasaw and Immigrants from Dominican Republic by Single Female Poverty
In terms of single female poverty, the demographic groups most similar to Chickasaw are Black/African American (26.4%, a difference of 0.33%), Arapaho (26.4%, a difference of 0.63%), Ottawa (26.0%, a difference of 1.0%), Yup'ik (26.6%, a difference of 1.3%), and Immigrants from Somalia (25.8%, a difference of 1.9%). Similarly, the demographic groups most similar to Immigrants from Dominican Republic are Immigrants from Congo (25.3%, a difference of 0.010%), Immigrants from Mexico (25.3%, a difference of 0.10%), Somali (25.2%, a difference of 0.28%), Potawatomi (25.4%, a difference of 0.32%), and Aleut (25.4%, a difference of 0.49%).
| Demographics | Rating | Rank | Single Female Poverty |
| Hondurans | 0.0 /100 | #301 | Tragic 25.1% |
| Shoshone | 0.0 /100 | #302 | Tragic 25.1% |
| Somalis | 0.0 /100 | #303 | Tragic 25.2% |
| Immigrants | Congo | 0.0 /100 | #304 | Tragic 25.3% |
| Immigrants | Dominican Republic | 0.0 /100 | #305 | Tragic 25.3% |
| Immigrants | Mexico | 0.0 /100 | #306 | Tragic 25.3% |
| Potawatomi | 0.0 /100 | #307 | Tragic 25.4% |
| Aleuts | 0.0 /100 | #308 | Tragic 25.4% |
| Dominicans | 0.0 /100 | #309 | Tragic 25.4% |
| Central American Indians | 0.0 /100 | #310 | Tragic 25.5% |
| Immigrants | Honduras | 0.0 /100 | #311 | Tragic 25.5% |
| Paiute | 0.0 /100 | #312 | Tragic 25.5% |
| Comanche | 0.0 /100 | #313 | Tragic 25.6% |
| Cherokee | 0.0 /100 | #314 | Tragic 25.7% |
| Iroquois | 0.0 /100 | #315 | Tragic 25.7% |
| Immigrants | Somalia | 0.0 /100 | #316 | Tragic 25.8% |
| Ottawa | 0.0 /100 | #317 | Tragic 26.0% |
| Chickasaw | 0.0 /100 | #318 | Tragic 26.3% |
| Blacks/African Americans | 0.0 /100 | #319 | Tragic 26.4% |
| Arapaho | 0.0 /100 | #320 | Tragic 26.4% |
| Yup'ik | 0.0 /100 | #321 | Tragic 26.6% |