Chickasaw vs Ute Single Female Poverty
COMPARE
Chickasaw
Ute
Single Female Poverty
Single Female Poverty Comparison
Chickasaw
Ute
26.3%
SINGLE FEMALE POVERTY
0.0/ 100
METRIC RATING
318th/ 347
METRIC RANK
28.4%
SINGLE FEMALE POVERTY
0.0/ 100
METRIC RATING
333rd/ 347
METRIC RANK
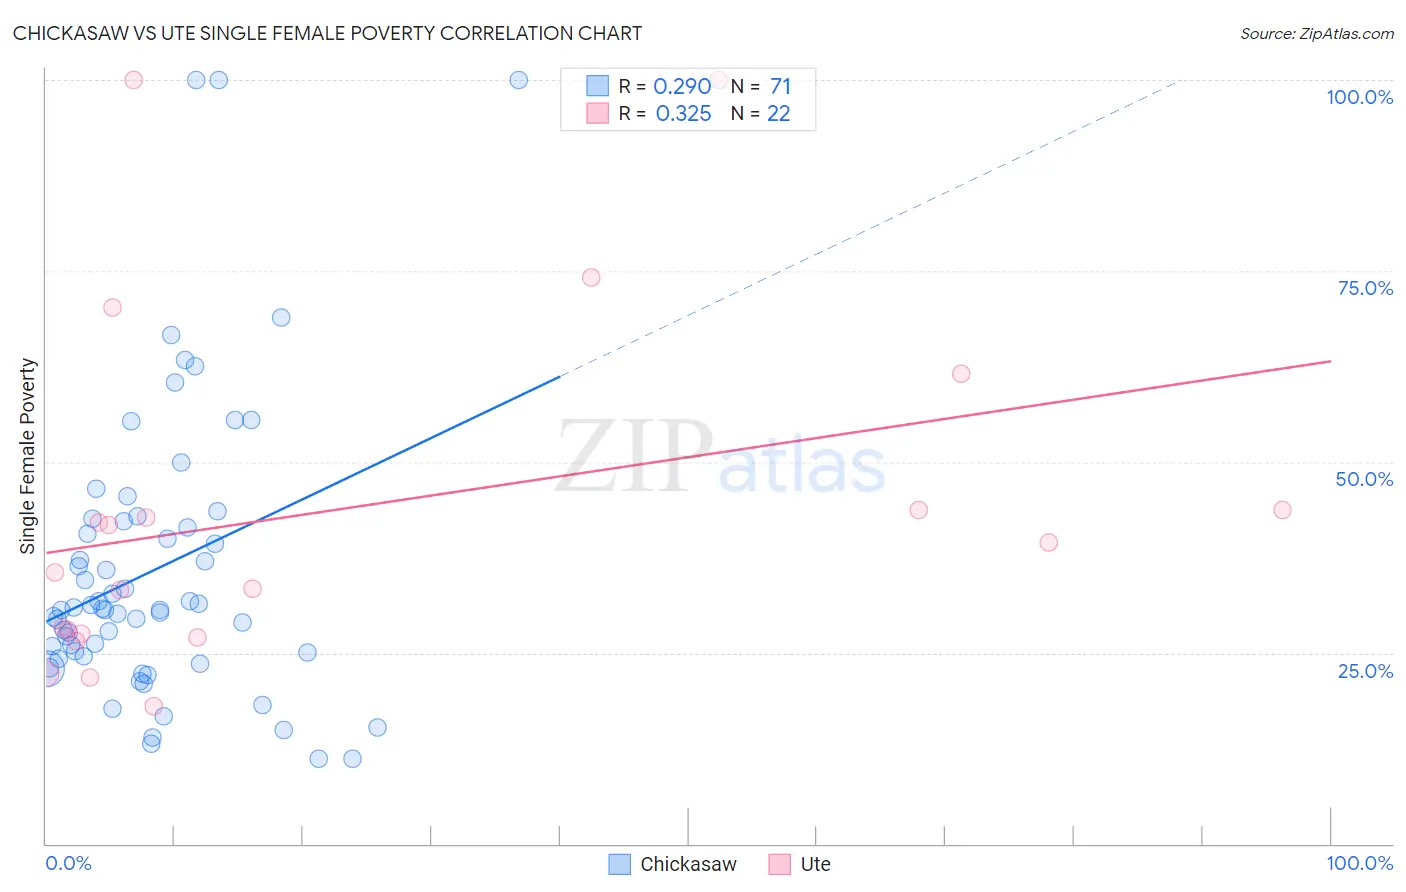
Chickasaw vs Ute Single Female Poverty Correlation Chart
The statistical analysis conducted on geographies consisting of 147,052,400 people shows a weak positive correlation between the proportion of Chickasaw and poverty level among single females in the United States with a correlation coefficient (R) of 0.290 and weighted average of 26.3%. Similarly, the statistical analysis conducted on geographies consisting of 55,519,789 people shows a mild positive correlation between the proportion of Ute and poverty level among single females in the United States with a correlation coefficient (R) of 0.325 and weighted average of 28.4%, a difference of 8.2%.
Single Female Poverty Correlation Summary
| Measurement | Chickasaw | Ute |
| Minimum | 11.1% | 18.0% |
| Maximum | 100.0% | 100.0% |
| Range | 88.9% | 82.0% |
| Mean | 35.8% | 43.7% |
| Median | 30.6% | 37.5% |
| Interquartile 25% (IQ1) | 24.5% | 27.4% |
| Interquartile 75% (IQ3) | 42.2% | 43.8% |
| Interquartile Range (IQR) | 17.7% | 16.3% |
| Standard Deviation (Sample) | 19.0% | 23.4% |
| Standard Deviation (Population) | 18.8% | 22.9% |
Demographics Similar to Chickasaw and Ute by Single Female Poverty
In terms of single female poverty, the demographic groups most similar to Chickasaw are Black/African American (26.4%, a difference of 0.33%), Arapaho (26.4%, a difference of 0.63%), Ottawa (26.0%, a difference of 1.0%), Yup'ik (26.6%, a difference of 1.3%), and Immigrants from Somalia (25.8%, a difference of 1.9%). Similarly, the demographic groups most similar to Ute are Yakama (28.3%, a difference of 0.42%), Native/Alaskan (28.2%, a difference of 0.68%), Pueblo (28.6%, a difference of 0.73%), Hopi (28.0%, a difference of 1.3%), and Immigrants from Yemen (28.9%, a difference of 1.9%).
| Demographics | Rating | Rank | Single Female Poverty |
| Iroquois | 0.0 /100 | #315 | Tragic 25.7% |
| Immigrants | Somalia | 0.0 /100 | #316 | Tragic 25.8% |
| Ottawa | 0.0 /100 | #317 | Tragic 26.0% |
| Chickasaw | 0.0 /100 | #318 | Tragic 26.3% |
| Blacks/African Americans | 0.0 /100 | #319 | Tragic 26.4% |
| Arapaho | 0.0 /100 | #320 | Tragic 26.4% |
| Yup'ik | 0.0 /100 | #321 | Tragic 26.6% |
| Seminole | 0.0 /100 | #322 | Tragic 26.8% |
| Chippewa | 0.0 /100 | #323 | Tragic 26.8% |
| Kiowa | 0.0 /100 | #324 | Tragic 26.9% |
| Choctaw | 0.0 /100 | #325 | Tragic 27.2% |
| Creek | 0.0 /100 | #326 | Tragic 27.4% |
| Dutch West Indians | 0.0 /100 | #327 | Tragic 27.5% |
| Apache | 0.0 /100 | #328 | Tragic 27.7% |
| Menominee | 0.0 /100 | #329 | Tragic 27.8% |
| Hopi | 0.0 /100 | #330 | Tragic 28.0% |
| Natives/Alaskans | 0.0 /100 | #331 | Tragic 28.2% |
| Yakama | 0.0 /100 | #332 | Tragic 28.3% |
| Ute | 0.0 /100 | #333 | Tragic 28.4% |
| Pueblo | 0.0 /100 | #334 | Tragic 28.6% |
| Immigrants | Yemen | 0.0 /100 | #335 | Tragic 28.9% |