Zip Codes with the Highest Percentage of Population Employed in Legal Services & Support in Great Falls, MT
RELATED REPORTS & OPTIONS
Legal Services & Support
Great Falls
Compare Zip Codes
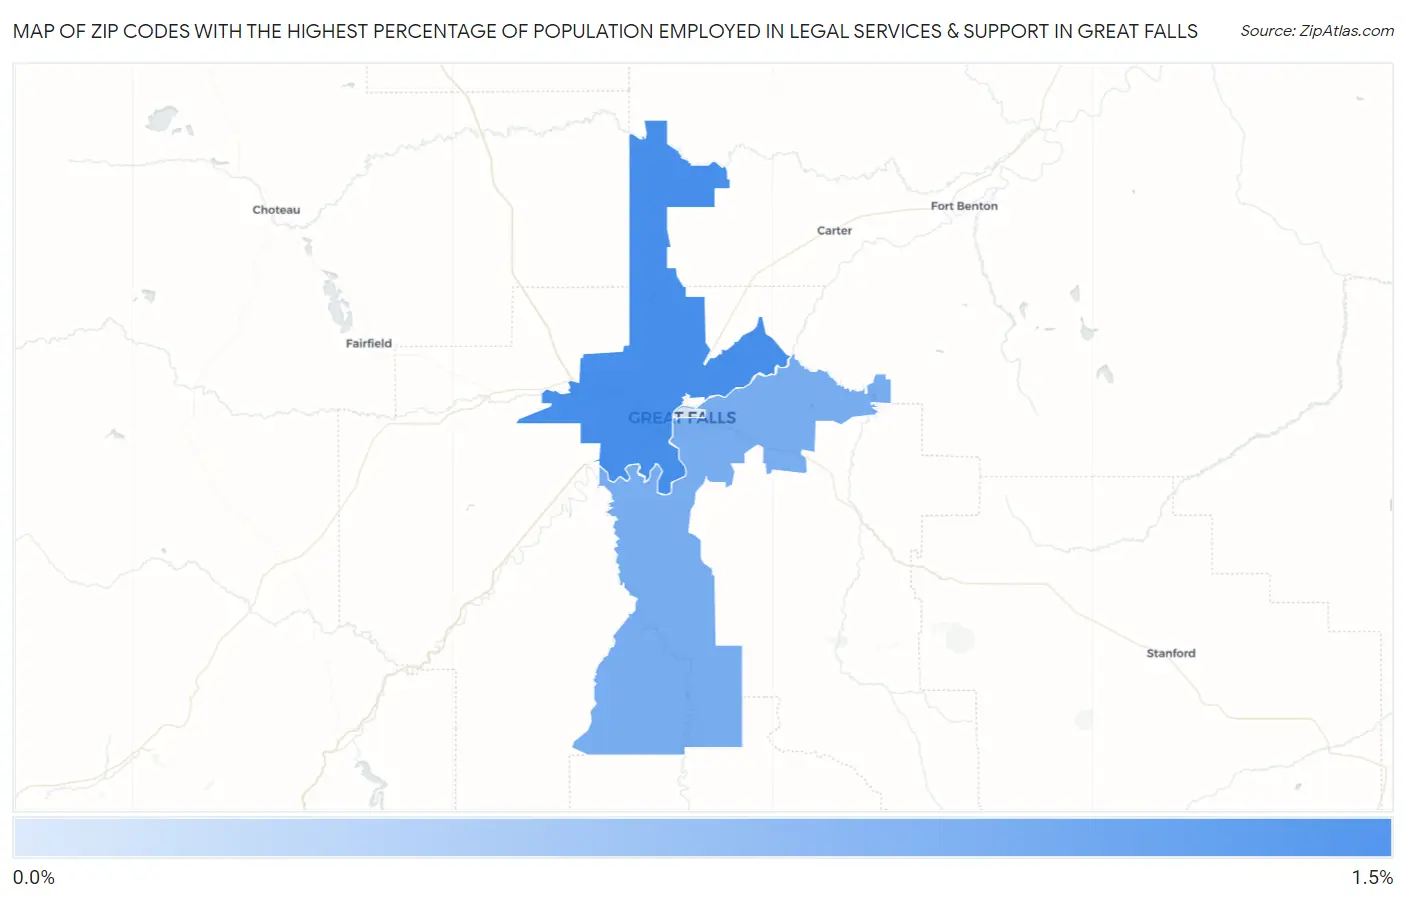
Map of Zip Codes with the Highest Percentage of Population Employed in Legal Services & Support in Great Falls
0.28%
1.1%
Zip Codes with the Highest Percentage of Population Employed in Legal Services & Support in Great Falls, MT
| Zip Code | % Employed | vs State | vs National | |
| 1. | 59404 | 1.1% | 0.99%(+0.143)#47 | 1.2%(-0.047)#6,903 |
| 2. | 59405 | 0.86% | 0.99%(-0.130)#66 | 1.2%(-0.320)#8,902 |
| 3. | 59401 | 0.28% | 0.99%(-0.717)#107 | 1.2%(-0.907)#15,295 |
1
Common Questions
What are the Top Zip Codes with the Highest Percentage of Population Employed in Legal Services & Support in Great Falls, MT?
Top Zip Codes with the Highest Percentage of Population Employed in Legal Services & Support in Great Falls, MT are:
What zip code has the Highest Percentage of Population Employed in Legal Services & Support in Great Falls, MT?
59404 has the Highest Percentage of Population Employed in Legal Services & Support in Great Falls, MT with 1.1%.
What is the Percentage of Population Employed in Legal Services & Support in Great Falls, MT?
Percentage of Population Employed in Legal Services & Support in Great Falls is 0.91%.
What is the Percentage of Population Employed in Legal Services & Support in Montana?
Percentage of Population Employed in Legal Services & Support in Montana is 0.99%.
What is the Percentage of Population Employed in Legal Services & Support in the United States?
Percentage of Population Employed in Legal Services & Support in the United States is 1.2%.