Zip Codes with the Highest Percentage of Households with Income Below $10,000 in Great Falls, MT
RELATED REPORTS & OPTIONS
Household Income | $0-10k
Great Falls
Compare Zip Codes
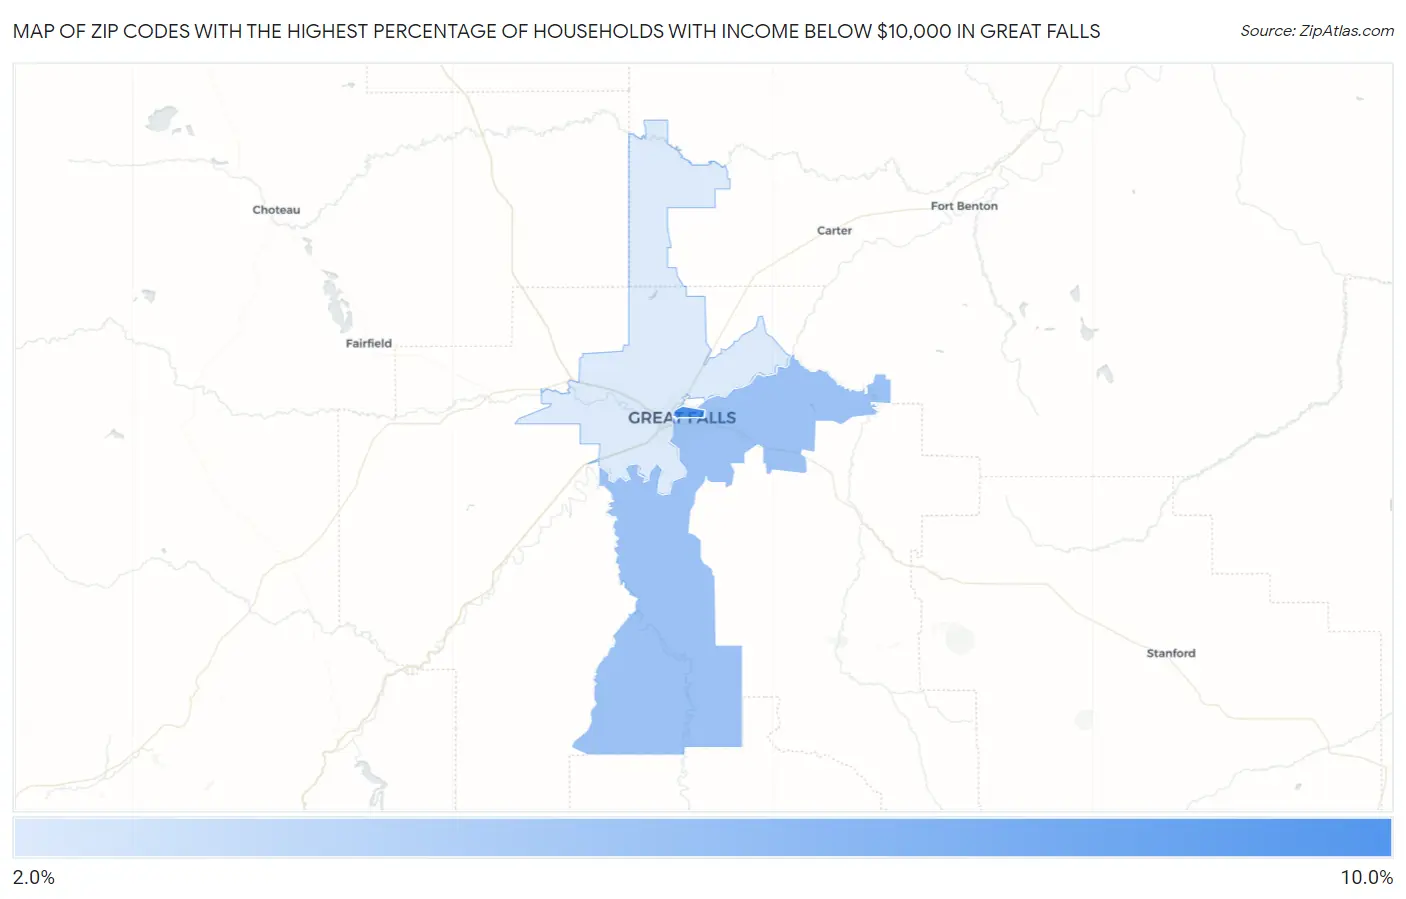
Map of Zip Codes with the Highest Percentage of Households with Income Below $10,000 in Great Falls
2.5%
8.7%
Zip Codes with the Highest Percentage of Households with Income Below $10,000 in Great Falls, MT
| Zip Code | Households with Income < $10k | vs State | vs National | |
| 1. | 59401 | 8.7% | 4.6%(+4.10)#68 | 4.9%(+3.80)#4,741 |
| 2. | 59405 | 5.2% | 4.6%(+0.600)#128 | 4.9%(+0.300)#11,056 |
| 3. | 59404 | 2.5% | 4.6%(-2.10)#217 | 4.9%(-2.40)#21,579 |
1
Common Questions
What are the Top Zip Codes with the Highest Percentage of Households with Income Below $10,000 in Great Falls, MT?
Top Zip Codes with the Highest Percentage of Households with Income Below $10,000 in Great Falls, MT are:
What zip code has the Highest Percentage of Households with Income Below $10,000 in Great Falls, MT?
59401 has the Highest Percentage of Households with Income Below $10,000 in Great Falls, MT with 8.7%.
What is the Percentage of Households with Income Below $10,000 in Great Falls, MT?
Percentage of Households with Income Below $10,000 in Great Falls is 5.3%.
What is the Percentage of Households with Income Below $10,000 in Montana?
Percentage of Households with Income Below $10,000 in Montana is 4.6%.
What is the Percentage of Households with Income Below $10,000 in the United States?
Percentage of Households with Income Below $10,000 in the United States is 4.9%.