Zip Codes with the Highest Percentage of Population Employed in Accommodation & Food Services in Columbus, MS
RELATED REPORTS & OPTIONS
Accommodation & Food Services
Columbus
Compare Zip Codes
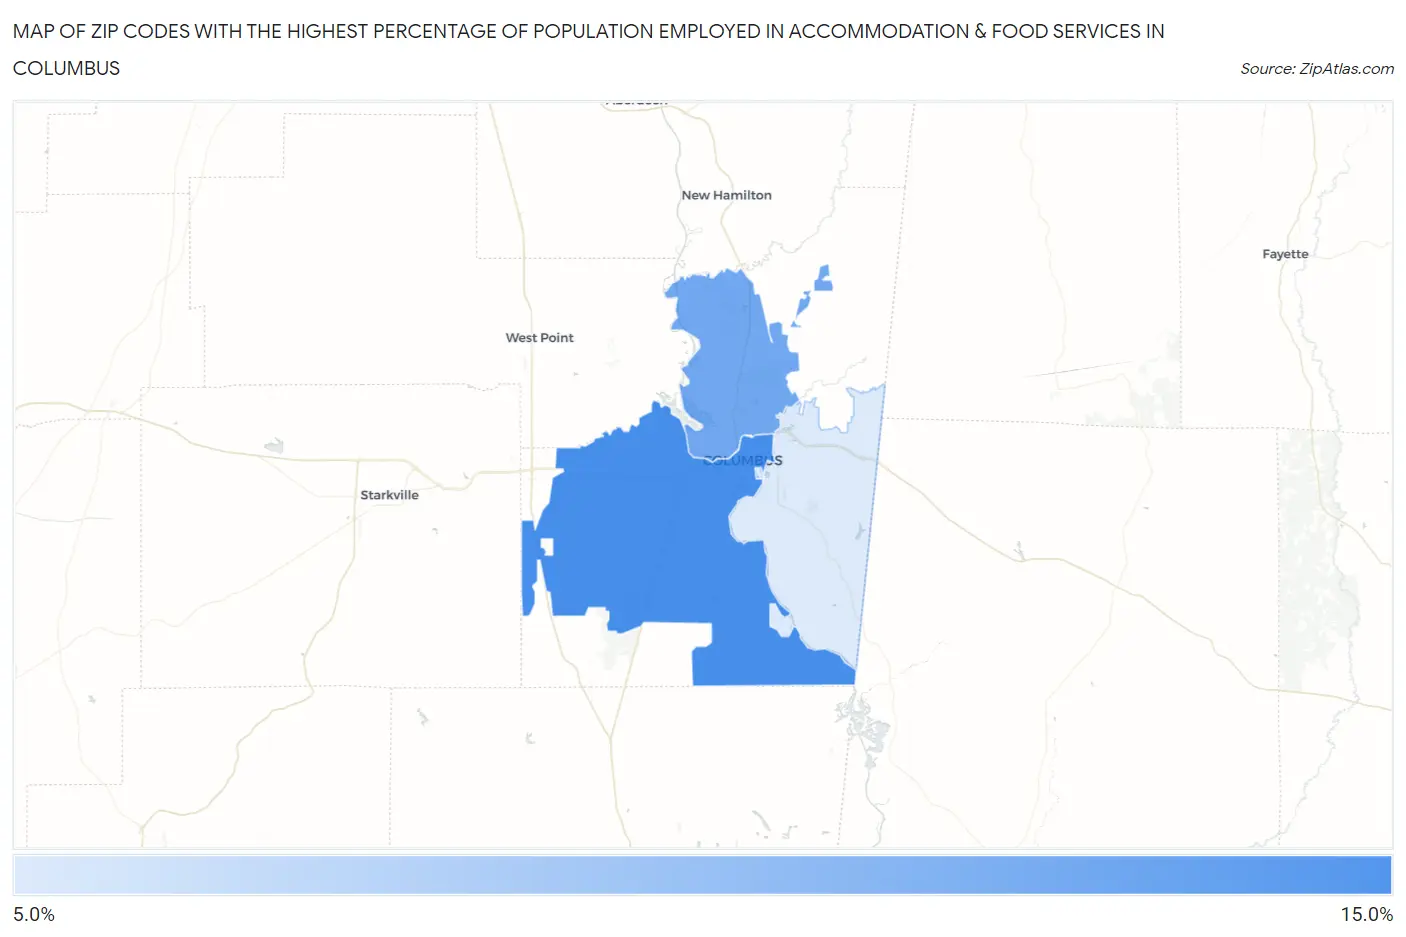
Map of Zip Codes with the Highest Percentage of Population Employed in Accommodation & Food Services in Columbus
7.6%
10.3%
Zip Codes with the Highest Percentage of Population Employed in Accommodation & Food Services in Columbus, MS
| Zip Code | % Employed | vs State | vs National | |
| 1. | 39701 | 10.3% | 6.9%(+3.42)#58 | 6.9%(+3.45)#4,163 |
| 2. | 39705 | 9.6% | 6.9%(+2.66)#69 | 6.9%(+2.69)#5,116 |
| 3. | 39702 | 7.6% | 6.9%(+0.691)#111 | 6.9%(+0.718)#8,752 |
1
Common Questions
What are the Top Zip Codes with the Highest Percentage of Population Employed in Accommodation & Food Services in Columbus, MS?
Top Zip Codes with the Highest Percentage of Population Employed in Accommodation & Food Services in Columbus, MS are:
What zip code has the Highest Percentage of Population Employed in Accommodation & Food Services in Columbus, MS?
39701 has the Highest Percentage of Population Employed in Accommodation & Food Services in Columbus, MS with 10.3%.
What is the Percentage of Population Employed in Accommodation & Food Services in Columbus, MS?
Percentage of Population Employed in Accommodation & Food Services in Columbus is 10.8%.
What is the Percentage of Population Employed in Accommodation & Food Services in Mississippi?
Percentage of Population Employed in Accommodation & Food Services in Mississippi is 6.9%.
What is the Percentage of Population Employed in Accommodation & Food Services in the United States?
Percentage of Population Employed in Accommodation & Food Services in the United States is 6.9%.