Zip Codes with the Highest Percentage of Population with a Degree in Liberal Arts and History in Columbus, MS
RELATED REPORTS & OPTIONS
Liberal Arts and History
Columbus
Compare Zip Codes
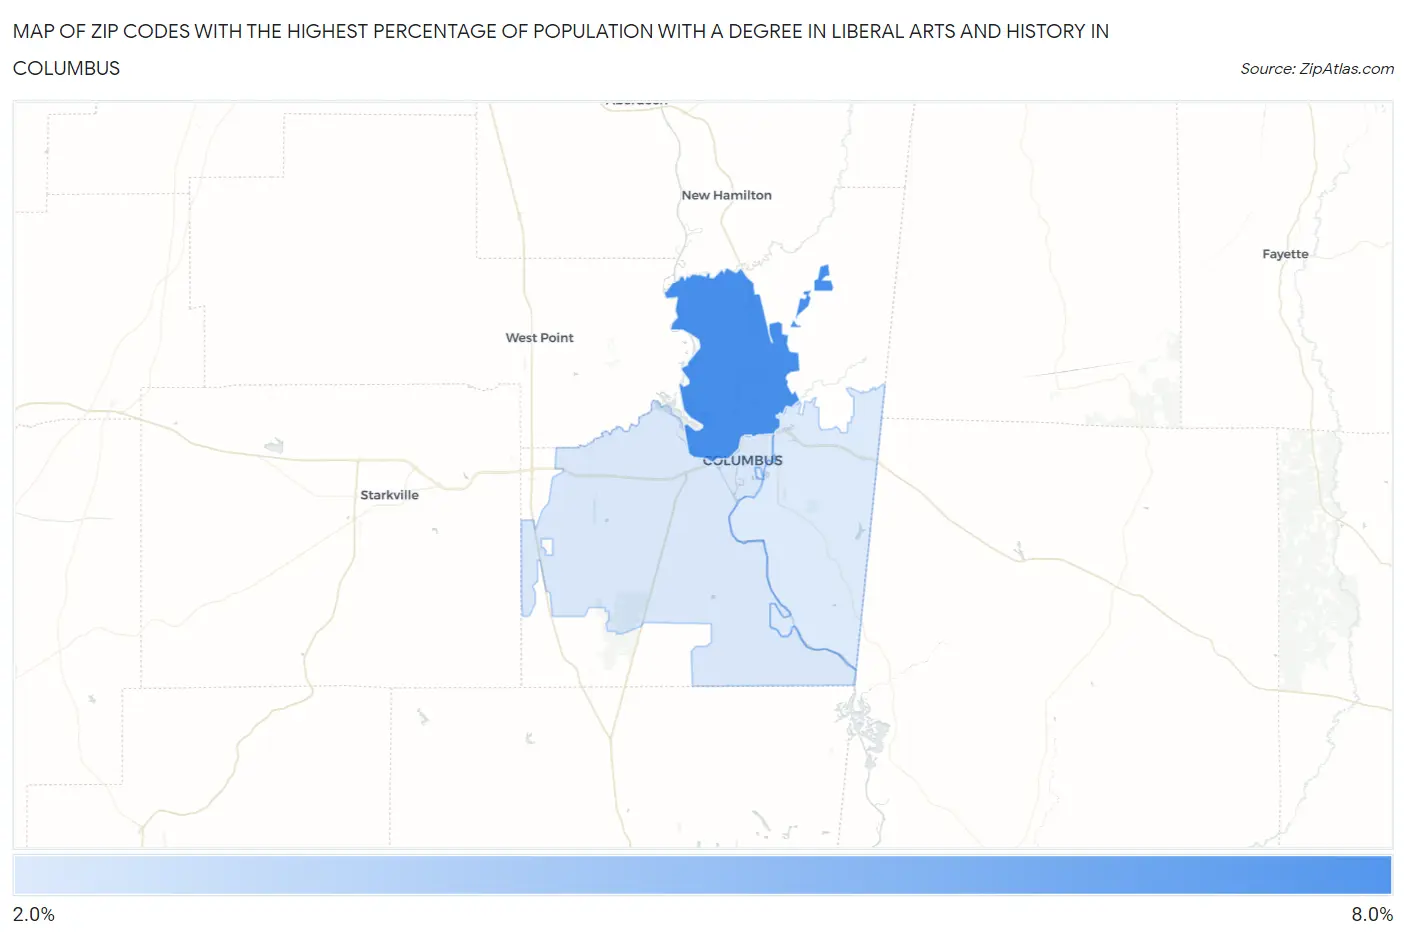
Map of Zip Codes with the Highest Percentage of Population with a Degree in Liberal Arts and History in Columbus
2.5%
6.5%
Zip Codes with the Highest Percentage of Population with a Degree in Liberal Arts and History in Columbus, MS
| Zip Code | % Graduates | vs State | vs National | |
| 1. | 39705 | 6.5% | 4.2%(+2.39)#78 | 4.9%(+1.68)#7,252 |
| 2. | 39701 | 2.6% | 4.2%(-1.57)#182 | 4.9%(-2.28)#19,683 |
| 3. | 39702 | 2.5% | 4.2%(-1.68)#186 | 4.9%(-2.40)#20,067 |
1
Common Questions
What are the Top Zip Codes with the Highest Percentage of Population with a Degree in Liberal Arts and History in Columbus, MS?
Top Zip Codes with the Highest Percentage of Population with a Degree in Liberal Arts and History in Columbus, MS are:
What zip code has the Highest Percentage of Population with a Degree in Liberal Arts and History in Columbus, MS?
39705 has the Highest Percentage of Population with a Degree in Liberal Arts and History in Columbus, MS with 6.5%.
What is the Percentage of Population with a Degree in Liberal Arts and History in Columbus, MS?
Percentage of Population with a Degree in Liberal Arts and History in Columbus is 3.6%.
What is the Percentage of Population with a Degree in Liberal Arts and History in Mississippi?
Percentage of Population with a Degree in Liberal Arts and History in Mississippi is 4.2%.
What is the Percentage of Population with a Degree in Liberal Arts and History in the United States?
Percentage of Population with a Degree in Liberal Arts and History in the United States is 4.9%.