Zip Codes with the Highest Percentage of Population Employed in Legal Services & Support in Chicago, IL
RELATED REPORTS & OPTIONS
Legal Services & Support
Chicago
Compare Zip Codes
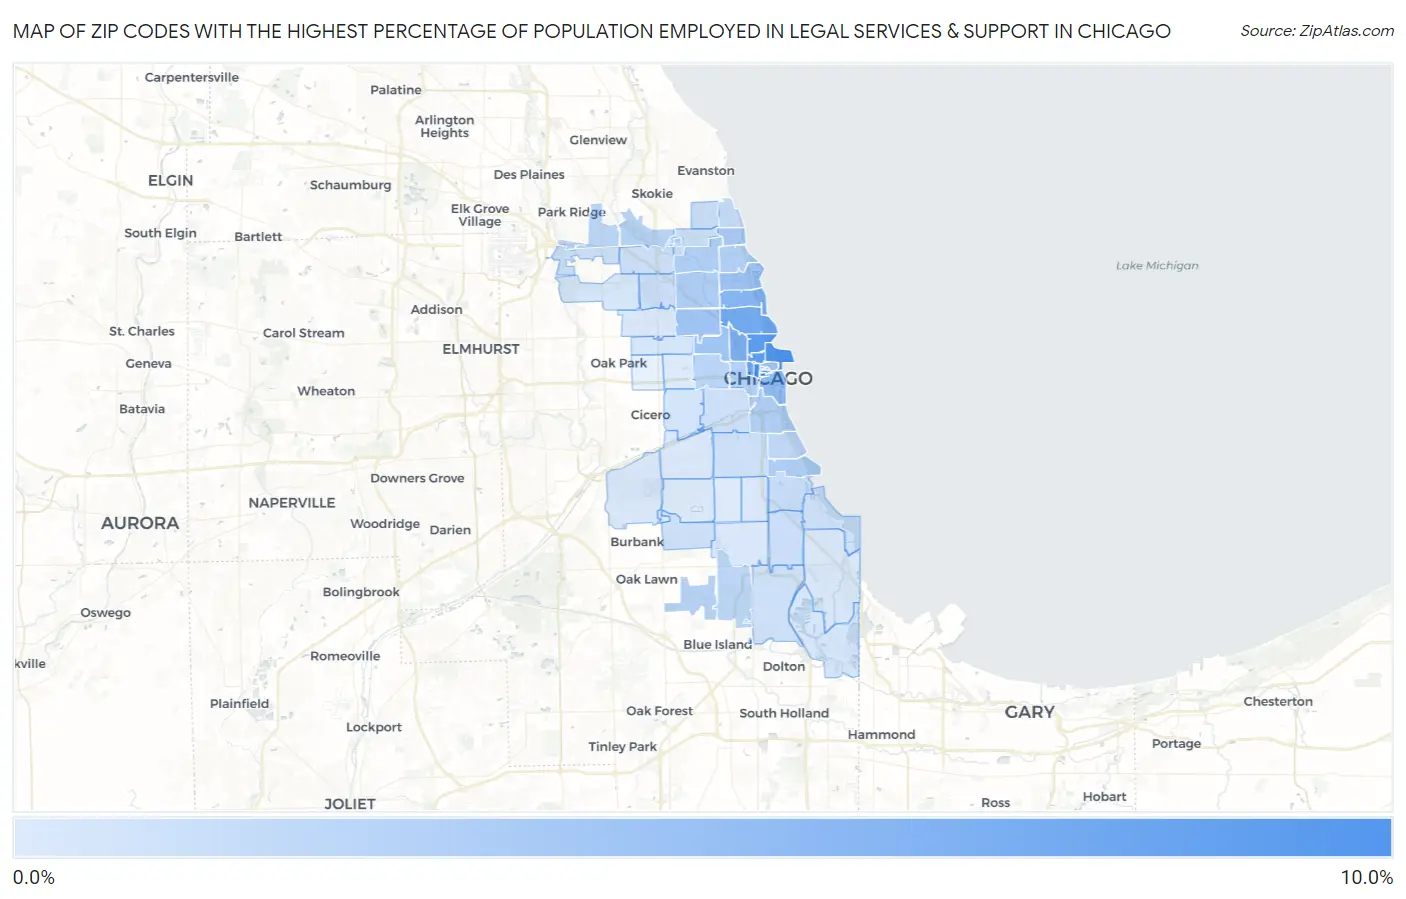
Map of Zip Codes with the Highest Percentage of Population Employed in Legal Services & Support in Chicago
0.23%
8.1%
Zip Codes with the Highest Percentage of Population Employed in Legal Services & Support in Chicago, IL
| Zip Code | % Employed | vs State | vs National | |
| 1. | 60606 | 8.1% | 1.3%(+6.74)#8 | 1.2%(+6.90)#259 |
| 2. | 60604 | 7.8% | 1.3%(+6.46)#10 | 1.2%(+6.63)#280 |
| 3. | 60611 | 7.7% | 1.3%(+6.31)#11 | 1.2%(+6.48)#289 |
| 4. | 60610 | 7.1% | 1.3%(+5.78)#15 | 1.2%(+5.94)#333 |
| 5. | 60654 | 6.9% | 1.3%(+5.55)#16 | 1.2%(+5.71)#356 |
| 6. | 60661 | 5.9% | 1.3%(+4.52)#22 | 1.2%(+4.69)#513 |
| 7. | 60614 | 5.7% | 1.3%(+4.38)#24 | 1.2%(+4.54)#550 |
| 8. | 60642 | 5.3% | 1.3%(+3.94)#27 | 1.2%(+4.10)#642 |
| 9. | 60657 | 4.8% | 1.3%(+3.41)#34 | 1.2%(+3.58)#792 |
| 10. | 60603 | 4.5% | 1.3%(+3.11)#37 | 1.2%(+3.28)#911 |
| 11. | 60605 | 4.1% | 1.3%(+2.79)#42 | 1.2%(+2.96)#1,047 |
| 12. | 60613 | 3.6% | 1.3%(+2.23)#47 | 1.2%(+2.40)#1,362 |
| 13. | 60622 | 3.5% | 1.3%(+2.13)#51 | 1.2%(+2.29)#1,454 |
| 14. | 60601 | 3.4% | 1.3%(+2.01)#55 | 1.2%(+2.18)#1,524 |
| 15. | 60647 | 3.3% | 1.3%(+1.90)#57 | 1.2%(+2.07)#1,607 |
| 16. | 60660 | 2.8% | 1.3%(+1.49)#72 | 1.2%(+1.65)#2,041 |
| 17. | 60618 | 2.6% | 1.3%(+1.20)#92 | 1.2%(+1.37)#2,434 |
| 18. | 60615 | 2.5% | 1.3%(+1.19)#93 | 1.2%(+1.36)#2,454 |
| 19. | 60616 | 2.4% | 1.3%(+1.07)#102 | 1.2%(+1.23)#2,652 |
| 20. | 60640 | 2.4% | 1.3%(+1.03)#104 | 1.2%(+1.19)#2,715 |
| 21. | 60607 | 2.4% | 1.3%(+1.03)#105 | 1.2%(+1.19)#2,716 |
| 22. | 60625 | 2.3% | 1.3%(+0.992)#110 | 1.2%(+1.16)#2,779 |
| 23. | 60655 | 2.1% | 1.3%(+0.728)#129 | 1.2%(+0.894)#3,270 |
| 24. | 60612 | 2.0% | 1.3%(+0.680)#132 | 1.2%(+0.846)#3,392 |
| 25. | 60646 | 2.0% | 1.3%(+0.642)#137 | 1.2%(+0.808)#3,503 |
| 26. | 60631 | 1.9% | 1.3%(+0.562)#147 | 1.2%(+0.728)#3,698 |
| 27. | 60643 | 1.9% | 1.3%(+0.525)#152 | 1.2%(+0.691)#3,793 |
| 28. | 60653 | 1.6% | 1.3%(+0.287)#168 | 1.2%(+0.452)#4,541 |
| 29. | 60626 | 1.6% | 1.3%(+0.221)#174 | 1.2%(+0.386)#4,782 |
| 30. | 60637 | 1.3% | 1.3%(-0.006)#208 | 1.2%(+0.159)#5,718 |
| 31. | 60645 | 1.2% | 1.3%(-0.101)#229 | 1.2%(+0.065)#6,218 |
| 32. | 60641 | 1.2% | 1.3%(-0.139)#232 | 1.2%(+0.026)#6,419 |
| 33. | 60619 | 1.2% | 1.3%(-0.148)#234 | 1.2%(+0.017)#6,492 |
| 34. | 60656 | 1.1% | 1.3%(-0.254)#263 | 1.2%(-0.088)#7,203 |
| 35. | 60659 | 1.1% | 1.3%(-0.269)#271 | 1.2%(-0.104)#7,302 |
| 36. | 60652 | 0.98% | 1.3%(-0.370)#294 | 1.2%(-0.204)#7,967 |
| 37. | 60630 | 0.98% | 1.3%(-0.370)#295 | 1.2%(-0.205)#7,970 |
| 38. | 60649 | 0.97% | 1.3%(-0.383)#296 | 1.2%(-0.218)#8,066 |
| 39. | 60628 | 0.96% | 1.3%(-0.394)#303 | 1.2%(-0.228)#8,160 |
| 40. | 60609 | 0.92% | 1.3%(-0.426)#314 | 1.2%(-0.261)#8,399 |
| 41. | 60608 | 0.88% | 1.3%(-0.469)#327 | 1.2%(-0.304)#8,775 |
| 42. | 60623 | 0.65% | 1.3%(-0.698)#424 | 1.2%(-0.532)#10,928 |
| 43. | 60633 | 0.62% | 1.3%(-0.732)#436 | 1.2%(-0.567)#11,287 |
| 44. | 60651 | 0.57% | 1.3%(-0.782)#461 | 1.2%(-0.617)#11,866 |
| 45. | 60634 | 0.56% | 1.3%(-0.794)#465 | 1.2%(-0.629)#11,995 |
| 46. | 60638 | 0.50% | 1.3%(-0.854)#499 | 1.2%(-0.688)#12,688 |
| 47. | 60617 | 0.49% | 1.3%(-0.861)#506 | 1.2%(-0.696)#12,778 |
| 48. | 60632 | 0.33% | 1.3%(-1.02)#593 | 1.2%(-0.855)#14,716 |
| 49. | 60639 | 0.32% | 1.3%(-1.03)#598 | 1.2%(-0.864)#14,813 |
| 50. | 60620 | 0.31% | 1.3%(-1.04)#601 | 1.2%(-0.876)#14,946 |
| 51. | 60621 | 0.30% | 1.3%(-1.05)#608 | 1.2%(-0.886)#15,073 |
| 52. | 60624 | 0.27% | 1.3%(-1.08)#622 | 1.2%(-0.912)#15,373 |
| 53. | 60636 | 0.27% | 1.3%(-1.08)#624 | 1.2%(-0.915)#15,400 |
| 54. | 60629 | 0.23% | 1.3%(-1.11)#645 | 1.2%(-0.949)#15,816 |
1
Common Questions
What are the Top 10 Zip Codes with the Highest Percentage of Population Employed in Legal Services & Support in Chicago, IL?
Top 10 Zip Codes with the Highest Percentage of Population Employed in Legal Services & Support in Chicago, IL are:
What zip code has the Highest Percentage of Population Employed in Legal Services & Support in Chicago, IL?
60606 has the Highest Percentage of Population Employed in Legal Services & Support in Chicago, IL with 8.1%.
What is the Percentage of Population Employed in Legal Services & Support in Chicago, IL?
Percentage of Population Employed in Legal Services & Support in Chicago is 2.2%.
What is the Percentage of Population Employed in Legal Services & Support in Illinois?
Percentage of Population Employed in Legal Services & Support in Illinois is 1.3%.
What is the Percentage of Population Employed in Legal Services & Support in the United States?
Percentage of Population Employed in Legal Services & Support in the United States is 1.2%.