Zip Codes with the Highest Percentage of Population with a Degree in Business in Chicago, IL

RELATED REPORTS & OPTIONS

Business
Population
Families and Households
Female Fertility
Female Fertility (Unmarried)
Race (Community Size)
Race (Percentage)
Ancestry (Community Size)
AfghanAfricanAlbanianAmericanApacheArabArgentineanArmenianAssyrian / Chaldean / SyriacAustralianAustrianBahamianBangladeshiBarbadianBasqueBelgianBelizeanBermudanBhutaneseBlackfeetBolivianBrazilianBritishBritish West IndianBulgarianBurmeseCajunCambodianCanadianCape VerdeanCarpatho RusynCelticCentral AmericanCentral American IndianCherokeeChickasawChileanChippewaChoctawColombianComancheCosta RicanCreeCreekCroatianCubanCypriotCzechCzechoslovakianDanishDominicanDutchEastern EuropeanEcuadorianEgyptianEnglishEstonianEthiopianEuropeanFilipinoFinnishFrenchFrench American IndianFrench CanadianGermanGerman RussianGhanaianGreekGuamanian / ChamorroGuatemalanGuyaneseHaitianHmongHonduranHopiHungarianIcelanderIndian (Asian)IndonesianInupiatIranianIraqiIrishIroquoisIsraeliItalianJamaicanJapaneseJordanianKenyanKiowaKoreanLaotianLatvianLebaneseLiberianLithuanianLumbeeLuxembourgerMacedonianMalaysianMalteseMenomineeMexicanMexican American IndianMongolianMoroccanNative HawaiianNavajoNew ZealanderNicaraguanNigerianNorthern EuropeanNorwegianOkinawanOsageOttawaPaiutePakistaniPalestinianPanamanianParaguayanPennsylvania GermanPeruvianPolishPortuguesePotawatomiPuebloPuerto RicanPuget Sound SalishRomanianRussianSalvadoranSamoanScandinavianScotch-IrishScottishSeminoleSenegaleseSerbianShoshoneSierra LeoneanSiouxSlavicSlovakSloveneSomaliSouth AfricanSouth AmericanSouth American IndianSoviet UnionSpaniardSpanishSpanish AmericanSri LankanSubsaharan AfricanSudaneseSwedishSwissSyrianTaiwaneseThaiTonganTrinidadian and TobagonianTurkishU.S. Virgin IslanderUgandanUkrainianUruguayanVenezuelanVietnameseWelshWest IndianYaquiYugoslavianZimbabwean
Ancestry (Percentage)
AfghanAfricanAlbanianAmericanApacheArabArgentineanArmenianAssyrian / Chaldean / SyriacAustralianAustrianBahamianBangladeshiBarbadianBasqueBelgianBelizeanBermudanBhutaneseBlackfeetBolivianBrazilianBritishBritish West IndianBulgarianBurmeseCajunCambodianCanadianCape VerdeanCarpatho RusynCelticCentral AmericanCentral American IndianCherokeeChickasawChileanChippewaChoctawColombianComancheCosta RicanCreeCreekCroatianCubanCypriotCzechCzechoslovakianDanishDominicanDutchEastern EuropeanEcuadorianEgyptianEnglishEstonianEthiopianEuropeanFilipinoFinnishFrenchFrench American IndianFrench CanadianGermanGerman RussianGhanaianGreekGuamanian / ChamorroGuatemalanGuyaneseHaitianHmongHonduranHopiHungarianIcelanderIndian (Asian)IndonesianInupiatIranianIraqiIrishIroquoisIsraeliItalianJamaicanJapaneseJordanianKenyanKiowaKoreanLaotianLatvianLebaneseLiberianLithuanianLumbeeLuxembourgerMacedonianMalaysianMalteseMenomineeMexicanMexican American IndianMongolianMoroccanNative HawaiianNavajoNew ZealanderNicaraguanNigerianNorthern EuropeanNorwegianOkinawanOsageOttawaPaiutePakistaniPalestinianPanamanianParaguayanPennsylvania GermanPeruvianPolishPortuguesePotawatomiPuebloPuerto RicanPuget Sound SalishRomanianRussianSalvadoranSamoanScandinavianScotch-IrishScottishSeminoleSenegaleseSerbianShoshoneSierra LeoneanSiouxSlavicSlovakSloveneSomaliSouth AfricanSouth AmericanSouth American IndianSoviet UnionSpaniardSpanishSpanish AmericanSri LankanSubsaharan AfricanSudaneseSwedishSwissSyrianTaiwaneseThaiTonganTrinidadian and TobagonianTurkishU.S. Virgin IslanderUgandanUkrainianUruguayanVenezuelanVietnameseWelshWest IndianYaquiYugoslavianZimbabwean
Immigrant Origin (Total)
AfghanistanAfricaAlbaniaArgentinaArmeniaAsiaAustraliaAustriaBahamasBangladeshBarbadosBelarusBelgiumBelizeBoliviaBosnia and HerzegovinaBrazilBulgariaBurma / MyanmarCambodiaCameroonCanadaCaribbeanCentral AmericaChileChinaColombiaCongoCosta RicaCroatiaCubaCzechoslovakiaDenmarkDominicaDominican RepublicEastern AfricaEastern AsiaEastern EuropeEcuadorEgyptEl SalvadorEnglandEritreaEthiopiaEuropeFijiFranceGermanyGhanaGreeceGuatemalaGuyanaHaitiHondurasHong KongHungaryIndiaIndonesiaIranIraqIrelandIsraelItalyJamaicaJapanJordanKazakhstanKenyaKoreaKuwaitLaosLatin AmericaLatviaLebanonLiberiaLithuaniaMalaysiaMexicoMiddle AfricaMoldovaMoroccoNepalNetherlandsNicaraguaNigeriaNorth MacedoniaNorthern AfricaNorthern EuropeNorwayOceaniaPakistanPanamaPeruPhilippinesPolandPortugalRomaniaRussiaSaudi ArabiaScotlandSenegalSerbiaSierra LeoneSingaporeSomaliaSouth AfricaSouth AmericaSouth Central AsiaSouth Eastern AsiaSouthern EuropeSpainSri LankaSudanSwedenSwitzerlandSyriaTaiwanThailandTrinidad and TobagoTurkeyUgandaUkraineUruguayUzbekistanVenezuelaVietnamWest IndiesWestern AfricaWestern AsiaWestern EuropeYemenZaireZimbabwe
Immigrant Origin (Percentage)
AfghanistanAfricaAlbaniaArgentinaArmeniaAsiaAustraliaAustriaBahamasBangladeshBarbadosBelarusBelgiumBelizeBoliviaBosnia and HerzegovinaBrazilBulgariaBurma / MyanmarCambodiaCameroonCanadaCaribbeanCentral AmericaChileChinaColombiaCongoCosta RicaCroatiaCubaCzechoslovakiaDenmarkDominicaDominican RepublicEastern AfricaEastern AsiaEastern EuropeEcuadorEgyptEl SalvadorEnglandEritreaEthiopiaEuropeFijiFranceGermanyGhanaGreeceGuatemalaGuyanaHaitiHondurasHong KongHungaryIndiaIndonesiaIranIraqIrelandIsraelItalyJamaicaJapanJordanKazakhstanKenyaKoreaKuwaitLaosLatin AmericaLatviaLebanonLiberiaLithuaniaMalaysiaMexicoMiddle AfricaMoldovaMoroccoNepalNetherlandsNicaraguaNigeriaNorth MacedoniaNorthern AfricaNorthern EuropeNorwayOceaniaPakistanPanamaPeruPhilippinesPolandPortugalRomaniaRussiaSaudi ArabiaScotlandSenegalSerbiaSierra LeoneSingaporeSomaliaSouth AfricaSouth AmericaSouth Central AsiaSouth Eastern AsiaSouthern EuropeSpainSri LankaSudanSwedenSwitzerlandSyriaTaiwanThailandTrinidad and TobagoTurkeyUgandaUkraineUruguayUzbekistanVenezuelaVietnamWest IndiesWestern AfricaWestern AsiaWestern EuropeYemenZaireZimbabwe
Income
Income (Families)
Income (Households)
Poverty
Poverty (Families)
Unemployment
Employment Occupations
Employment Industries
Employer Class
Commute Time
Commute Means
School Enrollment
Education by Degree Field
Occupancy
Finances
Physical Characteristics
Chicago
Compare Zip Codes
Comparison Subject

Map of Zip Codes with the Highest Percentage of Population with a Degree in Business in Chicago

9.6%
32.8%
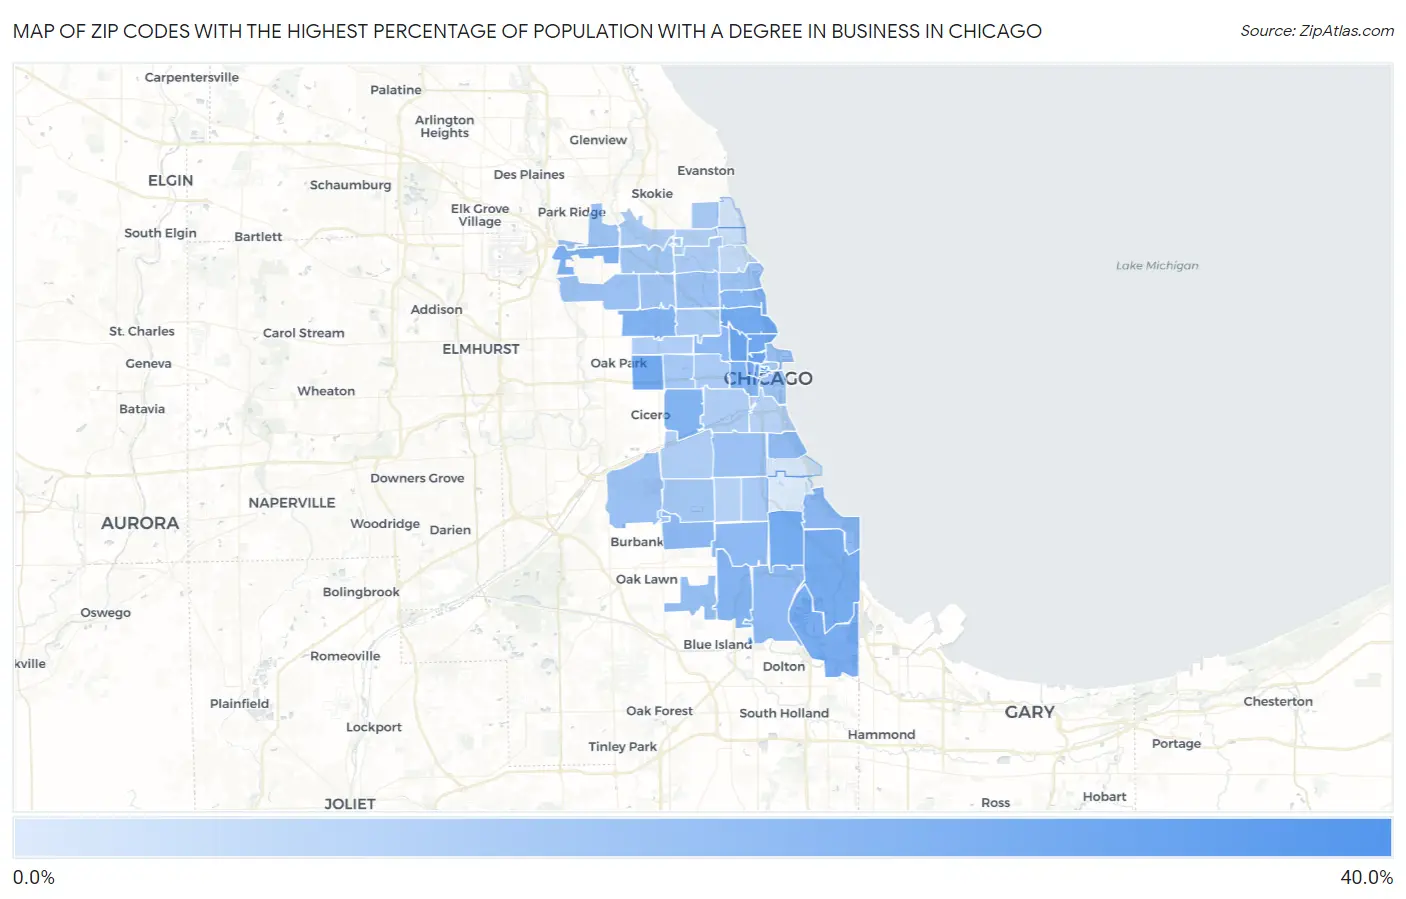
Zip Codes with the Highest Percentage of Population with a Degree in Business in Chicago Map

Zip Codes with the Highest Percentage of Population with a Degree in Business in Chicago, IL

Zip Code % Graduates vs State vs National
1. 60602 32.8% 20.4% (+12.4)#106 19.5% (+13.3)#2,111
2. 60603 28.5% 20.4% (+8.09)#155 19.5% (+8.97)#3,443
3. 60654 27.5% 20.4% (+7.16)#175 19.5% (+8.05)#3,896
4. 60642 26.8% 20.4% (+6.45)#192 19.5% (+7.33)#4,291
5. 60661 26.1% 20.4% (+5.70)#207 19.5% (+6.59)#4,825
6. 60610 25.7% 20.4% (+5.36)#225 19.5% (+6.24)#5,059
7. 60614 25.6% 20.4% (+5.19)#228 19.5% (+6.07)#5,199
8. 60606 25.5% 20.4% (+5.13)#230 19.5% (+6.02)#5,244
9. 60644 25.5% 20.4% (+5.13)#231 19.5% (+6.01)#5,249
10. 60619 25.2% 20.4% (+4.79)#244 19.5% (+5.67)#5,511
11. 60617 25.0% 20.4% (+4.57)#257 19.5% (+5.45)#5,737
12. 60633 24.5% 20.4% (+4.16)#273 19.5% (+5.04)#6,090
13. 60639 23.3% 20.4% (+2.88)#333 19.5% (+3.76)#7,390
14. 60656 23.2% 20.4% (+2.82)#335 19.5% (+3.70)#7,445
15. 60623 22.9% 20.4% (+2.56)#346 19.5% (+3.44)#7,714
16. 60607 22.9% 20.4% (+2.47)#353 19.5% (+3.35)#7,807
17. 60643 22.7% 20.4% (+2.32)#360 19.5% (+3.21)#7,967
18. 60657 22.4% 20.4% (+1.97)#376 19.5% (+2.86)#8,369
19. 60652 21.5% 20.4% (+1.13)#427 19.5% (+2.02)#9,442
20. 60649 21.4% 20.4% (+1.03)#433 19.5% (+1.92)#9,588
21. 60622 21.3% 20.4% (+0.910)#443 19.5% (+1.79)#9,752
22. 60620 21.3% 20.4% (+0.868)#448 19.5% (+1.75)#9,805
23. 60628 21.0% 20.4% (+0.632)#462 19.5% (+1.52)#10,134
24. 60653 20.9% 20.4% (+0.478)#471 19.5% (+1.36)#10,344
25. 60655 20.0% 20.4% (-0.372)#519 19.5% (+0.512)#11,549
26. 60611 19.9% 20.4% (-0.519)#531 19.5% (+0.365)#11,817
27. 60634 19.6% 20.4% (-0.815)#548 19.5% (+0.069)#12,263
28. 60618 19.5% 20.4% (-0.862)#552 19.5% (+0.022)#12,343
29. 60638 19.4% 20.4% (-1.03)#565 19.5% (-0.141)#12,563
30. 60631 19.2% 20.4% (-1.16)#575 19.5% (-0.280)#12,791
31. 60613 19.1% 20.4% (-1.28)#580 19.5% (-0.401)#12,989
32. 60609 18.9% 20.4% (-1.47)#593 19.5% (-0.590)#13,273
33. 60605 18.8% 20.4% (-1.58)#600 19.5% (-0.700)#13,427
34. 60641 18.2% 20.4% (-2.17)#631 19.5% (-1.29)#14,259
35. 60629 18.2% 20.4% (-2.23)#634 19.5% (-1.34)#14,365
36. 60630 18.0% 20.4% (-2.35)#641 19.5% (-1.47)#14,539
37. 60601 17.6% 20.4% (-2.74)#664 19.5% (-1.85)#15,114
38. 60624 17.5% 20.4% (-2.89)#671 19.5% (-2.01)#15,349
39. 60647 17.4% 20.4% (-2.97)#678 19.5% (-2.09)#15,477
40. 60645 17.3% 20.4% (-3.13)#689 19.5% (-2.25)#15,729
41. 60621 17.1% 20.4% (-3.31)#704 19.5% (-2.43)#16,029
42. 60612 16.8% 20.4% (-3.58)#720 19.5% (-2.70)#16,437
43. 60625 16.6% 20.4% (-3.77)#738 19.5% (-2.88)#16,741
44. 60646 16.6% 20.4% (-3.79)#739 19.5% (-2.91)#16,770
45. 60608 16.4% 20.4% (-4.01)#753 19.5% (-3.13)#17,092
46. 60632 16.2% 20.4% (-4.13)#760 19.5% (-3.25)#17,249
47. 60651 15.7% 20.4% (-4.63)#776 19.5% (-3.75)#17,924
48. 60659 15.6% 20.4% (-4.73)#780 19.5% (-3.85)#18,057
49. 60636 15.1% 20.4% (-5.32)#813 19.5% (-4.43)#18,876
50. 60616 15.0% 20.4% (-5.37)#819 19.5% (-4.49)#18,950
51. 60640 13.3% 20.4% (-7.12)#918 19.5% (-6.23)#21,139
52. 60660 12.3% 20.4% (-8.13)#960 19.5% (-7.24)#22,230
53. 60626 11.3% 20.4% (-9.12)#1,001 19.5% (-8.24)#23,204
54. 60604 10.9% 20.4% (-9.44)#1,014 19.5% (-8.56)#23,523
55. 60615 10.3% 20.4% (-10.1)#1,045 19.5% (-9.21)#24,131
56. 60637 9.6% 20.4% (-10.8)#1,066 19.5% (-9.91)#24,663

Common Questions

What are the Top 10 Zip Codes with the Highest Percentage of Population with a Degree in Business in Chicago, IL?
Top 10 Zip Codes with the Highest Percentage of Population with a Degree in Business in Chicago, IL are:
#1
32.8%
#2
28.5%
#3
27.5%
#4
26.8%
#5
26.1%
#6
25.7%
#7
25.6%
#8
25.5%
#9
25.5%
#10
25.2%
What zip code has the Highest Percentage of Population with a Degree in Business in Chicago, IL?
60602 has the Highest Percentage of Population with a Degree in Business in Chicago, IL with 32.8%.
What is the Percentage of Population with a Degree in Business in Chicago, IL?
Percentage of Population with a Degree in Business in Chicago is 19.5%.
What is the Percentage of Population with a Degree in Business in Illinois?
Percentage of Population with a Degree in Business in Illinois is 20.4%.
What is the Percentage of Population with a Degree in Business in the United States?
Percentage of Population with a Degree in Business in the United States is 19.5%.