Zip Codes with the Highest Percentage of Population Employed in Agriculture, Fishing & Hunting in Sioux City, IA
RELATED REPORTS & OPTIONS
Agriculture, Fishing & Hunting
Sioux City
Compare Zip Codes
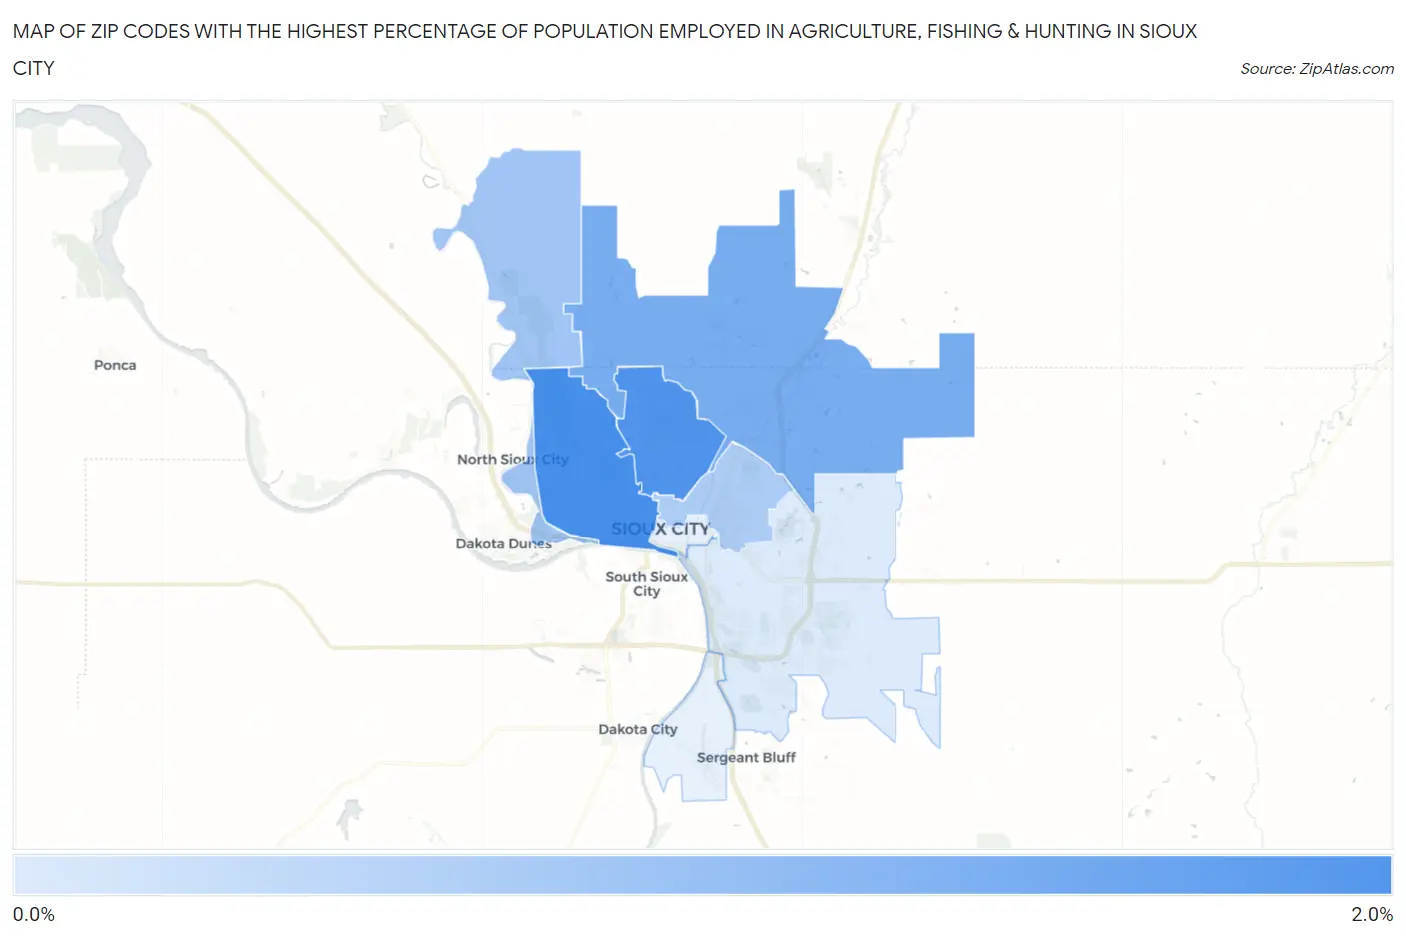
Map of Zip Codes with the Highest Percentage of Population Employed in Agriculture, Fishing & Hunting in Sioux City
0.32%
1.8%
Zip Codes with the Highest Percentage of Population Employed in Agriculture, Fishing & Hunting in Sioux City, IA
| Zip Code | % Employed | vs State | vs National | |
| 1. | 51103 | 1.8% | 3.5%(-1.66)#756 | 1.2%(+0.635)#13,219 |
| 2. | 51104 | 1.8% | 3.5%(-1.72)#758 | 1.2%(+0.576)#13,411 |
| 3. | 51108 | 1.3% | 3.5%(-2.16)#791 | 1.2%(+0.137)#14,888 |
| 4. | 51109 | 0.92% | 3.5%(-2.57)#823 | 1.2%(-0.277)#16,594 |
| 5. | 51105 | 0.80% | 3.5%(-2.70)#835 | 1.2%(-0.401)#17,246 |
| 6. | 51106 | 0.32% | 3.5%(-3.17)#869 | 1.2%(-0.875)#20,904 |
1
Common Questions
What are the Top 5 Zip Codes with the Highest Percentage of Population Employed in Agriculture, Fishing & Hunting in Sioux City, IA?
Top 5 Zip Codes with the Highest Percentage of Population Employed in Agriculture, Fishing & Hunting in Sioux City, IA are:
What zip code has the Highest Percentage of Population Employed in Agriculture, Fishing & Hunting in Sioux City, IA?
51103 has the Highest Percentage of Population Employed in Agriculture, Fishing & Hunting in Sioux City, IA with 1.8%.
What is the Percentage of Population Employed in Agriculture, Fishing & Hunting in Sioux City, IA?
Percentage of Population Employed in Agriculture, Fishing & Hunting in Sioux City is 1.1%.
What is the Percentage of Population Employed in Agriculture, Fishing & Hunting in Iowa?
Percentage of Population Employed in Agriculture, Fishing & Hunting in Iowa is 3.5%.
What is the Percentage of Population Employed in Agriculture, Fishing & Hunting in the United States?
Percentage of Population Employed in Agriculture, Fishing & Hunting in the United States is 1.2%.