Greek vs Immigrants from Senegal Disability
COMPARE
Greek
Immigrants from Senegal
Disability
Disability Comparison
Greeks
Immigrants from Senegal
11.7%
DISABILITY
46.2/ 100
METRIC RATING
178th/ 347
METRIC RANK
12.0%
DISABILITY
9.4/ 100
METRIC RATING
206th/ 347
METRIC RANK
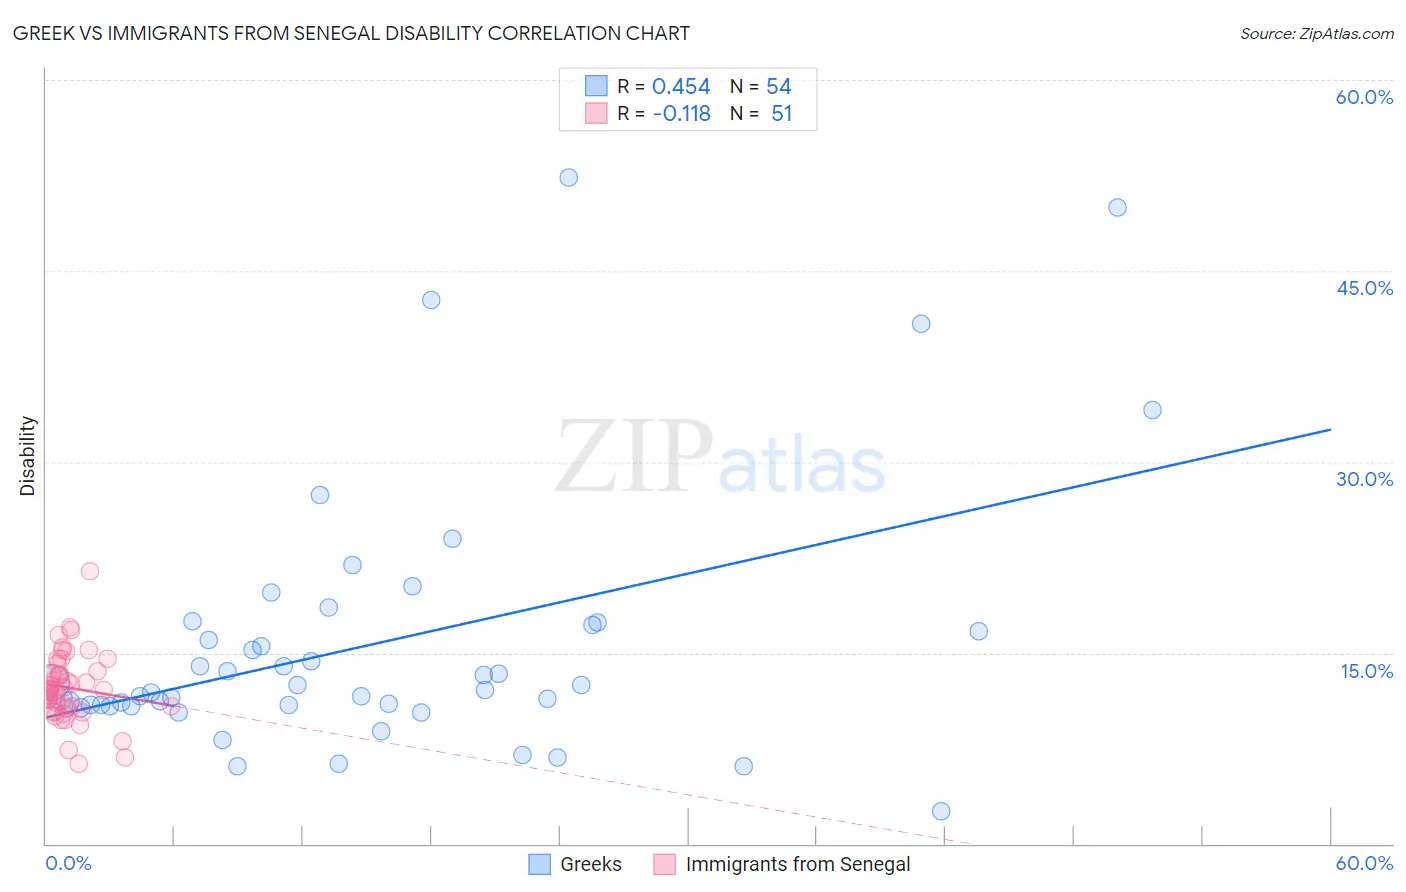
Greek vs Immigrants from Senegal Disability Correlation Chart
The statistical analysis conducted on geographies consisting of 482,714,083 people shows a moderate positive correlation between the proportion of Greeks and percentage of population with a disability in the United States with a correlation coefficient (R) of 0.454 and weighted average of 11.7%. Similarly, the statistical analysis conducted on geographies consisting of 90,129,421 people shows a poor negative correlation between the proportion of Immigrants from Senegal and percentage of population with a disability in the United States with a correlation coefficient (R) of -0.118 and weighted average of 12.0%, a difference of 2.3%.
Disability Correlation Summary
| Measurement | Greek | Immigrants from Senegal |
| Minimum | 2.5% | 6.3% |
| Maximum | 52.3% | 21.4% |
| Range | 49.8% | 15.1% |
| Mean | 15.7% | 12.3% |
| Median | 12.2% | 12.1% |
| Interquartile 25% (IQ1) | 10.9% | 10.6% |
| Interquartile 75% (IQ3) | 17.2% | 13.6% |
| Interquartile Range (IQR) | 6.3% | 3.0% |
| Standard Deviation (Sample) | 10.4% | 2.7% |
| Standard Deviation (Population) | 10.3% | 2.7% |
Similar Demographics by Disability
Demographics Similar to Greeks by Disability
In terms of disability, the demographic groups most similar to Greeks are Immigrants from Central America (11.7%, a difference of 0.020%), Immigrants from Western Africa (11.7%, a difference of 0.060%), Haitian (11.7%, a difference of 0.11%), Albanian (11.7%, a difference of 0.17%), and Immigrants from Armenia (11.7%, a difference of 0.19%).
| Demographics | Rating | Rank | Disability |
| Immigrants | Southern Europe | 52.8 /100 | #171 | Average 11.7% |
| Trinidadians and Tobagonians | 52.7 /100 | #172 | Average 11.7% |
| Maltese | 50.6 /100 | #173 | Average 11.7% |
| Albanians | 50.0 /100 | #174 | Average 11.7% |
| Haitians | 48.6 /100 | #175 | Average 11.7% |
| Immigrants | Western Africa | 47.5 /100 | #176 | Average 11.7% |
| Immigrants | Central America | 46.6 /100 | #177 | Average 11.7% |
| Greeks | 46.2 /100 | #178 | Average 11.7% |
| Immigrants | Armenia | 41.9 /100 | #179 | Average 11.7% |
| Immigrants | Honduras | 37.8 /100 | #180 | Fair 11.8% |
| Immigrants | Oceania | 34.3 /100 | #181 | Fair 11.8% |
| Icelanders | 34.0 /100 | #182 | Fair 11.8% |
| Hondurans | 31.2 /100 | #183 | Fair 11.8% |
| Iraqis | 30.0 /100 | #184 | Fair 11.8% |
| Immigrants | Burma/Myanmar | 28.5 /100 | #185 | Fair 11.8% |
Demographics Similar to Immigrants from Senegal by Disability
In terms of disability, the demographic groups most similar to Immigrants from Senegal are Immigrants from Thailand (12.0%, a difference of 0.010%), Immigrants from Caribbean (12.0%, a difference of 0.040%), Immigrants from Western Europe (12.0%, a difference of 0.080%), Danish (12.0%, a difference of 0.080%), and Czech (12.0%, a difference of 0.21%).
| Demographics | Rating | Rank | Disability |
| Immigrants | Panama | 14.6 /100 | #199 | Poor 11.9% |
| Belizeans | 12.8 /100 | #200 | Poor 11.9% |
| Assyrians/Chaldeans/Syriacs | 12.6 /100 | #201 | Poor 11.9% |
| Immigrants | England | 12.0 /100 | #202 | Poor 12.0% |
| British West Indians | 11.5 /100 | #203 | Poor 12.0% |
| Mexican American Indians | 11.4 /100 | #204 | Poor 12.0% |
| Immigrants | Western Europe | 10.1 /100 | #205 | Poor 12.0% |
| Immigrants | Senegal | 9.4 /100 | #206 | Tragic 12.0% |
| Immigrants | Thailand | 9.3 /100 | #207 | Tragic 12.0% |
| Immigrants | Caribbean | 9.1 /100 | #208 | Tragic 12.0% |
| Danes | 8.7 /100 | #209 | Tragic 12.0% |
| Czechs | 7.9 /100 | #210 | Tragic 12.0% |
| Immigrants | Cambodia | 7.3 /100 | #211 | Tragic 12.0% |
| Austrians | 7.2 /100 | #212 | Tragic 12.0% |
| Immigrants | Iraq | 7.1 /100 | #213 | Tragic 12.0% |