Greek vs Immigrants from Asia Disability
COMPARE
Greek
Immigrants from Asia
Disability
Disability Comparison
Greeks
Immigrants from Asia
11.7%
DISABILITY
46.2/ 100
METRIC RATING
178th/ 347
METRIC RANK
10.5%
DISABILITY
100.0/ 100
METRIC RATING
23rd/ 347
METRIC RANK
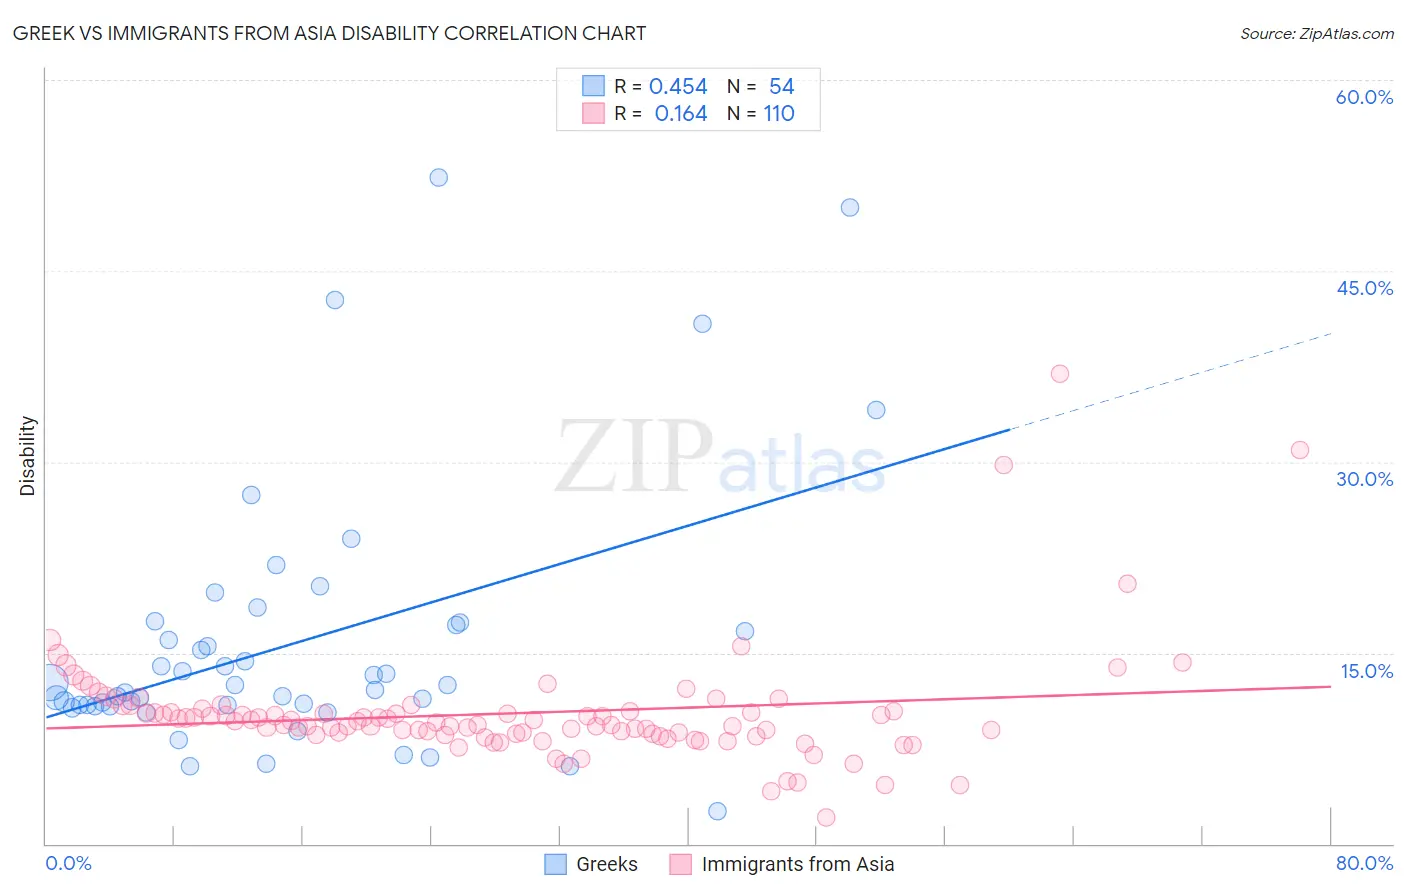
Greek vs Immigrants from Asia Disability Correlation Chart
The statistical analysis conducted on geographies consisting of 482,714,083 people shows a moderate positive correlation between the proportion of Greeks and percentage of population with a disability in the United States with a correlation coefficient (R) of 0.454 and weighted average of 11.7%. Similarly, the statistical analysis conducted on geographies consisting of 549,063,947 people shows a poor positive correlation between the proportion of Immigrants from Asia and percentage of population with a disability in the United States with a correlation coefficient (R) of 0.164 and weighted average of 10.5%, a difference of 11.3%.
Disability Correlation Summary
| Measurement | Greek | Immigrants from Asia |
| Minimum | 2.5% | 2.0% |
| Maximum | 52.3% | 36.9% |
| Range | 49.8% | 34.9% |
| Mean | 15.7% | 10.2% |
| Median | 12.2% | 9.6% |
| Interquartile 25% (IQ1) | 10.9% | 8.6% |
| Interquartile 75% (IQ3) | 17.2% | 10.4% |
| Interquartile Range (IQR) | 6.3% | 1.8% |
| Standard Deviation (Sample) | 10.4% | 4.5% |
| Standard Deviation (Population) | 10.3% | 4.5% |
Similar Demographics by Disability
Demographics Similar to Greeks by Disability
In terms of disability, the demographic groups most similar to Greeks are Immigrants from Central America (11.7%, a difference of 0.020%), Immigrants from Western Africa (11.7%, a difference of 0.060%), Haitian (11.7%, a difference of 0.11%), Albanian (11.7%, a difference of 0.17%), and Immigrants from Armenia (11.7%, a difference of 0.19%).
| Demographics | Rating | Rank | Disability |
| Immigrants | Southern Europe | 52.8 /100 | #171 | Average 11.7% |
| Trinidadians and Tobagonians | 52.7 /100 | #172 | Average 11.7% |
| Maltese | 50.6 /100 | #173 | Average 11.7% |
| Albanians | 50.0 /100 | #174 | Average 11.7% |
| Haitians | 48.6 /100 | #175 | Average 11.7% |
| Immigrants | Western Africa | 47.5 /100 | #176 | Average 11.7% |
| Immigrants | Central America | 46.6 /100 | #177 | Average 11.7% |
| Greeks | 46.2 /100 | #178 | Average 11.7% |
| Immigrants | Armenia | 41.9 /100 | #179 | Average 11.7% |
| Immigrants | Honduras | 37.8 /100 | #180 | Fair 11.8% |
| Immigrants | Oceania | 34.3 /100 | #181 | Fair 11.8% |
| Icelanders | 34.0 /100 | #182 | Fair 11.8% |
| Hondurans | 31.2 /100 | #183 | Fair 11.8% |
| Iraqis | 30.0 /100 | #184 | Fair 11.8% |
| Immigrants | Burma/Myanmar | 28.5 /100 | #185 | Fair 11.8% |
Demographics Similar to Immigrants from Asia by Disability
In terms of disability, the demographic groups most similar to Immigrants from Asia are Venezuelan (10.5%, a difference of 0.14%), Immigrants from Malaysia (10.6%, a difference of 0.52%), Argentinean (10.6%, a difference of 0.57%), Cypriot (10.6%, a difference of 0.58%), and Immigrants from Sri Lanka (10.5%, a difference of 0.69%).
| Demographics | Rating | Rank | Disability |
| Indians (Asian) | 100.0 /100 | #16 | Exceptional 10.3% |
| Immigrants | Iran | 100.0 /100 | #17 | Exceptional 10.3% |
| Burmese | 100.0 /100 | #18 | Exceptional 10.4% |
| Immigrants | Pakistan | 100.0 /100 | #19 | Exceptional 10.4% |
| Immigrants | Venezuela | 100.0 /100 | #20 | Exceptional 10.4% |
| Asians | 100.0 /100 | #21 | Exceptional 10.4% |
| Immigrants | Sri Lanka | 100.0 /100 | #22 | Exceptional 10.5% |
| Immigrants | Asia | 100.0 /100 | #23 | Exceptional 10.5% |
| Venezuelans | 100.0 /100 | #24 | Exceptional 10.5% |
| Immigrants | Malaysia | 100.0 /100 | #25 | Exceptional 10.6% |
| Argentineans | 100.0 /100 | #26 | Exceptional 10.6% |
| Cypriots | 100.0 /100 | #27 | Exceptional 10.6% |
| Egyptians | 100.0 /100 | #28 | Exceptional 10.6% |
| Immigrants | Argentina | 100.0 /100 | #29 | Exceptional 10.6% |
| Immigrants | Turkey | 100.0 /100 | #30 | Exceptional 10.6% |