French American Indian vs Immigrants from Belarus Disability
COMPARE
French American Indian
Immigrants from Belarus
Disability
Disability Comparison
French American Indians
Immigrants from Belarus
13.5%
DISABILITY
0.0/ 100
METRIC RATING
308th/ 347
METRIC RANK
11.1%
DISABILITY
98.9/ 100
METRIC RATING
85th/ 347
METRIC RANK
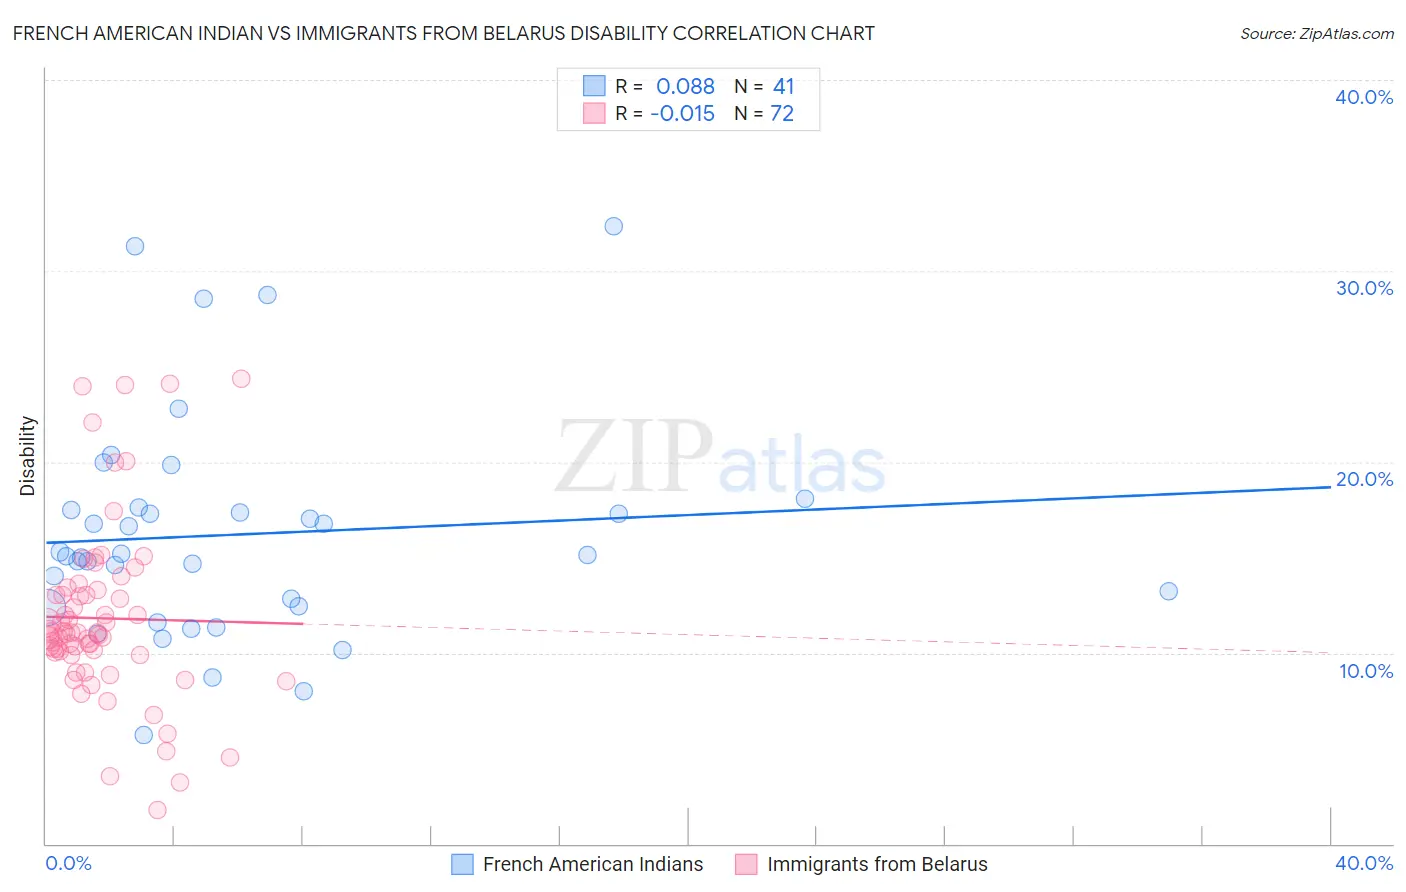
French American Indian vs Immigrants from Belarus Disability Correlation Chart
The statistical analysis conducted on geographies consisting of 131,973,513 people shows a slight positive correlation between the proportion of French American Indians and percentage of population with a disability in the United States with a correlation coefficient (R) of 0.088 and weighted average of 13.5%. Similarly, the statistical analysis conducted on geographies consisting of 150,193,731 people shows no correlation between the proportion of Immigrants from Belarus and percentage of population with a disability in the United States with a correlation coefficient (R) of -0.015 and weighted average of 11.1%, a difference of 21.7%.
Disability Correlation Summary
| Measurement | French American Indian | Immigrants from Belarus |
| Minimum | 5.7% | 1.8% |
| Maximum | 32.4% | 24.3% |
| Range | 26.7% | 22.6% |
| Mean | 16.2% | 11.8% |
| Median | 15.1% | 11.0% |
| Interquartile 25% (IQ1) | 12.4% | 10.0% |
| Interquartile 75% (IQ3) | 17.5% | 13.2% |
| Interquartile Range (IQR) | 5.1% | 3.2% |
| Standard Deviation (Sample) | 5.8% | 4.6% |
| Standard Deviation (Population) | 5.8% | 4.6% |
Similar Demographics by Disability
Demographics Similar to French American Indians by Disability
In terms of disability, the demographic groups most similar to French American Indians are Tlingit-Haida (13.5%, a difference of 0.080%), Shoshone (13.5%, a difference of 0.090%), Cape Verdean (13.5%, a difference of 0.14%), Blackfeet (13.6%, a difference of 0.61%), and Delaware (13.6%, a difference of 0.65%).
| Demographics | Rating | Rank | Disability |
| Immigrants | Micronesia | 0.0 /100 | #301 | Tragic 13.2% |
| Arapaho | 0.0 /100 | #302 | Tragic 13.2% |
| Scotch-Irish | 0.0 /100 | #303 | Tragic 13.3% |
| Yakama | 0.0 /100 | #304 | Tragic 13.4% |
| French Canadians | 0.0 /100 | #305 | Tragic 13.4% |
| Cape Verdeans | 0.0 /100 | #306 | Tragic 13.5% |
| Shoshone | 0.0 /100 | #307 | Tragic 13.5% |
| French American Indians | 0.0 /100 | #308 | Tragic 13.5% |
| Tlingit-Haida | 0.0 /100 | #309 | Tragic 13.5% |
| Blackfeet | 0.0 /100 | #310 | Tragic 13.6% |
| Delaware | 0.0 /100 | #311 | Tragic 13.6% |
| Spanish Americans | 0.0 /100 | #312 | Tragic 13.6% |
| Cree | 0.0 /100 | #313 | Tragic 13.7% |
| Blacks/African Americans | 0.0 /100 | #314 | Tragic 13.7% |
| Puget Sound Salish | 0.0 /100 | #315 | Tragic 13.7% |
Demographics Similar to Immigrants from Belarus by Disability
In terms of disability, the demographic groups most similar to Immigrants from Belarus are Immigrants from Russia (11.1%, a difference of 0.0%), Palestinian (11.1%, a difference of 0.040%), Immigrants from Sierra Leone (11.1%, a difference of 0.15%), Immigrants from Switzerland (11.1%, a difference of 0.16%), and Chilean (11.1%, a difference of 0.19%).
| Demographics | Rating | Rank | Disability |
| Immigrants | Cameroon | 99.3 /100 | #78 | Exceptional 11.1% |
| Immigrants | Jordan | 99.3 /100 | #79 | Exceptional 11.1% |
| Immigrants | Ireland | 99.3 /100 | #80 | Exceptional 11.1% |
| Immigrants | Poland | 99.1 /100 | #81 | Exceptional 11.1% |
| Chileans | 99.1 /100 | #82 | Exceptional 11.1% |
| Immigrants | Switzerland | 99.0 /100 | #83 | Exceptional 11.1% |
| Immigrants | Sierra Leone | 99.0 /100 | #84 | Exceptional 11.1% |
| Immigrants | Belarus | 98.9 /100 | #85 | Exceptional 11.1% |
| Immigrants | Russia | 98.9 /100 | #86 | Exceptional 11.1% |
| Palestinians | 98.9 /100 | #87 | Exceptional 11.1% |
| Immigrants | Romania | 98.5 /100 | #88 | Exceptional 11.2% |
| Immigrants | South Africa | 98.2 /100 | #89 | Exceptional 11.2% |
| Immigrants | Brazil | 98.1 /100 | #90 | Exceptional 11.2% |
| Immigrants | Western Asia | 98.1 /100 | #91 | Exceptional 11.2% |
| Ecuadorians | 98.0 /100 | #92 | Exceptional 11.2% |